
Abstract
This paper addresses the complex issue of managing medical waste transportation using electric vehicles, with the goal of minimizing both energy consumption and the risks associated with hazardous waste. A multi-objective mixed-integer linear programming model is introduced, incorporating practical factors such as time windows, partial recharge policy, load-dependent discharge, infection risk, and trips to waste disposal facilities. Our proposed method, a combination of the multi-objective evolutionary algorithm using decomposition (MOEA/D) with adaptive large neighborhood search (ALNS) and local search (LS) techniques, is referred to as MOEA/D-ALNS. This method demonstrates superior performance compared with the non-dominated sorting genetic algorithm, NSGA-II, modified MOEA/D and MOEA/D-LNS in benchmark instances with realistic assumptions. Our experimental results revealed an inverse correlation between energy consumption and risk objectives. Sensitivity analyses showed that eliminating time-window constraints results in more energy-efficient and safer routes while maintaining a slightly lower battery energy level can strike an ideal balance between energy consumption, risk, and battery health. This research contributes to the understanding of infectious medical waste management with its consideration of electric vehicles and waste disposal. It lays a solid foundation for future studies aiming to improve the sustainability and efficiency of medical waste routing practices.
Keywords
The management of medical waste, which has drawn increased attention during global health crises such as the COVID-19 pandemic, is a critical issue affecting global public health ( 1 ). Improper handling of such waste can exacerbate the risk of disease transmission and environmental contamination. Medical waste typically comprises both potentially infectious and noninfectious items ( 2 ). Although infectious waste accounts for less than 18% of the overall health care waste at primary health facilities ( 3 ), all mixed medical waste must be treated as infectious. As the pandemic continues, the collection and transportation of medical waste have become increasingly challenging ( 4 ), necessitating a sustainable and environmentally responsible infectious waste management system.
Medical waste management is intrinsically connected to social and environmental challenges, and harmonious integration of these components is vital for sustainability. The United Nations has enumerated a set of global sustainable development goals ( 5 ), many of which directly or indirectly relate to waste management. To realize these sustainability goals, a transition to cleaner fuels and increased transportation efficiency is crucial, thus necessitating the integration of electric vehicles (EVs) into waste delivery operations ( 6 ).
Traditionally, the transport of medical waste has been heavily reliant on internal combustion engine vehicles (CEVs) which constitute a substantial portion of the global transportation sector. This sector is a major contributor to pollution and greenhouse gas emissions, producing approximately 7.3 billion metric tons of CO2 annually ( 7 ). Though CEVs have proven to be reliable for transportation needs, their detrimental effects on both human health and environmental quality cannot be overlooked.
Recent advances in transportation technologies, especially the use of EVs, have formed part of a global strategy to reduce emissions. For example, Deutsche Post DHL has committed €7 billion euros to its electric fleet over the next decade. Likewise, UPS has declared its intention to incorporate 1,000 EVs into its logistics operations in the coming years ( 7 ). The benefits offered by EVs, such as emission reduction and energy efficiency, can play a crucial role in sustainable waste management ( 8 ). With the development of EV technology, the advent of connected and automated vehicles (CAVs) has introduced the possibility of creating dedicated lanes. These lanes could potentially enhance the efficiency of medical waste transportation and alleviate congestion, leading to further reductions in transport cost and carbon emissions ( 9 – 11 ). However, the use of EVs is hampered by challenges such as restricted capacity, limited driving range, and insufficient charging infrastructure ( 8 ). These obstacles underline the importance of route planning in the management of infectious medical waste.
The medical waste electric vehicle routing problem (MWEVRP) is a variation of the electric vehicle routing problem (EVRP) ( 12 ). Although previous studies ( 6 , 13–15) have examined this issue, the existing literature has several limitations. These studies mainly focus on efficient route planning with demand nodes and charging station visits, often overlooking critical aspects such as waste disposal at specialized facilities. Moreover, many of these studies tend to prioritize cost-oriented objectives, thereby inadequately addressing the multidimensional challenges associated with infectious medical waste collection, such as reducing energy consumption and minimizing the risk of infection associated with transportation.
In real-world scenarios, however, ignoring these vital factors can lead to impractical and unsustainable solutions. The inclusion of special facilities for medical waste disposal is paramount to mitigate potential environmental harm and public health risks. Moreover, the emphasis on reducing energy consumption aligns with the Paris Agreement to limit global temperature increase ( 16 ). Additionally, risk management in this context involves preventing the unintentional spread of diseases caused by infectious waste, as well as developing strategies to prepare for and mitigate the potential effects of infections. Thus, risk assessment, routing, and safety considerations emerge as primary challenges associated with medical waste transportation.
Sustainable transportation is fundamentally aimed at reducing air pollution, improving public health, enhancing safety, increasing transportation efficiency, protecting the environment, and fostering economic vitality ( 12 ). By addressing the research gaps identified in this study, our work not only fills these voids, but also makes a significant contribution to the field of sustainable transportation.
This paper makes three important contributions to medical waste management using electric vehicles. First, it introduces a multi-objective (MO) mixed-integer linear programming (MILP) model that aims to reduce contagious risk and pollution emissions. The model integrates various practical constraints, including driving duration, partial recharge policy, service time windows, trips to waste disposal facilities, fleet size, vehicle payload, and battery capacity. Unlike recent studies that assumed a linear relationship between energy consumption and distance traveled ( 6 , 14 , 15 ), our research incorporates load-dependent discharge into the MILP model to account for the significant influence of vehicle payload on energy consumption. This approach can lead to more accurate and effective waste management strategies ( 17 ). Second, we develop an innovative multi-objective evolutionary algorithm, MOEA/D-ALNS, integrating a decomposition framework, enhanced by adaptive large neighborhood search (ALNS) and local search (LS) techniques. This algorithm is capable of generating an effective Pareto front, enabling decision makers to choose trade-offs between clean-and-risky and polluted-and-safe routes for medical waste transportation. Finally, benchmark instances with realistic assumptions are used to evaluate the algorithm’s solution quality, and sensitivity analyses for time windows and battery energy levels are carried out to provide valuable managerial insights for decision makers in MWEVRP.
Literature Review
This section gives an overview of research on medical waste VRP and the EVRP. The MWEVRP is a complex problem that combines features of these two problems. First, the concepts and solution approaches studied in medical waste vehicle routing problems (MWVRP) are outlined. Next, recent research on EVRPs and their application in waste collection are examined. Finally, solutions for multi-objective VRPs are briefly reviewed.
Medical Waste Vehicle Routing Problem
The scientific study of waste management emerged in the late 1960s ( 18 ). The waste collection vehicle routing problem (WCVRP) was initially defined by Kim et al. ( 19 ), addressing practical aspects like multiple disposal site trips and driver lunch breaks. They proposed an extended version of Solomon’s ( 20 ) insertion algorithm to solve this problem.
The study of MWVRP, a variation of WCVRP, has attracted considerable interest in recent years as a result of COVID-19. Unlike the classic WCVRP, MWVRP requires the evaluation of infection risk. Taslimi et al. (
21
) presented a periodic load-dependent VRP for the collection of medical waste, using a decomposition-based algorithm with column generation. Ghannadpour et al. (
22
) developed a sustainability-focused health care waste collection model, minimizing transportation costs, fossil fuel consumption, and disease risk, and optimized it with a self-adaptive evolutionary algorithm. Babaee and Aydın (
23
) developed a multi-depot MWVRP model considering outsourcing strategy and used meta-goal programming to address multi-objective challenges, including social risk, measured by the population near disposal sites and disease transmission probability. In another study, Tirkolaee et al. (
24
) optimized a multi-period MWVRP in uncertain demand situations using fuzzy chance-constrained programming and a weighted goal optimization approach. Govindan et al. (
25
) and Zhao et al. (
26
) addressed uncertain demand using fuzzy goal programming and augmented
In contrast to the aforementioned studies, a recent study by Erdem ( 7 ) incorporated EVs into medical waste collection operations. They focused on reducing health risks and providing cost-effective and zero-emission logistics through a weighting method that combines ALNS and LS as the search engine.
As depicted in Table 1, recent studies on MWVRP have identified various objectives and constraints related to sustainability. The majority of research predominantly focuses on internal combustion engine vehicles (CEV). However, planning with EVs in medical waste management is more complex than with CEVs given the need to consider recharging.
Recent VRP Studies (2020–2022) on the Waste Collection Problem
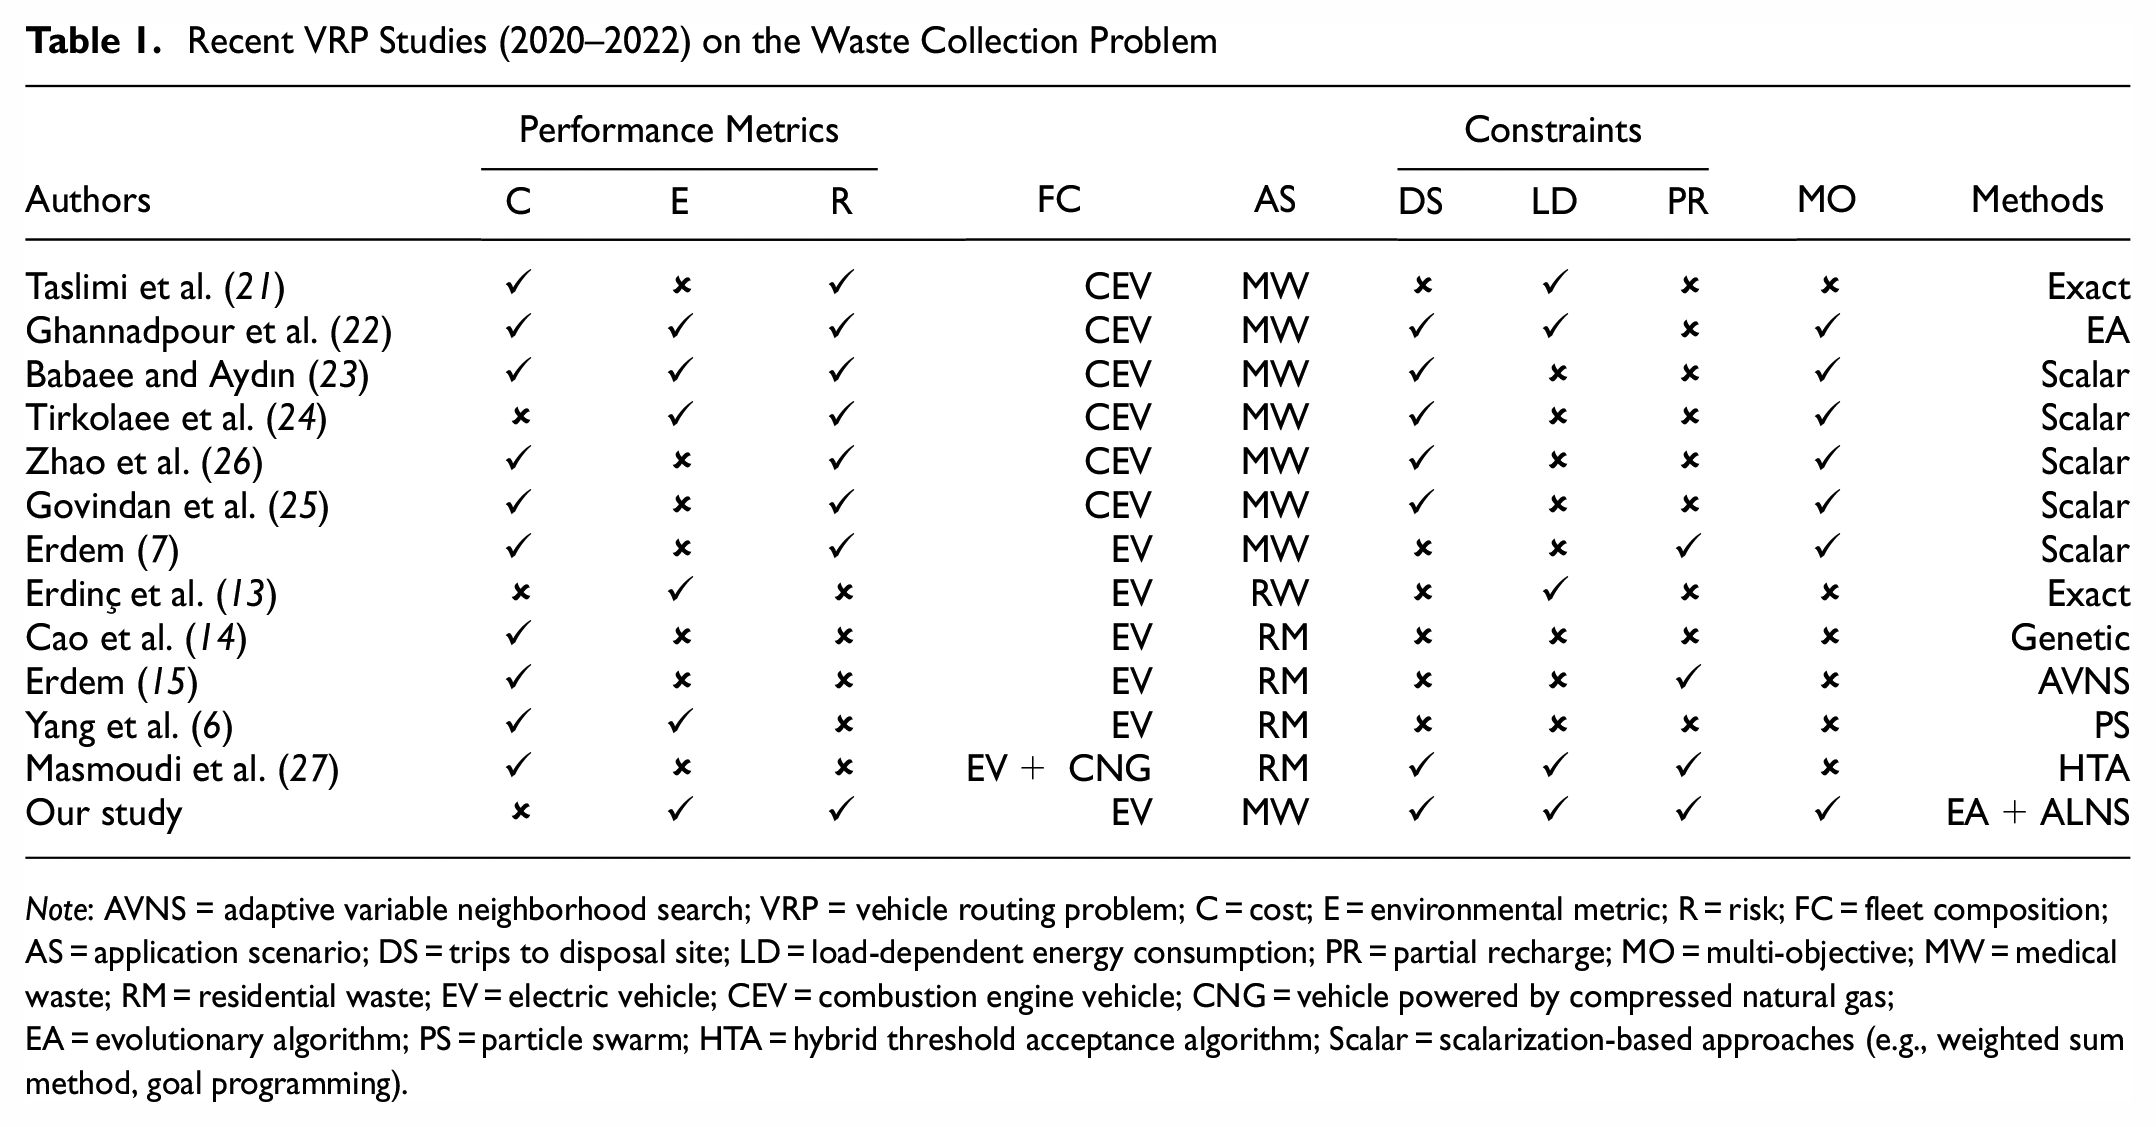
Note: AVNS = adaptive variable neighborhood search; VRP = vehicle routing problem; C = cost; E = environmental metric; R = risk; FC = fleet composition; AS = application scenario; DS = trips to disposal site; LD = load-dependent energy consumption; PR = partial recharge; MO = multi-objective; MW = medical waste; RM = residential waste; EV = electric vehicle; CEV = combustion engine vehicle; CNG = vehicle powered by compressed natural gas; EA = evolutionary algorithm; PS = particle swarm; HTA = hybrid threshold acceptance algorithm; Scalar = scalarization-based approaches (e.g., weighted sum method, goal programming).
Electric Vehicle Routing Problem and its Application in Waste Collection
With the growing awareness of the environmental challenge, EVRP has gained more attention in view of EVs’ environmental benefits. Unlike traditional VRP, the EVRP considers driving range, charging strategy, battery capacity, charging duration, and location of recharging stations. Conrad and Figliozzi ( 28 ) were pioneers in introducing EVRP with constant recharge time. Building on this, Macrina et al. ( 29 ) expanded the EVRP to include time windows while using a heterogeneous fleet of CEVs and EVs. More recently, Masmoudi et al. ( 27 ) explored a similar problem using a homogeneous fleet of plug-in hybrid electric refuse vehicles operated by electricity and compressed natural gas (CNG).
Existing research on EVRP can be classified into two categories according to the charging policy: full and partial recharge strategies ( 30 ). The former assumes complete battery replenishment whenever a vehicle reaches a charge station (CS), while the latter allows batteries to recharge up to any level ( 31 ), which is more realistic in real cases. On the issue of energy consumption, some early EVRP studies assumed it was a linear function of travel distance, regardless of the load carried ( 32 ). This assumption is impractical, as consideration of load in discharge calculations can significantly affect routes, particularly when heavy cargo is unloaded early to save energy. Recent research by Vincent et al. ( 33 ), and Masmoudi et al. ( 27 ) considered more realistic energy consumption and partial charging policies. In these studies, energy consumption depends on the weight of the load carried, and the state of charge (SoC) is treated as a decision variable.
Although EVRP has been extensively studied, its application in waste management remains relatively unexplored. Erdinç et al. ( 13 ) first developed a realistic MILP model for the electric garbage truck routing problem using an exact method and real-world data from Istanbul’s Bakirkoy Municipality but they overlooked recharging decisions. Cao et al. ( 14 ) examined an EVRP in a two-echelon recycle network without considering the charging process and proposed a hybrid genetic algorithm combined with large neighborhood search operators. Their findings suggested that using heterogeneous fleets can reduce costs and balance economic, environmental, and resource aspects in recycling systems.
Later, Erdem ( 15 ) introduced an integrated MIP model for WCEVRP with distance-based energy consumption, and developed an algorithm based on adaptive variable neighborhood search (AVNS) in solving this issue. Yang et al. ( 6 ) investigated sorted waste collection with multi-compartment EVs, taking into account the uncertainty of waste generation rates. They introduced a chance-constrained model and proposed a diversity-enhanced particle swarm optimization algorithm to address it. Recently, Masmoudi et al. ( 27 ) examined a single-objective WCVRP using a fleet of vehicles driven by electricity and CNG. They proposed a hybrid threshold acceptance (HTA) algorithm, demonstrating strong performance compared with cutting-edge EVRP algorithms.
Multi-Objective Optimization Methods
Research on multi-objective optimization problems (MOPs) began in the 1970s and, since then, numerous techniques have been developed in solving MO-VRPs ( 34 ). These methods can be divided into two classes: scalar and Pareto methods.
Scalar methods involve mathematical transformations to convert MOPs into single-objective optimization problems. Recently, scalar methods such as the weighted sum approach (
7
), goal programming method (
23
–
25
), and
On the other hand, Pareto methods, which use the concept of dominance, have gained popularity in addressing real-world MOPs ( 36 ). This is a result of their superior heuristic optimum-seeking ability and capability to identify a large set of non-dominated points within a reasonable computational time.
In MO-VRPs, Pareto-dominance is often used in conjunction with an evolutionary algorithm (EA) framework, such as NSGA-II ( 37 ), MOEA/D ( 38 ), and SPEA2 ( 39 ). Most EAs in both research and application areas follow a similar framework, using a search operator based on Pareto domination and an iterative reproduction operator ( 40 ). The most used search method is genetic algorithm ( 34 ), other methods such as ant colony ( 41 ), adapted large neighborhood search (ALNS) ( 42 ), GRASP ( 43 ), Tabu search ( 44 ), and particle swarm ( 45 ) have also been combined with Pareto-dominance with remarkable results.
Substantial evidence indicates that incorporating local search mechanisms into EAs significantly improves their performance in combinatorial optimization problems ( 36 ). To our knowledge, no previous studies have used a decomposition-based EA with an ALNS search mechanism to address our specific problem. This research gap motivates our study to develop a novel Pareto-based hybrid algorithm, MOEA/D-ALNS, which combines the MOEA/D framework and ALNS for solving the MO-MWEVRP.
Literature Gap
While there is substantial research related to the waste collection EVRP, there appears to be a limited number of studies that specifically tackle the MO-EVRP within the specific context of medical waste collection and transportation. This subject is particularly crucial given the significant public health and environmental challenges it presents. Our study aims to bridge this gap by concurrently considering routing, waste disposal, and recharging decisions, with special attention to factors such as load-dependent energy consumption, partial recharge policy, and infection risk. The risk function used in this study is determined by variables such as vehicle load, population exposure between nodes, and transmission probability.
Additionally, as shown in Table 1, despite the extensive research on multi-objective WCVRP, which predominantly used scalar methods, a notable research gap exists in the application of evolutionary algorithms to solve the MWEVRP.
Our exploration in this area not only expands the existing MWEVRP literature, but also provides practical solutions to a more complex waste collection routing problem.
Problem Description and Model Formulation
This section presents a MO-MILP model for the MWEVRP, incorporating waste disposal, time windows, loading capacity, battery capacity, and recharge decisions as primary constraints.
The proposed model is inspired by the studies of Kim et al. ( 19 ) and Masmoudi et al. ( 27 ). To solve the problem, the following conditions must be met:
A single depot and disposal site are considered.
EVs are homogenous.
Vehicle speed remains constant.
A finite number of vehicles and CSs are available.
Each demand node must be visited once by a single vehicle.
Multiple visits to the CSs and disposal site are allowed for vehicles.
The total waste collected from demand nodes cannot exceed vehicle capacity. If full, the vehicle must visit the disposal site before visiting the next demand node.
Customers must be served within their time windows.
Recharge time is assumed to be linear.
Vehicles must visit a charging station if their remaining battery is insufficient to reach the next customer.
Partial charging policy is implemented at CSs when a vehicle visits a CS.
Each vehicle begins and ends at the depot with an empty load, adhering to the maximum working hour constraint.
Energy Consumption
The energy consumption of an EV is influenced by various factors, including travel distance, mass, vehicle speed, engine efficiency, and so forth. To compute the EV’s energy consumption, we first need to determine the mechanical power requirement, denoted as

where
The parameters
Taking into account the motor efficiency of an EV, denoted as

The values

where
Mathematical Model
The routing problem in an urban area can be described using a complete and directed network represented as
To allow multiple visits to the same CS, copies of recharging stations are introduced, forming the set
The depot serves as a charge station, and thus, it is included in the set J. By duplicating the depot, the starting and ending nodes are represented by 0 and
To better reflect real-world scenarios, our model adopts the partial recharging (PR) policy over the traditional full recharging method ( 6 , 50 ). Figure 1 shows an example with six customers, two CSs, a waste disposal facility, and a depot. The percentages on the routes indicate the vehicle’s battery state of charge on its arrival at a specific location or after recharge at a station. By allowing vehicles to recharge only the necessary energy for their next trip, this policy not only reduces recharge time but also facilitates adherence to the maximum duration constraint. Furthermore, minimizing unnecessary recharging can open up additional customer service time windows thanks to reduced waiting times at charging stations, potentially enhancing the solution quality ( 51 , 52 ). It is noteworthy that under the PR scheme, the recharge quantity, as indicated in Table 2, becomes a continuous decision variable, introducing significant complexity to the problem.


An illustrative example of a solution for the medical waste electric vehicle routing problem (MWEVRP).
Subject to

1) Network flow balance constraints


2) Capacity constraints


3) Time-window constraints


4) Battery capacity balance constraints


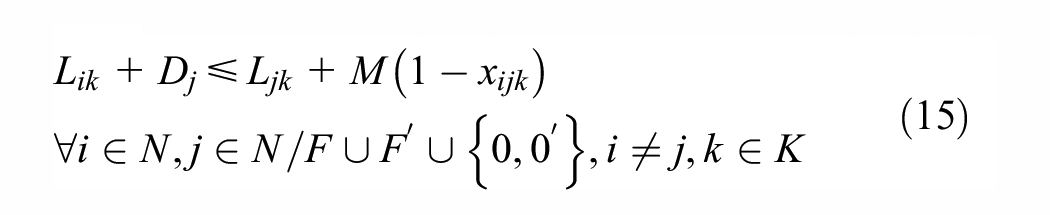
The objective functions 4 and 5 aim to minimize the overall energy consumption of EVs and the associated infection risk, which is measured by the number of exposed individuals on the road, the vehicle load, and the probability of disease transmission. Equation 6 computes the energy consumption by EV on a given arc. Constraint 7 ensures the input and output flow balance for nodes except the depot. Constraint 8 dictates that each demand node is served once by an EV. Constraint 9 permits vehicles to visit the recharge station and disposal facility multiple times if necessary. Constraints 10 to 12 stipulate that vehicles begin and end their routes at the depot, and the final point visited before returning to the depot is either the disposal facility or the CS. Constraint 13 indicates that the vehicle leaves the depot or the disposal site with an empty load. Constraints 14 and 15 describe the capacity restrictions for vehicles and the load balance between two consecutively visited points, respectively. Constraints 16 and 17 track the arrival time of EVs at a node. Constraint 18 and 19 set the time window for demand nodes and the latest return time for EVs to the depot. Equation 20 indicates that the EV departs the depot with a full battery. Constraints 21 and 22 monitor the SoC for each vehicle. Constraint 23 limits the SoC of an EV to be less than the maximum battery capacity. Constraint 24 accounts for partial battery recharging. Constraint 25 defines the types of variables.
Mathematical Notation

Solution Method
The MOEA/D, a type of EA, has exhibited superior performance compared with other advanced multi-objective evolutionary algorithms ( 53 ). It decomposes multi-objective problems into numerous scalar optimization subproblems, solving them simultaneously with EAs. In addition, MOEA/D integrates neighborhood structure concepts in its framework. Recently, heuristics based on the ALNS and MOEA/D algorithm have demonstrated its effectiveness in solving machine scheduling problems ( 54 ) and VPRs ( 55 ). Computational results from Zandieh and Ghannadpour ( 55 ) highlight that the proposed MOEA/D-ALNS algorithm surpassed two previously published algorithms, namely Game-MOGLNS (game theoretical multi-objective genetic with large neighborhood search) by Ghannadpour and Zandiyeh ( 56 ) and NSGA-II (non-dominated sorting genetic algorithm-II) by Leng et al. ( 57 ), as well as the basic MOEA/D algorithm in the multi-objective time-dependent hazardous materials routing problem.
In theory, the MOEA/D-ALNS algorithm has the potential to effectively tackle a wide range of multi-objective VRPs. This is largely a result of its integration of two powerful algorithms: ALNS, which has been successfully applied in resolving numerous single-objective VRPs ( 7 , 31 , 46 , 58 ), and MOEA/D, which has exhibited impressive results in addressing a variety of multi-objective and many-objective problems ( 36 , 59 , 60 ). Each component of the proposed algorithms can be adapted to various other instances of VRPs.
Building on the theoretical applicability and the demonstrated effectiveness of the MOEA/D-ALNS algorithm, this study customizes the algorithm for solving the proposed MO-MWEVRP. Several mechanisms are embedded into the MOEA/D algorithm to enhance the optimization process.
The primary modifications to the proposed MOEA/D algorithm are as follows: First, infeasible solutions are permitted during iterations to explore new regions of the search space, using a generalized objective function represented by Equation 26.

General Framework
Algorithm 1 outlines the pseudo-code for the developed MOEA/D-ALNS. The first step defines the algorithm’s inputs, including: i)

Next, the MWEVRP is decomposed into
To generate an initial individual solution for each population
During each iteration, the algorithm performs the following steps:
Each subproblem is optimized using ALNS. The Tchebychef approach (TCH) aggregate function is used to assess the objective functions.
The current solution is strengthened by LS.
IDS and IRS are applied to ensure the feasibility of the solution with regard to disposal and recharge constraints.
The optimal solution vector
For each neighbor
The selection probability values
On meeting the termination condition of the loop

Tchebycheff Approach Aggregation Function
The weighted Tchebycheff approach can handle problems with non-convex Pareto fronts ( 59 ). A scalar optimization subproblem is formulated as Equation 27.
The ideal reference point is defined as
Adaptive Large Neighborhood Search
ALNS has demonstrated remarkable performance in addressing diverse VRPs ( 33 ). To generate the neighborhood of a given solution, six destroy and four repair operations are performed. Following each iteration, a scoring mechanism evaluates and updates the past performance of operators. Operators are chosen according to their scores, and high-scoring operators are favored for subsequent iterations. A newly generated solution is accepted based on a predefined acceptance criterion. Unlike the single-objective ALNS mechanism, this study employs the TCH aggregation function to evaluate solution quality.
Customer Interval Selection
Before applying a destroy operator, the initial step is to determine the number of nodes to remove and the selection rule, which differs in each iteration. The chosen number, denoted as
Destroy Operators
The following operators aim to remove q demand nodes from the solution, creating an incomplete solution.
Random removal (RR): This algorithm randomly chooses and deletes demand nodes, contributing to points dispersion.
Route removal (RoR): This mechanism selects a vehicle route at random and removes both the route and its entire set of customers.
Worst distance removal (WDR): This approach aims to remove nodes causing a significant increase in total distance. The point j is determined by
Worst risk removal (WRR): This operator eliminates demand nodes with the highest risk, calculated by summing the risks of the point’s entry and departure links
Worst energy consumption removal (WECR): The operator removes q demand nodes causing a substantial increase in energy consumption.
Worst risk and energy consumption removal (WRER): This operator eliminates q demand nodes based on the aggregated risk and energy consumption objective function.
Repair Operators
These operators are designed to rebuild a partially destroyed solution by reinserting q removed nodes, aiming to create a new and improved solution.
Greedy insertion (GI): This algorithm inserts node i into the best position on the route based on distance, aiming to reduce the energy consumption.
Best risk insertion (BRI): This mechanism aims to insert the node in a position that results in the least increase in total route risk.
Best energy consumption insertion (BRCI): This method places the customer in the position that consumes the least amount of energy.
Best risk and energy consumption insertion (BREI): This algorithm positions nodes optimally based on aggregated risk and energy consumption objective functions, assigning nodes to the lowest-ranking positions.
Local Search Mechanisms
The MO random variable neighborhood descent method (MO-RVND) is used as a LS mechanism. It performs local search in a random order as the optimal sequence for executing local search can depend on both the problem and the instance characteristics ( 54 ). The MO-RVND algorithm uses the TCH aggregation function and first-improvement strategy, integrating the following three operators:
Relocate: This intra-route move operator chooses a demand node from a vehicle’s route and repositions it within the same route.
Exchange: This inter-route move operator swaps customers between two randomly chosen routes, creating two new routes.
2-Opt*: This intra-route improvement algorithm selects two routes and modifies them by reversing and reconnecting multiple pairs of edges, resulting in two new routes.
Feasibility Gain Procedure
Two operators are used to maintain the feasibility of the route for disposal and recharge constraints. These operators are described below.
Insert disposal station (IDS): The IDS operator assesses all route nodes, and if the payload at a node exceeds the vehicle’s capacity, a nearby disposal facility is inserted before it. After a visit to the facility, the payload of a vehicle is reset to zero.
Insert recharge station (IRS): The IRS operator is similar to the best station insertion operator detailed by Keskin and Çatay ( 31 ). This strategy identifies the optimal CS insertion between the depot and any nodes that the EV reaches with a negative battery level. By assessing all arcs in reverse on the route, the insertion that results in the least increase to the generalized objective (Equation 26) is selected. This process repeats for each node where the EV arrives with a negative battery level.
To determine the recharge amount at a CS, we assume an EV departs the depot with a fully charged battery and consumes its entire battery by the time it returns, provided it has been recharged at least once en route. If the EV is recharged only once during the trip, the energy added ensures its return to the depot with an empty battery. For routes requiring multiple recharges, the same approach is applied each time a new CS is inserted between the last CS visited and the depot. If a CS is either positioned between two consecutive CSs or after the depot but before other CSs, the recharge amount at each CS is calibrated such that the EV eventually returns to the depot with an empty battery.
Adaptive Mechanism
The adaptive mechanism modifies the probability

This Equation 28 uses the parameter

Specifically, the probabilities of destroy operators
Simulated Annealing Acceptance
To avoid local optimality, the SA is employed. In each iteration, a probability is computed using Equation 30 to accept a new, worse solution. The new solution is accepted if the probability exceeds

Method for Updating Non-Dominated Solutions
This research integrates multiple objectives into the optimization process to generate solutions. However, since these objectives may conflict, finding an optimal solution that minimizes all of them concurrently is not possible. Therefore, we focus on identifying the Pareto frontier, which comprises solutions that are not dominated by any other solution. To update the set of non-dominated solutions (D), the non-dominant sort method presented in Cota et al. (
54
) is employed. A solution vector

Experiment Design
Recent studies on MWEVRP have used various real-world instances, but no benchmark instance exists to date. Our computational test uses the data sets from Schneider et al. (
58
) and Desaulniers et al. (
61
), which include small, medium, and large-sized instances with up to 100 demand nodes, classified by the location distribution: random (R), clustered (C), and mixed (RC). These data sets differ in time-window length, vehicle load, battery capacity, and the number of recharge stations. Population exposure between vertices is generated using a uniform distribution with values ranging from 50 to 100. Drawing from the research by Babaee and Aydın (
23
), the infection probability
To evaluate the proposed algorithm’s effectiveness, experiments are conducted using four distinct algorithms: NSGA-II, MOEA/D, MOEA/D-LNS and MOEA/D-ALNS. These algorithms are performed with Spyder 5.2.2 on a PC with AMD 5900HX running at 4.6 GHz. The aim of this experiment is to examine how the inclusion of LNS operators and adaptive learning mechanisms affects the MOEA/D algorithm’s performance.
NSGA-II: While NSGA-II has proven effective in addressing the multi-objective VRP, it has not yet been used for the MWEVRP. Our proposed NSGA-II, building on the works of Kuo et al. ( 62 ) and Zandieh and Ghannadpour ( 55 ), begins by generating an initial population for each chromosome. This initial population is formed using the same method as in MOEA/D-ALNS. After that, parent chromosomes are chosen from the initial population to undergo crossover and mutation processes, yielding new offspring. Both the old and new populations are then combined, after which ranking and crowding distances are computed for all individuals. As the merged population exceeds the size of the initial one, the algorithm trims the extra individuals based on their ranks and crowding distances. This procedure repeats until predefined termination conditions are met. The flowchart of our proposed NSGA-II is presented in Figure 2.
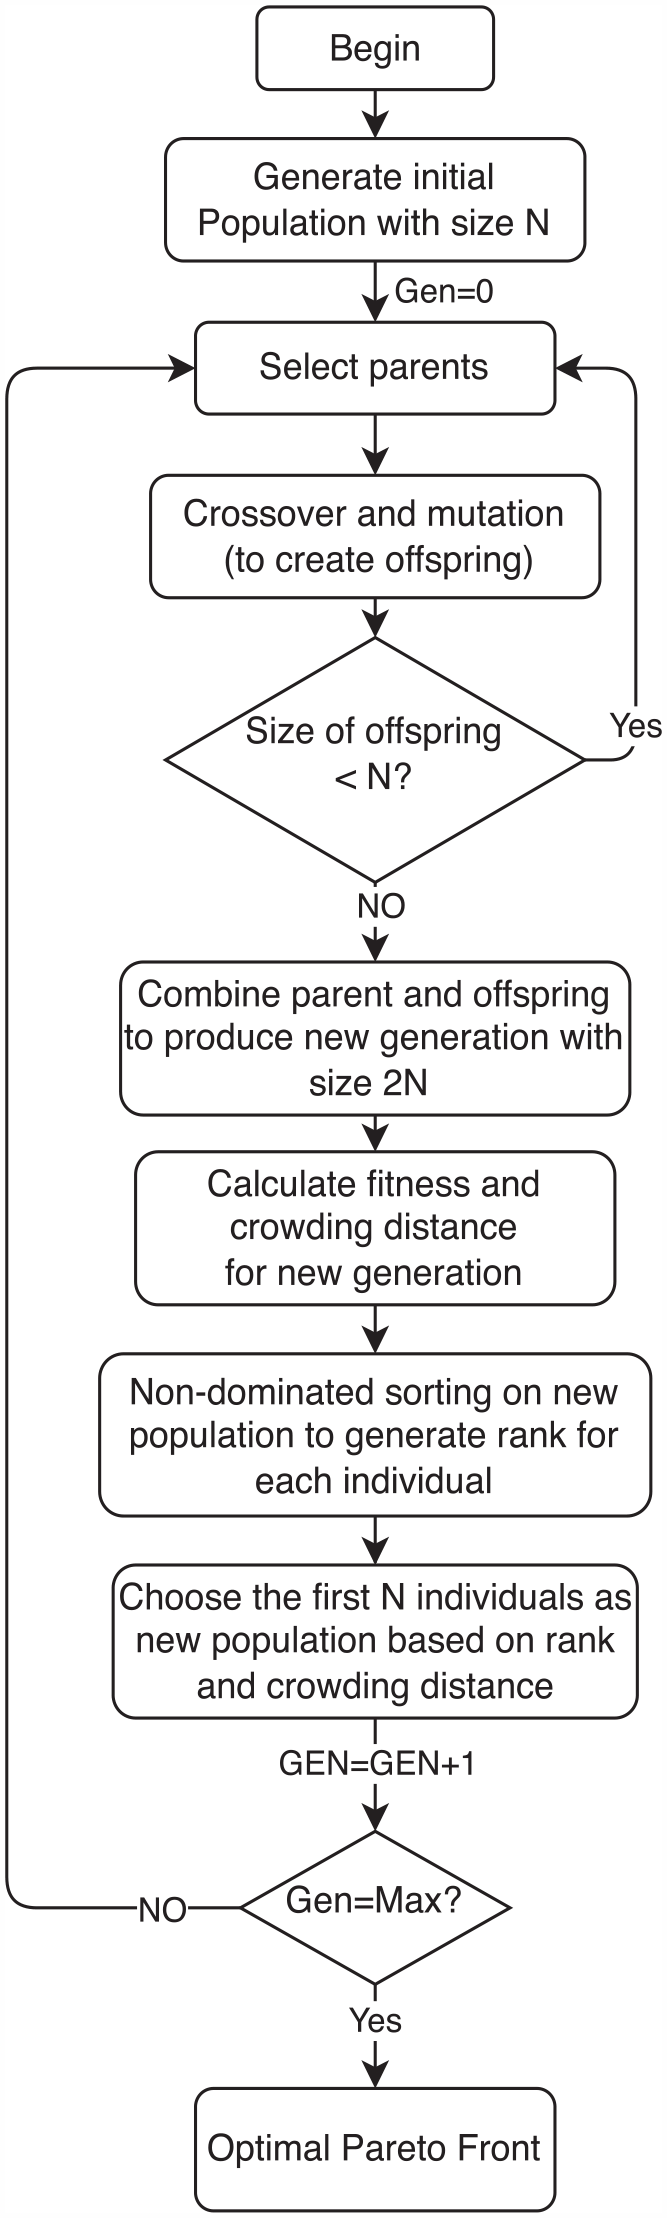
Flowchart of non-dominated sorting genetic algorithm (NSGA)-II.
Within this algorithm, the crossover operators include the best cost route crossover (BCRC) ( 55 ) and our proposed problem-specific operators: GI, BRI, and BREI. In BCRC, a route is arbitrarily selected from each parent chromosome, and customers within this route are then removed from the other parent’s route. These removed customers are subsequently relocated to the most energy-efficient positions. Other operators are similar to BCRC, but they differ in their neighborhood search mechanism. During the mutation phase, a fraction of the population is mutated using relocate, exchange, and 2-Opt* algorithm in a random manner. After this step, IRS and IDS operators are applied to regain route feasibility concerning battery and vehicle capacity.
MOEA/D: This modified MOEA/D employs RR, GI, BRI, and BRCI operators for neighborhood search instead of ALNS and omits the adaptive learning mechanism. During the evolution of each subproblem, the RR operator selects q demand nodes randomly, removes them from paths, and reinserts them using GI, BRI, and BRCI at random to produce a new candidate solution.
MOEA/D-LNS: This algorithm is a variant of the large neighborhood search approach that handles multiple objectives. It retains the same components as our proposed MOEA/D-ALNS, except for the adaptive learning mechanism.
To assess the performance of the developed algorithms, six metrics are employed, including:
Best energy consumption (BEC): This metric evaluates the optimal energy consumption (lower is better);
Best risk (BR): This criterion measures the best risk achieved by algorithms (lower is better);
Number of Pareto solutions (NPS): The indicator reflects the quantity of Pareto solutions (higher is better);
Hypervolume metric (HV): The criteria quantify the space between the reference point and the Pareto points (higher is better);
Spacing (SP): This metric shows the distribution of non-dominated solutions. If there is only one non-dominated solution, the SP is defined as infinity (lower is better);
Computational time (CPU): This metric assesses the computational time in seconds (lower is better).
Given the stochastic nature of the proposed algorithms, each method is implemented 10 times for each instance and only the mean value of the metric is considered.
Parameter Tuning
Parameter calibration is achieved through empirical tests on five instances (Table 3). Each factor is evaluated individually while keeping other parameters constant. We set the stopping criterion for the MOEA/D, MOEA/D-LNS and MOEA/D-ALNS algorithms at 20 generations
Data About the Test Instances

Note: D = no. of demand nodes; CS = no. of charge stations; V = no. of vehicles; Pop = population exposure between nodes; RI = infection probability between nodes.
In the NSGA-II algorithm, both the crossover and mutation rates are two pivotal parameters that significantly influence the algorithm’s performance ( 63 ). Testing these rates is crucial to determine if a specific combination yields satisfactory results. For this purpose, various values of the crossover and mutation rates were used to obtain solutions for an instance with 15 customers. Following this, BEC, BR, HV, and CPU values are calculated to evaluate and compare the quality of the solutions. This evaluation aids in identifying which combination of parameter values produces the most optimal solution.
Table 4 displays the metrics for each tested parameter combination. Based on these results, the optimal values determined for the crossover and mutation rates are 0.9 and 0.1, respectively. This combination yielded the best performance for BEC and BR, and also demonstrated favorable results in HV. To ensure a fair comparison, the parameters of population size
Parameter Test for NSGA-II.

Note: NGSA = non-dominated sorting genetic algorithm; BEC = best energy consumption; BR = best risk; CPU = computational time; HV = hypervolume; Inf = infeasible solution; na = not applicable.
Results and Discussion
In this section, the performance of MOEA/D-ALNS and the enhancement strategies for MOEA/D are evaluated. Specifically, MOEA/D-ALNS is compared with the following algorithms: i) the NSGA-II enhanced with specialized crossover and mutation operators, and ii) the modified MOEA/D and MOEA/D-ALNS without the adaptive selection strategy.
Comparison between MOEA/D-ALNS and NSGA-II
In this subsection, MOEA/D-ALNS is compared with the NSGA-II algorithm, with a focus on the objectives BEC and BR. Results for small and medium instances are shown in Table 5. For the large-scale instance, when both algorithms used identical values for population size and maximum iteration, NSGA-II failed to generate viable solutions. Consequently, these results were omitted from the table. Table 5 reveals that MOEA/D-ALNS consistently surpasses the NSGA-II algorithm for both objectives, particularly for medium-sized instances. For example, MOEA/D-ALNS achieves an energy saving of approximately 37 % for the objective of minimizing total energy consumption. Additionally, it reduces the total risk by 9 % compared with the NSGA-II algorithm in instances with 50 customers. With regard to computation time, NSGA-II performs better. However, the time difference between these two algorithms narrows with increasing problem size.
Comparisons between MOEA/D-ALNS and NSGA-II on Objectives

Note: MOEA/D = multi-objective evolutionary algorithm using decomposition; ALNS = adaptive large neighborhood search; NSGA = non-dominated sorting genetic algorithm.
Comparison of MOEA/D, MOEA/D-LNS, and MOEA/D-ALNS Results
A comparison of the results in Tables 6 and 7 reveals that for energy consumption, the three algorithms show no significant differences in small data sets with 10 and 15 demand nodes. However, as the problem dimension increases, MOEA/D-ALNS consistently outperforms the others, being the most energy-efficient with the lowest average energy consumption (921.61), followed by MOEA/D-LNS (976.01) and MOEA/D (1,097.08).
Comparisons of MOEA/D-Based Algorithms Based on BEC, BR, and CPU

Note: BEC = best energy consumption; BR = best risk; CPU = computational time; NPS = number of Pareto solutions; HV = hypervolume; MOEA = multi-objective evolutionary algorithm; MOEA/D = multi-objective evolutionary algorithm using decomposition; LNS = large neighborhood search; ALNS = adaptive large neighborhood search.
Comparisons of MOEA/D-Based Algorithms Based on NPS, HV, and SP

Note: NPS = number of Pareto solutions; HV = hypervolume; SP = spacing; MOEA = multi-objective evolutionary algorithm; MOEA/D = multi-objective evolutionary algorithm using decomposition; LNS = large neighborhood search; ALNS = adaptive large neighborhood search.
The average values for HV and SP were calculated without using data from the c202C10 instance.
With respect to risk metric, the three algorithms perform similarly, with MOEA/D-ALNS having a minor advantage in the large-scale instance. MOEA/D demonstrates superior NPS and CPU performance, indicating its effectiveness in generating diverse Pareto solutions and its suitability for situations when fast computation is a priority. In the HV comparison, MOEA/D-LNS outperforms the other two algorithms, while MOEA/D and MOEA/D-ALNS have similar performance in SP, which is slightly better than MOEA/D-LNS.
The radar plot in Figure 3 displays the normalized means of the metrics for these three algorithms, using a distance-based normalization approach ( 64 ). The greatest performance in this scenario obtains one point, while the worst performance obtains 0. The computational results reveal that MOEA/D-ALNS is ideal for obtaining the most energy- and risk-efficient solutions, while MOEA/D is tailored for prompt solution generation.
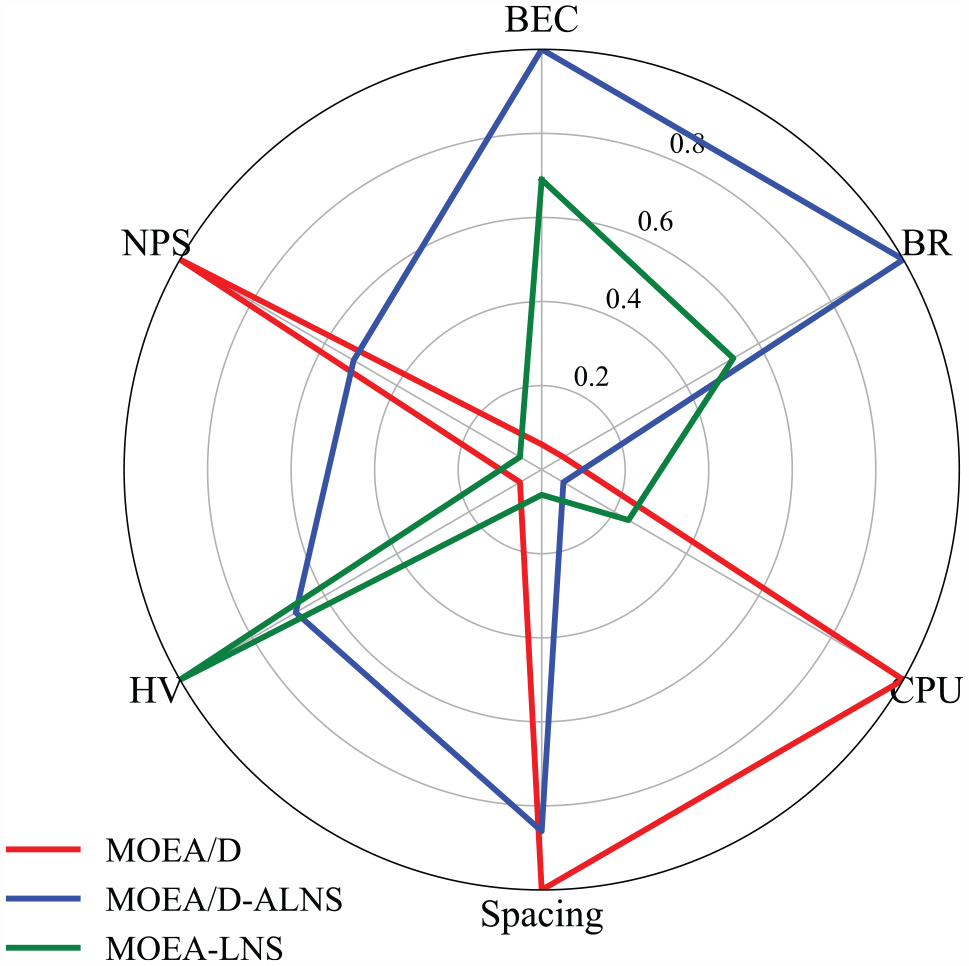
The radar plot for three algorithms.
The three algorithms are further evaluated using the simple additive method (SAM) with six equally weighted performance metrics. These metrics are normalized using a distance-based technique ( 64 ). The ranking of these three EAs can be found in Table 8, with the MOEA/D-ALNS algorithm receiving the highest score of 0.68. The result indicates that the MOEA/D-ALNS algorithm outperformed and dominated the other two EAs. The MOEA/D and MOEA/D-LNS algorithms rank second and third, respectively.
The Ranking of Algorithms Based on SAM

Note: SAM = simple additive method; BEC = best energy consumption; BR = best risk; CPU = computational time; NPS = number of Pareto solutions; HV = hypervolume; SP = spacing; MOEA = multi-objective evolutionary algorithm; MOEA/D = multi-objective evolutionary algorithm using decomposition; LNS = large neighborhood search; ALNS = adaptive large neighborhood search.
Notably, our results closely align with a recent experiment conducted by Wang et al. ( 63 ) which focused on the multi-objective perishable product VRP. Unlike our approach, their research developed an algorithm that combined the NSGA-II framework with ALNS operators. This new approach, termed NSGA-II-ALNS, was compared with the basic NSGA-II algorithm and the NSGA-II-LNS algorithm. Their findings demonstrated superior overall performance of NSGA-II-ALNS over both the basic NSGA-II and the NSGA-II-LNS. When comparing the performance of the LNS algorithm under the NSGA-II and MOEA/D frameworks with the basic NSGA-II and MOEA/D, respectively, both our study and that conducted by Wang et al. ( 63 ) presented consistent results. In particular, the inclusion of the LNS algorithm led to an improvement in the objective function and an increase in HV. This consistency across different studies further validates the notion that integrating ALNS operators into the evolutionary framework, along with other tailored improvement strategies, can significantly enhance the quality of derived solutions.
Figure 4 shows the Pareto fronts for all algorithms, illustrating the dispersion of Pareto points in the solution area. An inverse correlation between the two objective functions is observed. This implies that reducing energy consumption can lead to a rise in the risk function, and vice versa. In practical terms, the optimal solution concerning the risk objective function might come at a high energy consumption. Conversely, the solution with the lowest energy consumption is likely to involve a high-risk route.
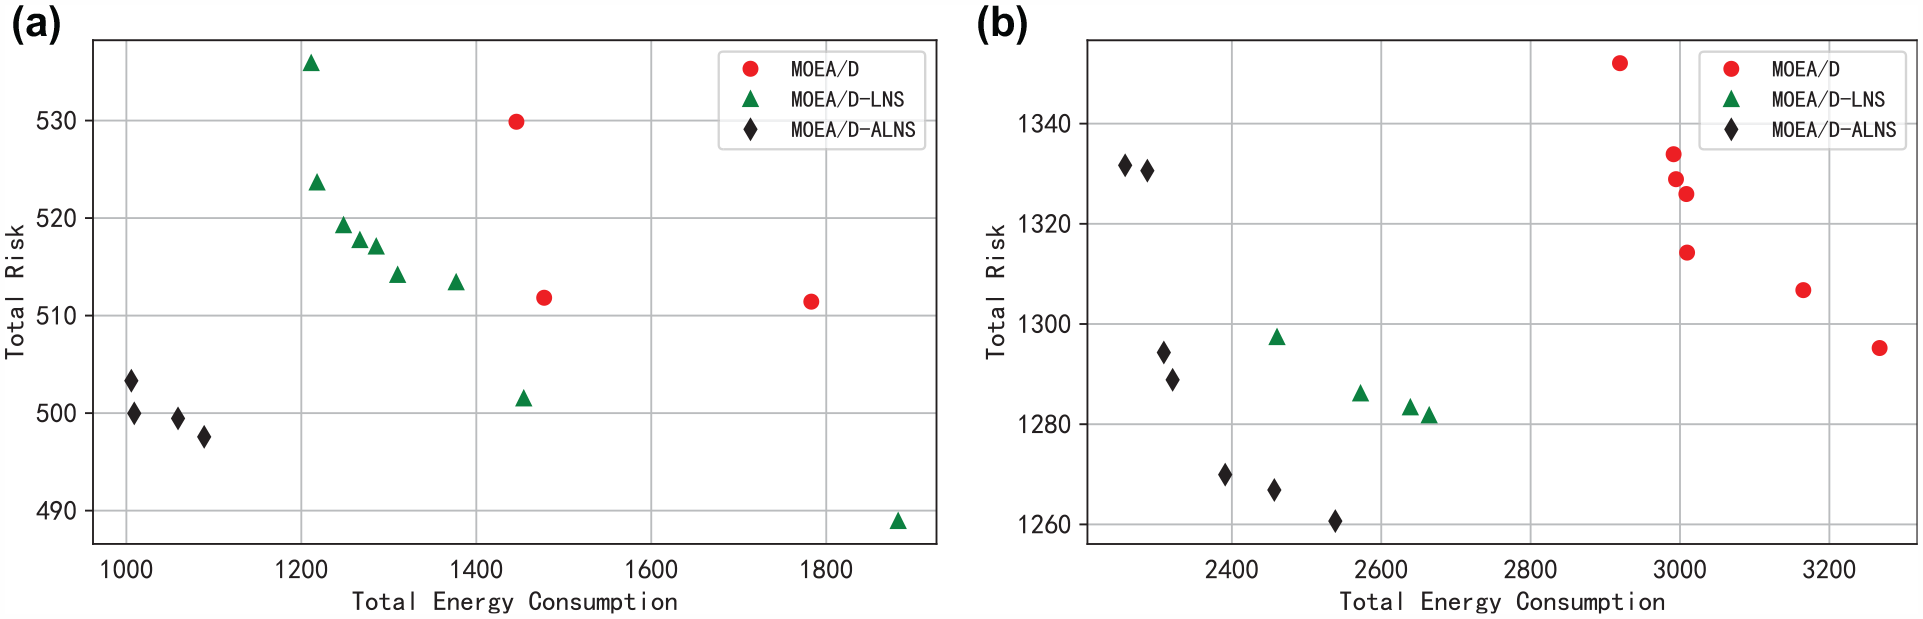
The evolutionary-based algorithms’ Pareto fronts: (a) instance: rc201_21_50; (b) instance: rc_21_100.
Sensitivity Analysis and Implications
This section investigates the effects of time windows on the objective function by removing them. Additionally, a sensitivity analysis is performed to evaluate how changes in battery capacity affect the objective functions. If the impact is minor, a non-fully charged policy can be implemented to preserve battery health. Since the previous tests revealed that the MOEA/D-ALNS algorithm achieved better solution quality than other algorithms, it is used exclusively for all tests in this section.
The first experiment examines the influence of time windows on the solution. Table 9 demonstrates that when comparing scenarios with and without time windows, the average energy consumption decreased by 35.56%, 26.87%, 40.86%, and 51.21%, while the average risk values reduced by 29.43%, 17.32%, 12.42%, and 15.95% for the instances with
Sensitivity Analysis Results for Time Windows
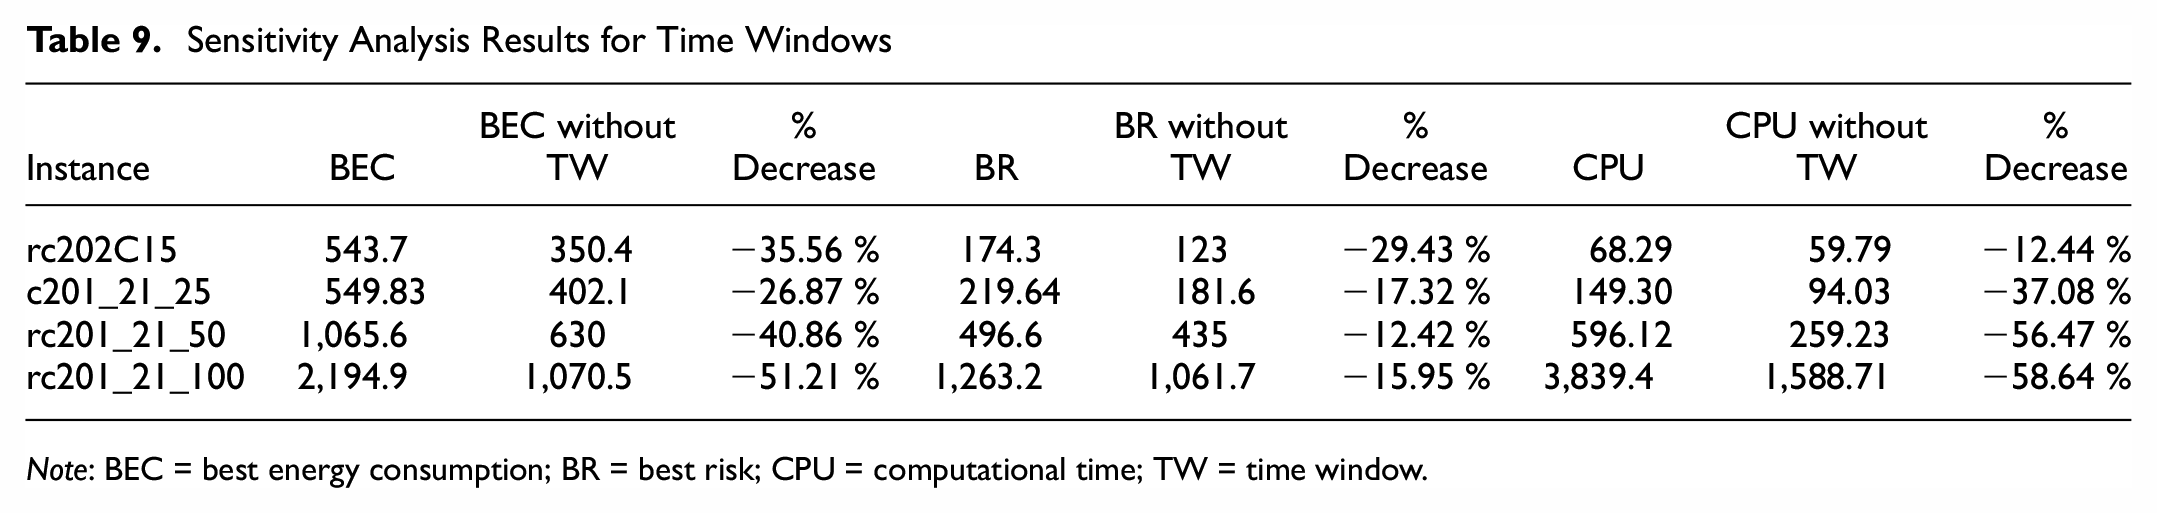
Note: BEC = best energy consumption; BR = best risk; CPU = computational time; TW = time window.
Relaxing time-window constraints in the MWEVRP yields substantial improvements in energy consumption, risk value, and computational efficiency. Particularly, when the number of demand nodes increases to 50 or more, the CPU required to solve the problem reduces by more than half. As depicted in Figure 5, these advances are likely a result of the increased flexibility in visiting nodes and better usage of charging stations. Without time-window constraints, vehicles can minimize idle time and continuously move between nodes, thus establishing more energy-efficient and safer routes. Additionally, the removal of customer service time constraints allows the algorithm to explore the solution space more efficiently.

Time windows impact on routes (c201_21_25): (a) included; (b) excluded.
The imposition of time-window constraints in medical waste management primarily arises from pressing public health concerns ( 12 ). These constraints ensure that hazardous wastes are disposed of within strict timeframes, thus mitigating associated health threats. Normally, medical waste collection is synchronized with the operational hours of health care institutions. However, unforeseen events, such as disease outbreaks, can trigger surges in waste volumes. Such unexpected surges challenge the established time constraints, leading to potential backlogs and heightened safety risks.
Given the challenges posed by strict time-window constraints, emerging practices present promising solutions. Notably, not all medical waste carries the same level of risk. Wastes that have undergone initial treatment, or those without harmful bio-agents, can be managed with more flexibility, reducing the need for rigid time constraints ( 65 ). Furthermore, with a rise in health care facilities operating around the clock, off-peak collection through outsourcing is becoming an increasingly viable solution, addressing the logistical challenges of tight time windows ( 23 ). The integration of these practices (such as flexible time management of low-risk waste and off-peak collection) into our research offers a practical path to alleviate time-window constraints, thereby enhancing the efficiency and safety of medical waste management.
The second experiment involves a detailed sensitivity analysis to explore the relationship between the objective functions and potential changes in battery energy levels. Reserved energy levels (REL) of 10 %, 7.5 %, 5 %, and 2.5 % are considered, which indicate that 90 %, 92.5 %, 95 %, and 97.5 % of the energy stored in the battery can be consumed by the EV. The MOEA/D-ALNS algorithm is used to solve the modified problem instances, with the results recorded in Table 10. Table 11 further illustrates the relative percentage deviation, minimum, maximum, and average change rates of objective functions as the REL varies from 10 % to 2.5 %. These indices are designed to identify potential fluctuations and overall trends in energy consumption and risk. The relative percentage deviation is formulated as follows:

where
Average Results of Problem Instances with Various Reserved Energy Level
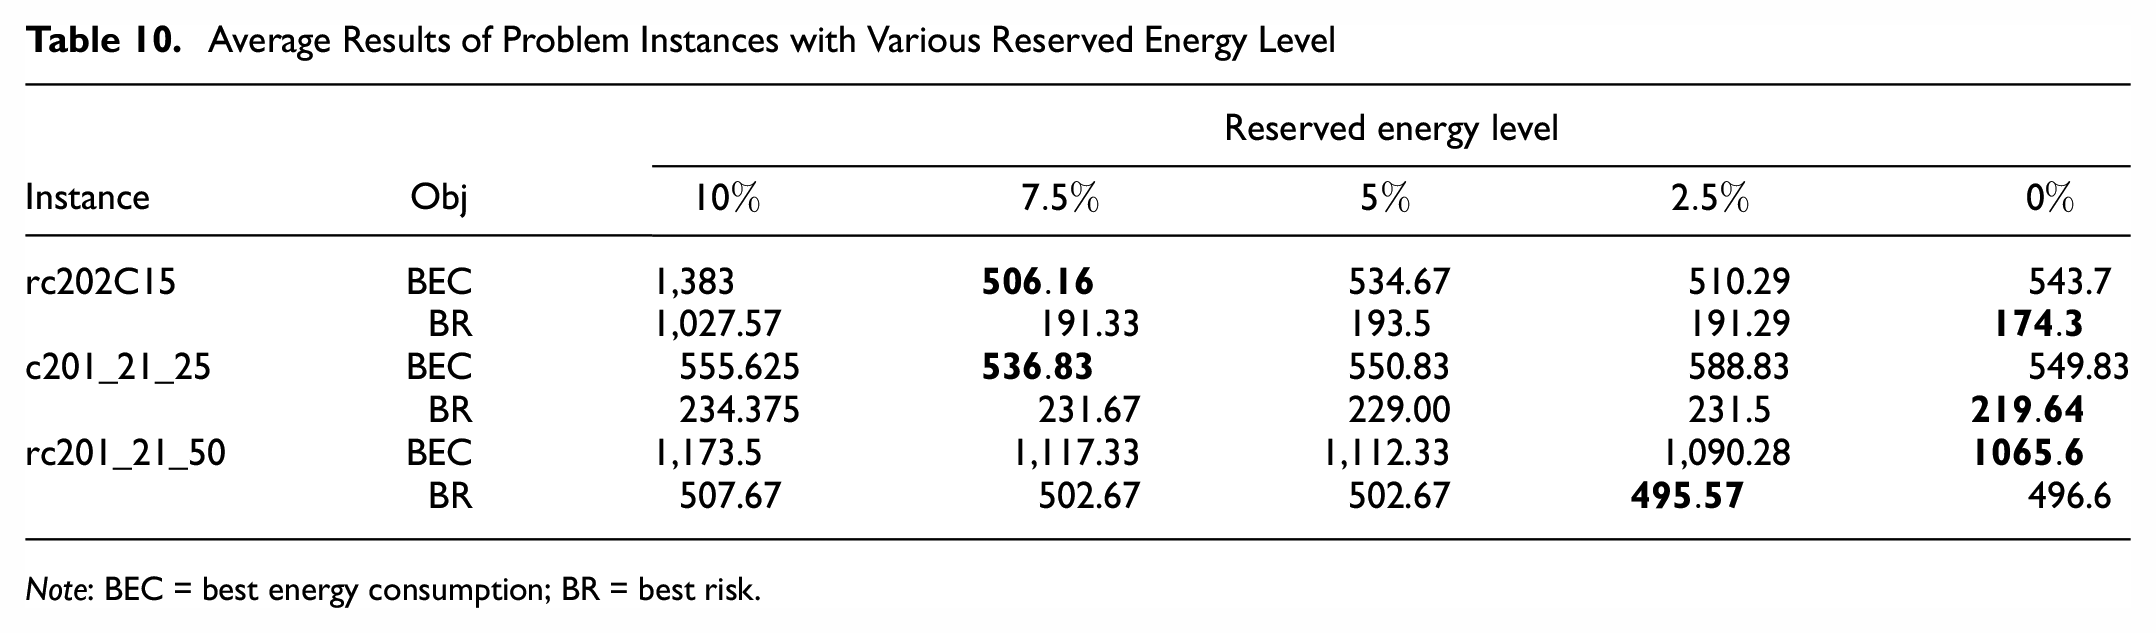
Note: BEC = best energy consumption; BR = best risk.
Relative Percentage Deviation of Objective Functions Between Various Reserved Energy Levels
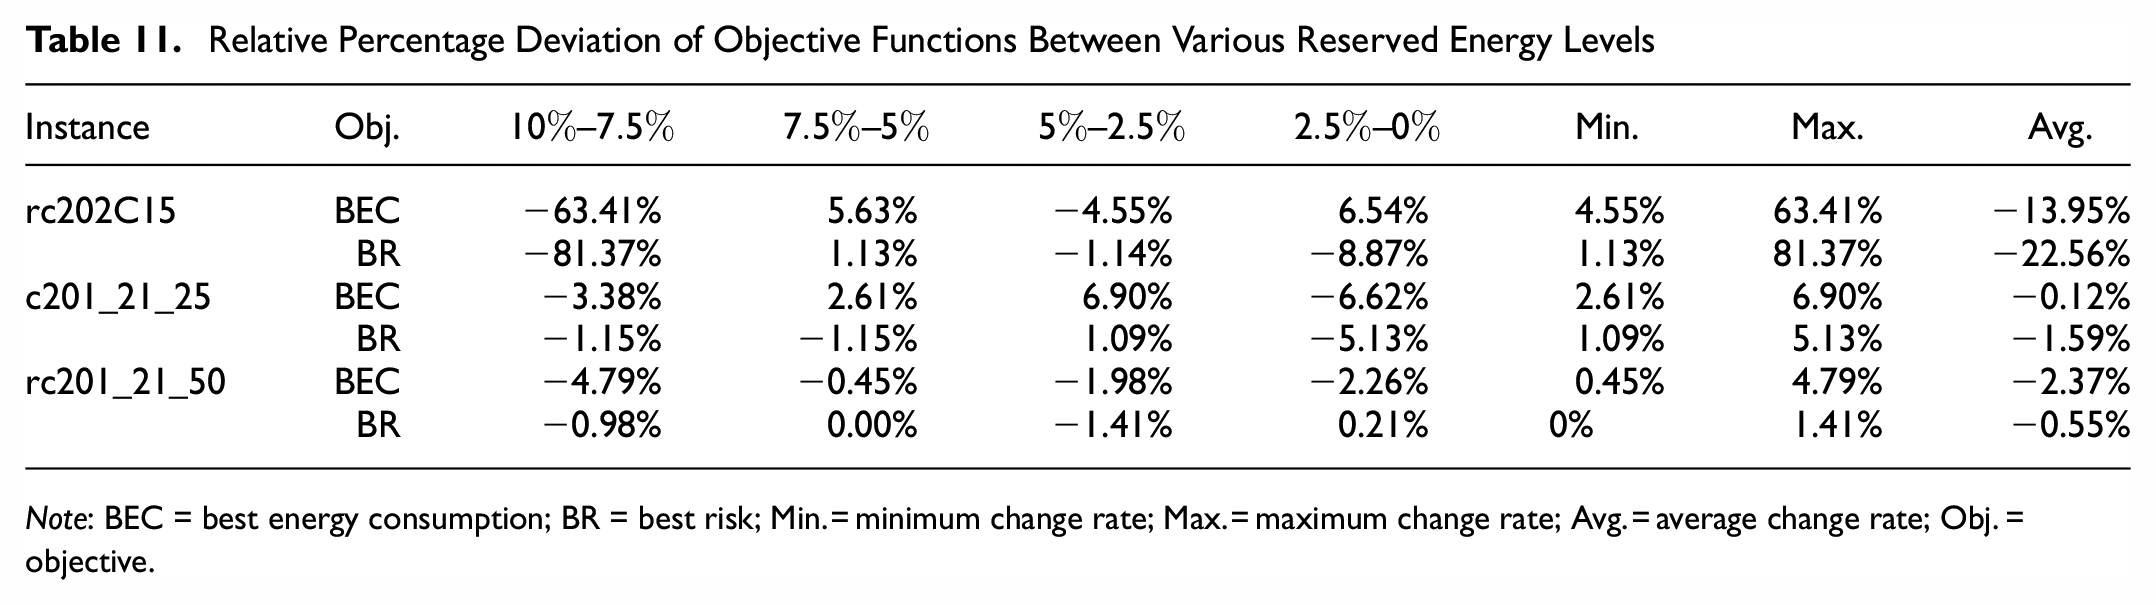
Note: BEC = best energy consumption; BR = best risk; Min. = minimum change rate; Max. = maximum change rate; Avg. = average change rate; Obj. = objective.
Our analysis reveals an inconsistent relationship between the objective functions and the REL, despite a noticeable trend of declining objective function values as the REL decreases. This inconsistency seems to be driven by both the size of the considered instance and the inherent characteristics of the proposed solution algorithm.
For instance size, the average change rates, as outlined in Table 11, show that in small instances such as c202C15, where only a few vehicles are deployed, both energy consumption and risk are highly sensitive to shifts in the REL. An increase in REL might necessitate more frequent charging for EVs, thereby leading to a significant surge in both energy consumption and risk. For instance, in the rc202C15 scenario, substantial reductions in energy consumption and risk are observed when the REL shifts from 7.5% to 10%. In contrast, in larger instances like c201_21_25 and rc201_21_50, adjustments in the REL exert only a marginal impact on energy consumption and risk. This may be attributed to the larger fleet size, offering more total battery capacity and flexibility in route planning.
Apart from the instance size, the observed inconsistency may also stem from the inherent characteristics of the solution algorithm being used. This algorithm produces solutions that involve multiple conflicting objectives, aiming to identify an optimal compromise between them. As a result, it can lead to outcomes that are not always consistent. For instance, it could generate a solution with low risk but high energy consumption, or vice versa, resulting in fluctuations in these two objective functions.
Metrics such as the minimum and maximum change rates in Table 11 help illustrate the degree of variability in the solution across different data instances, indicating that as the instance size increases, the variation in the objective function values tends to diminish.
In practice, it is advisable to keep the battery energy level slightly below its full capacity to optimize energy consumption and risk management, while also preserving battery health. Our results suggest that an energy level of 92.5 % seems optimal for small instances with 15 or 25 demand nodes, while a level of 97.5 % might be more suitable for larger instances with 50 demand nodes. Thus, determining the ideal energy level requires a comprehensive evaluation of specific problem instances to attain an optimal balance between energy consumption, risk, and battery health.
Conclusion
This study addresses the significant health and environmental challenges posed by the MO-MWEVRP, a complex problem that entails optimizing both route and recharging decisions. To tackle this issue, a bi-objective MILP model and an innovative MOEA/D-ALNS algorithm have been developed. Numerical experiments showcased the superior performance of the MOEA/D-ALNS algorithm compared with the NSGA-II, MOEA/D, and MOEA/D-LNS algorithms on modified EVRP benchmark instances, taking into account realistic assumptions. Moreover, the experimental results revealed an inverse relationship between energy consumption and the risk of infection, providing planners valuable insights into the trade-offs between clean-and-risky routes and polluted-and-safe routes for medical waste transportation. Decision makers can use these insights to tailor solutions to fit their desired objectives. Additionally, this study includes sensitivity analyses of time windows and battery capacity, yielding further valuable insights.
For future research, several directions could be explored: Firstly, researchers could address inherent uncertainties in the problem, such as dynamic traffic conditions and demand uncertainties, by using robust optimization and fuzzy programming techniques. Secondly, emerging technologies such as generative pre-trained transformers (GPT) could be incorporated to fine-tune algorithm parameters and enhance the algorithm’s performance. Finally, efficient exact solution methods for MWEVRP could be developed, while considering additional constraints such as lunch breaks, multi-depot scenarios, and multiple disposal sites.
Footnotes
Author Contributions
The authors confirm contribution to the paper as follows: study conception and design: Keyong Lin, S. Nurmaya Musa; data collection: S. Nurmaya Musa; analysis and interpretation of results: S. Nurmaya Musa, Hwa Jen Yap; draft manuscript preparation: Keyong Lin. All authors reviewed the results and approved the final version of the manuscript.
Declaration of Conflicting Interests
The author(s) declared no potential conflicts of interest with respect to the research, authorship, and/or publication of this article.
Funding
The author(s) disclosed receipt of the following financial support for the research, authorship, and/or publication of this article: This research was partially funded by the Universiti Malaya Research Grant (grant number: IIRG008B-19IISS) and Faculty Research Grant (grant number: GPF034A-2019).