




Abstract
Being able to predict motor vehicle crashes which are a major public health concern would greatly improve traffic safety. The prevalence of mobile sensing platforms now allows spatially and temporally rich driving data to be collected relatively easily. Research efforts have been devoted to predicting crashes from such data. This paper seeks in particular to assess the feasibility and performance of using aggregated fine geo-resolution vehicle telemetric data for crash risk prediction. We acquired vehicle telemetric data from Geotab Inc., which recorded the frequency of hard acceleration, hard braking, harsh cornering, and the average magnitude of those harsh events among its registered commercial vehicles for every 150 × 150 m2 roadway segment within Columbus, Ohio between January and April 2018. We aggregated the data, obtained the crash history from the Ohio Police Accident Report, and leveraged three machine learning–based algorithms to predict the crash risk. The results suggest that aggregated vehicle telemetric data could provide acceptable predictions for crash risk at a roadway segment level. Our models’ predictive performances were further improved and maximized by including in the models both vehicle telemetric data and roadway geometric characteristics. Several factors, such as the aggregated count of hard accelerations and the presence of an intersection, were shown to be the factors that potentially made the greatest contribution to crash occurrence. We concluded that vehicle telemetric data could provide complementary and valuable information about crash likelihood monitoring, which may enable the police and city planners to implement proactive safety interventions. Yet the nature of traffic crashes is still complex and multi-dimensional.
Motor vehicle crashes are a public health concern both in the United States and abroad, as considerable societal and economic costs accrue not only to the crash victims and their families but also to society at large ( 1 , 2 ). Each year, approximately 1.25 million people are killed on roads around the world and millions more sustain injuries ( 3 ). According to the Centers for Disease Control and Prevention (CDC), motor vehicle crashes are a leading cause of death, killing over 100 people a day in the United States ( 2 ). In 2020, more than 40,000 people died in motor vehicle crashes in the United States ( 2 ). Safety is undoubtedly a primary goal of transportation engineering ( 4 ), and crash prediction has been of major importance in proactively improving traffic safety ( 5 ).
Mobile sensors are an extremely useful source of data with prospective applications in transportation fields ( 6 ). With the prevalence of smartphones and integrated mobile sensing platforms, modern vehicles can be fitted with sensors connected directly to the on-board diagnostic (OBD) system or client-owned smartphone devices to collect driving data, making the derivation of exposure measures and surrogate safety measures (SSMs) a relatively easy task ( 6 ). This can reduce the cost of data collection and facilitate the process of obtaining large-scale driving data for safety research, and is believed to be significant as SSMs have become a popular proactive alternative to crash-based methods in crash prediction given that observed crashes themselves are not complete predictors of safety ( 7 ). SSMs are generally defined as any non-crash measures that are physically and predictably related to crashes ( 7 , 8 ), such as congestion, speed, and so on ( 8 , 9 ).
Vehicle telemetry now allows vehicle driving data including acceleration, deceleration, and speed to be collected in real time. Common SSMs such as hard acceleration, hard braking, and average speed can then be obtained readily. Many insurance companies nowadays, such as Progressive and Root Insurance, have a pricing scheme providing driver-performance-based insurance rates based on the telemetric data collected from their users’ or drivers’ smartphones. The real-time feedback on driving style and price that policy owners pay for insurance may also help improve the users’ awareness of their risky driving behavior and ultimately promote safe driving. Such SSMs are suggested to be not only able to define individual drivers’ risky behavior metrics, but are also advantageous in assessing the likelihood of crash occurrence ( 10 ). Petraki et al. ( 10 ) argued that with a large enough driver sample, researchers would be able to obtain a sizable trip sample that could reflect important information about any risky roadway segments. It is relevant that researchers have incorporated hard-braking events and average speed for crash risk prediction. Bagdadi ( 11 ) found that critical jerk performed better in detecting near-crashes relative to using longitudinal acceleration. In a series of studies researchers incorporated hard-braking events and average speed in their predicting models ( 6 , 7 , 9 ). Notably, there have been mixed findings on the direction of the effect of hard-braking events reported in the existing literature ( 6 , 7 , 11 , 12 ). More specifically, research work using naturalist driving data has shown that the higher frequency of critical jerk events is associated with individual drivers’ higher risk of crash involvement ( 11 ). The research work adopted driving data and crash records from individual drivers, analyzing the data by Poisson regression. The positive association between hard-braking events and crash frequency is also supported by previous findings concluding that a hard-braking rate is positively associated with crash frequency at intersections and on highways ( 7 , 12 ). Others, however, have reported that a hard-braking rate is negatively associated with crash frequencies in that higher hard-braking rates tend to be associated with fewer crashes ( 6 ). Some believe that this phenomenon may be attributed to different research approaches, different data sources, and low data quality ( 13 ).
It is suggested that an “ideal” SSM should possess the ability to predict crash risk under different settings and should be reliable and replicable in producing an accurate result whatever the setting ( 12 , 14 ). We’ve already seen research work using SSMs such as hard-braking events conducted at varying locations within different time periods telling different stories ( 6 , 7 , 11 , 12 ), whether data acquired from other sources replicate or contradict previous findings and conclusions needs to be further tested and validated ( 8 ). In addition, the authors believe that those less-studied SSMs are also worthy of research in the field of crash risk prediction. This paper therefore focuses specifically on these aggregated measures: aggregated counts of hard acceleration events, aggregated counts of hard-braking events which have been studied quite often, and aggregated counts of harsh cornering events. The authors hypothesize that by aggregating the measures and combining them with crash record, it would be possible to assess the crash risk associated with specific roadway segments ( 15 ). Besides, many traditional crash models and screening techniques for road safety management have adopted regression techniques ( 6 , 7 ) which might have suffered difficulties in fully capturing the complex relationships between crashes and other factors owing to the inherent limitations of regression techniques. To address this, in this paper we chose three machine learning–based algorithms. Moreover, research data obtained through GPS can sometimes be noisy, the use of data that are directly derived from vehicles’ OBD II should be able to provide researchers with high-quality data for safety research ( 12 ).
Based on the discussion above, the specific aims of this paper were: 1) to examine if our findings about using a set of measures derived from aggregated vehicle telemetric data for crash risk prediction replicate what has been reported in the literature; and 2) to add to the existing research database extra data points for the feasibility and performance of using aggregated vehicle telemetric data for crash risk prediction. We used the Geotab data recorded and managed by Geotab Inc., which measured the frequency of a series of harsh events and the salience of the events for every specified roadway segment within Columbus, Ohio. In addition to the aggregated harsh events, our analysis also included the roadway geometric characteristics of the same roadway segments to assess if they would supplement the aggregated harsh events to yield better predicting performance. Three types of machine learning–based algorithms, including regularized logistic regression (RLR), eXtreme gradient boosting (XGBoost), and neural network (NN) were employed to build the association between the predicted feature (crash occurrence) and the predicting features (i.e., aggregated vehicle telemetric data, roadway geometric characteristics).
Methods
Data
Geotab Inc. collected data on hard acceleration, hard braking, and harsh cornering events from their registered commercial vehicles via the Geotab GO telemetric device, which was directly plugged into the vehicles’ OBD II port ( 16 ). Geotab Inc. recorded and managed the Geotab database, which supplied the aggregated vehicle telemetric data ( 17 ). The data recorded the hourly aggregated frequencies of hard acceleration (> 0.3 gravity), hard braking (> 2.5 gravity), and harsh cornering (> 0.3 gravity) events, and the average magnitude (m/s2) of those harsh events for every 500 ft × 500 ft (150 m × 150 m) geo-spot of the roadways within Columbus City, OH. The Geotab database contained 28,038 geo-spots with each assigned a unique identifier consisting of a seven-digit alphanumeric number (geohash). The databases’ recorded geo-spot latitude range was from 39.79729 to 40.14198, and the longitude range was from −83.25371 to −82.76207.
The data were collected between January and May 2018, and had approximately 9 million observations. The frequencies of hard acceleration, hard braking, and harsh cornering events were further aggregated by month. Since the Geotab data only recorded the data collecting month for every record, the daily and weekly based aggregated frequencies for those harsh events were unavailable. For every geo-spot, we summed the aggregated counts for the acceleration, braking, and cornering events. The maximum average magnitude of the adjacent roadway geo-spots was also computed to account for possible spatial correlations between adjacent roadway segments ( 18 , 19 ).
The roadway geometry for every geo-spot was obtained from the 2016 to 2018 Ohio Police Accident Report (PAR) database. The Ohio PAR database provided geo-coordinates for every crash, so that their crash locations could be converted and matched to the seven-digit alphanumeric identifiers in the Geotab database. The roadway geometric variables included the maximum speed limit and whether a school zone, a work zone, or an intersection were present within the spots. As some geo-spots in the Geotab data set did not appear in the 2016 to 2018 Ohio PAR database, we were not able to obtain those spots’ roadway geometric variables, and those spots were then removed from the analysis (in total, 43,204 observations out of 96,072 were dropped). Therefore, the geo-spots we investigated all had previous crash reports before the focused period (January to May 2018), and we thought these spots were “crash-prone-geo-spots” given the previous crash occurrence. Furthermore, the geo-spots that were in the PAR database but with missing values for roadway geometric variables were also excluded from our final analysis. Queries from the 2018 Ohio PAR database provided the number of crashes per geo-spot within a given month. If no crashes occurred during that month for a geo-spot, the number of crashes was set to zero. The predicted variable was whether crashes occurred in a given month for a geo-spot. In other words, we used vehicle telemetric data (e.g., aggregated counts of hard acceleration and braking events within a certain month), combined with roadway geometric characteristics of a given geo-spot to predict whether crashes occurred in this month.
The numerical predicting variables (vehicle telemetric data) are summarized in Table 1. The categorical (binary) predicting variables’ characteristics (roadway geometric variables) are presented in Table 2. Note, many minima and median values of numerical variables were equal to zero (Table 1), suggesting that the five-month data collecting window provided very sparse observations, and the variable distributions were right-skewed. As for the predicted variable crash occurrence, we had 13.8% geo-spots with at least one crash versus 86.2% without a crash. In this study, we separately investigated how the predicting variables predict crash occurrence by dividing them into three sets (vehicle telemetric features, roadway features, and combined features) (Table 3).
Summary of Numerical Predicting Variables

Note: SD = standard deviation; Min. = minimum; Max. = maximum.
Summary of Binary Predicting Variables’ Characteristics
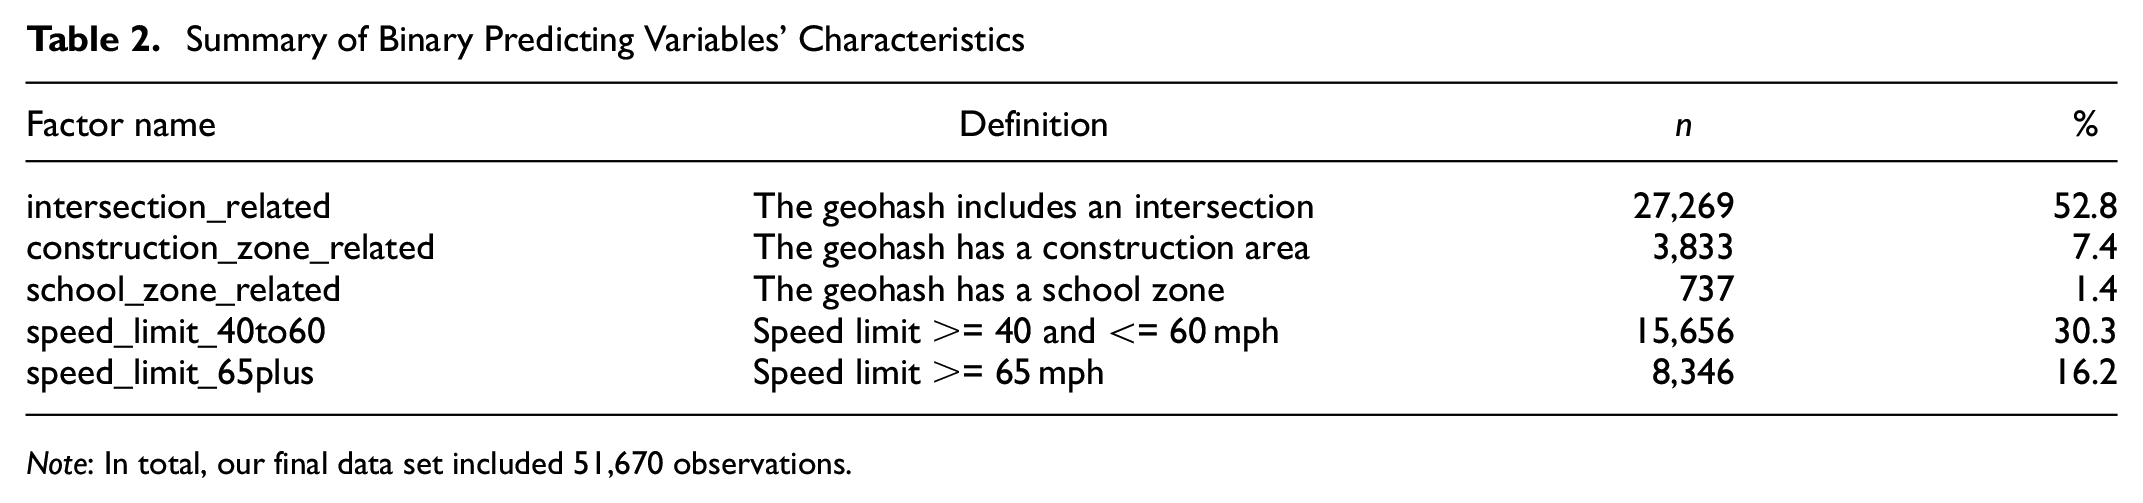
Note: In total, our final data set included 51,670 observations.
Definitions of Different Predicting Variable Sets
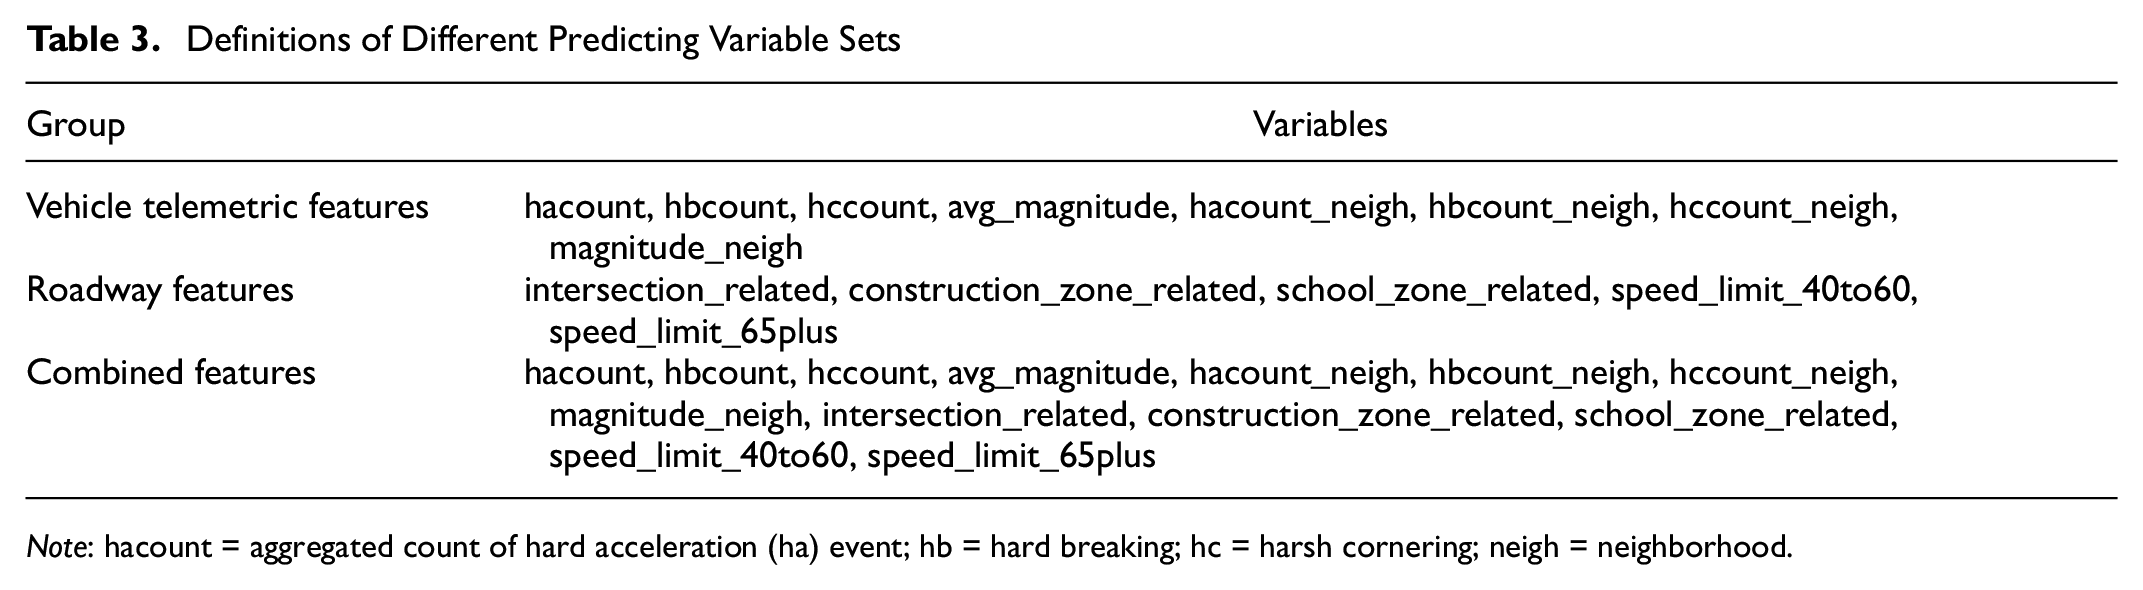
Note: hacount = aggregated count of hard acceleration (ha) event; hb = hard breaking; hc = harsh cornering; neigh = neighborhood.
Methodology
Our main goal was to predict crash occurrence. Since the predicted variable, whether crashes would occur at a given geo-spot was binary, our prediction was essentially classification. We therefore used three machine learning–based algorithms to help achieve the research goal. The three methods were RLR, XGBoost, and NN, all commonly used classification algorithms. For each algorithm, we built three models to compare their predictive performance based on the three different sets of predicting variables listed in Table 3. We conducted all the analyses using the programming language Python. The algorithm’s structure, their predictive performance, and the variable importance of each algorithm will be illustrated in the following sections.
Regularized Logistic Regression (RLR)
The regularized regression technique, including ridge and lasso regressions, can mitigate the overfitting problem associated with the traditional regression models and, as a result, can provide improved predictive performance ( 20 – 22 ). Regularized regressions set constraints on the coefficient estimates and shrink the estimates by adding a regularization/penalty term to avoid complex models. The algorithm structure for RLR is given in Equation 1:

where
θ is a vector consisting of coefficient estimates,
m is the number of observations, and
When a = 1, the logistic regression is with a lasso penalty. If the regularized/tuning parameter λ is sufficiently large, many θ estimates will be forced to be zero, and a simpler model will be obtained ( 22 ). When a = 2, the logistic regression is with a ridge penalty, and the θ estimates for unimportant variables will be close to zero ( 22 ). When λ is set to zero, the model becomes the regular logistic regression. We tuned the RLR for the ridge/lasso penalty and λ within the range from 0.00001 to 100 using five-fold cross-validation.
eXtreme Gradient Boosting (XGBoost)
Generalized linear models (e.g., logistic regression) predefine a linear relationship between predicted and predicting variables and usually cannot account for complex nonlinear relationships. Also, generalized linear models have a limited ability to identify interactions between the predicting variables. In contrast, tree-based models are capable of dealing with both nonlinearity and interactions, possibly resulting in a better predictive performance than generalized linear models. Many previous studies have applied tree-based models to determine the contributing factors to severe traffic crashes ( 23 , 24 ) and the likelihood of crash occurrence ( 25 – 27 ).
Chen and Guestrin ( 28 ) proposed the XGBoost decision tree to improve the prediction resulting from a single tree. The XGBoost decision tree combines the results of a sequence of decision trees and then provides a final prediction. Specifically, the XGBoost technique first fits a tree using the residuals from the previous tree as the response, rather than the outcome Y. The new decision tree is then added to the fitted function (Equation 2) to update the residuals,

where
B is the number of trees,
hb(x) is the output of a single decision tree, and
λ is the shrinkage parameter, controlling the learning rate of XGBoost.
We tuned four parameters for our XGBoost models: 1) λ, the model’s learning rate; 2) B, the number of trees; 3) d, the maximum depth of each tree; and 4) m, the minimum number of children weight. The early stopping method avoids overfitting (if, after a fixed number of iterations, no improvement was observed [e.g., the model accuracy does not increase], the algorithm stops adding more trees to the models). We again leveraged five-fold cross-validation to select the best combination set of (λ, B, d, m).
Neural Network (NN)
NNs mimic the structure of biological neurons and are at the core of Deep Learning. They are versatile, powerful, and scalable, making them ideal for tackling large and highly complex machine-learning tasks such as classifications ( 29 ). Besides tree-based models, NNs are often used to approximate nonlinear and complicated relationships between predicted and predicting variables. The model’s structure in our study consisted of three layers: the input layer, the output layer, and a hidden layer (Figure 1). The input layer dimension is equal to the number of input features. The output layer dimension is equal to 1, which is binary and refers to whether crashes occurred at a given geo-spot.
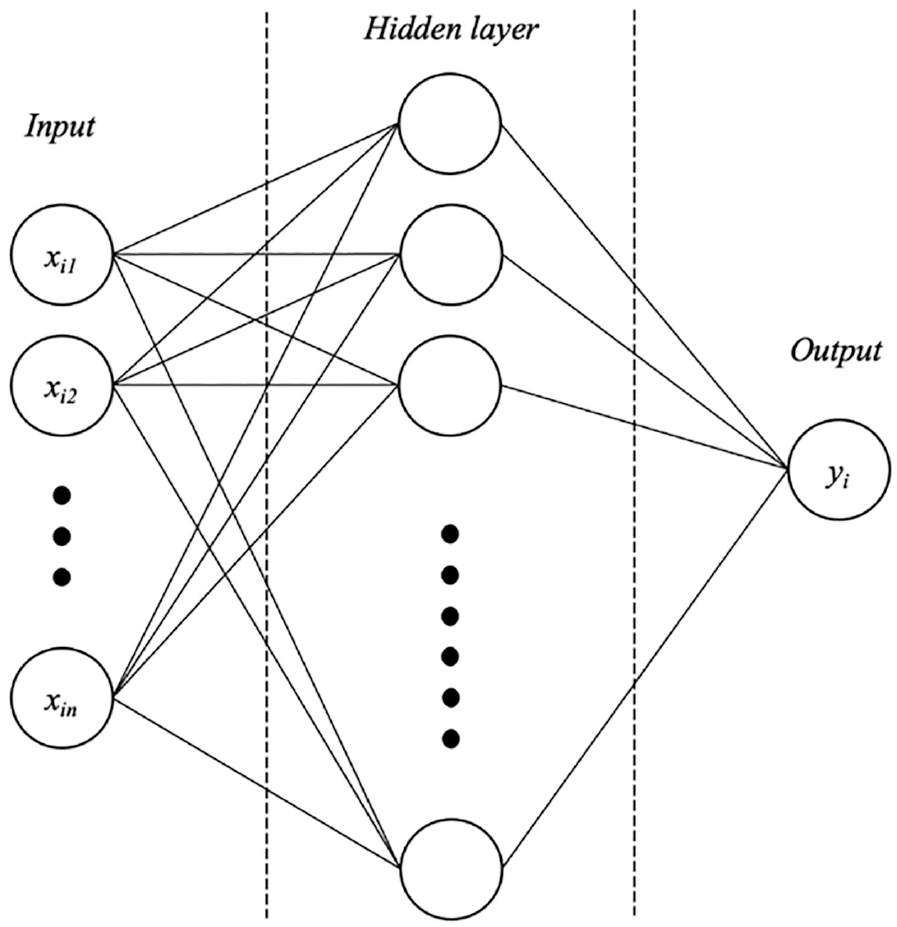
Architecture of single-layer neural network.
Given that the performed task was relatively simple as a machine-learning task (binary classification with few variables of interest), we chose to incorporate only one hidden layer in our NN model. Each neuron in the hidden layer is associated with a “weight” applied to the input features. To train an NN, forward and backward propagation are the essential processes. Forward propagation is usually used first by applying a set of randomly selected starting weights to calculate the output ( 30 ). Then the output is compared with the actual output, yielding a quantified error that will later be used for the backward propagation. Backward propagation adjusts the weights to minimize the error. The forward and backward propagations are then repeated until a maximum iteration number or a predefined stopping criterion is reached ( 30 ).
Data Processing and Model Evaluation
The imbalance issue and the inequality and uncertainty of the cost for false negatives (a geo-spot with a crash but no predicted crashes) versus false positives (a geo-spot without a crash but was predicted to have a crash) required our evaluation metric to be classification-threshold-invariant. Therefore, we used the receiver operating characteristic (ROC) curve as the metric to evaluate the separability of our models. The associated measure, the area under the curve (AUC) ranges between 0 and 1. When AUC is 0.5, the model has no classification capacity, and when AUC approaches 1, the model is excellent for discriminating between positive and negative cases. AUC results are considered excellent for AUC values between 0.9 and 1, good for AUC values between 0.8 and 0.9, fair or acceptable for AUC values between 0.7 and 0.8, and failed for values between 0.5 and 0.6 ( 31 ). Usually, when AUC is less than 0.5, the tested model performs worse than a random classifier. In addition to evaluating the models using ROC and AUC, we also assessed variable importance to identify the most contributing factors to predict crash occurrence for the best model of each algorithm.
Results
We first visualize the ROC curves and the associated AUC values for the three models. The optimal tuning parameter(s) for each model that maximized the cross-validation AUC values are presented in Table 4. The ROCs and AUC values for the RLR, XGBoost, and NN models with the three sets of predicting variables against the testing data set are presented in Figure 2. The AUC value was 0.64 for the RLR model, 0.67 for the XGBoost model, and 0.65 for the NN model when using the vehicle telemetric features as the only predicting variables. With the vehicle telemetric features and roadway geometric features (the combined features), the AUC value for all algorithms increased to 0.71. The roadway features alone of a given geo-spot yielded AUC values of 0.69, 0.68, and 0.67 for the RLR model, the XGBoost model, and the NN model, respectively. These values were higher than predicting crash occurrence only using the vehicle telemetric features, but lower than that of using the combined features.
Tuning Parameters for the Models
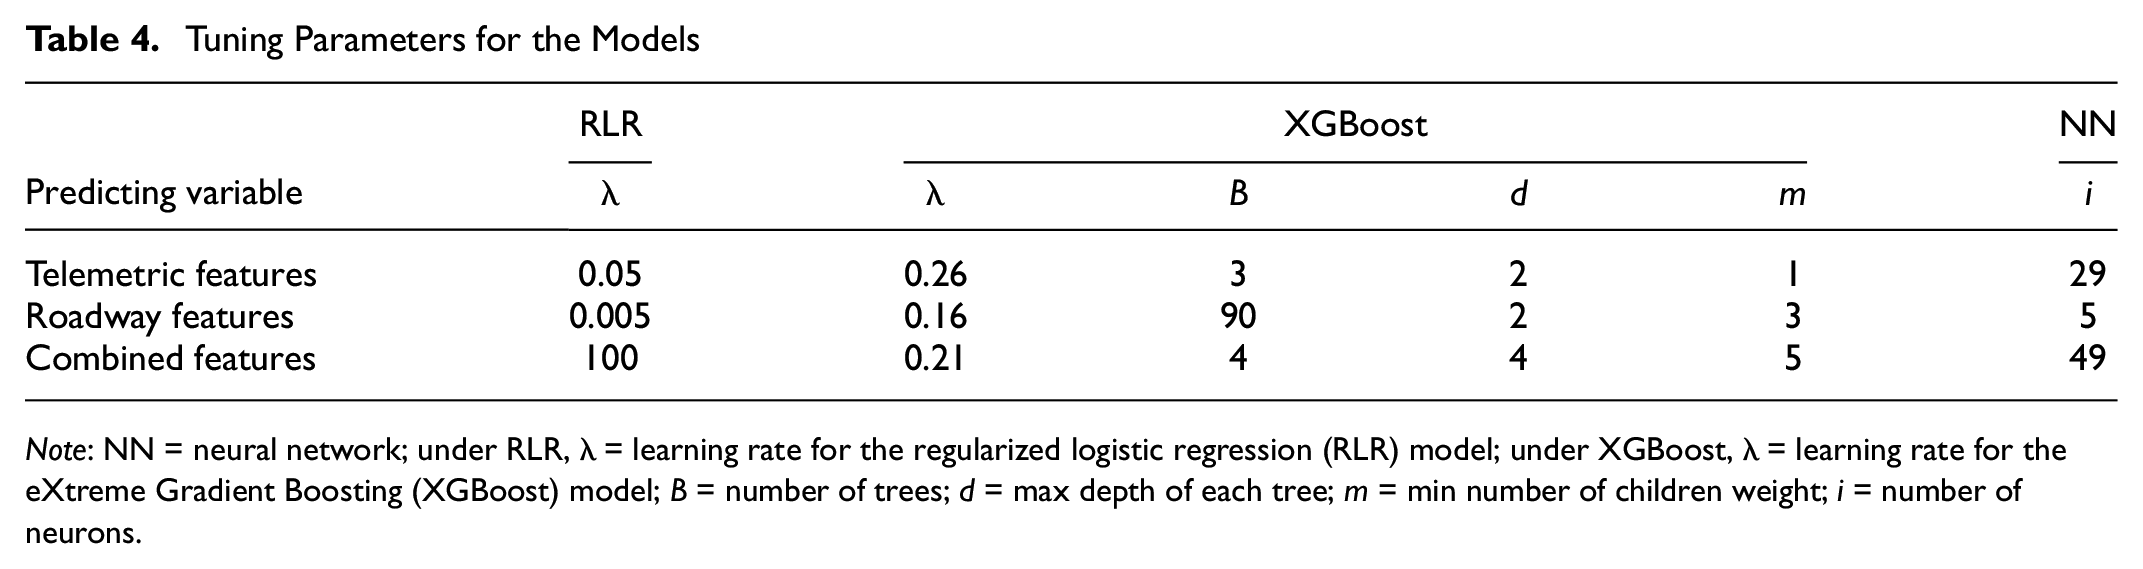
Note: NN = neural network; under RLR, λ = learning rate for the regularized logistic regression (RLR) model; under XGBoost, λ = learning rate for the eXtreme Gradient Boosting (XGBoost) model; B = number of trees; d = max depth of each tree; m = min number of children weight; i = number of neurons.
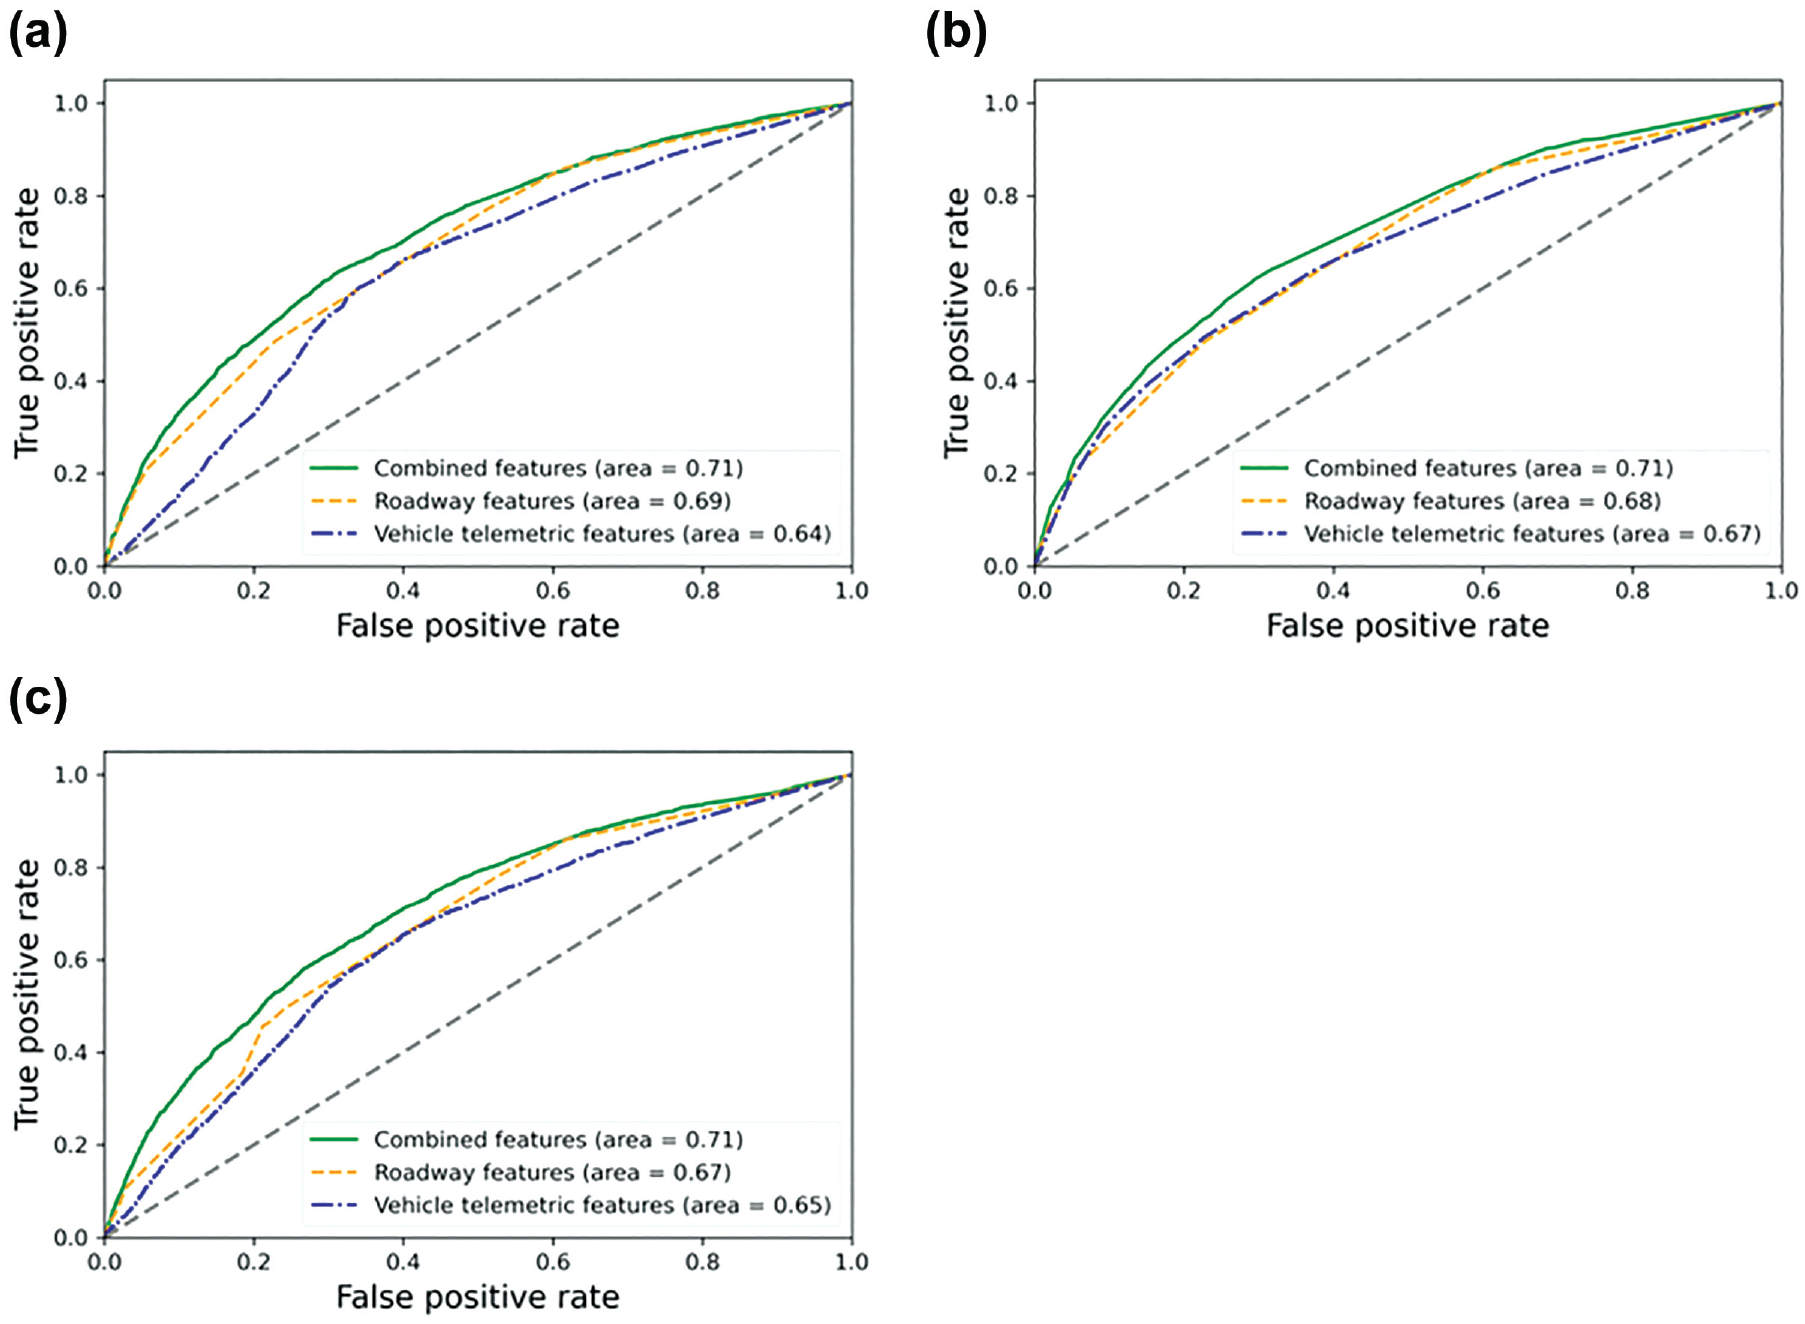
ROCs for models using: (a) regularized logistic regression (RLR) algorithm; (b) XGBoost algorithm; and (c) neural network (NN) algorithm.
Because all models performed best using the combined features as the predicting variables, we assessed the variable importance associated with the best models. For RLRs, the regression coefficients’ magnitude could derive the variable importance. By fitting the model using standardized independent variables, the coefficients are then standardized regression coefficients, and we employed this method to acquire the variable importance for the RLR model. For the XGBoost model, calculating the average gain across all splits where the feature was used obtained feature importance. Finally, for the NN model, we calculated a given feature’s importance by permutating this feature 100 times and subtracting the baseline score for the NN model (binary classification accuracy) by the average score obtained from permutating this feature. The normalized feature importance for the three best models under the three algorithms is illustrated in Figure 3. The results for the RLR model suggested that the aggregated count of hard-braking events (hbcount) was the most contributing factor in predicting a given month’s crash occurrence. The second and third most contributing factors for the RLR model were the aggregated count of hard acceleration events (hacount) and the aggregated count of harsh cornering events (hccount). In addition to the aggregated count of hard acceleration events (hacount) being the most contributing factor predicting crash risk, the XGBoost model’s other most contributing factors included a geo-spot with the presence of an intersection(s) (intersection_related) and the aggregated count of hard-braking events (hbcount). The presence of an intersection(s) (intersection_related), the average magnitude of the harsh events (avg_magnitude), and a geo-spot with a speed limit equal to or greater than 65 mph (speed_limit_65plus) were the most contributing factors to predict crash occurrence for the NN model. Note that including a construction area (construction_zone_related) also played a relatively important role in predicting crash occurrence of a given month among the geo-spots studied for both the XGBoost and the NN model.
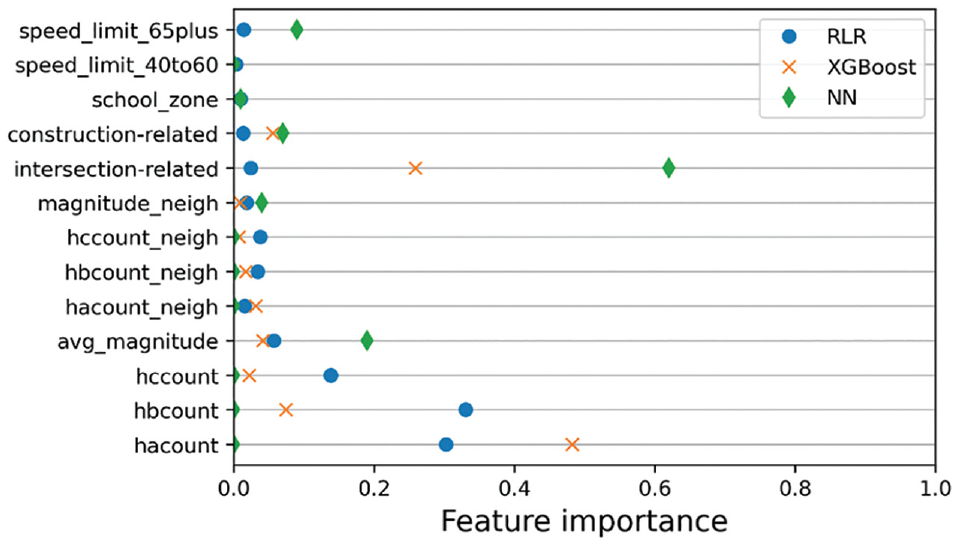
Normalized feature importance for the best models.
Discussion
Traffic crashes are one of the most serious and threatening problems that society encounters nowadays; therefore, research efforts to predict crashes and eventually prevent them from occurring are of paramount importance ( 30 ). SSMs are believed to be a proactive alternative for crash prediction ( 9 ). With the application of mobile sensors in the transportation field and the development of vehicle telemetry, this paper sought to assess the feasibility and performance of using a set of aggregated SSMs from fine geo-resolution vehicle telemetric data for crash prediction. We focused on a data set including 28,038 observations (geo-spots) within Columbus, Ohio, between January 1 and May 31, 2018. We used three machine learning–based algorithms — RLR, XGBoost, and NN — to develop our predicting models.
Our results show that by certain modeling techniques, aggregated vehicle telemetric data possessed the ability to predict crash occurrence, though it was not excellent. It should be noted that in the present study we investigated a series of measures at an aggregated level (e.g., aggregated count of hard acceleration event in a given month); unlike some other metrics such as time-to-collision characterizing behavior at an individual level, the aggregated measures may be referred to as proper surrogate measures of safety instead of safety indicators.
The AUC values we were able to obtain when using vehicle telemetric features alone for crash prediction fell into the range between 0.6 and 0.7, which is comparable to the findings from previous research using several machine learning–based algorithms for crash likelihood prediction (the maximum AUC value the authors obtained was 0.7, while the others all fell into the same range between 0.6 and 0.7) ( 32 ). In the study the authors incorporated both driver age and gender, as well as many other proactive variables such as speed limit to predict short-term crash likelihood at the roadway segment level. They concluded that their models could be implemented for real-time crash monitoring ( 32 ). Considering the relatively low-cost way of obtaining and aggregating vehicle telemetric data by month in this paper, our findings might be significant in a different way in that they demonstrated the utility of aggregated vehicle telemetric data for crash prediction at a roadway segment level. The finding that aggregated SSMs were to some degree predictive of crash occurrence is generally in line with the relevant research work that found that hard-braking events were significantly positively correlated with crash occurrence/counts ( 9 , 26 ). But, at the same time, hard-braking rate has been reported to be negatively associated with crashes ( 6 ), indicating that an inconsistency may still exist between the existing literature and our findings on the direction of effect of hard-braking events on crashes.
Another contribution of the present study, to the authors’ knowledge, is that it investigated not only hard-braking events but also hard acceleration and harsh cornering events. Based on the results of variable importance, the aggregated count of hard acceleration, hard braking, and harsh cornering events all played an important role in crash risk prediction (in the RLR and XGBoost models). This complements previous studies which incorporated hard-braking events, jerk, and average speed as the SSMs for crash/near-crash modeling ( 6 , 9 , 11 ) and adds a new piece of knowledge to the current research database for the relationship between SSMs and crash risk.
In addition to the vehicle telemetric data, our modeling results also suggest that the combined features, which included roadway geometric features and vehicle telemetric features, led to the best crash predicting performance in all three models. This might seem natural as more variables are likely to feed additional information to the model so that prediction accuracy will accordingly increase. On the other hand, this finding provides empirical evidence in support of the belief that traffic crashes are attributed to multiple factors and that their nature is always seen as complex ( 30 ). The AUC value for the best model of each algorithm fell into the range of 0.7 and 0.8, suggesting that the best models obtained in this study exhibited just acceptable predictive performances. The reason might be that other traditional factors that were previously shown to be able to predict crash occurrence might have played a role in the studied data. For example, researchers have stated that weather conditions and the percentage of heavy vehicles on a road segment can affect traffic crashes ( 26 ). In addition, the best crash predicting model achieved by another group of researchers included multiple variables including vehicle kinematics, driver inputs, and weather status ( 30 ). Although in this paper we incorporated vehicular variables (e.g., hard brakings) and driving environment (some roadway geometric characteristics), we were not able to include sufficient information about the drivers themselves (e.g., age and gender). And that may help explain why we have only reached an acceptable predicting performance as the three main traffic safety components are believed to be drivers, vehicles, and the driving environment ( 33 ). In other words, one cannot obtain a model for crash prediction without carefully considering a broad spectrum of variables. Nevertheless, given the ability to predict crash occurrence, we would still believe that vehicle telemetric data could greatly supplement crash analyses. Since traffic crashes are usually rare events compared with harsh events, leveraging vehicle telemetric data will make it possible to identify high-risk locations proactively ( 33 ).
Several limitations were associated with our study. First, we had only five months of commercial vehicle telemetric data (from January 1 to May 30, 2018). The limited sample size resulted in a sparsity of harsh event counts (acceleration, braking, and cornering and the magnitude of those events). This paucity of data also limited our ability to include other potentially influential variables in traffic safety. For example, weather conditions and traffic volume, together with human factors might all play a part in traffic crashes and shaping crash risk ( 4 , 30 , 34 ). The aggregated count of harsh events in the present work may only partially reflect traffic volume effects, as geo-spots with higher traffic volumes tend to have more harsh events. Moreover, the restricted data set precluded us from evaluating the relationship between vehicle telemetric data and severely injured traffic crashes. Identifying the spots that are likely to witness traffic collisions with severe injuries could better facilitate the police in prioritizing their intervention efforts. Second, we were only able to include locations with previous crash records in our modeling because of data availability and accessibility. This may have naturally created a bias in the locations we had worked on and limited the generalizability and interpretations of our results. Besides, some have suggested that having zero crashes in the short term does not necessarily imply long-term safety. That is, (some) locations that we have omitted might also see crashes during the study period. Also, it is believed that geo-locating crashes on the road network based only on police reports might be problematic ( 9 ). Therefore, relevant research is recommended to incorporate locations both with and without previous crash records. Third, the choice of 150-m2 roadway segments might have failed to specify along which direction the crashes occurred and some roadway geometric characteristics that are particularly associated with the crashes. The choice of grid size in this paper was limited by the available data set, which has also prevented us from thoroughly studying the relationship between crash risk and location-specific characteristics and quantitively comparing what grid size is able to yield the best predicting power. Future research, if possible, could consider predicting crash risk using varying sizes of roadway segments. Lastly, given that the data were collected in 2018, the validity of the reported findings today is worth investigating.
Conclusions
Motor vehicle crashes are a leading cause of death. The prevalence of integrated mobile sensing platforms providing vehicle telemetric data allows traffic safety professionals to tackle the issue with crash predictions using proactive safety measures. This research aimed to assess the feasibility and performance of aggregated fine geo-resolution vehicle telemetric data for crash prediction. We built three machine learning–based models using the aggregated vehicle telemetric data acquired from Geotab Inc. and police records in Columbus, Ohio. Overall, our results demonstrate the utility of aggregated fine geo-resolution vehicle telemetric data for predicting crash occurrence. We also found that traffic crashes were a complex phenomenon in which multiple factors, including vehicular harsh events and roadway geometric characteristics were contributory factors. With the proliferation of wireless vehicle communication technologies, the amount of vehicle telemetric data is expected to increase rapidly. Such data are promising in providing complementary and valuable information for monitoring crash probability, thereby enabling the police and city planners to implement safety interventions proactively.
Footnotes
Acknowledgements
We would like to thank Dr. Melody Davis for her valuable comments on the manuscript. We would also like to thank Geotab. Inc for providing their Geotab data to the public as part of the Smart Columbus Operating System initiative.
Author Contributions
The authors confirm contribution to the paper as follows: study conception and design: Sijun Shen, Simon Lin Linwood, Bo Lu, Motao Zhu; data collection: Sijun Shen; analysis and interpretation of results: Sijun Shen, Fangda Zhang; draft manuscript preparation: Sijun Shen, Fangda Zhang. All authors reviewed the results and approved the final version of the manuscript.
Declaration of Conflicting Interests
The author(s) declared no potential conflicts of interest with respect to the research, authorship, and/or publication of this article.
Funding
The author(s) disclosed receipt of the following financial support for the research, authorship, and/or publication of this article: This work was supported by the National Institute of Child Health and Human Development, the National Institutes of Health (R01HD074594).
