
Abstract
To reduce commuting expenses incurred by suburban employers and their urban employees, this paper proposes the operation of commuter buses by an employer alliance and builds a bi-level programming model to optimize their operation. The upper model determines the composition of the alliance with the objective of minimizing total commuting expenses. The lower model optimizes the commuter bus routes so as to minimize the total commuting expenses of the alliance through a consideration of differences in the value of employees’ time. We fairly allocate total operating costs among alliance members based on cooperative game theory, which reinforces the optimized alliance’s stability. This paper then takes Meishan District in Ningbo as a numerical case study. The analysis shows the following: (1) under the alliance model, the total commuting expenses of three allied employers will be reduced by 8.09% per day; (2) the total commuting time of employees can be reduced by 3.75% per day; moreover, (3) the spatial distribution of the bus stops has a significant impact on employers’ willingness to participate in an alliance as opposed to operating an independent commuter bus service. Specifically, the farther dispersed the bus stops and the fewer the employees at each stop, the greater the likelihood that the employer will participate in an alliance.
As urbanization in China has progressed, more and more plants have been relocated to the suburbs to reduce manufacturing costs ( 1 ). Dalian Jinpu New District, Qingdao Huangdao Economic and Technological Development Zone, and Ningbo Meishan Comprehensive Bonded Zone are each far-flung suburbs of the megacities for which they are named, and they were developed primarily to accommodate manufacturing. Although they are all located more than 40 km away from the centers of their mother cities ( 2 ), they have gradually become the cities’ manufacturing clusters and employ large numbers of workers. Because of the “siphon effect” of the elements of living infrastructure in their central cities ( 3 ), however, most employees who work in these late-developed suburbs prefer to live in the mother cities. As a result, their commuting time has increased significantly, while their sense of well-being (including quality of life) has deteriorated ( 4 ). To save the time and monetary costs of long-distance commuting, most suburban employers (both enterprises and institutions) offer commuter bus services between central and outlying manufacturing areas ( 5 ). The employees of each employer are often so widely dispersed throughout the central city, however, that these commuter buses must frequently detour and stop to pick up employees. This increases both the operational costs of the buses and the employees’ in-vehicle time. In this context, the formation of commuter bus alliances may allow multiple employers to coordinate their commute demand and increase the number of employees boarding at any single stop. Such alliances may thus reduce the number of bus stops, the travel distances of commuter buses, the costs of operating the buses, and employee commute times.
Currently, employers usually optimize their commuter bus routes to minimize only their operating (that is, their monetary) costs ( 6 ). In this case, boarding stops that service different numbers of employees are all regarded as homogenous. When a stop accessed by a larger number of employees is arranged at the beginning of a bus route, this may lead to a higher total time cost, as that large group of employees who get on the bus early must spend significantly more time on the commuter bus. Figure 1, a and b , depicts, respectively, the commuter bus route with the minimum vehicle travel distance and the bus route with the minimum employee commuting time. The numbers in brackets along the arrows, such as (5, 10), indicate the link’s length (5 km) and the time necessary (10 min) to traverse the link. The numbers within the square brackets, such as [A, 5], at each node, indicate the number of employees (five persons) boarding the bus at a stop (A). Thus, while the length of the bus route in Figure 1a is shorter (and the monetary cost is lower), the total commuting time of all the employees is 30 min longer than that in Figure 1b. When designing commuter bus routes, not only the bus travel distance but also the employees’ travel time should be factored into the total costs. Moreover, since the value of employee time to different employers may differ, reducing the travel time of more highly valued employees is most likely to reduce the total time cost of all employees. This consideration of the differences in value to employers of employee time is thus necessary to further minimize the total commuting expenses incurred by both employers and employees.
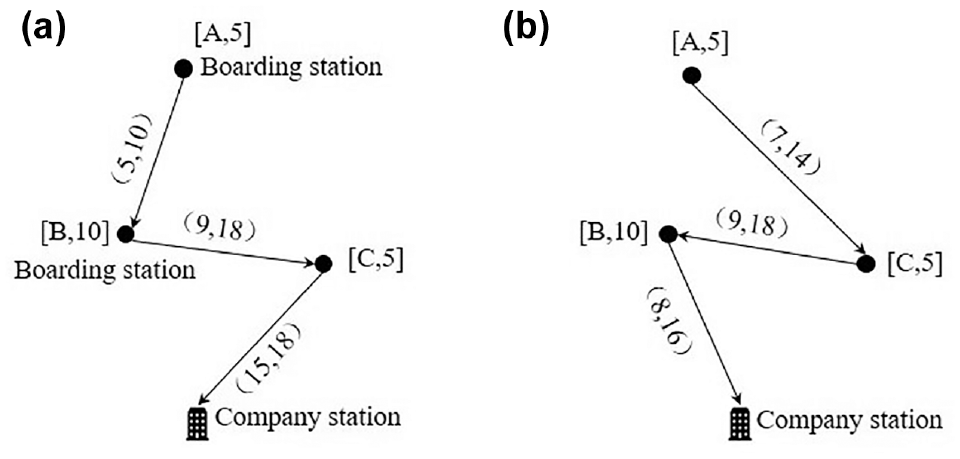
Bus routes with different minimization objectives.
While alliances may offer a potential resolution between the different optimization goals highlighted in Figure 1, it does not always benefit every suburban employer (or their employees) to join such an alliance. On the contrary, the participation of some employers in an alliance could even lead to an increase in the total commuting cost for all parties. Any examination of these alliances must determine the composition of alliance participants, namely, which employers should continue to operate a commuter bus independently, and which ones should coordinate their transportation service. In addition, it is also necessary to study the spatial distribution of employees, which may influence whether a given enterprise should participate in an alliance.
Even under an optimal alliance, it must be noted that the number of employees and the value of their time (as measured by their employer) at each stop are always different. As a result, the commuting cost savings for different employees may vary significantly. In some cases, while an alliance may reduce the total commuting expenses across the group, an individual employer’s participation may lead to an increase in the time and/or monetary costs accruing to it and its employees. Therefore, to ensure the stability of optimal alliances, it is necessary to fairly allocate operating costs based on cooperative game theory by considering both the gains and losses of participating employers and their contributions to the alliance.
This paper proposes the idea of a commuter bus alliance and optimizes the bus routes by taking into account the value of employee time and the differences in the value of that time to various employers. This study then develops a method to fairly allocate bus operating costs based on cooperative game theory to stabilize the optimal employer alliance. Finally, this paper analyzes the spatial distribution of employees’ domiciles, which affects employers’ willingness to participate in the alliance.
Literature Review
The existing publications relevant to this paper can be divided into two categories, namely, research on bus routing and research on cooperative game theory.
Bus Routing
The first major branch of bus routing literature consists of publications that have focused on the routing problem when an employer independently operates buses. Among these studies, Bektaş and Elmastaş ( 7 ) analyzed the operation of a school bus subject to its passenger capacity and distance range and built an integer programming model to solve the problem of optimizing its route. The calculation results showed that the solution method could reduce the operation costs of the bus by 28%. Sghaier et al. ( 8 ) also studied the school bus routing problem, proposed a model to minimize the network operation cost, and developed a new genetic algorithm (GA) to solve the model. Leksakul et al. ( 9 ) addressed the problem of commuter bus route planning within the context of large enterprises and explored the influences of different heuristic algorithms on reducing the operational costs of commuter buses. Zhou et al. ( 10 ) studied the problem of vehicle routing, aiming at maximizing the punctuality rate and minimizing the travel time based on the reinforcement learning model. The case study showed that the proposed algorithm was able to improve the arrival time percentage by 4.8% and the total reward value by 66.1%. Yoon and Chow ( 11 ) studied the problem of route planning and route generation under uncertain demand and proposed a sequential route generation process in which operators regularly expand route sets and receive passenger flow feedback. Using this sensor loop, a route generation method based on reinforcement learning was designed. Experimental results showed that the algorithm is better than random selection. Ren et al. ( 12 ) examined the routing problem of long-distance, high-speed commuter buses, and proposed a mathematical model to minimize the total distance traveled by buses by determining the number of commuter buses and their stops. The authors concluded that these improvements would likely increase the attractiveness of long-distance high-speed commuter buses to employees. Zhang et al. ( 13 ) studied the problem of on-demand public buses and proposed an optimization model for the design of stop spacing, minimizing the total travel time of all passengers. The case results demonstrated that various factors significantly influenced the spacing of on-demand public bus stops. These factors included passenger density, the weight ratio linked to the perception of travel time, which refers to individuals’ subjective evaluation of the duration of their travel experience, walking speed, and the time lost near or at the stop, encompassing deceleration time, acceleration time, boarding time, and buffer time. Shen et al. ( 14 ), meanwhile, proposed a customized bus route design model to allow real-time demand response, which they solved by dividing the proposed model into two stages. The results showed that the model could ensure the quality of passenger service while also reducing vehicular operating costs. Guo et al. ( 15 ) proposed a joint optimization strategy of the dynamic departure interval and vehicle combination and established a bi-level model with optimizing the total cost of passenger travel as the upper and optimized total cost of electric buses as the lower.
The second major offshoot of bus route planning includes studies related to the coordination of transportation by multiple employers and institutions. Silva et al. ( 16 ) studied the problem of school buses in rural areas and considered a multi-school, mixed load pickup model to minimize the total vehicle driving distance. They found that this approach could reduce bus driving distances by up to 20%. Lima et al. ( 17 ) also examined the problem of school bus routing in sparsely populated rural areas to minimize the number of bus vehicles and the corresponding travel distance. Their model proposed the use of mixed load and heterogeneous buses to pick up and transport students in rural areas, and their case study showed that mixed load and heterogeneous bus operation could significantly reduce operating costs. Yao et al. ( 18 ) studied the school bus routing problem with a mixed load plan (SBRP-MLP) and proposed two modes of the SBRP-MLP, namely, a SBRP-MLP with virtual stops and a SBRP-MLP with interscholastic transportation. The results showed that the proposed SBRP-MLP takes less time than the single-load plan. Moreover, the SBRP-MLP with virtual stops is more suitable for small-scale cases, while the SBRP-MLP with intercollegiate transportation is more suitable for large-scale cases. Miranda et al. ( 19 , 20 ) established a route optimization model to minimize the operation costs of school buses, allowing the same school bus to pick up and send students home simultaneously. Given a multi-school, mixed transportation scenario, Caceres et al. ( 21 ) focused on the school bus route problem concerning special education students. They established a mathematical planning model to minimize the number of vehicles and supported the use of a heterogeneous bus fleet to meet the transportation requirements for wheelchairs. Li and Chow ( 22 ) studied the problem of the mixed ride of special education and general education school bus routing and proposed a new framework for a mixed ride school bus routing system, which allowed students using wheelchairs and ordinary students to take the same school bus together. The case study showed that this method can save 14.32% of the total travel distance and 10.46% of the total travel time. Ansari et al. ( 23 ) considered the impact of students’ special needs on the school bus routing problem and aimed to minimize bus mileage. Their findings also supported the use of heterogeneous fleets and mixed load pickup to transport students with special needs to school. Chen and Zhang ( 24 ) studied the problem of shared commuter buses and proposed a model that combined the parking location problem with dynamic route optimization. They then established the shortest walking distance model to select the most appropriate parking location and used real-time traffic information to plan the vehicle travel path to minimize the vehicle’s travel time.
Actually, the value of time is a concept that has been widely discussed in the context of transit operation problems, for example, Jing et al. ( 25 ) presented a bi-level transit fare equilibrium model for a deregulated transit system. They proposed a logit-type model to capture passenger preferences for different public transport lines, taking into account factors such as fares and travel times (including in-vehicle time and waiting times). Fan and Machemehl ( 26 ) used GAs to study the problem of optimal bus route network design with variable transit demand accounting for multiple factors influencing the total cost experienced by users, such as walking time, waiting time, and in-vehicle time, as well as costs associated with bus operations and unsatisfied demand. These studies highlighted the importance of considering the value of in-vehicle time; however, they do not take into account differences in the value of employees’ time. In addition, although these papers have considered cases in which some employers and institutions operate commuter buses cooperatively, very little attention has so far been paid to which employers and institutions are suitable members of a commuter bus alliance and which are not.
Cooperative Game Theory
The problem of cooperative game theory has gradually attracted increasing attention, and how to divide the joint value derived from collaborating has been studied in traditional cooperative game theory. Given the collective outcome, various available research regards the profit sharing or cost allocation rule for sustainable partnership ( 27 ).
Firstly, the nucleolus is another way to allocate cooperative benefits by minimizing dissatisfaction in all possible coalitions. For example, Saad et al. ( 28 ) studied the impact of the trade-off between the benefits of the primary user with respect to probability and the cost of false alarm probability on the topology and the dynamics of a communication network of secondary users that seeks to reduce interference on the primary user through collaborative sensing, and proposed distributed collaboration strategies through coalitional games. Through simulations, this study compared the performance of the proposed distributed solution with respect to an optimal centralized solution that minimizes the average missing probability per secondary users. According to Shi ( 29 ), the solution process of the nucleolus method involves calculating the excess of each subset within the alliance and comparing profit distributions to identify the least unsatisfactory solution. This process is complex in nature. Furthermore, the nucleolus method aims to find feasible solutions that minimize dissatisfaction, but there may exist multiple such solutions, rendering the solution process difficult. In addition, the nucleus method does not prioritize the idea of “distribution according to contribution,” but rather focuses on minimizing dissatisfaction ( 29 ).
Secondly, the τ-value ( 30 ), as an allocation value satisfying the principles of rational behavior and rationality, is a scheme formed by the players’ decision-making between the upper and lower bounds of expected distributions. Casas-Méndez et al. ( 31 ) studied the properties of the coalitional τ-value and provided an axiomatic characterization of it. Then they used the coalitional τ-value to study bankruptcy problems and the determination of aircraft landing fees. Zhang et al. ( 32 ) studied value concepts for cooperative games with a communication structure represented by a graph. Their study also involved an analysis of the equitable distribution of the surplus solution using the τ-value method. The results of this case showed that the fair distribution of the surplus solution will distribute more surplus to larger alliances, while the τ-value benefits the vulnerable groups. Nonetheless, the τ-value has garnered comparatively less attention than alternative approaches, such as the Shapley value and the nucleolus. This is primarily because of the τ-value’s reliance on player-specific characteristic functions, which can be intricate and less intuitively definable. Furthermore, the τ-value lacks certain favorable properties. For instance, it does not ensure efficiency, signifying that the cumulative τ-values of individual players might not align with the overall value of the grand coalition. This deficiency of desirable properties can diminish the attractiveness of the τ-value in allocation problems that prioritize equity and specific axiomatic principles. Furthermore, the computational process of determining the τ-value can be more resource-intensive compared to calculating the Shapley value. The τ-value necessitates the assessment of all conceivable coalitions, a task that can be time-consuming and infeasible for games involving a substantial number of participants or a myriad of potential coalitions. The computational intricacies tied to the τ-value might restrict its applicability and acceptance in scenarios where efficient computation holds paramount importance.
Thirdly, the Banzhaf value is another important single value solution in game theory, in which the total payoff obtained for the players is the sum of all marginal contributions of every player normalized by 2n−1 ( 33 ). Alonso-Meijide and Fiestras-Janeiro ( 34 ) introduced a new coalitional value in the context of transferable utility games with an a priori system of unions, which it is called the symmetric coalitional Banzhaf value. This value satisfies the property of symmetry in the quotient game, the quotient game property, and it is a coalitional value of Banzhaf. Wang et al. ( 35 ) studied the profit distribution of wind power, thermal power, and electric vehicles in the power market, built the optimal dispatching model under the three-party alliance, two-party alliance, and non-alliance modes, and used cost distribution methods such as the Shapley value method and Banzhaf value to distribute the profit of the three-party alliance. The case results showed that the three-party joint model can promote the consumption and development of wind power. Liang and Li ( 36 ) studied the solution of the Banzhaf value, and proved that the Banzhaf value is a monotonic and non-decreasing function of coalitions’ payoffs under weaker coalition monotonicity-like conditions. A numerical example is given to illustrate the effectiveness of the solution method. The Banzhaf value derives from the theoretical construct of victorious or defeated coalitions, encompassing a player’s capacity to exert influence over game results. This methodology quantifies a player’s significance with respect to their potential to sway outcomes through participation in or withdrawal from distinct coalitions.
In addition, Shapley ( 27 , 37 ) proposed the Shapley value cost allocation method as a fair and reasonable approach to the coalition cost allocation method by calculating the marginal contribution, and the Shapley value is the most frequently used solution. Besozzi et al. ( 38 ) examined the appropriate cost allocation of the cooperative operation of tourist buses, and used the Shapley value method to fairly determine the cost of each bus to each stop. Yang et al. ( 39 ) and Ye et al. ( 40 ) similarly used the Shapley value method to allocate the distribution of costs to each company engaged in the cooperative delivery of supplies to logistics enterprises. To achieve economies of scale, Zheng et al. ( 41 ) and Guo et al. ( 42 ) studied the cost allocation problem of container shipping alliances, and applied the Shapley value method in response. Gao et al. ( 43 ) and Zheng et al. ( 44 ) further applied the Shapley value method to solve the cost allocation problems of supply chain alliances. This diverse and far-ranging body of research testifies to the applicability of the Shapley value method in solving a wide variety of cost allocation problems. The Shapley value method has garnered significant attention from game theorists ( 45 ). The method is based on assessing the marginal benefits brought by individual participants in an alliance when sharing costs. Its solution provides a more equitable and comprehensive calculation formula, resulting in a unique and stable profit sharing ratio among players in cooperative decision-making structures ( 46 ). Consequently, the Shapley value method is chosen in this study to allocate the monetary cost of the commuter alliance.
Contributions
Based on this survey of the available literature, the contributions of this study can be summarized in the following manner. Firstly, to alleviate the problems of high operating costs for suburban employers and the long commuting times of urban employees, we propose the operation of commuter buses by an alliance of employers. Secondly, we consider the time cost to employees and the differing values assigned by employers to their employees’ time when optimizing the commuter bus route. As part of this process, we also verify the necessity of considering the differences in time values via sensitivity analysis. Thirdly, to ensure the stability of any alliance under the cooperative game, we compare different methods for profit sharing or cost allocation rules for a sustainable partnership and adopt the Shapley value method to allocate the operating costs between the participating employers fairly according to the marginal contribution. Fourthly, we analyze the impact of the spatial distribution of bus stops on the employer’s decision to participate in an alliance or to continue independently operating its commuter buses.
Methodology
Problem Description
The decision-making process with respect to a commuter bus alliance operated by multiple employers includes alliance participant composition optimization (APCO), commuter bus route optimization (CBRO), and bus operating cost allocation (BOCA).
The APCO is necessary to determine which employers will benefit from participating in the alliance and which ones should continue to operate their own commuter bus independently. This element of the approach aims to minimize the commuting expenses of all employers and employees. These commuting expenses include the time cost to employees and the vehicle operating costs to the employers. The composition of the alliance, which is the output of the APCO, determines the number of stops and the total number of employees boarding at each stop. These numbers constitute the inputs for the CBRO.
The CBRO determines the number of alliance buses and their routes, intending to minimize the commuting expenses (the time and operating costs) incurred by the employers and their employees in the alliance. This layer of the model considers both the cost of the time to all employees on commuter buses and the differences in the value of their time. The primary output of the CBRO, namely, the commuting expenses information, supplies further information to the APCO portion of the model, which continues to determine whether an employer should participate in the alliance by analyzing the total commuting expenses of employers and employees.
The optimization of commuter bus operation via APCO and CBRO is thus a leader–follower, bi-level, decision-making problem in which the APCO and CBRO comprise the upper model (UM) and lower model (LM), respectively. Through the mutual feedback of the UM and LM, the optimal operation scheme (that is, the optimal composition of the alliance and the commuter bus routes) can be determined.
Finally, to maintain the stability of the alliance, it is necessary to allocate bus operating costs fairly across all members (BOCA) based on cooperative game theory. In this paper, the BOCA is developed based on an understanding of the benefits gained by employers and their overall contribution to the functioning of the alliance. In this case, based on the comparison of different methods in the Cooperative Game Theory section, the Shapley value cost allocation method is the most proper method in this paper and the particulars of this analysis will be discussed further in the Analysis of the Allocated Costs section.
Sets and Variables
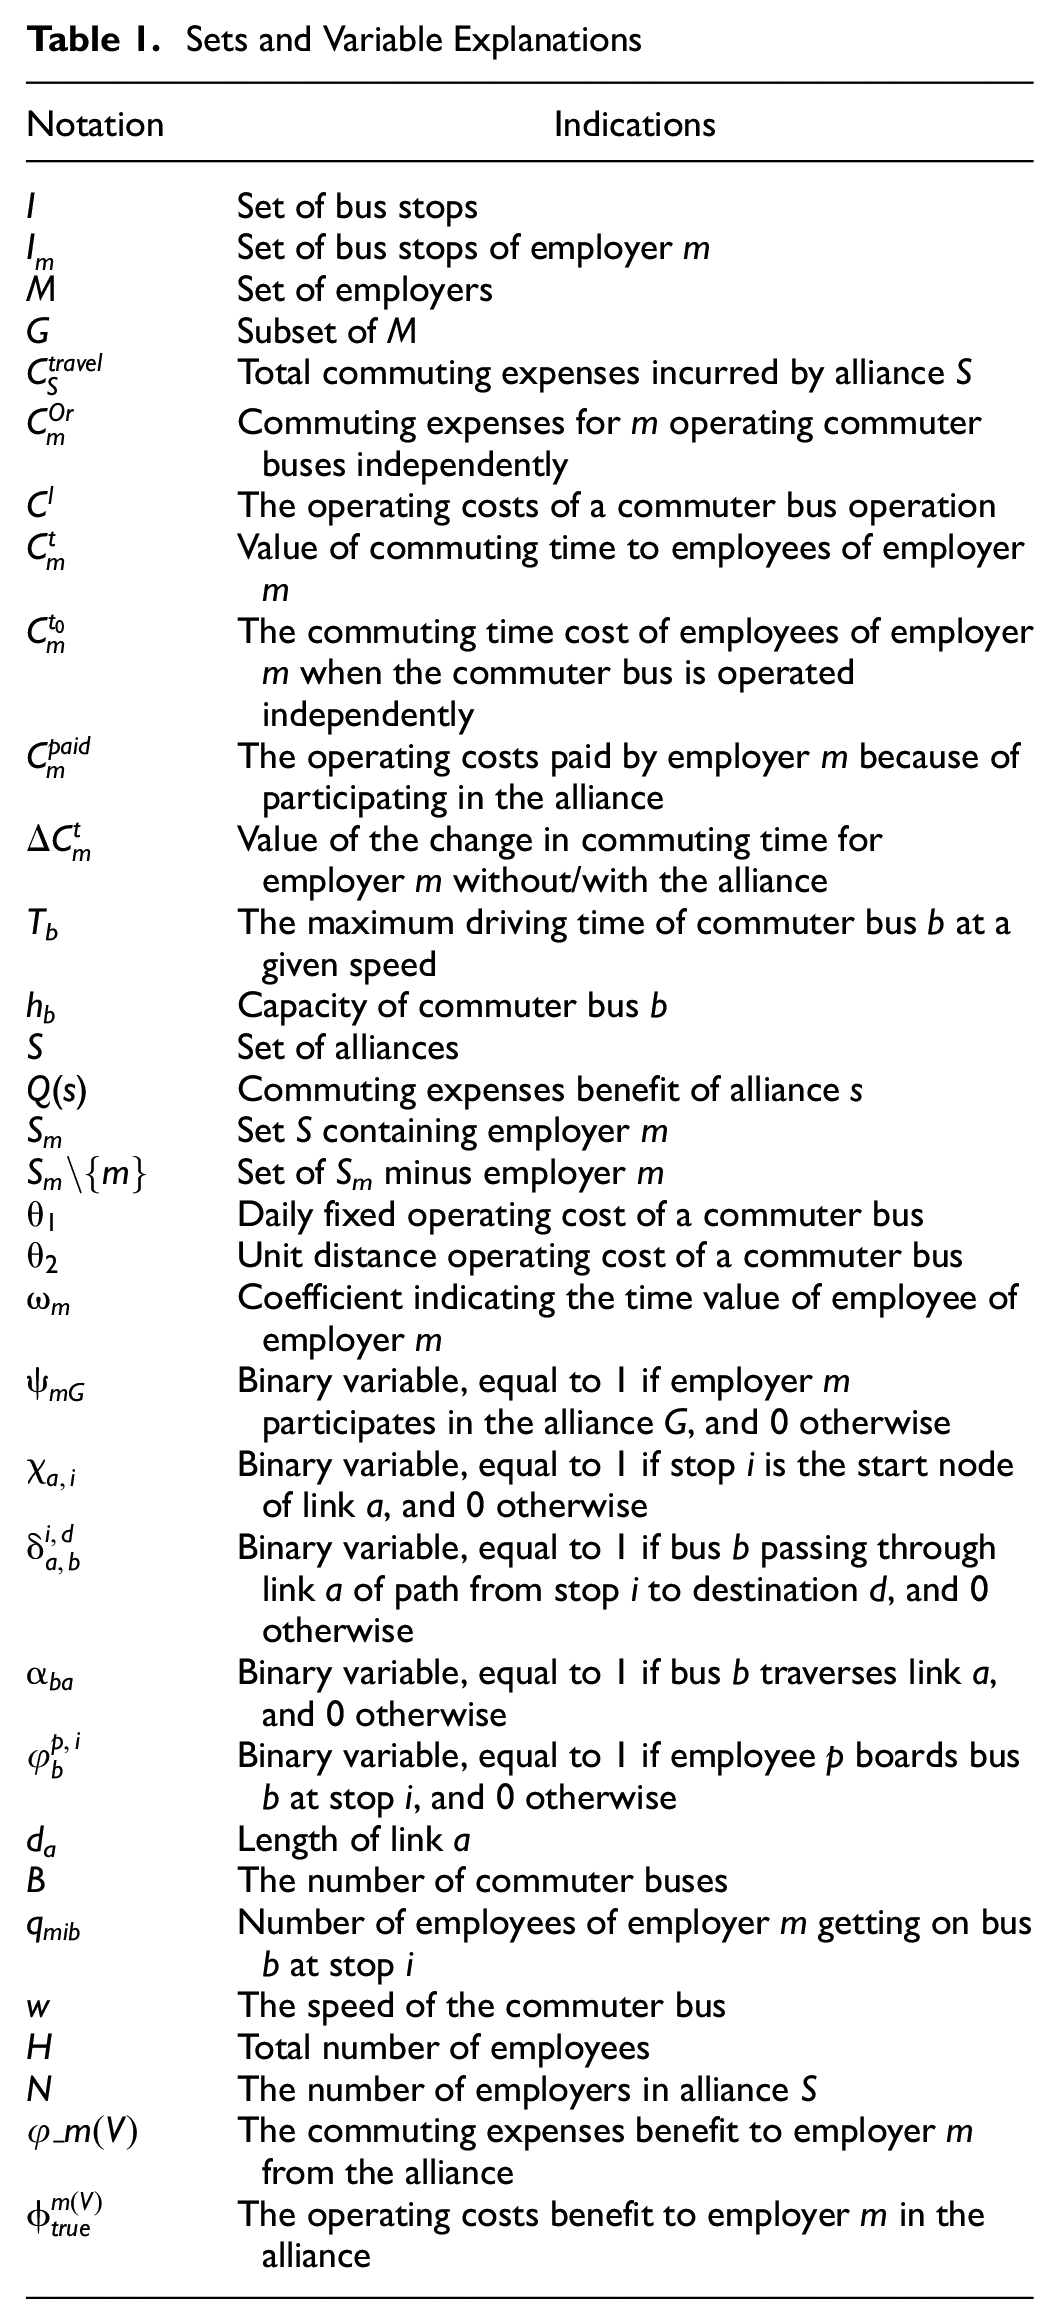
Sets and variables in the model are introduced in Table 1.
Sets and Variable Explanations
Model Structure
Model to Optimize the Alliance Composition
A model to optimize the composition of alliance participants (APCO) to minimize commuting expenses is shown in Equation 1:
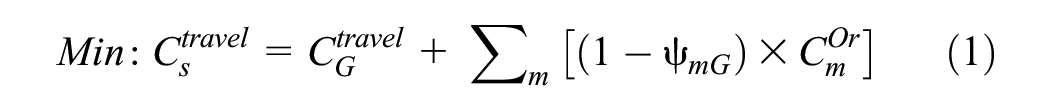
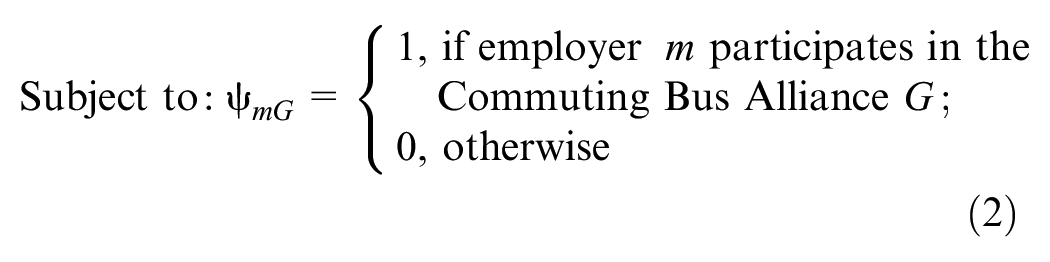
As shown in Equation 2, the decision variable is binary, as each employer chooses whether or not to participate in the alliance.
Commuter Bus Route Optimization Model
The objective function of the commuter bus route optimization model (CBROM) can be written as shown below in Equation 3:

where

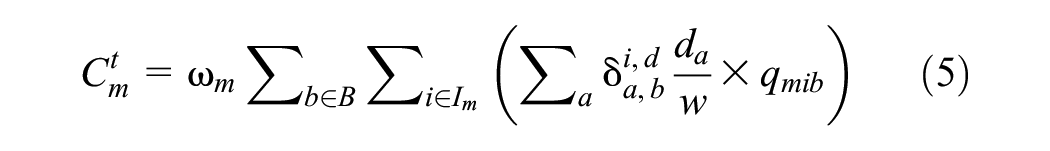
The constraints of the CBROM are shown in Equations 6–14:


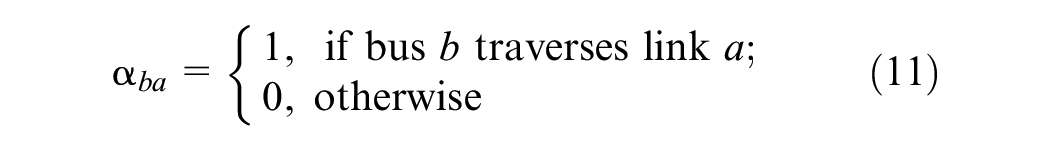
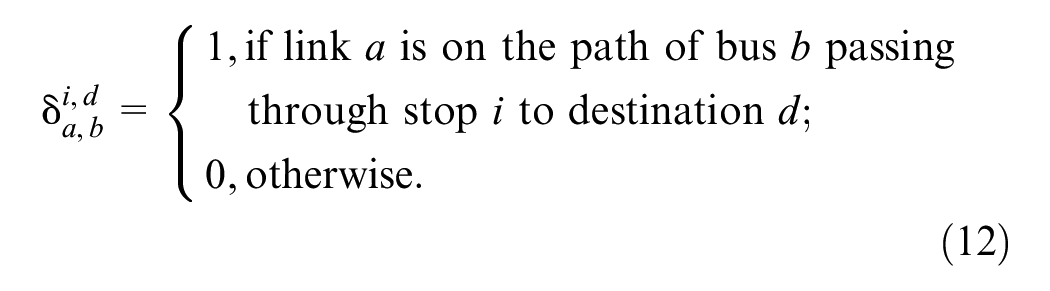
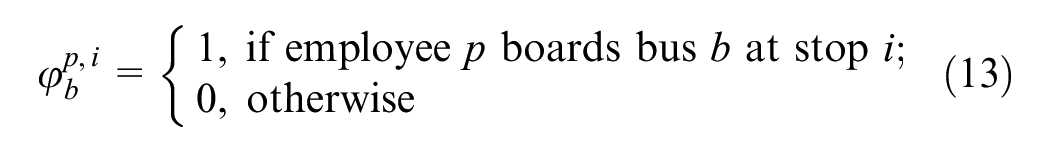
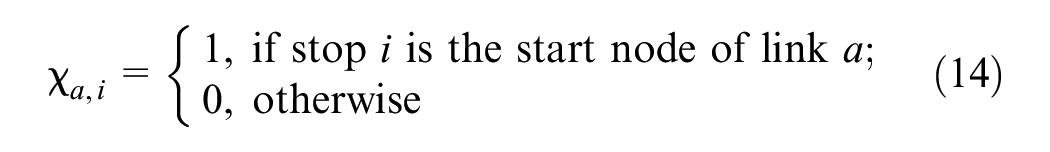
where Equation 6 expresses the passenger capacity constraint of a given bus. Equation 7 is the seat capacity constraint of all commuter buses. Equation 8 indicates that every stop is guaranteed to have at least one commuter bus available for service, while Equation 9 specifies that an employee can be served only by one bus. Equation 10 provides the running time constraint of a given commuter bus per day. Equations 11–14 are binary variables.
Method for Bus Operating Cost Allocation
To address the problem of BOCA, a model is developed utilizing the Shapley value method. Here, we assume that for any employer m, only when the expense of
The difference between the total incurred commuting expenses in scenarios with and without an alliance is taken as the benefit produced by the alliance. This model is expressed below in Equation 15:

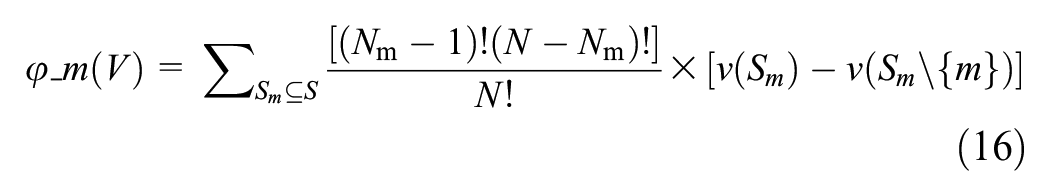
Given the marginal contributions of participants, the benefits of the alliance can then be determined via Equation 16:
To allocate the expenses among the participants based on the beneficiary-pay rule, the difference in the value of employee time should be first calculated using Equation 17. The savings in operating costs to each participant can then be calculated by Equation 18. Finally, Equation 19 can be used to calculate the operating costs that should be allocated to employers in the alliance:


Algorithm Design
The model proposed in this paper can be classified as a leader–follower problem, which naturally lends itself to a bi-level programming formulation, namely an NP-hard (non-deterministic polynomial-hard) problem. Given the non-convex nature of the problem, direct solution attainment becomes challenging. Therefore, an iterative computation between the UM and LM is necessary for obtaining a solution. In cases where the number of feasible solutions of the UM is relatively small, we initially examine all viable solutions, particularly the feasible alliance structures, and compute their respective objective function values to achieve an accurate solution of the UM. However, when the number of viable solutions in the UM becomes large, previous studies ( 47 – 49 ) have demonstrated the effectiveness of GAs in tackling bi-level models. Therefore, we consider the utilization of the GA as a suitable methodology for addressing the model within the context of the study case characterized by a considerable number of feasible UM solutions.
With respect to the LM, when optimizing the operational routes of commuter buses under different alliance structures provided by the UM, we take into account the value of employees' time and the variation in time value among different employers. Consequently, the cost associated with traversing each link is no longer determined solely by its length, but also by the number of employees from each employer on the bus vehicles when the commuter bus travels through the link, as well as the time value attributed to employees from each employer. This makes conventional routing algorithms, such as the ant colony algorithm, unsuitable. Therefore, a GA is employed to solve the LM, where a chromosome represents a set of commuter bus operational schemes. The solution steps using a real number encoded GA are as follows.
Step 1: Determine the number of stops along these commuter bus routes and the number of employees boarding at each stop based on the alliance structure given by the UM.
Step 2: Generate N initial solutions randomly based on the commuting requirements derived from Step 1, with each solution representing a set of commuter bus operational schemes.
Step 3: Performing selection, crossover, and mutation operations. Moreover, individuals with the highest fitness values under mixed loading operational schemes are also selected and retained (that is, a commuter bus passes through two or more employers’ stops).
Step 4: Judge whether to terminate the calculation. If “Yes,” output the number of commuter buses and the optimal travel routes for the buses. Otherwise, return to Step 3.
Case Study
Data Sources
For the case study, this paper selects employers A, B, and C in Meishan District (Ningbo, China) for analysis. In the absence of an alliance, the three employers operate a total of 146 bus stops, and the number of employees taking the buses provided by each employer is 283, 37, and 511, respectively. The locations of the three employers (ID 0) and their employees’ bus stops (ID 1–146) are shown in Figure 2. Indeed, there are shared or closely situated bus stops that are utilized by employees from diverse employers residing within a shared community. These stops are identified as Stops 42, 49, 83, and 127 in this study. In response to this situation, our approach entails pooling the demand originating from these stops into adjacent stops.
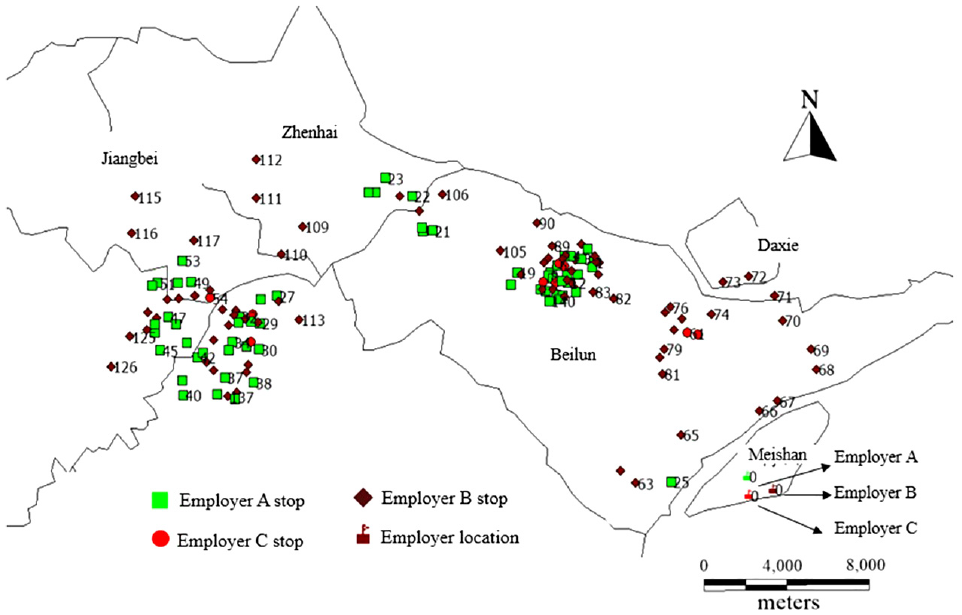
Sites of the three employers and their employees’ bus stops.
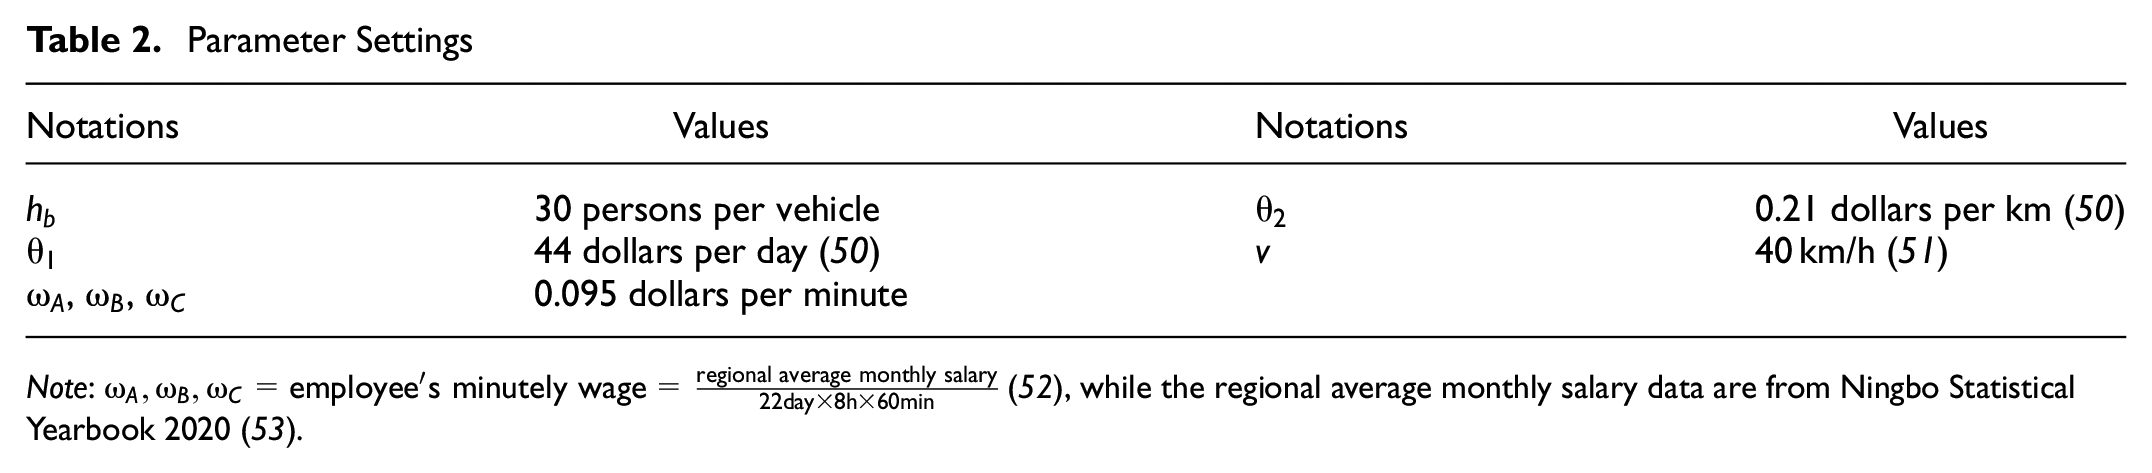
For the sake of model calculation, the values of the parameters in the model are given in Table 2.
Parameter Settings
Results Analysis
The results and analysis of the solutions are explained in the following sections.
Composition of the Alliance
In Table 3, notations A, B, and C indicate that each of the three employers operates commuter buses independently. The notations with brackets indicate various permutations of alliances, such that “{A, B}, C” means that A and B jointly operate their buses, while C operates independently. From Table 3, it is clear that the total daily commuting expenses are lowest under an alliance composition of {A, B, C}. This alliance composition would thus be the likeliest outcome.
Daily Costs of Commuter Buses Under Different Alliance Compositions
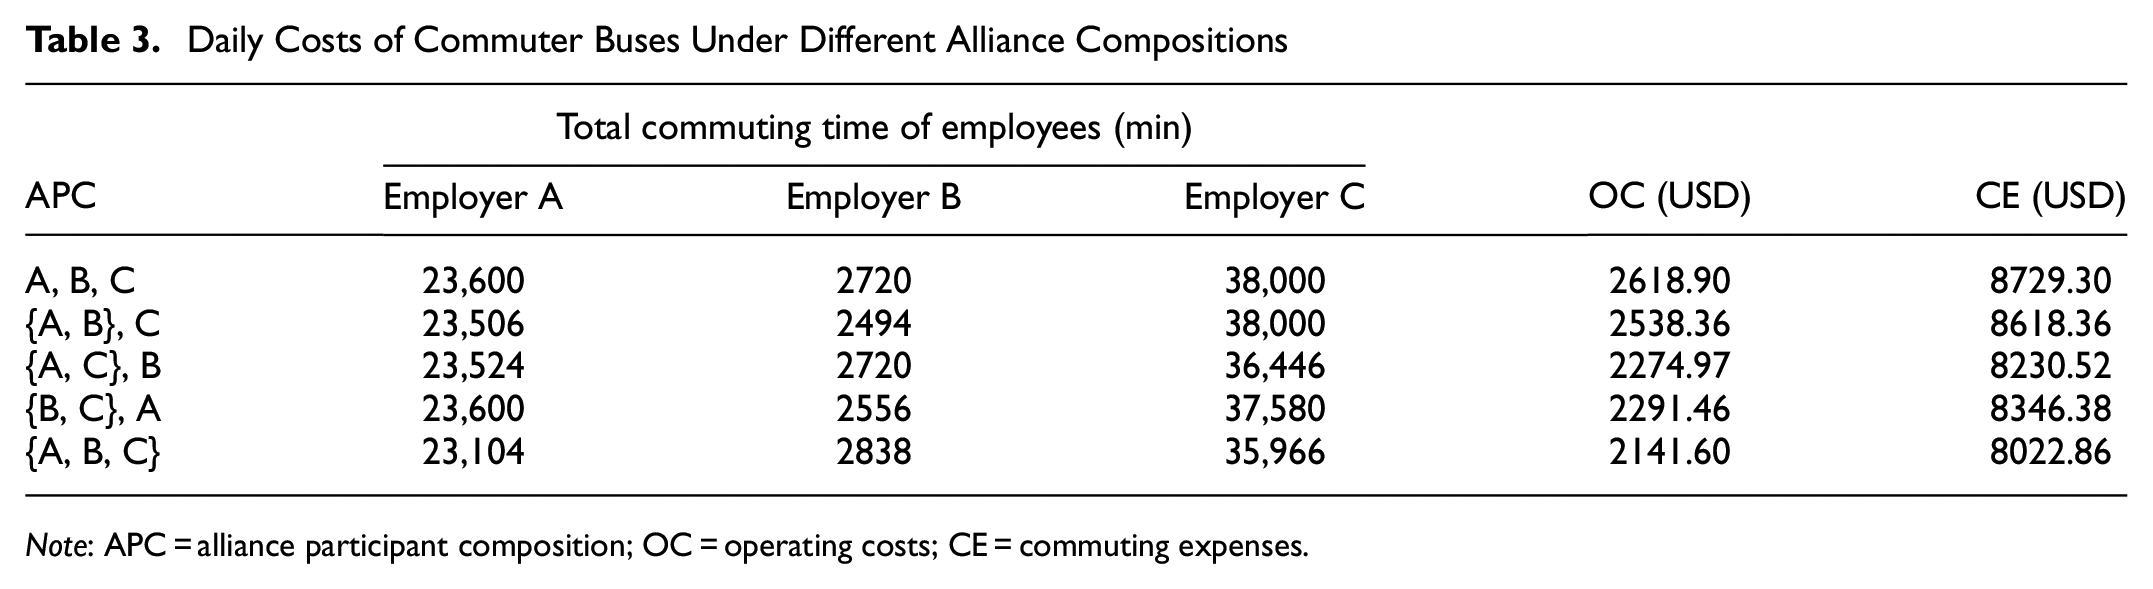
Note: APC = alliance participant composition; OC = operating costs; CE = commuting expenses.
A further comparison of the expenses of the independent A, B, C scenario and the alliance of {A, B, C} in Table 3 demonstrates that the total commuting expenses corresponding to the alliance are lower by 706.44 USD, a decrease of 8.09%. The total in-vehicle commute time of all employees also decreases by 2412 min, a decrease of 3.75%. Furthermore, the operating costs to the employers declined by 477.3 USD, a decrease of 18.23%.
Commuter Bus Route Analysis
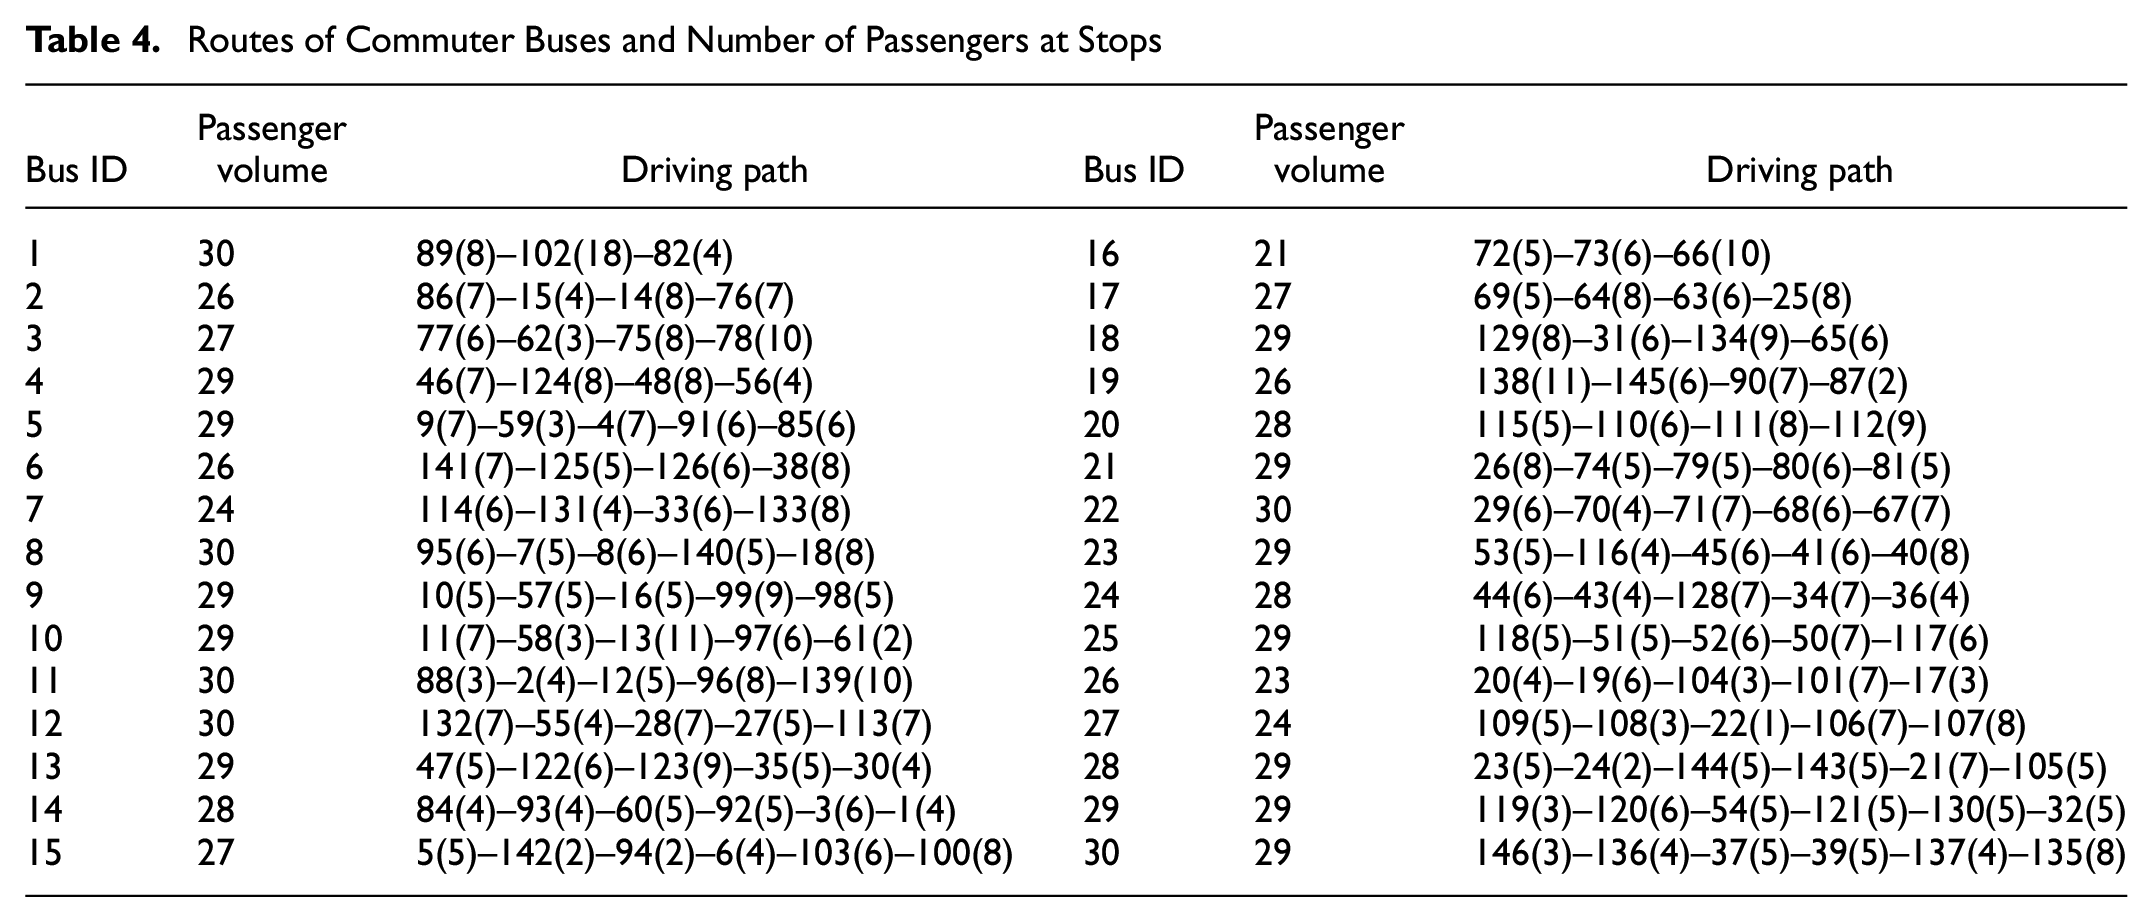
Under the optimal alliance composition of {A, B, C}, 30 buses are necessary, and their routes are shown in Table 4. The driving route 89(8)–102(18)–82(4) for Bus 1 indicates that, on the way to the work sites in the suburbs, 8, 18, and 4 employees will board Bus 1 at stops 89, 102, and 82, respectively, and then arrive at the employers in the suburb. At the end of the day, the commuter bus will pick up employees from each employer and then deliver them, in reverse order, to Stops 82, 102, and 89. In comparison to the case in which each employer operates its commuter buses, participation in the alliance reduces the daily total bus travel distance by 863.32 km, which is equivalent to 28.77 km per bus per day.
Routes of Commuter Buses and Number of Passengers at Stops
To briefly verify the necessity of considering the difference in the value of employees’ time when planning bus routes, we have optimized the bus routes for the alliance {A, B, C} only in regard to operating costs, but not employees’ time. The results show that the operating costs are 1936.59 USD, the employees’ daily total commuting time is 66,948 min, and the total commuting expenses to employers and employees are 8296.65 USD. Compared with the case in which we consider the differences in the value of employees’ time, in this scenario, the employees’ daily total commuting time actually increases by 5040 min. This in turn produces a 3.73% increase in the total commuting expenses incurred under the optimal alliance of {A, B, C}. Thus, taking into account the time cost of employees’ commuting trips is necessary to take full advantage of the reductions in total commuting expenses offered by our model.
Analysis of the Allocated Costs
From Table 3, in contrast to the case of independent operation, under the {A, B, C} alliance, the commuting time of employees from employers A and C decreases by 2.1% and 5.35%, respectively. Conversely, the commuting time of employees from employer B increases by 4.34%. If employer B is not adequately compensated for the increase in their employees’ commuting time, it is likely that employer B will not participate in the alliance.
Given the necessity of properly allocating the operating costs based on cooperative game theory, we adopt the Shapley value method and tabulate the amounts allocated to each employer in Figure 3. Under the alliance, the operating costs of all three employers are reduced, respectively, by 19%, 78%, and 10%. In this case, although the commuting time of employer B’s employees increases, this loss can be completely compensated for by the relatively steep reduction in employer B’s bus operation cost. The fair allocation method thus helps to verify the stability of the desired alliance composition, as employers A and C bear more of the operational costs, while employer B absorbs the increased cost in time.
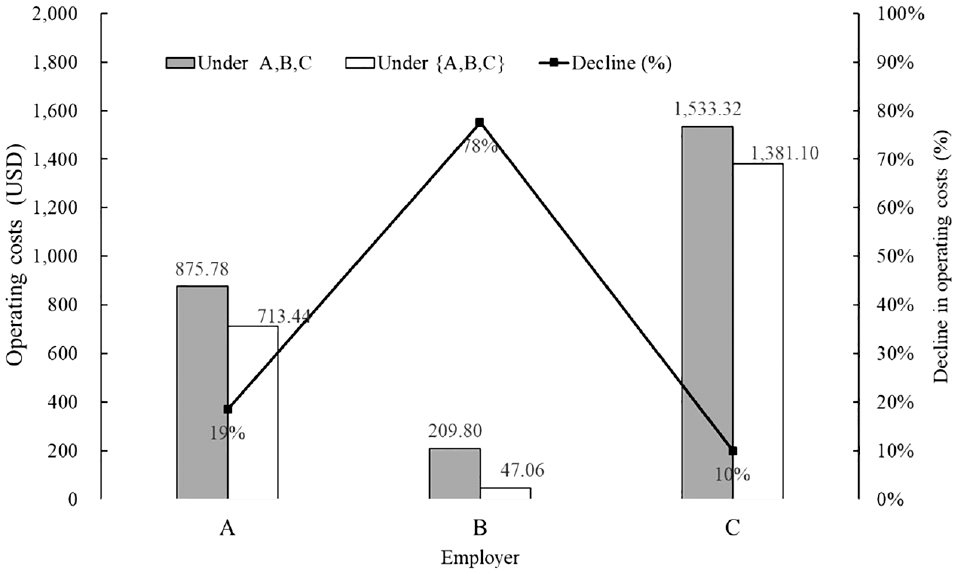
The operating costs allocated to each employer with and without an alliance.
Sensitivity Analysis of the Value of Time
Intuitively, the time value of the employees to different employers varies. In this section, we conduct a sensitivity analysis of the differences in time value to continue optimizing the operation of commuter buses as members of the alliance. For the sensitivity analysis, the values of the time of employees of employers A and C are assumed unchanged, but that of employees of employer B are set at 1.5, 2, 2.5, and 3 times their original value. The results of the analysis are illustrated in Figures 4 and 5. As Figure 4 demonstrates, the total commuting time of the employees of employer B decreases as the increment of their time’s value and the allocated expense also increases. This indicates that, if an employer in the alliance wishes to shorten its employees’ commuting time through an adjustment of the commuter bus operation scheme, they will be allocated a larger share of the operating costs to compensate for the increased time cost to other employers’ employees. From Figure 5, as
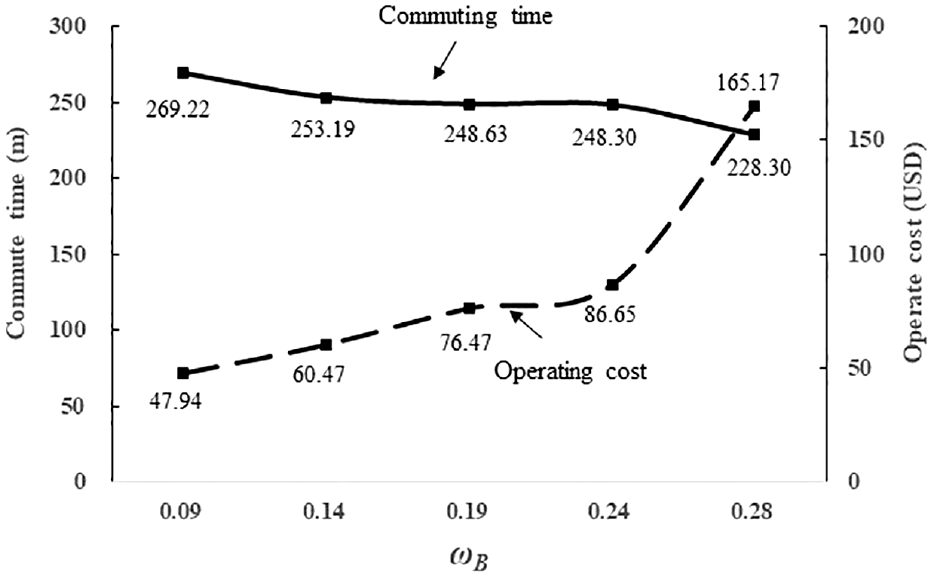
Commuting time and operating cost to employer B under different values of
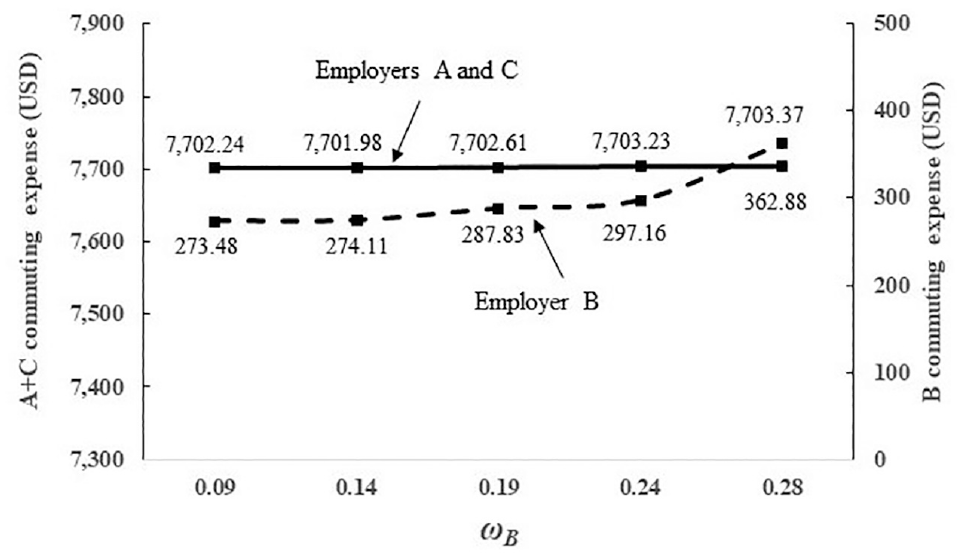
Commuting expenses under different values of
In addition, when the employees’ commute time value coefficients (
The presented case of three employers serves as evidence supporting the notion that the formation of commuter bus alliances can be a valuable and efficient strategy in certain circumstances. Nonetheless, inefficiency could occur with certain employers sometimes.
Analysis of Factors That Affect the Composition of the Alliance
To further verity the necessary of studying the alliance composition and explore the factors that contribute to the efficiencies of participating in a commuter bus alliance with certain employers, we introduce an additional employer (employer D) located near to the initial three employers and assume that employer D has 59 employees. The distribution of the bus stops for employer D can be described by a standard deviation ellipse. The larger the area of the ellipse, the higher the dispersion degree of the stops.
Firstly, to study the influence of the dispersion degree of bus stops on employer D’s decision with respect to alliance participation, we set up four employer D scenarios with different stop dispersion based on the size of the ellipse. The location of the employee sites of employer D under scenarios D1–D4 and their standard deviation ellipses are shown in Figure 6.
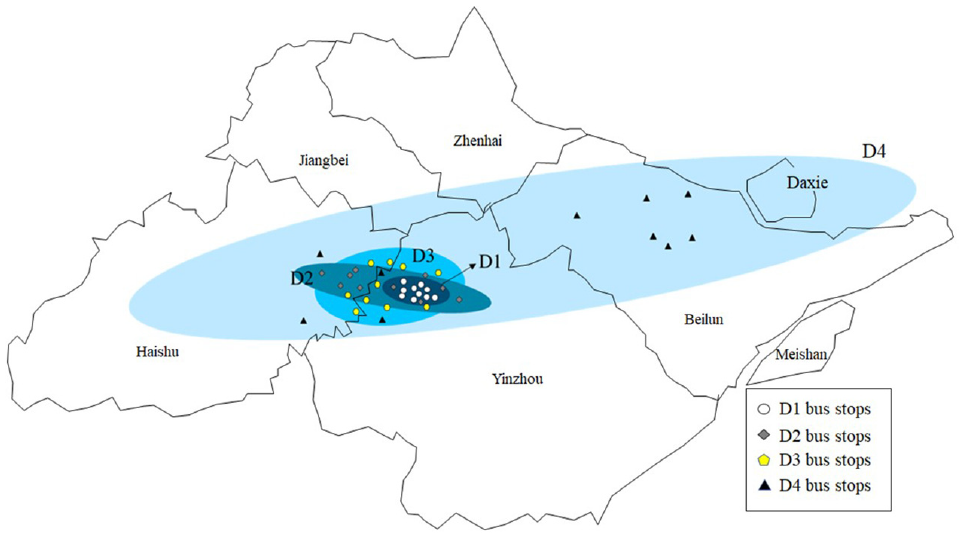
Four distribution ellipses of employee bus stops for employer D.
Figure 7 tabulates the calculations of the commuting expenses for each of the above four scenarios. The figure illustrates the total commuting expenses for all four employers under two scenarios: employer D participating in the alliance or not (i.e., the alliance of {A, B, C, D} and the alliance of {A, B, C}+D). The expenses of the alliance {A, B, C, D} encompass the generalized cost incurred when the operating routes of {A, B, C, D} differ from those of {A, B, C}+D. In other words, it implies that at least one commuting bus of {A, B, C, D} traverses both the stops of {A, B, C} and the stops of employer D.
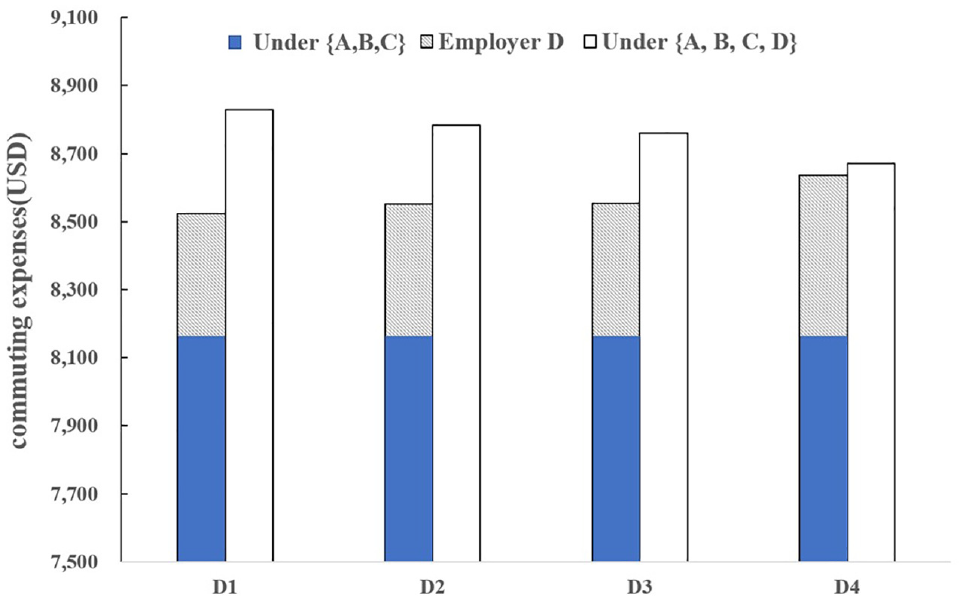
Total commuting expenses in the case of employer D participating in the alliance.
According to Figure 7, it can be seen that the commuting expenses incurred by the alliance of {A, B, C, D} are higher than under the alliance of {A, B, C}, D, which indicates that when participating in a commuter bus alliance inefficiency could occur with certain employers sometimes and verifies the necessary of optimizing the alliance composition, discussed in the Model to Optimize the Alliance Composition section. However, it can also been seen that as the ellipse size increases from D1 to D4 (i.e., the bus stops become more scattered), the gap between the total commuting expenses narrows. This illustrates that the dispersion degree of an employer’s bus stops is a key factor that affects alliance participation. As the dispersion degree increases, employer D is more likely to participate in a proposed commuter bus alliance. This is because that as the density of stops for employer D increases, there is a greater likelihood of having stops for employer D near to the stops of the alliance {A, B, C}, and in some cases, even within the stops of the alliance {A, B, C}. This creates a higher probability for employer D to join the alliance, as it enables the reduction of the overall commuting expenses for all four employers. In addition, there is an increase in the commuting expenses of employer D when operating independently from scenario D1 to scenario D4. This indicates that there exists an inverse relationship between the density of employer stops and the operating cost of the bus service. In other words, as the density of stops of an employer increases, the operating cost of the bus service tends to decrease.
To conduct a more comprehensive exploration of additional determinants influencing employer participation in the commuter bus alliance, we intend to introduce three supplementary scenarios based on the foundation of scenario D4. This involves incrementally increasing the number of employee stops of employer D. In these scenarios, the total number of employees of employer D remains equal to 59, but these employees are randomly assigned to 10, 15, and 20 bus stops within the D4 ellipse. The number of employees at each stop gradually decreases as the number of stops increases. The commuting expenses under the alliances {A, B, C}, D and {A, B, C, D} for each of the three scenarios are shown in Figure 8.
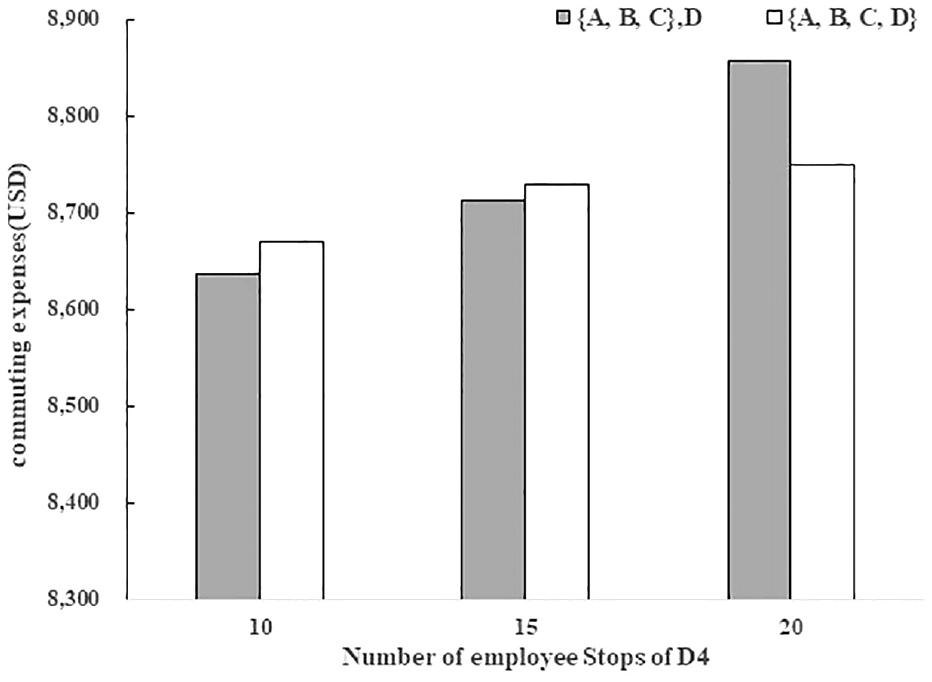
Commuting expenses in three different scenarios.
In Figure 8, as the number of employer D’s bus stops increases from 10 to 15, the disadvantage to employer D of participating in the alliance gets smaller. When there are 20 stops, the total commuting expenses incurred by the four employers and their employees under an alliance of {A, B, C, D} is lower than the total under the alliance of {A, B, C}, D. This also indicates that the more stops in an employer service (which implies that each stop serves fewer employees), the greater the likelihood that they choose to participate in the alliance.
Based on the observations from Figures 7 and 8, it can be inferred that, under the condition of a consistent number of employees for an employer, a narrower dispersion range and a reduced number of stops would diminish the likelihood of the employer engaging in a proposed commuter bus alliance. Nevertheless, the locations of these stops of the scenarios in Figures 7 and 8 might introduce confounding variables that could affect the reliability of the aforementioned conclusion. Consequently, to further corroborate the aforementioned deduction and alleviate the influence of random stop locations, an additional set of eight scenarios has been established. Specifically, we construct a standard deviation ellipse encompassing 10 bus stops for employer D and assume that the size of the ellipse with 10 stops remains unchanged, but that it may be located at several sites within the distribution ellipse for {A, B, C}. The various placements of this ellipse are depicted as sites D5–D12 in Figure 9. By solving the proposed model for scenarios D5–D12, we can calculate the total commuting expenses both with and without employer D’s participation in the alliance. The results of these calculations are outlined in Figure 10.
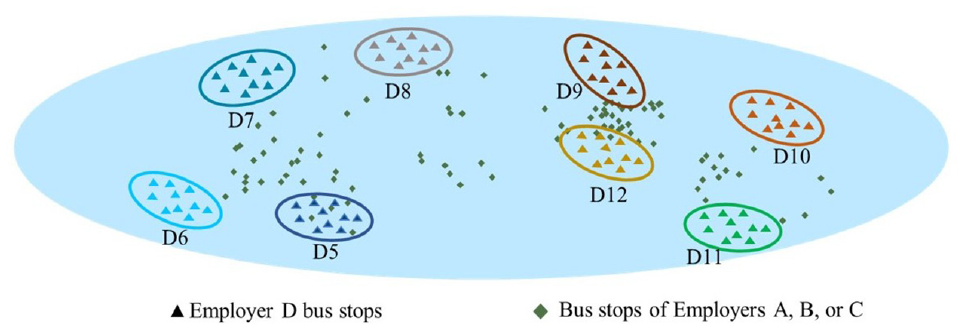
Different locations of employer D’s bus stops.
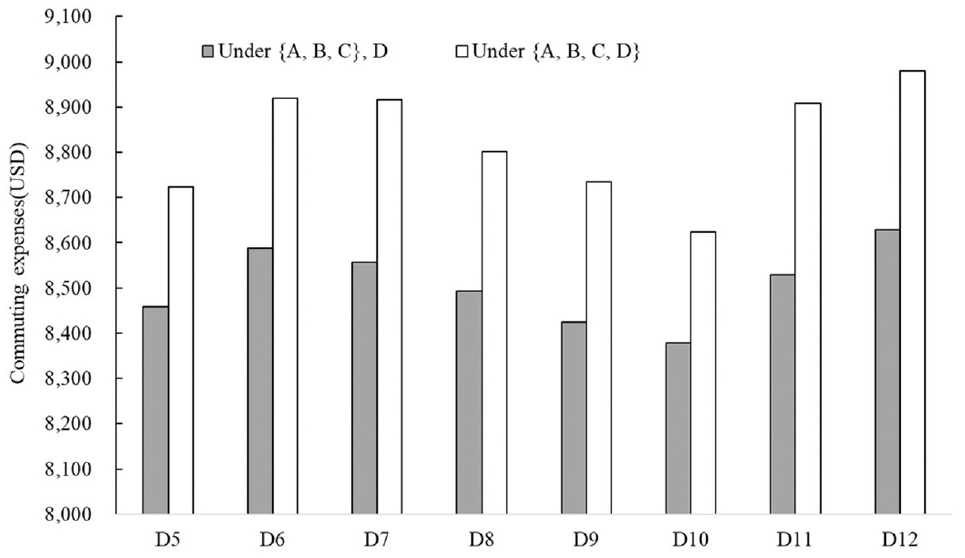
Total commuting expenses for different alliances under different location scenarios.
From Figure 10 it is clear that, for all scenarios D5–D12, the commuting expenses under the alliance of {A, B, C, D} are higher. This indicates that when the ellipse size and the number of bus stops necessary for an employer are both small (i.e., the bus stops are located near each other), it is always better for the employer to operate its commuter buses. Significantly, this holds no matter where the stops of the employer are located.
One further tantalizing suggestion from Figure 10 is that the employees’ location relationship between the bus stops of employer D and the employees’ bus stops of the existing alliance {A, B, C} or the distance between the two kinds of bus stops may also be a key factor affecting an employer’s participation in the alliance. In Figure 10, the gap in commuting expenses when employer D participates or does not participate in the alliance across scenarios D5–D12 is not equivalent. This fluctuation suggests the possibility of some influence from employee location, although the specific rules of such an effect have not yet been fully investigated. Such an investigation is likely to be an important research direction in the future development of this model.
Conclusion
This paper proposes a commuter bus alliance to address the problem of long-distance commuting by employees who work in remote areas. This study then proposes a method to optimize the operation scheme of jointly operated commuter buses to remote areas by multiple employers. Using the Shapley value method, this paper finally allocates the operating costs of the commuter bus operation to ensure the long-term stability of the alliance.
To verify the practicability of such an alliance and the reasonability of the proposed model, this paper takes the commuter buses of three employers in the Meishan District of Ningbo City as an example for empirical analysis. The results show that, firstly, compared with the independent operation of commuter buses, an alliance can significantly reduce the buses’ travel distance in urban areas, which in turn reduces total commuting expenses by 8.09%. Secondly, these findings demonstrate that a consideration of the difference in the value of employee time to different employers in the alliance is essential for further optimizing bus routes and reducing commuting expenses. Thirdly, the results demonstrate the equitability of the Shapley value method in solving the cost allocation problem within the commuter bus alliance. Finally, a comparative analysis of the commuting expenses of the system under participation and non-participation in the alliance, and under different spatial distributions of employees, reveals that an employer is less likely to participate in the alliance when its bus stops are distributed relatively densely and when the number of employees boarding at each stop is relatively high. Conversely, as the dispersion degree of stops increases while the number of employees served at a given stop decreases, a suburban employer’s likelihood of participating in a bus alliance rises significantly.
The proposed commuter bus alliance and the optimization model developed in this paper thus provide a potential method for alleviating the problems of high commuting costs and long commuting times for employers in remote areas. The model also provides a foundation for employer decision-making as they choose whether to participate in an alliance or to continue operating independent commuter buses.
Footnotes
Acknowledgements
We would like to thank the anonymous reviewers for their constructive feedback which has helped us significantly improve the paper.
Author Contributions
The authors confirm their contribution to the paper as follows: study conception and design: Z. Yang, D. Chen; data collection: S. Tang; analysis and interpretation of results: D. Chen, Y. Lin, S. Tang, X. Li; draft manuscript preparation: Z. Yang, X. Li, Y. Lin. All authors reviewed the results and approved the final version of the manuscript.
Declaration of Conflicting Interests
The author(s) declared no potential conflicts of interest with respect to the research, authorship, and/or publication of this article.
Funding
The author(s) disclosed receipt of the following financial support for the research, authorship, and/or publication of this article: The work that is described in this paper was jointly supported by the Natural Science Foundation of Zhejiang Province, China (LQ21E080004) and the National Natural Science Foundation of China (grant numbers 72001120, 72072097).