



Abstract
Transit riders’ feedback provided in ridership surveys, customer relationship management (CRM) channels, and, in more recent times, through social media, is key for transit agencies to better gauge the efficacy of their services and initiatives. Getting a holistic understanding of riders’ experience through the feedback shared in those instruments is often challenging, mostly because of the open-ended, unstructured nature of text feedback. In this paper, we propose leveraging traditional transit CRM feedback to develop and deploy a transit-topic-aware large language model (LLM) capable of classifying open-ended text feedback to relevant transit-specific topics. First, we utilize semi-supervised learning to engineer a training dataset of 11 broad transit topics detected in a corpus of 6 years of customer feedback provided to the Washington Metropolitan Area Transit Authority. We then use this dataset to train and thoroughly evaluate a language model based on the RoBERTa architecture. We compare our LLM—MetRoBERTa—with classical machine learning approaches utilizing keyword-based and lexicon representations. Our model outperforms those methods across all evaluation metrics, providing an average topic classification accuracy of 90%. Finally, we provide a value proposition of this work demonstrating how the language model, alongside additional text processing tools, can be applied to add structure to open-ended text sources of feedback such as Twitter. The framework and results we present provide a pathway for an automated, generalizable approach for ingesting, visualizing, and reporting transit riders’ feedback at scale, enabling agencies to better understand and improve customer experience.
Public transportation agencies collect a wealth of customer experience data through traditional customer relationship management (CRM) feedback channels, ridership surveys, and social media interactions. As transit agencies continue to place more emphasis on customer experience to recover ridership to pre-pandemic levels, collecting and timely analyzing feedback is of utmost importance for making data-informed decisions to improve customer satisfaction and attract more riders ( 1 ). While the classical focus of customer service staff—in transit agencies and elsewhere—has been to review and respond to individual customer comments through traditional CRM channels, there is an ever-growing need to adapt to the use of social media, and especially Twitter, as a key channel of customer feedback ( 2 ). The unstructured nature of this feedback, however, combined with the lack of transit-specific natural language models and tools, presents difficulties for agencies and public transit researchers, hindering their ability to efficiently and meaningfully analyze feedback for transit-specific trends over time and at scale.
While conventional natural language processing (NLP) tools can be applied to open-text customer feedback in its existing form, the broad range of topics in these comments and their generic aggregations does not lead to meaningful analysis. This is especially true for uncategorized data such as open-ended survey responses, call center transcripts, or tweets. Looking at the traditional use of NLP for sentiment analysis as an example, while the distribution of positive to negative comments could provide a proxy for overall customer experience, false equivalencies are drawn between the severity, urgency, or resolvability of comments. In the context of a transit agency, for example, conducting a topic-agnostic sentiment analysis to assess the impact of a presumably favorable new fare policy could be falsely affected by an influx of negative sentiment feedback caused by an incident-driven service disruption that occurred during the same period of analysis. To help address this gap, we conducted this study analyzing all instances of CRM feedback at the Washington Metropolitan Area Transit Authority (WMATA) from 2017 to 2022 to create an end-to-end framework for meaningfully categorizing customer feedback and interactions, allowing for more robust transit service and policy evaluation. The language model we develop and present as a result of this work—MetRoBERTa—is a large language model (LLM) that can provide a predictive classification of 11 transit-specific topics. This classification model, supplemented with existing NLP tools for text mining and sentiment analysis, allows for the meaningful aggregation of customer feedback about specific topics at scale. It also paves a path that could enable the automatic creation and routing of action items from customer feedback to transit agency departments, overcoming the time-intensive and subjective process of manually categorizing and routing rider feedback.
Objectives and Contribution
In this study, we propose and evaluate a framework for detecting latent transit-specific topics and classifying unstructured transit customer feedback into those topics. To the authors’ best knowledge, this work is the first to efficiently leverage historic transit agency CRM data to develop an end-to-end, transit-topic-aware natural language model. We demonstrate the high accuracy of the resulting model in classifying unstructured customer feedback, using data from Twitter as a case study, and further re-classifying feedback from existing CRM channels that may have been misclassified during the traditional manual input process. The following sections of this paper are as follows: 1) a survey of related works, 2) a detailed breakdown of the CRM data preprocessing, modeling, and language model training, 3) results, including model evaluation and potential case study applications using data from Twitter, and 4) discussion and conclusions.
Related Work
NLP is a field of artificial intelligence focusing on the interaction between computers and human language. It enables computers to process, analyze, and derive insights from vast amounts of textual data, including text classification, named entity recognition, information extraction, sentiment analysis, translation, prompt answering, and text summarization. Recent advances in NLP have made it possible and accessible for domains outside computing to utilize NLP to better understand the customer experience by mostly focusing on analyzing the sentiment of customer feedback ( 3 – 5 ).
Naturally, transit agencies are poised to benefit from such advances. Understanding rider attitudes and sentiments is paramount for transit agencies to assess and improve service, especially at a time when agencies are struggling to recover ridership to pre-pandemic levels ( 6 ). Social media, and Twitter (recently rebranded as “X”) in particular, offer agencies the opportunity to engage with large amounts of customer feedback, often in real or near real time, supplementing the traditional methods of infrequent and scope-confined ridership surveys ( 7 ). The ongoing changes with the Twitter user interface and API, however, may change this in the future ( 8 ). While extracting meaningful customer experience metrics for a specific domain such as public transit introduced the need for some pre-processing of the unstructured feedback data (e.g., creating baseline topics), the efficacy of this newfound data source has been demonstrated in numerous recent studies. Das and Zubaidi collect transit-related tweets from New York (NY) and California (CA) using a list of significant key terms (e.g., @NYTransit) and conducted sentiment and emotion analysis on the tweets using open-source libraries (i.e., no transit-specific lexicons developed) ( 9 ). They concluded that CA and NY have different emotional content in their transit-related tweets, indicating that binary sentiment analysis may be inadequate in analyzing transit tweets where specific sentiment lexicons may be needed. Hosseini et al. proposed linking semantic analysis with social network analysis to better understand transit customer satisfaction ( 10 ). In addition to collecting large amounts of tweets, the authors identified accounts that are strictly transit-specific and accounts that are influential, and further classified accounts into the general public, reporters, unofficial transit bloggers, transit officials, and politicians. They also incorporated transit-specific lexicons using terms identified from the Transit Cooperative Research Program ( 11 ). The study demonstrated that customers are more likely to utilize Twitter for real-time concerns (e.g., safety, travel time, service, and information provision) compared with planning topics (e.g., spatial and temporal availability) and that topic discussions vary depending on service status and locale. Kabbani et al. conducted a similar study which reciprocated the results, concluding that key incidents can be identified from Twitter feedback, allowing agencies to quickly identify and respond to issues in near real-time ( 12 ).
More recently, researchers focused on the means of utilizing Twitter feedback to assess and improve operations. Haghighi et al. and Al-Sahar et al. conducted studies concluding that utilizing customer-oriented measures from Twitter to supplement operational-oriented measures from traditional transit data sources would empower agencies to improve planning and operational decisions ( 13 – 15 ). While findings from studies conducted in different cities show consistent results on the value-added of language processing for extracting useful information on transit riders’ experience, they also identify limitations associated with traditional NLP methods, such as the need for standardization and lemmatization, the difficulty of incorporating geocoding and topic modeling for the personal, decontextualized, and specific nature of tweet texts, and that word-frequency-based methods are limited by differing local contexts ( 9 , 16–18).
The advent of language models in recent years has provided immense contributions to advancing state-of-the-art NLP. LLMs, most notably BERT, GPT, and their derivatives, have proven extremely useful for general-purpose text mining and analysis tasks ( 19 , 20 ). In this study, we propose utilizing existing customer feedback from traditional sources to develop an LLM capable of inferring transit-specific topics. We additionally assess the value-added of this approach in identifying and classifying the transit-specific topic of tweets in a highly generalizable, end-to-end manner.
Methodology
The data sources, steps for preprocessing, model training, and application for analysis are illustrated in Figure 1. The main data source used in this study is a dataset containing a total of ∼ 180,000 customer feedback comments with manually classified labels from WMATA’s CRM database. This dataset includes customer complaints and feedback from January 2017 through December 2022. The dataset has been anonymized for any personal identifiable information by WMATA before being made accessible to the researchers. The curated dataset includes the text written by the customers or customer service agent in the case of comments made over the phone or online chat, in addition to a manually selected label that maps the complaint to one of 61 problem categories. The developed language model was applied to a second dataset containing ∼ 300,000 tweets corresponding to the same period of CRM data. Those were only direct tweets that mentioned one of WMATA’s official Twitter handles (namely @wmata, @wmatagm, @metrobusinfo, and @metrorailinfo).

Data sources, processing, training, and application steps for the proposed framework.
Detecting Transit-Specific Topics from Customer Feedback
Although WMATA’s CRM data contained human-classified category labels which were used to route action items from feedback to internal departments, the large number of distinct labels that every feedback instance can be assigned to (61 categories) makes it challenging to directly utilize the dataset as-is for training a classification model. While it could be possible to manually create a hierarchical, parent-child structure to condense the number of categories, there is no guarantee that the customers would consistently assign similar issues to fall within the same problem category. As such, we opted to utilize a semi-supervised learning algorithm, latent Dirichlet allocation (LDA), on the dataset to re-categorize customer feedback instances into fewer, broader latent topics based on the co-occurrence of specific lexicon within the comments’ text. WMATA’s CRM problem categories are fully listed in Appendix I.
Before applying LDA to the dataset, hierarchical clustering was employed as a screening mechanism to identify an upper limit of potential topics, which was found to be 23 (i.e., 23 broad clusters best represented the 61 manually labeled individual problem categories). We then ran a 23-topic LDA, which yielded broad transit-specific topics, the words associated with those topics, and their relative contribution to the topic score. The authors identified topics with similar keywords which were further condensed to result in nine topics (e.g., individual topics of Delays, Not Stopping, and Early Departures were condensed into a single topic of Delays and Operations). A limitation of LDA, however, was being unable to detect niche topics that were significantly less represented compared with others. This includes critical topics such as complaints about crime, harassment, and safety in the transit system. Additionally, ∼62,000 (about 35%) complaints did not have a significant primary topic score and were left unassigned, as the keywords detected in their text could map to multiple latent topics. To resolve the former issue, the niche topics of crime, harassment, and security were held out of the CRM dataset before applying LDA, and categorized as a single topic based on the original manually assigned CRM labels. The same was done for the crowding complaints as a topic of its own. The resulting set of ∼120,000 complaints that had a strong primary topic score (i.e., keywords detected in the complaint text map more strongly toward one topic than others) was assigned to 11 topics (nine LDA-detected topics and the two manually categorized topics). The complaint text and LDA topic label were used as a training dataset, illustrated in Figure 2. Table 1 shows those topics, their keywords, and relevant categories from the 61 problem categories manually assigned at complaint entry. Appendix II shows the ratio that CRM problem categories contribute to each LDA topic (up to the top three categories per topic, for brevity).

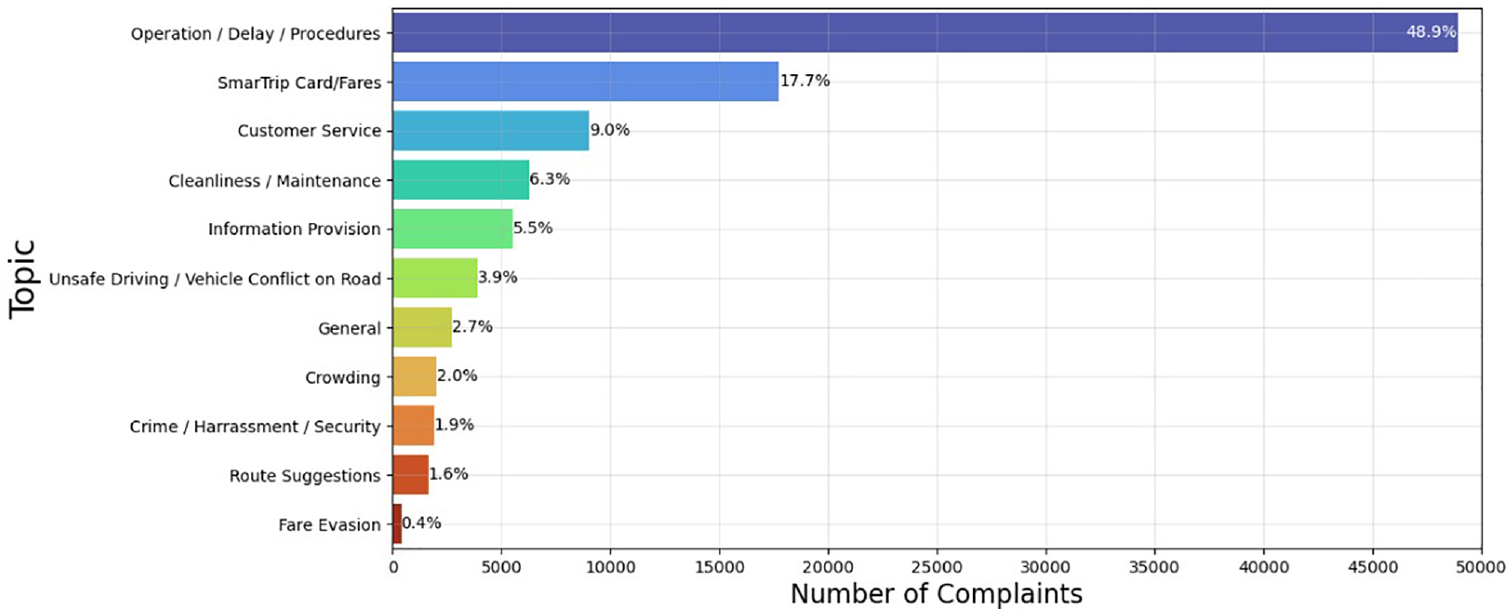
Distribution of topics across customer relationship management (CRM) complaints in the training dataset.
Broad Transit-Specific Topics and Keywords

Note: LDA = latent Dirichlet allocation; WMATA CRM = Washington Metropolitan Area Transit Authority customer relationship management.
WMATA categories which span multiple topics: Safety, MetroAccess, Crowding, Mobile feedback, Accessibility.
Topic Classification Models
Traditional Machine Learning (ML)Models
To develop a topic classification model that utilizes the LDA-labeled dataset, we use term frequency inverse document frequency (TF-IDF) to create a matrix representation of the customer complaints and the terms used across different topics. The term frequency (TF) provides a measure of the importance of a term (t) within a specific customer complaint (d). While the inverse document frequency (IDF) is a measure of the uniqueness of term (t) across a collection across the entire collection of complaints (D). By multiplying the TF and IDF, higher weights are assigned to terms that are frequent within a specific topic but relatively rare across all complaints.


Combining TF and IDF:

To create a TF-IDF feature matrix, we calculated the frequency of unigrams (single-word terms) and bigrams (two-word terms) that have appeared at least 20 times across all CRM complaints. This was done after accounting for stop words and WMATA-specific terms (route and station names, etc.). The resulting TF-IDF feature matrix that was used as an input to the classification models contained weights of approximately 20,000 unique terms.
Using the TF-IDF feature matrix as an input, we trained and evaluated five traditional machine learning (ML) models: a random forest classifier, a linear regression with stochastic gradient descent, a support vector machine, naive Bayes, and a logistic regression classifier. All models were trained on 5-fold cross-validation with a training-validation split of 80:20. In calculating the loss function (multi-class cross-entropy), we used an inverse-weight vector to account for the differences in topic size—illustrated in Figure 2—assigning a higher weight to the lower-represented classes to prevent the model from biasing toward over-represented topics.
Masked Language Modeling
While TF-IDF offers a powerful way to represent a text corpus for training and deploying traditional ML algorithms, a key limitation is that it struggles with out-of-vocabulary (i.e., previously unseen) terms. While the term feature matrix extracted from our dataset contains ∼20,000 unique terms, any terms not seen in this glossary would constitute a null value to the underlying predictive model. Another key limitation is that TF-IDF-based models do not take context into account, and rather treat individual terms (unigrams and bigrams in this study) independently.
Given that one of the core areas of interest for WMATA is creating a model that supports extracting and aggregating feedback from unstructured data sources such as Twitter, having a model capable of semantic and contextual understanding is key. Additionally, once adequately trained, LLMs’ ability to transfer-learn allows for the creation of a generalizable transit-topic-aware model that is not restricted by the spatial and temporal use of certain terms to describe transit topics. The core LLM we utilized for this study is the RoBERTa model open-sourced by Facebook (now Meta) Research, re-trained to our dataset, as described in Algorithm 2 ( 21 ). We additionally compared a model variant that was further pre-trained on ∼124M tweets and fine-tuned for multi-label topic classification, but found the RoBERTa base model generalized better to our data ( 22 ).
Extended Analysis Pipeline
The topic classification model was designed to fit within a pipeline of broader NLP tools, fused with transit operations data to aggregate performance metrics. After assigning a transit topic to a feedback instance, we additionally (to the extent possible) extract the following:
Sentiment using open-source RoBERTa sentiment model ( 23 )
Mode, route, vehicle, and location using uni/bigram matching to WMATA assets
Customer characteristic (e.g., gender or frequency of feedback) using text inference
Normalization of feedback volume based on daily ridership data

Results and Discussion
Language Model Evaluation
Figure 3 shows the accuracy of the traditional ML models evaluated, with the box plots illustrating the score distribution and the scatters showing the individual score of each of the 5-fold training.
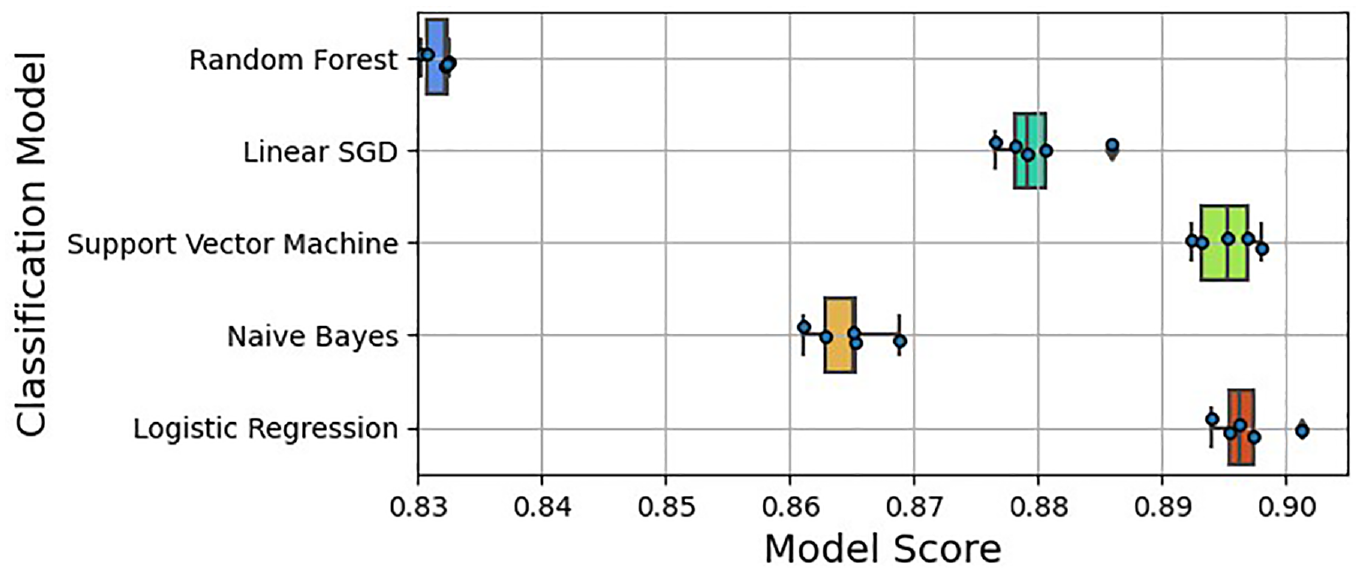
Performance of term frequency inverse document frequency (TF-IDF)-based machine learning (ML) classification models.
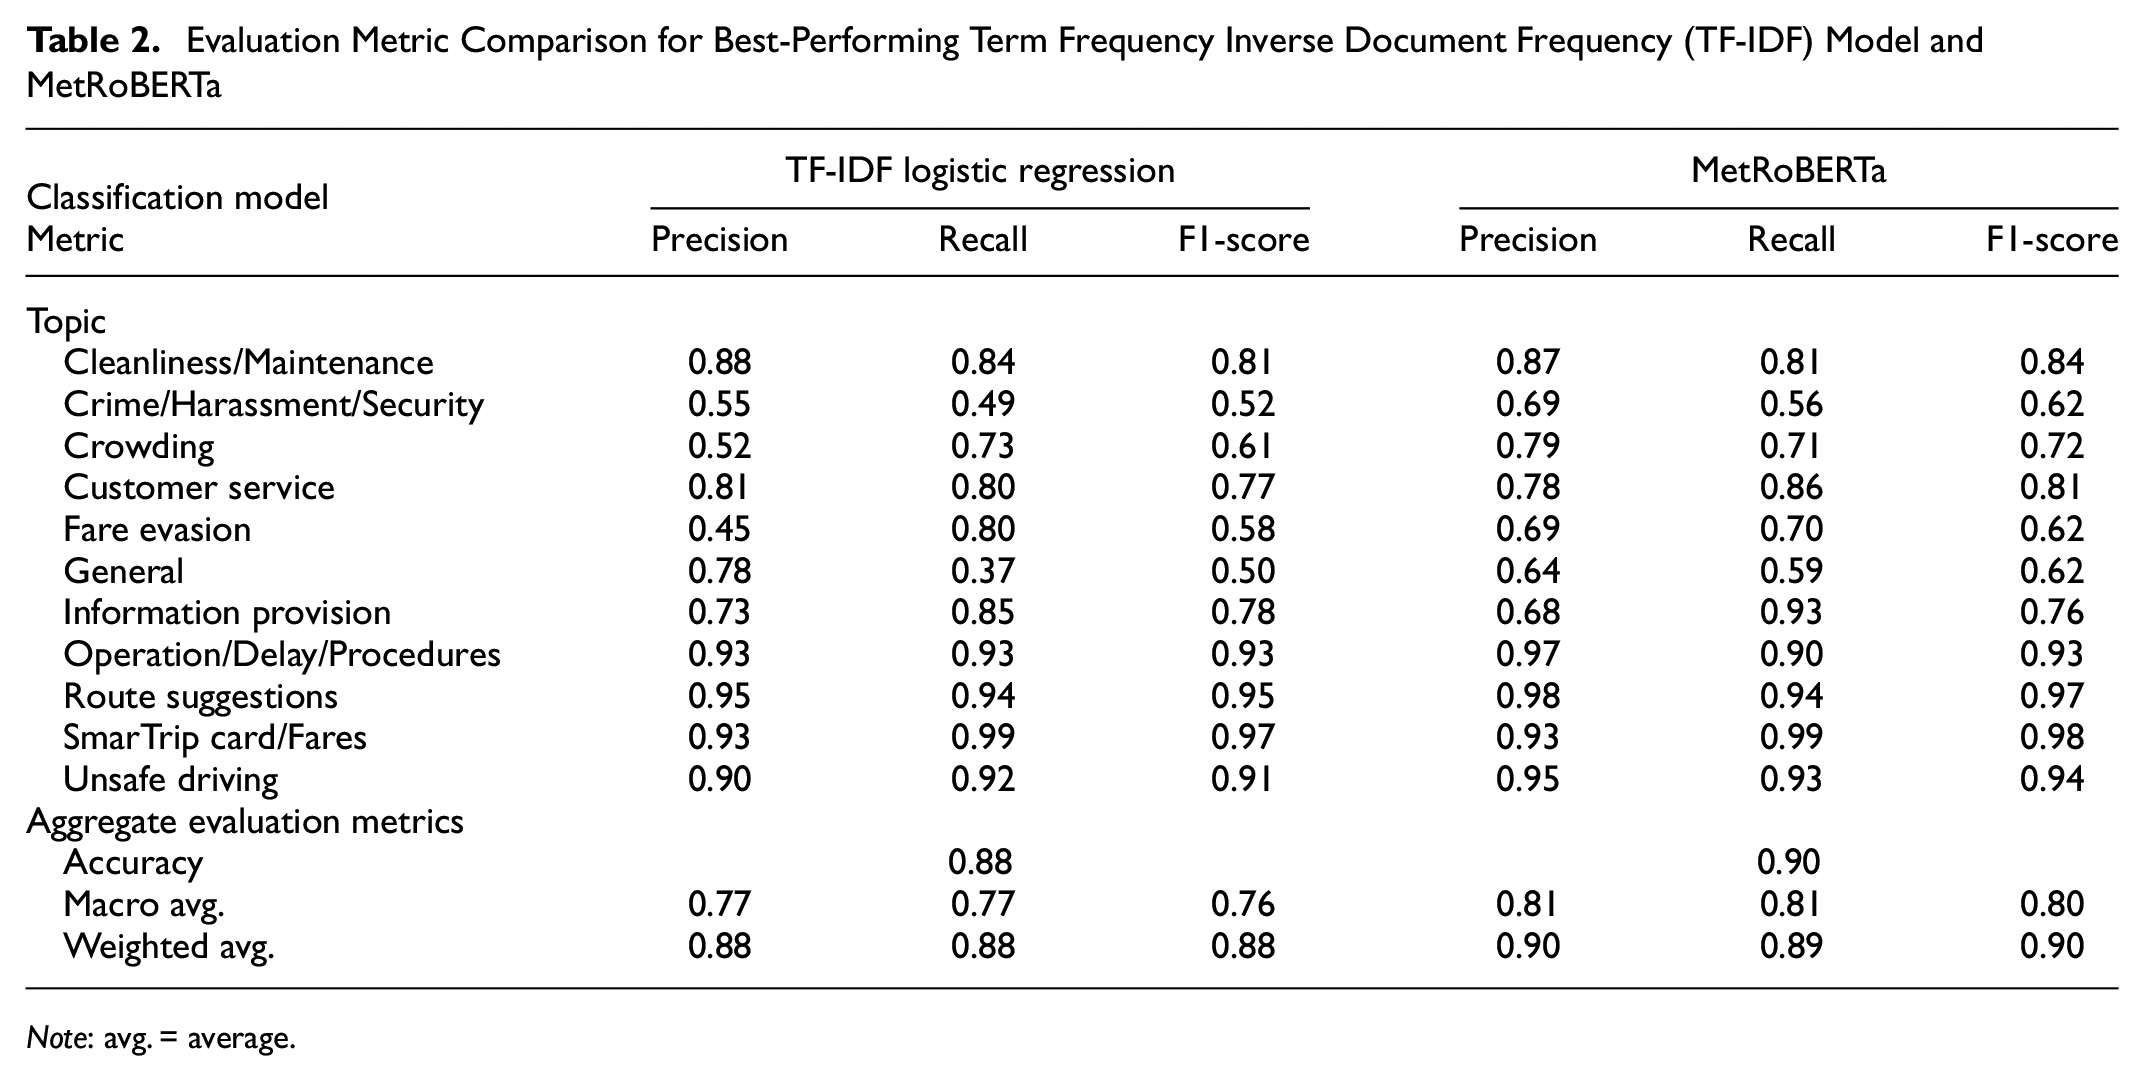
The logistic regression model was found to be the best performer. We compare its performance with MetRoBERTa which was trained on the same dataset, as elaborated in Algorithm 2. Table 2 shows the comparison between the two models. The macro and weighted averages are, respectively, the mean of the raw metric scores for each topic and the topic-size weighted mean. Figure 4 shows the confusion matrices for MetRoBERTa in percentage points and raw inter-topic counts for the predicted topic classifications of the 20,000 feedback instances in the test subset.
Evaluation Metric Comparison for Best-Performing Term Frequency Inverse Document Frequency (TF-IDF) Model and MetRoBERTa
Note: avg. = average.

MetRoBERTa topic classification accuracy (left) and raw counts (right).
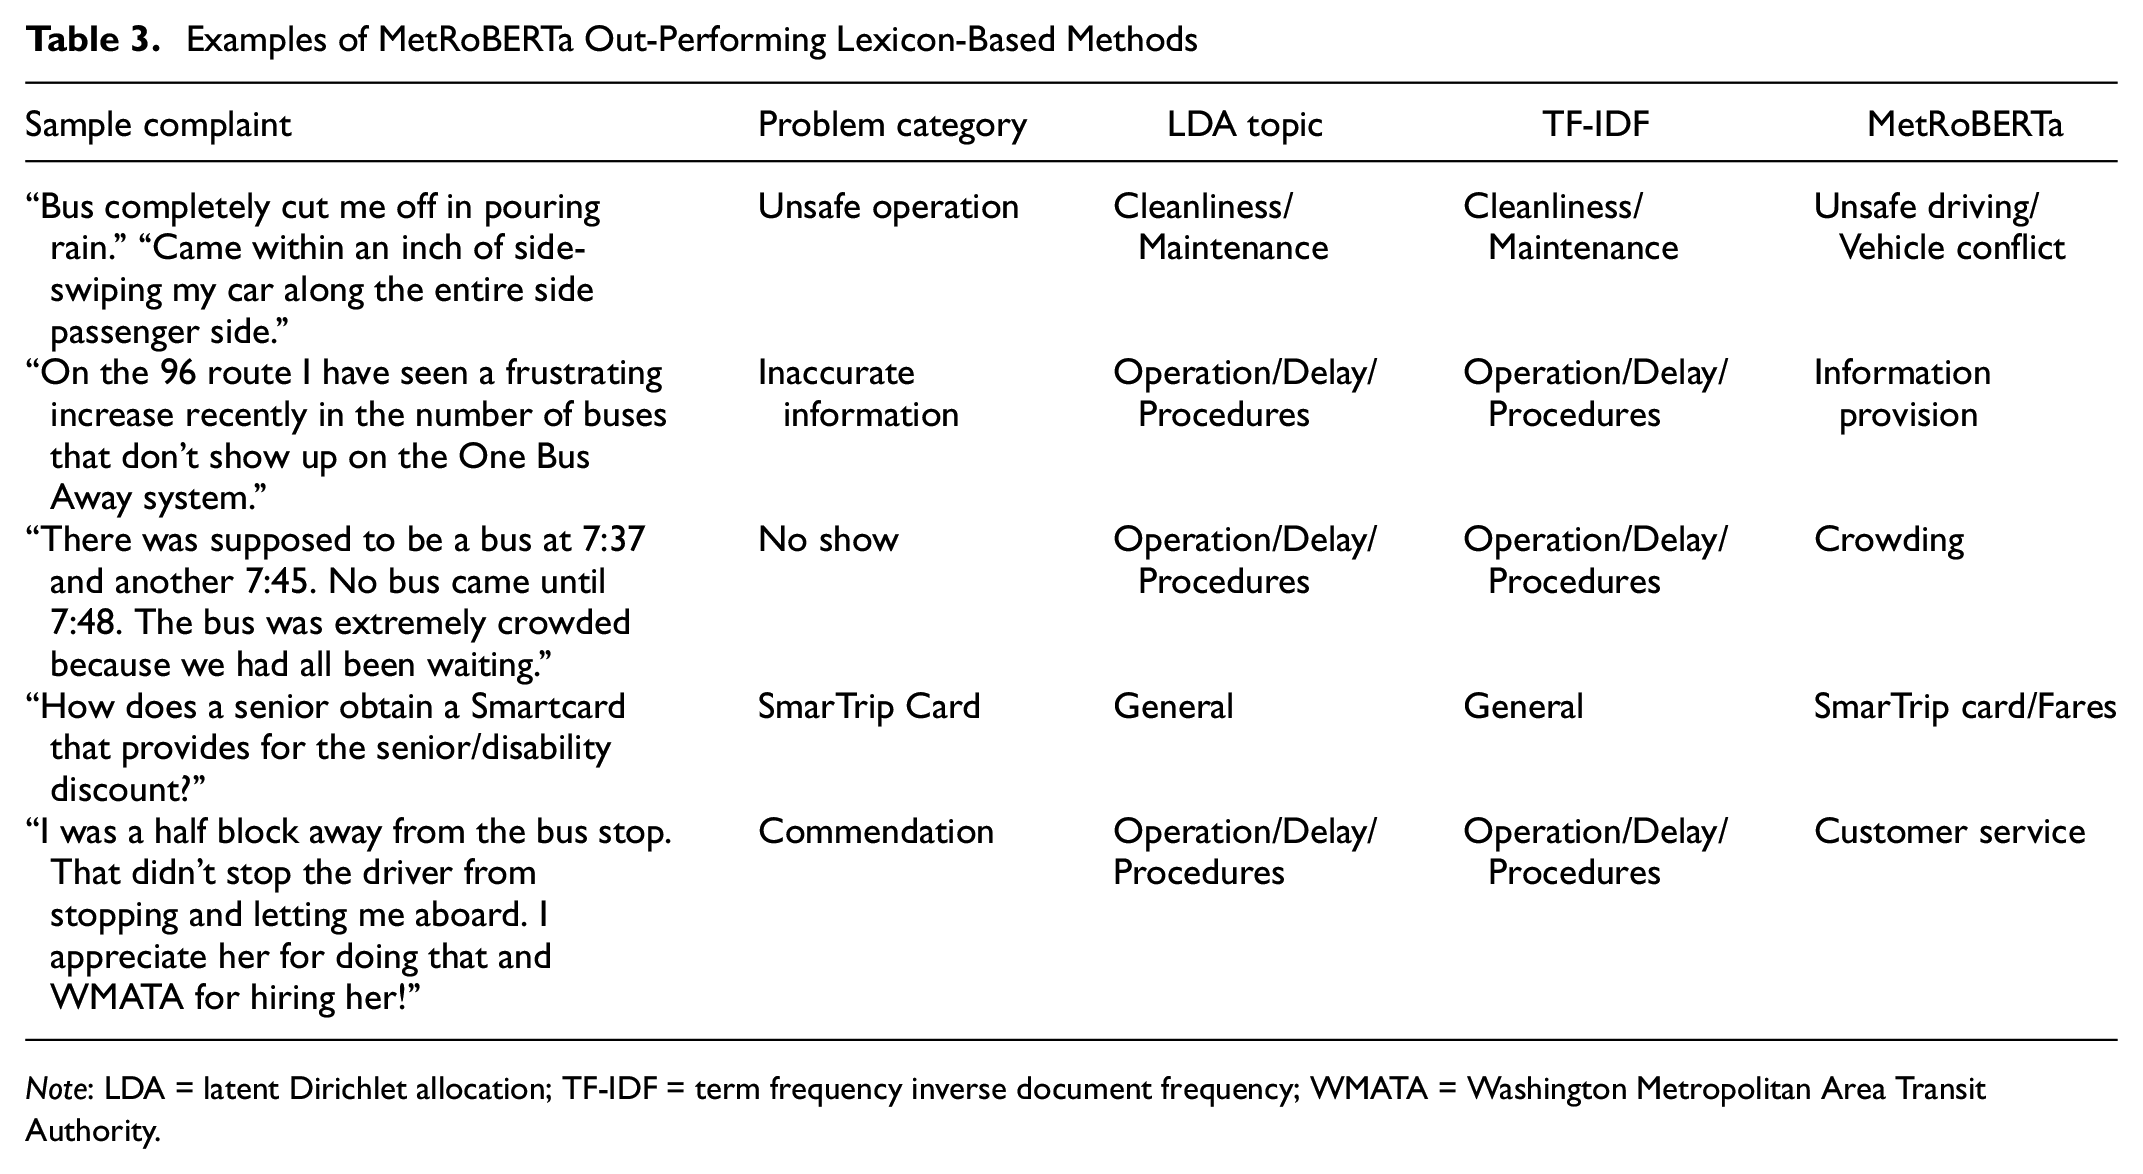
MetRoBERTa outperforms the best-performing TF-IDF model across all aggregate evaluation metrics. Additionally, the semantic and context-aware nature of our BERT-based model allows it to correctly identify what were misclassifications either because of the manual nature of assigning problem categories by customers or customer service representatives, the keyword-based re-categorization of topics to create our training dataset through LDA, or both. Table 3 shows examples where MetRoBERTa’s prediction of the label did not match the ground truth label (LDA topic), and it provided a classification that would better fit the complaint. The problem category is the label manually assigned by the customer when submitting a CRM complaint. It can be seen in those examples that the TF-IDF model matches the LDA-assigned topic, which is reasonable given that both methods rely on keywords to detect topics. However, when words are used in a different context (e.g., “pouring” and “swiping,” which the keyword-based methods associated more with cleaning, as in the first example) or when a customer inquires about the “Smartcard” and not “SmarTrip” card, keyword-based methods struggle. In cases like those demonstrated by the 2nd and 5th examples, the customers used words that are associated with operations and delays (e.g., “buses don’t show up,”“driver stopping”) but the context of the comment was respectively better fitting to topics of information provision and customer service. Given that such instances negatively affect accuracy, the MetRoBERTa’s true accuracy would be well above the reported 90%.
Examples of MetRoBERTa Out-Performing Lexicon-Based Methods
Note: LDA = latent Dirichlet allocation; TF-IDF = term frequency inverse document frequency; WMATA = Washington Metropolitan Area Transit Authority.
Value Proposition for Transit Agencies
Adding Structure to Unstructured Data
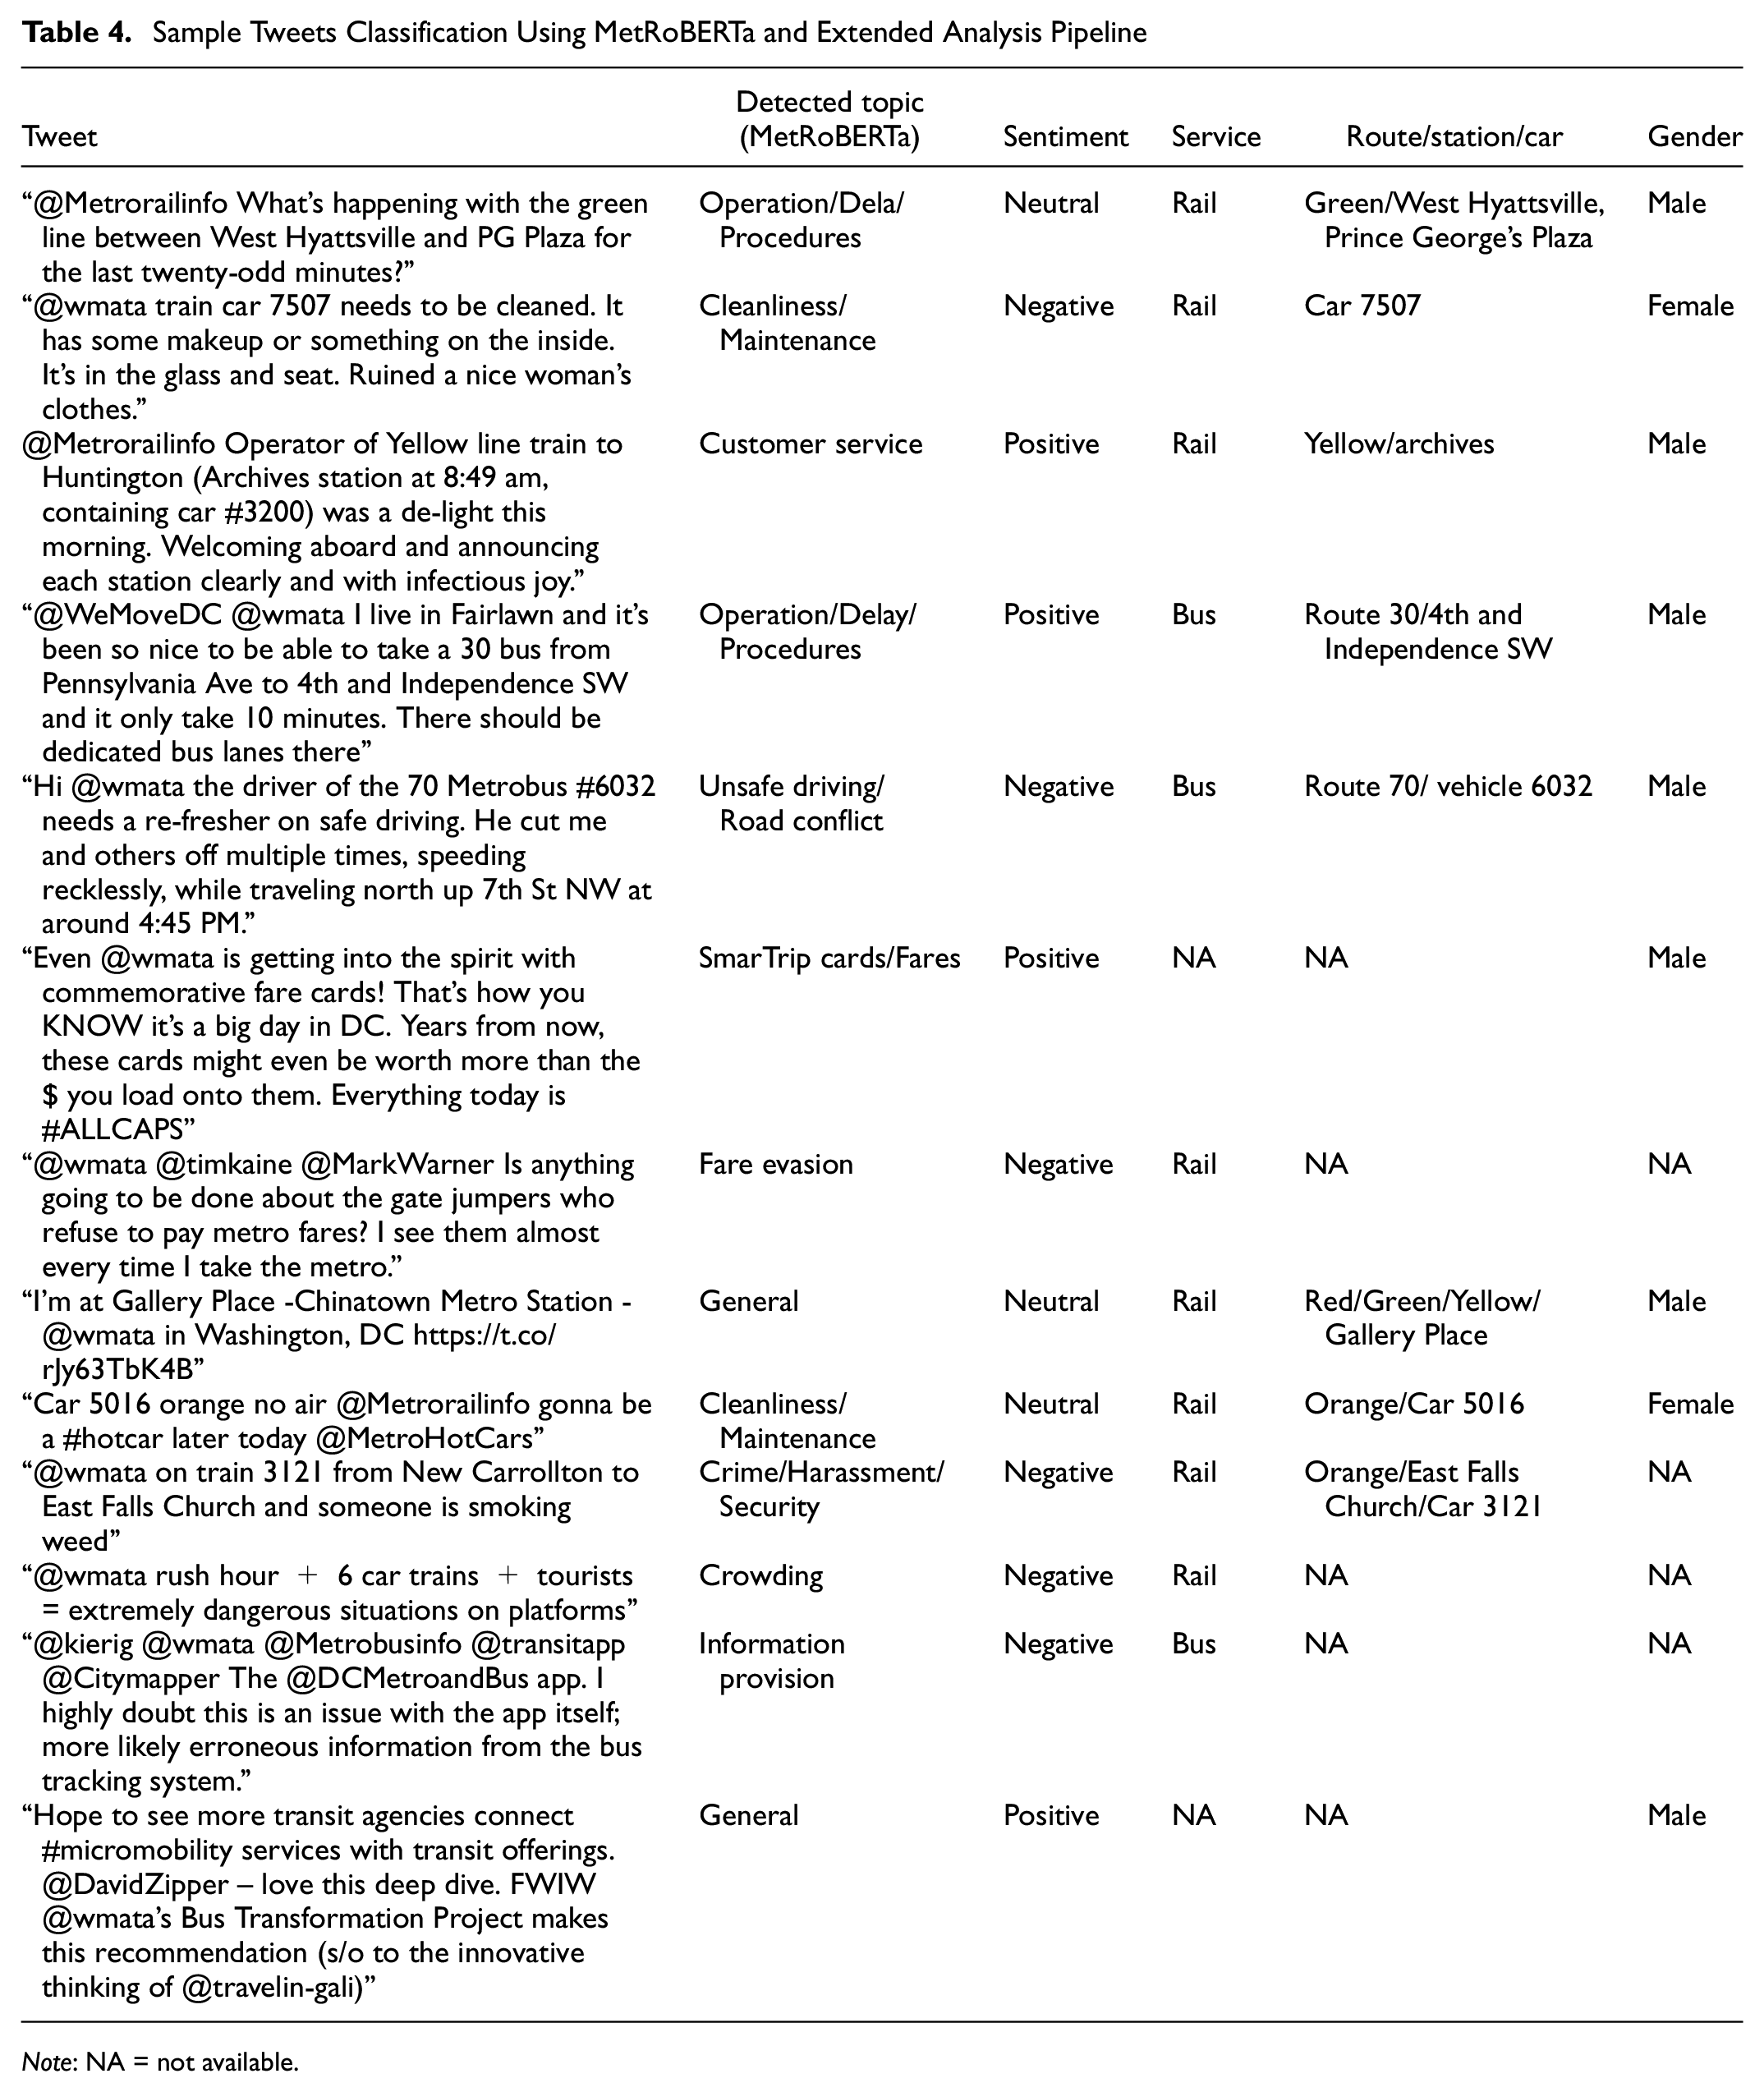
Our proposed analysis pipeline featuring MetRoBERTa combines the results of our transit-specific topic classification LLM with other attributes, such as sentiment, service, location, assets, and user characteristics, that can be obtained using text-mining and open-source tools. We provide a case study analyzing data from Twitter. After using our model to detect a topic, sentiment is inferred via a RoBERTa sentiment model ( 23 ). Using a RoBERTa-based sentiment model is key for efficiency, as both the sentiment and our classification model use the same text tokenizer. We used text mining to identify the mode of service, and match routes, stations, and vehicle IDs to a database of WMATA assets. A likely gender was inferred from the user’s first name (when possible) using a method previously developed at WMATA ( 24 ). Table 4 shows an application of this pipeline to add structure to tweets mentioning @wmata (and related WMATA accounts).
Sample Tweets Classification Using MetRoBERTa and Extended Analysis Pipeline
Note: NA = not available.
The addition of a transit-specific topic as a dimension to the data allows for more meaningful aggregations of customer feedback across a multitude of transit agencies’ interests. This will be briefly demonstrated in the following two applications: understanding sources of customer feedback and generating performance metrics from customer feedback.
Understanding Sources of Customer Feedback
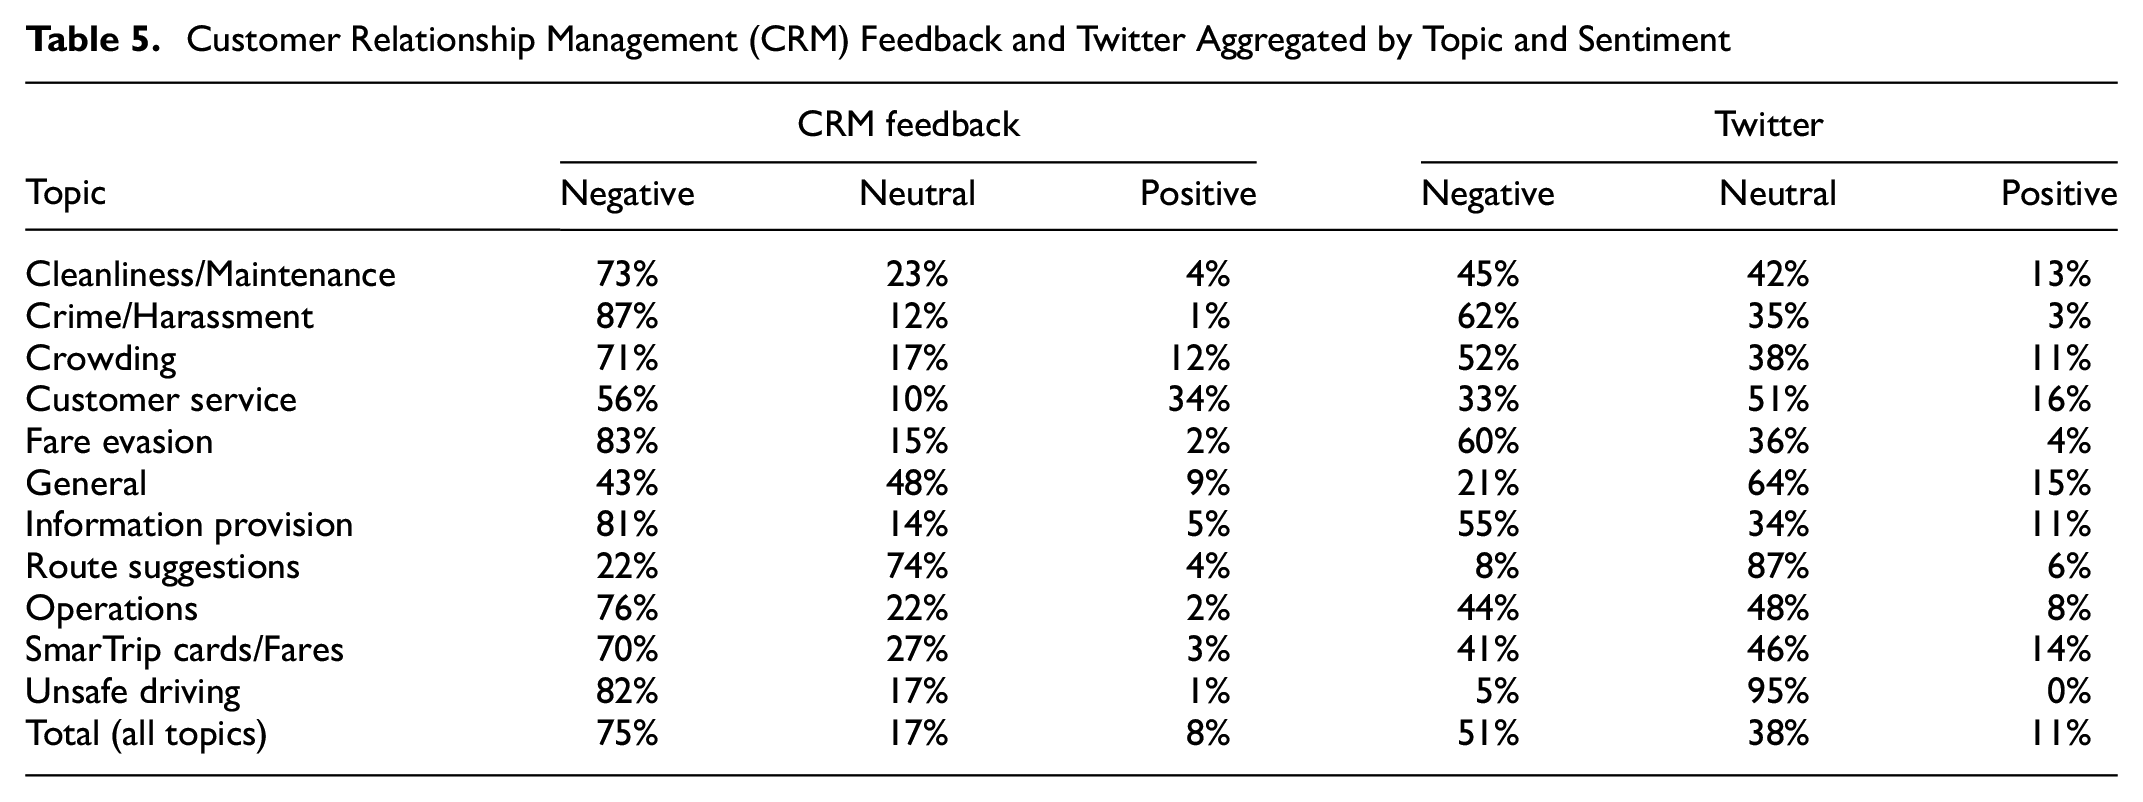
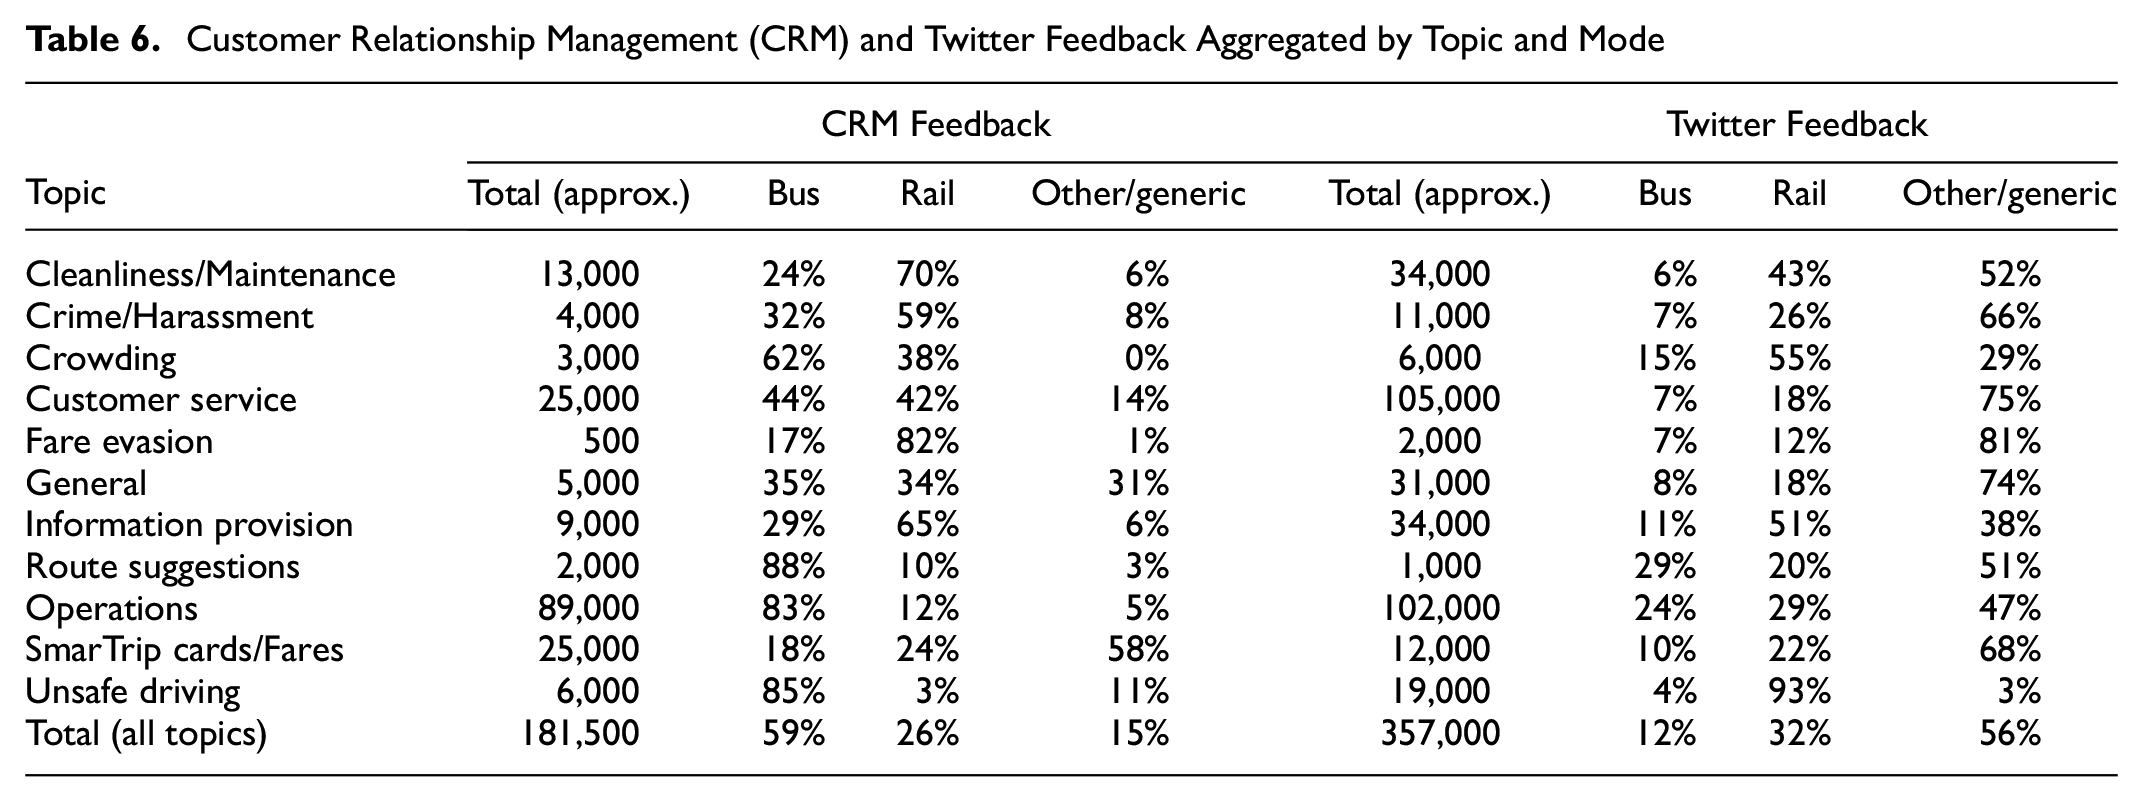
Tables 5 and 6 compare aggregations of WMATA’s CRM and Twitter feedback (both from January 2017 to December 2022) by topic, sentiment, and mode. From the total numbers, we can observe that overall there is more negative sentiment expressed in traditional CRM feedback compared with Twitter, where a higher share of neutral sentiment can be observed. This is not surprising, considering that the purpose of the CRM system is to gather and respond to customer complaints or requests for information about improving or building service. Conversely, more neutral and slightly higher positive feedback is observed on Twitter. This may be attributable to the “comments in passing” nature of tweets, where the barrier to providing commentary on the go and tagging relevant WMATA accounts is significantly lower than that of initiating an official customer complaint.
Customer Relationship Management (CRM) Feedback and Twitter Aggregated by Topic and Sentiment
Customer Relationship Management (CRM) and Twitter Feedback Aggregated by Topic and Mode
The addition of topic classifications from MetRoBERTa, however, helps to further isolate the polarity of sentiments amongst different categories, as well as investigate how they vary between these two sources. For example, we are able to observe that the majority of positive feedback in the CRM data comes from customer service, specifically from a sub-category labeled Commendation, and the rate of positive customer service feedback on the CRM database actually exceeds that of Twitter. The topics of Crime/Harassment/Security and Fare evasion are seen to be consistently negative in sentiment in both CRM and Twitter, while topics of Cleanliness/Maintenance, Crowding, Information provision, Operations, Fares, and Unsafe driving tended to be more neutral and less negative on Twitter compared with CRM.
Looking at the modal breakdown in Table 6, we observe that a significantly higher proportion of CRM complaints are bus-related compared with Twitter, which skews more toward rail service and general discussions on current affairs. Adding topic labels from MetRoBERTa, however, we are able to further segment that while ∼50% of CRM feedback is about operations, we observe a better distribution of topics in the Twitter feedback, with customer service being similarly represented to operations, and other topics more equitably distributed. This underscores a large difference in the nature of feedback and demographics of feedback providers between the two sources. Additionally, we are able to isolate the bias in feedback frequency toward bus users on CRM and rail users on Twitter to the topics of Crowding, Operations, and Unsafe driving, while the topics of Cleanliness/Maintenance, Crime/Harassment/Security, Information provision, Route suggestions, and SmarTrip cards/Fares actually demonstrate a similar distribution of rail-to-bus comments despite the overall biases. These insights demonstrate how our topic classification model can be used to add an additional dimension to customer feedback analysis and draw actionable insights.
Generating Performance Reporting Metrics from Customer Feedback
Lastly, we provide examples of how the structure added to open-ended text feedback using our model and proposed extended text analysis framework can be utilized to conduct cross-sectional, longitudinal, and strategic studies leveraging customer feedback as a performance indicator of the customer experience on various aspects of public transit systems. For the purpose of this demonstration, the reporting metric used is complaints per million riders, where the volume of complaints is normalized by ridership data from WMATA’s Trace Origin, Destination, and Transfers inference (ODX) model database during the same analysis timeframe. This allows feedback levels to be compared across different time periods where system ridership varied, especially during the COVID-19 period. Figure 5, a and b, illustrates examples of cross-sectional studies showing the distribution of customer feedback on operations across WMATA’s Metrobus routes and cleanliness in Metrorail stations over the year 2022, demonstrating the value-added of enabling topic-specific geospatial trends to be aggregated and visualized.
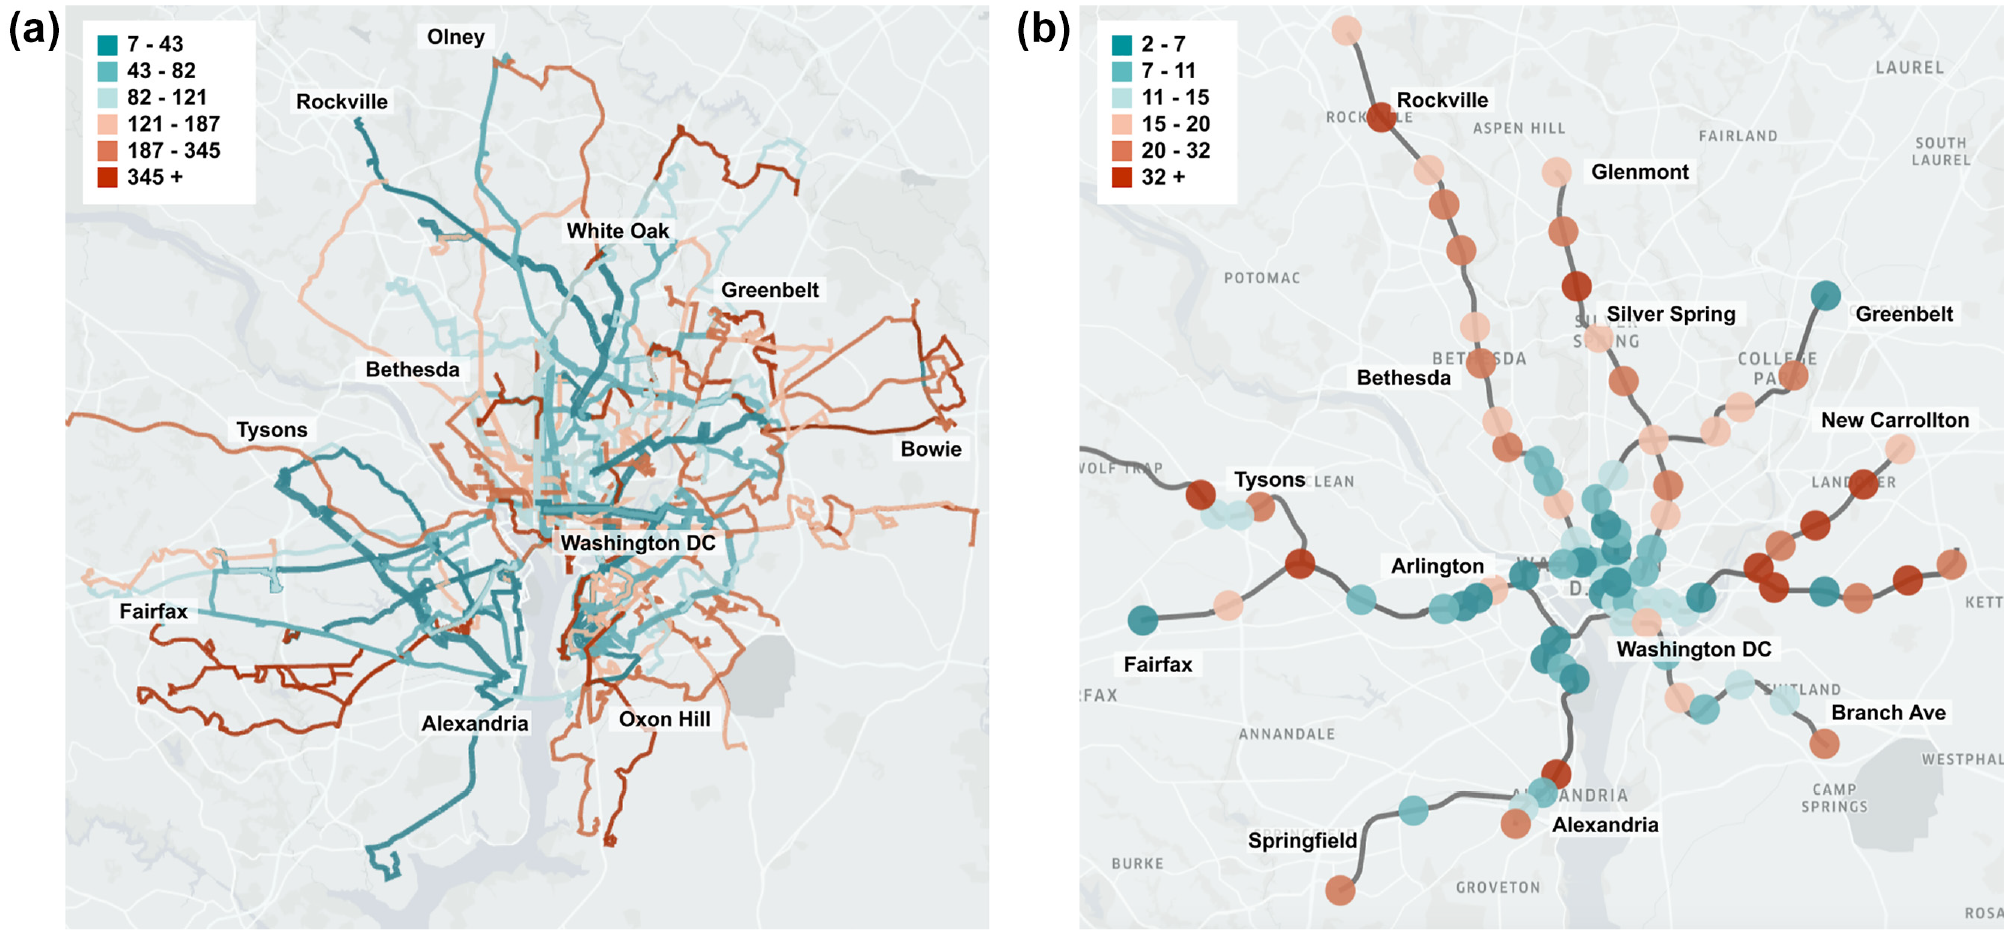
Spatial pattern of select topic complaints per million Washington Metropolitan Area Transit Authority (WMATA) riders: (a) operations-related by metrobus routes and (b) cleanliness-related by metrorail stations.
Figure 6, a and b, demonstrates examples of topic-specific longitudinal studies on complaints (illustrated as 30-day moving averages) about fares and cleanliness, respectively, during the year 2022. Using MetRoBERTa’s transit topic classification, we are instantly able to observe that around the time WMATA implemented a late-night flat fare regime on Metrorail service starting June 27, 2022, fare-related complaints on most Metrorail lines decreased. Similarly, after a deep-cleaning program for rail stations in August 2022, complaints about cleanliness on the rail system decreased on all lines.

Temporal pattern of select topic complaints per million Washington Metropolitan Area Transit Authority (WMATA) riders: (a) fares-related by metrorail route and (b) cleanliness-related by metrorail route.
These examples demonstrate what the authors envision as standard implementations of the MetRoBERTa extended analysis pipeline, where specific types of study can be tailored to match the characteristics of the underlying data. Data with sparse aggregations, such as niche topics, feedback for specific bus routes, or smaller Metrorail stations, are more suitable for cross-sectional studies over long periods of time, where more opportunities for data collection may lead to meaningful comparison and analysis. Conversely, assets with rich aggregations that vary on a daily or weekly basis, such as complaints about specific popular rail lines, topics, or system-wide initiatives such as fares and service changes are more suitable for longitudinal analysis (e.g., time series) where certain trends and anomalies can be identified.
Conclusions
In this study, we proposed and evaluated the value of leveraging customer feedback provided to transit agencies through traditional CRM systems to develop and deploy a transit-topic-aware LLM. The language model we developed as a part of this study, MetRoBERTa, has proven capable of accurately classifying open-ended text feedback to relevant transit-specific topics. The model outperformed classical ML approaches that utilize lexicons and keyword-based representations, with an average transit topic classification accuracy of at least 90%. We concluded this study by providing a value proposition of utilizing our language model, alongside additional text processing tools, to add structure to open-ended text sources of feedback such as Twitter.
While our LLM was found to outperform the best-performing traditional ML model across all metrics, the raw gains in performance were marginal (2%–4%) and our future work will look to further improve this performance. However, MetRoBERTa provides the added advantage of a single-shot pre-processing of text data for topic classification and sentiment detection via RoBERTa-based tokenization and modeling, which presented a substantial efficiency boost for the tasks presented in this paper. Studies in the literature consistently conclude that LLM-based models outperform traditional ML approaches for such more-involved tasks ( 25 ). Future extensions of this work could also utilize LLM tokenization and embeddings for other tasks such as summarization and conversational text generation for customer support chatbots. All those tactical advantages are in addition to the ability to identify context and overcome label errors, given that LLMs (RoBERTa-based or otherwise) have already been pre-trained on corpora containing billions of text instances, as opposed to TF-IDF or similar vectorization (e.g., bag of words) which only utilizes common words present in a limited training dataset. The advantage of this as far as generalizability is concerned is evident, as illustrated in Table 3.
Based on our observations from this study, we expect MetRoBERTa’s performance to improve as it is retrained with more customer feedback data from WMATA or other sources. The literature indicates that the data-hungry nature of LLMs which results from the massive number of parameters (123 million parameters for our RoBERTa-based model) does create a need for continued re-training, as feasible, to improve performance and ensure generalizability ( 26 ). Re-training our model from the current checkpoint can be completed in ∼30 min for every 10,000 feedback instances with a commercial-grade GPU (NVIDIA Tesla V100 or similar). A limitation of this study was the need to generate ground truth labels for the training dataset using LDA. While LDA, or any other unsupervised or semi-supervised method, can provide a reliable clustering of the topics, it can be observed in the examples provided in Table 3 that the lexicon-based nature of clustering topics can lead to assigning customer comments into a false category, and such errors can cascade when that label is used to train a model. The vast majority of complaints, however, are categorized into LDA topics that are relevant to their manually assigned problem category as shown in Appendix II and the subsequent model performance provides assurance that such misclassifications do not undermine model training in a substantial manner. Future work will investigate utilizing methods that account for label uncertainty ( 27 ). Future work will also look into creating sub-models (smaller LLMs or lexicon-based models) to break down the broad topics detected by MetRoBERTa into more granular categories which would add more value.
The case study presented in this paper focused on comparing feedback data from traditional CRM with Twitter, but this NLP analysis framework applies to all types of open-ended data that a transit agency might be interested in analyzing, including responses from ridership surveys, and incident and maintenance reports. In addition to the robust and accurate topic classification, the identification, to the extent possible, of transit agency assets mentioned in the customer feedback processed through our framework allows seamless integration with the agency’s ridership and GTFS data, allowing for robust visualization and reporting of aggregate metrics and trends. Such a level of integration addresses a fundamental gap impeding the broader utilization of NLP in transit, creating a pathway for an automated, generalizable approach for ingesting, visualizing, and reporting transit riders’ feedback at scale and empowering agencies to better understand and improve customer experience. The authors are working with WMATA on deploying this work for regular use at the agency and will continue to further develop the model backend and the use cases from processed data to best support the agency’s customer experience analytics.
Supplemental Material
sj-docx-1-trr-10.1177_03611981231225655 – Supplemental material for MetRoBERTa: Leveraging Traditional Customer Relationship Management Data to Develop a Transit-Topic-Aware Language Model
Supplemental material, sj-docx-1-trr-10.1177_03611981231225655 for MetRoBERTa: Leveraging Traditional Customer Relationship Management Data to Develop a Transit-Topic-Aware Language Model by Michael Leong, Awad Abdelhalim, Jude Ha, Diane Patterson, Gabriel L. Pincus, Anthony B. Harris, Michael Eichler and Jinhua Zhao in Transportation Research Record
Footnotes
Acknowledgements
The authors would like to thank the Washington Metropolitan Area Transit Authority (WMATA) for their generous support of this project, and the MIT SuperCloud and Lincoln Laboratory Supercomputing Center for providing high-performance computing resources that have contributed to the research results reported in this paper.
Author Contributions
The authors confirm their contribution to the paper as follows: study conception and design: A. Abdelhalim, M. Leong, D. Patterson, G. Pincus, M. Eichler; data collection: M. Leong, A. Abdelhalim, J. Ha; analysis and interpretation of results: M. Leong, A. Abdelhalim, D. Patterson, G. Pincus, A. Harris; draft manuscript preparation: A. Abdelhalim, M. Leong, J. Ha, D. Patteson, G. Pincus, M. Eichler, J. Zhao. All authors reviewed the results and approved the final version of the manuscript.
Declaration of Conflicting Interests
The author(s) declared no potential conflicts of interest with respect to the research, authorship, and/or publication of this article.
Funding
The author(s) disclosed receipt of the following financial support for the research, authorship, and/or publication of this article: Co-authors D. Patterson, G. Pincus, A. Harris, and M. Eichler are employed by the Washington Metropolitan Area Transit Authority (WMATA) which funded this study.

Supplemental Material
Supplemental material for this article is available online.
References
Supplementary Material
Please find the following supplemental material available below.
For Open Access articles published under a Creative Commons License, all supplemental material carries the same license as the article it is associated with.
For non-Open Access articles published, all supplemental material carries a non-exclusive license, and permission requests for re-use of supplemental material or any part of supplemental material shall be sent directly to the copyright owner as specified in the copyright notice associated with the article.
