



Abstract
The optimization of the connection between urban rail transit and the bus is an essential issue that benefits passenger travel and the urban structure and has social benefits, which can be realized by reasonably adjusting the bus departure schedule. This study is necessary because the development status quo of China’s urban transportation network planning is unreasonable, travel efficiency is not high, and operating costs are high. This paper sets up the decision variables of bus departure time and departure interval at each station, establishes a dual-objective optimization model with the minimum schedule change and the minimum transfer time, and studies the application of the augmented Chebyshev algorithm in the dual-objective optimization model. Secondly, based on the Shenzhen metro and public transportation integrated circuit card data, the case analysis uses the generalized Chebyshev algorithm and the non-dominated sorting genetic algorithm, respectively. The optimization results show that using the improved augmented and generalized Chebyshev algorithm in the bus schedule alteration time within a reasonable range can maximize the total transfer time, which compared with the original scheme is shortened by 68.06%. In contrast, genetic algorithms will make the complete bus schedule alteration prominent, and the whole transfer time is substantially increased. The results show that the improved augmented generalized Chebyshev algorithm is more suitable for solving the dual-objective rail transit connection problem.
Keywords
In recent years, with the acceleration of urbanization, establishing a sound urban public transportation system is conducive to alleviating the contradiction between urban transportation supply and demand. Conventional buses are still the main body of public transportation, bearing the majority of the traffic. However, with the further development of urban rail transit and conventional buses and the gradual increase of rail transit lines, more attention must be paid to the integrity and coordination of the public transportation system. In the urban public transportation system, passengers often need to transfer to buses through metro transportation to reach their destinations. Still, the transfer between urban rail and buses generally has problems such as long transfer distances, inappropriate transfer time, and unreasonable designed transfer routes, resulting in low transfer efficiency. At the same time, most of the current public transportation preparation schedule does not consider the coordination with rail transit. Most interchange passengers do not want to face the bus situation, especially passengers with travel time requirements, so thoroughly weighing the coordination between urban rail transit and bus interchange can, to a certain extent, reduce the possibility of the above situation.
Transfer time is the time consumed by passengers to walk from the urban rail to the platform of the connecting bus and finally get on the connecting bus. Xu et al. ( 1 ) proposed the concept of passenger waiting time, based on which this paper creatively divides all transfer passengers into two categories: non-stay passengers and stay passengers, that is, their transfer time is divided into non-stay passenger transfer time and dwell passenger transfer time, which is closer to real life. Therefore, our paper first analyzes the actual situation of interchange passengers and establishes a total interchange time model. Moreover, based on the advantages of higher flexibility of bus departures and relatively lower operating costs, this paper considers optimizing the connection between buses and urban rail transit by debugging a suitable bus schedule. However, significant changes in bus schedules often cause some passengers to be uncomfortable. For this situation, a minimum change in bus schedules is used as one of the objective functions in this paper. Combined with the objective of minimizing the overall transfer time of passengers, a dual-objective rail transit connection optimization model is developed in this paper. In the algorithm part, a Chebyshev algorithm based on the Pareto idea is proposed to set the incremental model to approximate the problem’s non-dominated frontier and find the non-dominated solution set with good convergence ( 2 ). Finally, it is used to search for the optimal solution. The non-dominated sorting genetic algorithm (NSGA-II) is the most commonly used method to study the interchange between rail transit and public transportation. Through experimental comparison, it is found that compared with the NSGA-II, the augmented Chebyshev algorithm can solve the non-dominated solution with better adaptability and significantly optimize the passenger transfer time. In this paper, we comprehensively consider the non-stagnant and stagnant transfer phenomena from rail transit to bus vehicles, establish a dual-objective optimization model of an urban rail transit connection scheme with bus schedule change as the decision variable, and solve it by the improved Chebyshev algorithm, which makes the final optimization scheme more adaptable. It can provide the foundation for a sound decision solution for public transportation operators.
Based on the above description, The main contributions of this paper can be summarized as follows.
Interchanges between multiple modes of transportation are considered, rather than just studying a particular method of transportation. Our study is more realistic than other studies evaluating urban rail transit or bus travel.
A dual-objective optimization model is established according to the metro and bus operation characteristics. Meanwhile, unlike other multi-objective studies, multiple objectives tend to be parallel or congruent. Our goals reflect a direct contradiction in time, and the two purposes are mutually constrained and must be considered together.
A new algorithm is used: the augmented Chebyshev algorithm. In previous studies, the NSGA-II is a more common algorithm for computing the bi-objective optimization model. This study uses the augmented Chebyshev algorithm to find practical non-dominated solutions. By building an augmented model, we obtain a better non-dominated frontier so that the original two conflicting objectives can be more optimized to a certain degree. This algorithm has better solution efficiency than other algorithms, and the quality of the solution results is high.
Applying the non-dominated Pareto solution to bus schedule changes, different decision-makers with different needs because of other geographical and economic conditions, and so forth, can achieve their purpose by adjusting the weights so that the adjustment results have real benefits. The rest of this paper is organized as follows. The second section summarizes the relevant research results of previous scholars, the third section specifies the model, and the fourth section introduces the principle of the augmented Chebyshev algorithm in detail and analyzes the process of establishing and solving the dual-objective optimization model. In the fifth section, we translate and compare two different algorithms based on actual data to verify the superiority of the augmented Chebyshev algorithm. Finally, the conclusions are summarized in the sixth section.
Literature Review
Since the last century, researchers have been studying the optimization of public transportation interchanges one after another. With respect to research subjects, bus interchange research predates urban rail transit because of bus systems’ more general and widespread role in urban transportation. In contrast, urban rail transit systems are more specialized and specific to certain cities. Research on the bus interchange has focused on bus stop planning, optimizing interchange strategies, and improving operational efficiency. Some early papers focused on the patterns of passenger transfer behavior, such as Zahir et al. ( 3 ) who, through field surveys, studied passenger arrival patterns at stops, bus departure times at terminals and stops, and stopping times. Attention is also paid to the problem of interchange station location and planning, for example, Chien et al. ( 4 ) combined geographic and demographic information to obtain information such as the optimal number of bus routes and their locations using genetic algorithms. More papers focus on the study of interchange time and efficiency, such as Bookbinder and Désilets ( 5 ), who focus on interchange optimization considering the effect of interchange time randomness, while Belletti et al. ( 6 ) and Ismail and Ang ( 7 ) both aim to weigh the interchange between buses through the rational scheduling of bus vehicles and crew. Ismail and Ang ( 7 ) even set the objective model of maximizing revenue and minimizing operating costs and fleet size by scientific methods. Research on rail transit interchange started relatively late, focusing on passenger mobility and urban rail transit line design. For example, Zheng et al. ( 8 ) explored the walking time pattern of interchange passengers in stations from a statistical perspective, using Beijing rail transit as an example. Blanco et al. ( 9 ) aimed to reduce operating costs and achieve better passenger guidance by optimizing rail lines and schedules, which will undoubtedly entail a huge engineering effort. Optimizing schedules is certainly a more realistic research direction when urban rail lines are built, so Wong et al. ( 10 ), Xu et al. ( 1 ), Yin et al. ( 11 ), and Chen et al. ( 12 ) conducted research in this way. Still, they have built different objective models or solution methods. Wong et al. ( 10 ) considered the minimum transfer waiting time for all passengers and develop an optimization-based heuristic algorithm for model calculations. Xu et al. ( 1 ) wanted to reduce passenger wait times and rail vehicles’ energy consumption during peak and off-peak hours. Yin et al. ( 11 ) not only considered the problem of minimizing the waiting time for urban rail transit transfers but also wanted to satisfy the need for minimum operating costs and developed a Lagrangian relaxation-based heuristic algorithm to optimize rail vehicle schedules. Chen et al. ( 12 ) solved the single-objective model problem of more successful passenger interchanges by the genetic algorithm and Dijkstra algorithm. Over time, the study of bus–rail interchanges has evolved to a comprehensive perspective, and researchers have begun to focus on the following areas. (a) Integration of bus and urban rail transit, such as considering the overall operating cost, for example, Chien and Schonfeld ( 13 ) used a continuous substitution method to find the optimal solution of the objective function to minimize the overall cost of the bus and urban rail transit network. As well as considering the accessibility of the interchange process, a related study using regression models was conducted by Wang et al. ( 14 ). (b) Optimizing the interchange strategy. Zhao and Tan ( 15 ) conducted a study on interchange efficiency from a microscopic perspective but did not propose a specific approach to solve the model. Wang et al. ( 16 ) considered macroscopic spatial topological relationships to study adjustments related to interchange bus routes along rail transit completion, although this will undoubtedly face cumbersome planning problems. (c) Enhancing the passenger experience. In today’s human-centered world, this is undoubtedly the focus of current research, most of which aims to reduce passenger travel time or transfer waiting time by conveniently adjusting schedules, thus increasing passenger satisfaction. Most studies have targeted this, for example, Shu-xia et al. ( 17 ) studied the average waiting time for urban rail transit transfers to conventional buses by considering factors such as platform distance and pedestrian walking speed. Zhang and Liu ( 18 ) used a hybrid genetic algorithm and a hill-climbing algorithm to solve the single-objective model with minimum total passenger travel time. Ren and Ouyang ( 19 ) also considered the rail inter-district transport capacity and solved it using the Cplex solver, although this approach tends to be time-consuming. Tian-wei et al. ( 20 ) considered the issue more deeply, built a multi-objective optimization model with minimum total passenger waiting time, total number of moment adjustments, and total moment adjustment time, and used the NSGA-II combined with simulation methods to solve the model. Wang et al. ( 21 ) considered a special case: the interchange problem in the case of sudden disruption of urban rail transit operation, aiming to reduce the interchange waiting time and avoid exchange failure, and used an improved simulated annealing algorithm for the case study.
With respect to research methods, it is easy to see that in the beginning, the research on interchange optimization of public vehicle schedules was mainly focused on building single-objective models, which aim to optimize a specific objective of the interchange process, such as minimizing the interchange time of passengers, minimizing the total cost of interchange, and so forth. The trend in research is now to consider multiple objectives to optimize interchange tasks in a more comprehensive and integrated manner. Model computation is attempted using, for example, linear programming, integer programming, heuristic algorithms, metaheuristic algorithms, and so forth. For example, Tang et al. ( 22 ) combined the genetic algorithm and simulated annealing algorithm to solve the problem of minimizing passenger waiting time and bus operation costs. Li et al. ( 23 ) used a genetic algorithm to calculate a bi-objective optimization model with minimum travel time along the bus route and full passenger waiting time at the stop in the bus transfer problem. Bie et al. ( 24 ) developed a multi-objective optimization model for minimizing the sum of departure time delay, energy consumption, and transit procurement cost in a transit transfer study and solved it using the NSGA-II. Han et al. ( 25 ) proposed a bus schedule dynamic optimization model with the objective function of minimizing bus operation cost and passenger travel cost, which was solved using the advanced adaptive NSGA-II (AANSGA-II). The NSGA-II is a meta-heuristic algorithm based on a genetic algorithm, and it is not difficult to find that it is widely used in the above multi-objective optimization permutation problem. Still, it may inevitably have issues such as convergence to locally optimal solutions and slow convergence, so more computational methods must be explored.
With the rapid development of information technology, research on bus and urban rail transit interchange has begun to focus on the application of technologies such as intelligent transportation systems (ITSs), big data, and smartphone applications, and researchers have started to explore how these technologies can be used to improve the efficiency and convenience of interchange. Transfer recognition is the basis of passenger trip recognition. It has essential research significance for multi-modal transportation connections, which generally require obtaining travel origin–destination (OD) data through integrated circuit (IC) card data and judging the transfer behavior in space and time. Trépanier et al. ( 26 ) derived the IC card data based on trip chains and interchange strategies for the off-board stations, and analyzed the line network passenger flow based on the OD data. Jang ( 27 ) used IC card data to evaluate the characteristics of travel time, interchange, and travel time distribution of passengers in multiple travel modes and finally analyzed the interchange behavior of passengers between particular areas. Munizaga and Palma ( 28 ) developed a multi-modal public transportation network travel OD derivation model based on IC card and Global Positioning System (GPS) data and identified interchange stations by extrapolating distances with interchange times. The study of interchange identification can be used to obtain accurate information on passenger travel OD, which can be used to analyze and optimize the operation of buses and urban railways. Therefore, this study conducted a transfer study using IC card data.
Model Formulation
In this section, we introduce a new dual-objective optimization model with minimal transfer time–bus moment changes to balance the depreciation of the overall transfer time for urban rail transit-to-bus transfer passengers while ensuring that the bus moment changes are not too significant. Before we formulated the model, for simplicity of modeling, the model used the following assumptions to ensure the reliability of the model formulation:
the upstream and downstream lines of conventional buses and rail transit are independent research objects, and only the interchange stations in the sequences are considered;
the exact route runs the same type of bus vehicles, running at the same speed and specific fleet size, ignoring the waiting time after the bus arrives and the time required for passengers to get on and off the bus;
the number of bus departures during the study period is known, and the transfer passengers randomly select the next bus from the bus routes that stop at the station as the transfer object.
Notations and Parameters
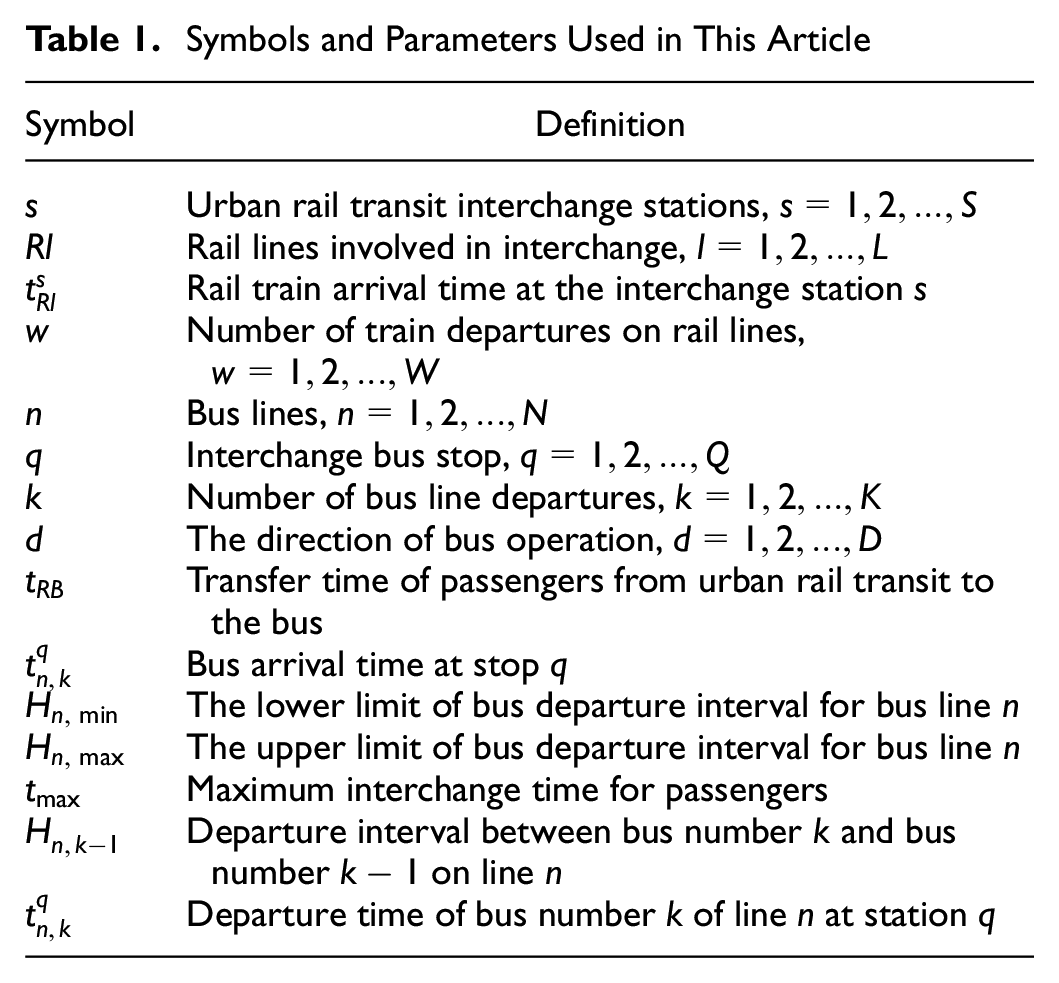
This section lists all the relevant notations and parameters to build and describe the model we need and the problem under study. Table 1 shows this section’s complete list of symbols and parameters.
Symbols and Parameters Used in This Article
Decision Variables
In the model we developed, the bus departure interval and the bus departure time at the interchange station are used as decision variables, which are as follows.
Objective Function
Minimum Transfer Time
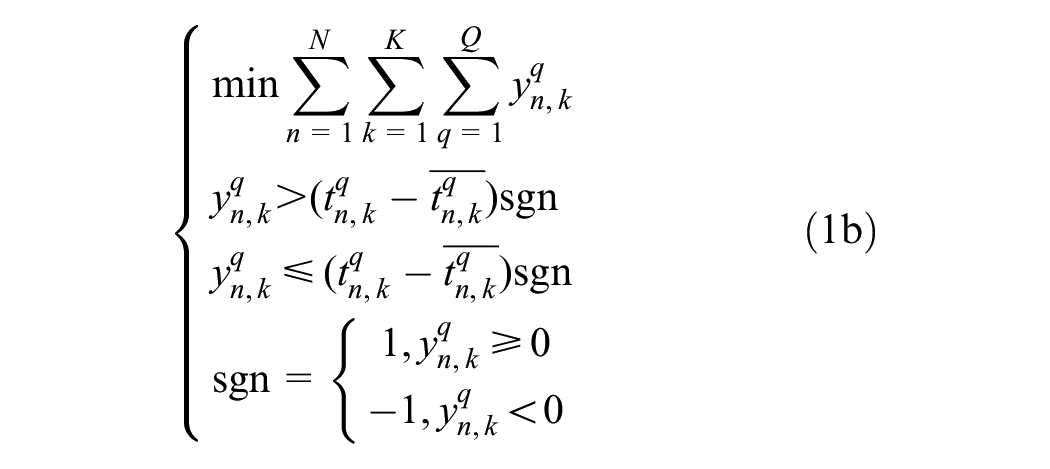
Coordination between conventional and rail transit can only be achieved by providing a reliable bus operation service. Minimal bus schedule changes have the most negligible impact on existing bus operations. To avoid large fluctuations in the departure interval during the schedule adjustment process, which would affect passengers riding at other stops on the route, the minimum bus schedule change is used as an objective function:

In Equation 1a, to facilitate subsequent algorithmic operations, let
Minimum Transfer Time
The time consumed by passengers to get off the rail train, walk to the platform of the connecting bus, and finally get on the connecting bus is called the transfer time of passengers, which can be expressed as

Schematic diagram of interchange time definition.
With advanced ITS technology, it is easy to obtain information on the number of passengers participating in rail-to-bus transfers and their respective transfer stations during the same period from the IC card data. The number of interchanges from the urban rail transit station

i. The transfer time of a single non-stay passenger starts from getting off the urban rail transit and ends when the bus arrives at the transfer station, and the transfer time is expressed by Equation 3:

The number of all non-stay passengers is denoted as

So, the non-stay passenger transfer times are found by Equation 5:

ii. The transfer time of a single stranded passenger starts from getting off the urban rail transit. It ends when the

The symbol
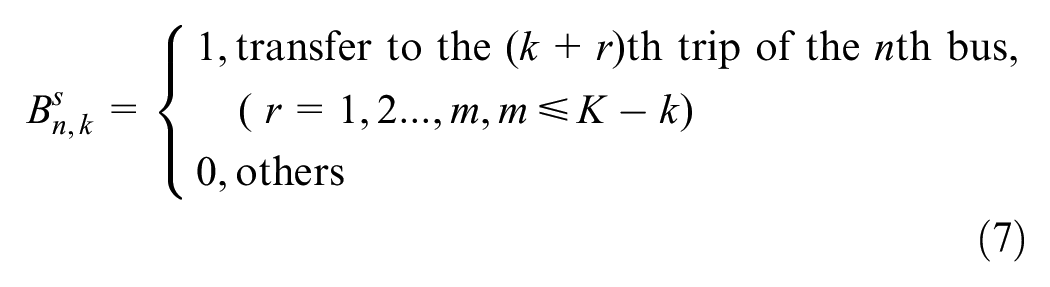
The number of passengers in this segment is expressed as

So, the stranded passenger transfer times are obtained from Equation 9:

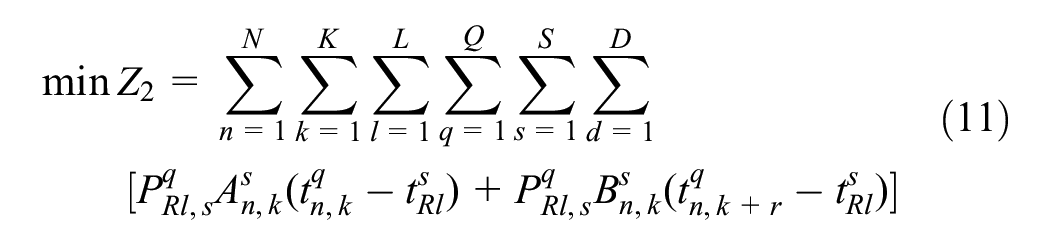
The total transfer time for all transfer passengers must add up the transfer time for non-stay and stay passengers and is expressed by Equation 10:

The constraint function that minimizes the total permutation time in Equation 11 is our second objective function:
Constraints
In this section, some conditions related to bus schedule development are described to adjust bus schedules. There are several constraints described below.
(a) Maximum and minimum constraints on the departure interval
The departure interval between any two adjacent bus vehicles on the

(b) Number of departures constraint
During the study period, the number of departures of the

(c) Maximum interchange time constraint for passengers
Let the maximum transfer time of passengers be

(d) Passenger interchange constraint
The maximum number of interchange passengers per rail trip is limited to a certain number of regular bus trips:

where
Overall Statements
Our dual-objective model with minimal changes in transfer times–bus moments is realistic. On the one hand, we strive for a more reasonable connection between urban rail transit and bus, to improve the level of public transportation services, and for passengers to have a better interchange experience with minimal overall interchange time, which is achieved by adjusting the bus departure schedules at each station, but this change is not arbitrary. Otherwise, it will increase the discomfort of bus drivers and passengers who often participate in interchanges, which is unrealistic. The next issue we will discuss is reconciling these two conflicting objectives while satisfying certain constraints, that is, finding reasonable algorithms for solving the problem and getting solutions that benefit both goals.
Algorithms
In studying bi-objective optimization problems, the final optimal solution is often an optimal set of keys, forming a Pareto front. To find the answer with better adaptability, weighing the two objectives in different situations is a crucial problem for research in multi-objective optimization problems. To this end, in this paper, we propose an augmented Chebyshev algorithm to find a better convergent non-dominated solution set and obtain the Pareto front of the problem for the above dual-objective model with a minimum bus schedule change and minimum transfer time.
Overview of the Augmented Chebyshev Algorithm
The traditional Chebyshev algorithm is insensitive to
Extreme Value Point
Based on the minimum value obtained from the previous dual-objective optimization model, the minimum value is used as the minimal value of the non-dominated frontier, that is, (



Quantification
Since the two objective functions of the bus schedule change and transfer time are measured in different units, the linear mid-threshold method is used to avoid the influence of dimensionality of the objective function values before applying the extended Chebyshev algorithm. It transformed into a unified index evaluation value using the tremendous and minimal values calculated earlier. Meanwhile, the objective function value is the specific formula given in Equation 18:

Augmentation Model
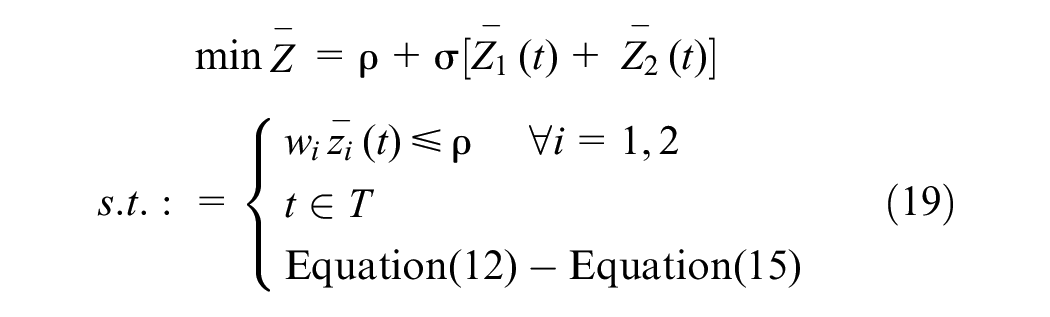
Using Chebyshev’s algorithm, the bi-objective model is transformed into a single-objective incremental model by adding a
Specific Implementation Steps of the Algorithm
The exact steps for solving the problem using the augmented Chebyshev algorithm are as follows.
Step 1: Calculate the minimum value. Optimize only objective (1) to solve the original model to find the optimal urban rail transit connection scheme
Step 2: Calculate the maximum value. Based on the dictionary sequence method of Equation 16, add the constraint of
Step 3: Dimensionless transformation of the objective function value. Through the method of thresholding in a straight line, the objective function value is transformed into an objective function value between 0 and 1 by taking the extreme and minimal values of the previous two objective function values to eliminate the interference of the dimension.
Step 4: Find the non-dominated solution. Firstly, the value of the penalty factor is determined. The penalty factor

Flow chart of the augmented Chebyshev algorithm.
Numerical Example
Illustration of the Calculation
We obtained the IC swipe card data about Shenzhen bus and rail transportation in December 2016. Meanwhile, after strict data screening and pre-processing, we select specific day data, for instance, validation. Shenzhen 66 Bus Road has five bus stops near access to four different metro stations, including the first bus stop, three terminal stations, and the last station, as shown in Figure 3. The bus stops numbered from 1 to 5 are the Window of the World, Baishizhou 3, Xili Fating 2, the zoo station, and Wangjingkeng Country. The average time for each bus stop to run to the next stop, the total number of interchanges per day at each stop, and the number of interchanges in directions 1 and 2 are shown in Tables 2 and 3, with each stop marked virtually. The operation period is from 6:00 a.m. to 11:00 p.m. In that period, 125 buses, including the direction from site 1 to site 5, had 1764 interchange passengers. This paper mainly studies the interchange of sites 1–5, where site 1 is the first station and site 5 is the terminal.

Shenzhen 66 Bus Road and urban rail transit connection diagram.
Time Period of Bus Operation for Each Station

Interchange Data of the Four Stations

Note: NA = not available.
We mark whether a transfer passenger is a stranded passenger (0,1) based on the data of getting off the urban rail transit and getting on the transfer bus, and mark the order of departure of the previous bus from 1 to 125, where we assume the longest and shortest transfer time from the urban rail transit to the bus is shown in Table 2, and we believe the bus departure interval is 3–20 min. For stranded passengers, the default is to take the next bus. Table 4 shows the shortest transfer times from urban rail transit to bus after our changes.
Minimum Transfer Time From Urban Rail Transit to the Bus

Because of the incompleteness of each station’s departure data and the difficulty in determining them, this paper fits the departure time of a station based on the original departure, and the results show that it belongs to a normal distribution. Then, this normal distribution is used to randomly generate 125 departure times for four stations in direction 1 and 125 departure times for four stations in direction 2. Because the fitting is based on historical data and then the departure times of the four stations are estimated, the random variation of the departure times of the stations is more reasonable for solving the optimal solution of the dual-objective model of the original problem.
Calculation Results
In this paper, the bi-objective model with minimum bus schedule changes and minimum transfer time is programmed in Cplex software, and the data of each arithmetic case is substituted to solve its optimal solution. In the algorithm arithmetic example, the same model is optimized in directions 1 and 2, respectively. This paper shows that the exact algorithm has a good test effect for the rail–bus connection model. In the parameter setting, the value of
From the results of the Cplex software run, it can be seen that in direction 1, the values of penalty factors
Calculation Results of Direction 1 of the Augmented Chebyshev Algorithm

Calculation Results of Direction 2 of the Augmented Chebyshev Algorithm
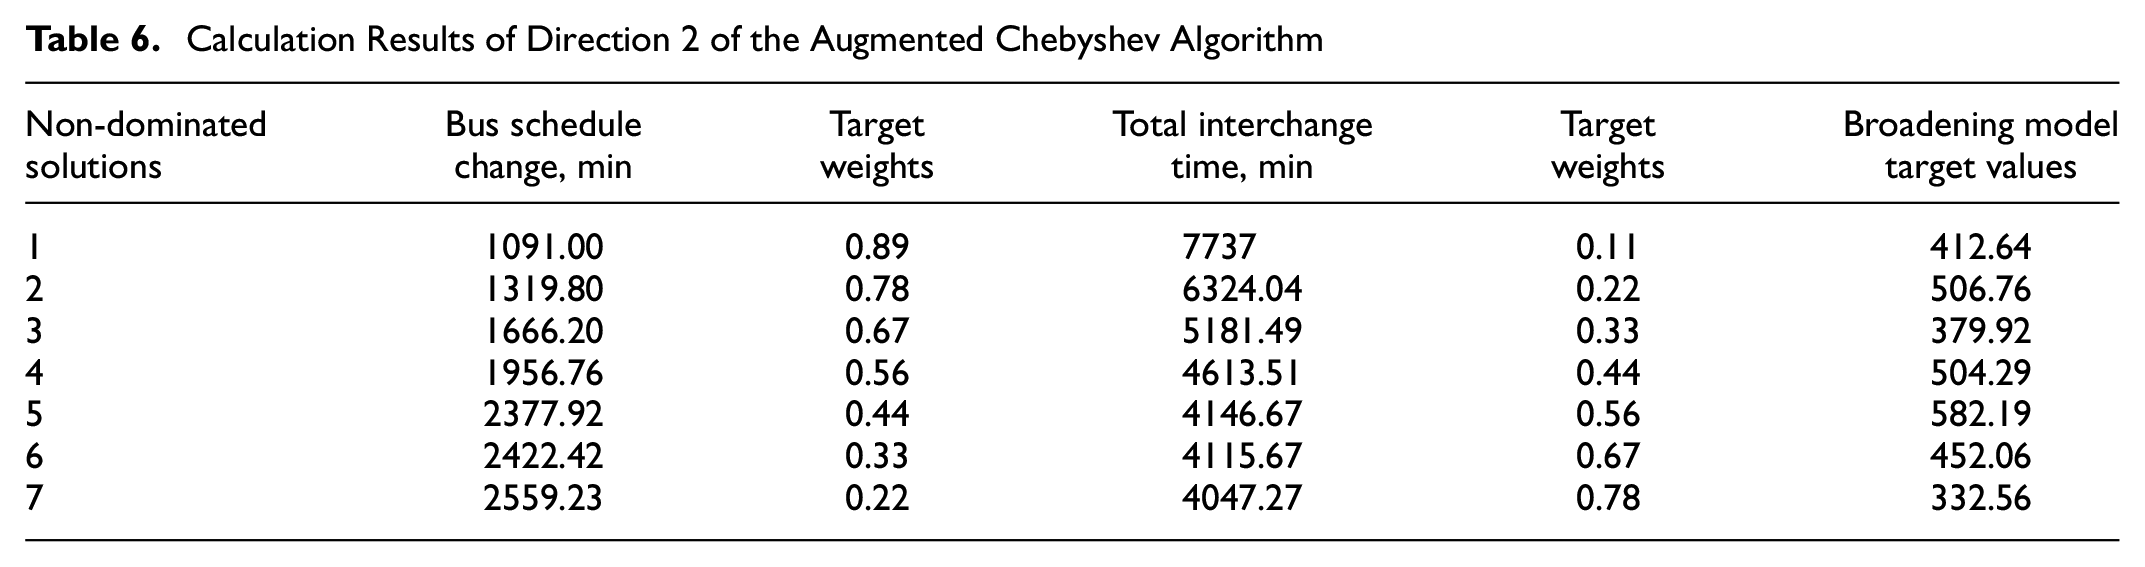
From Tables 5 and 6, it can be seen that in direction 1, when the weight of target 1 is
Selected Bus Schedule Changes for Four Stops in Direction 1

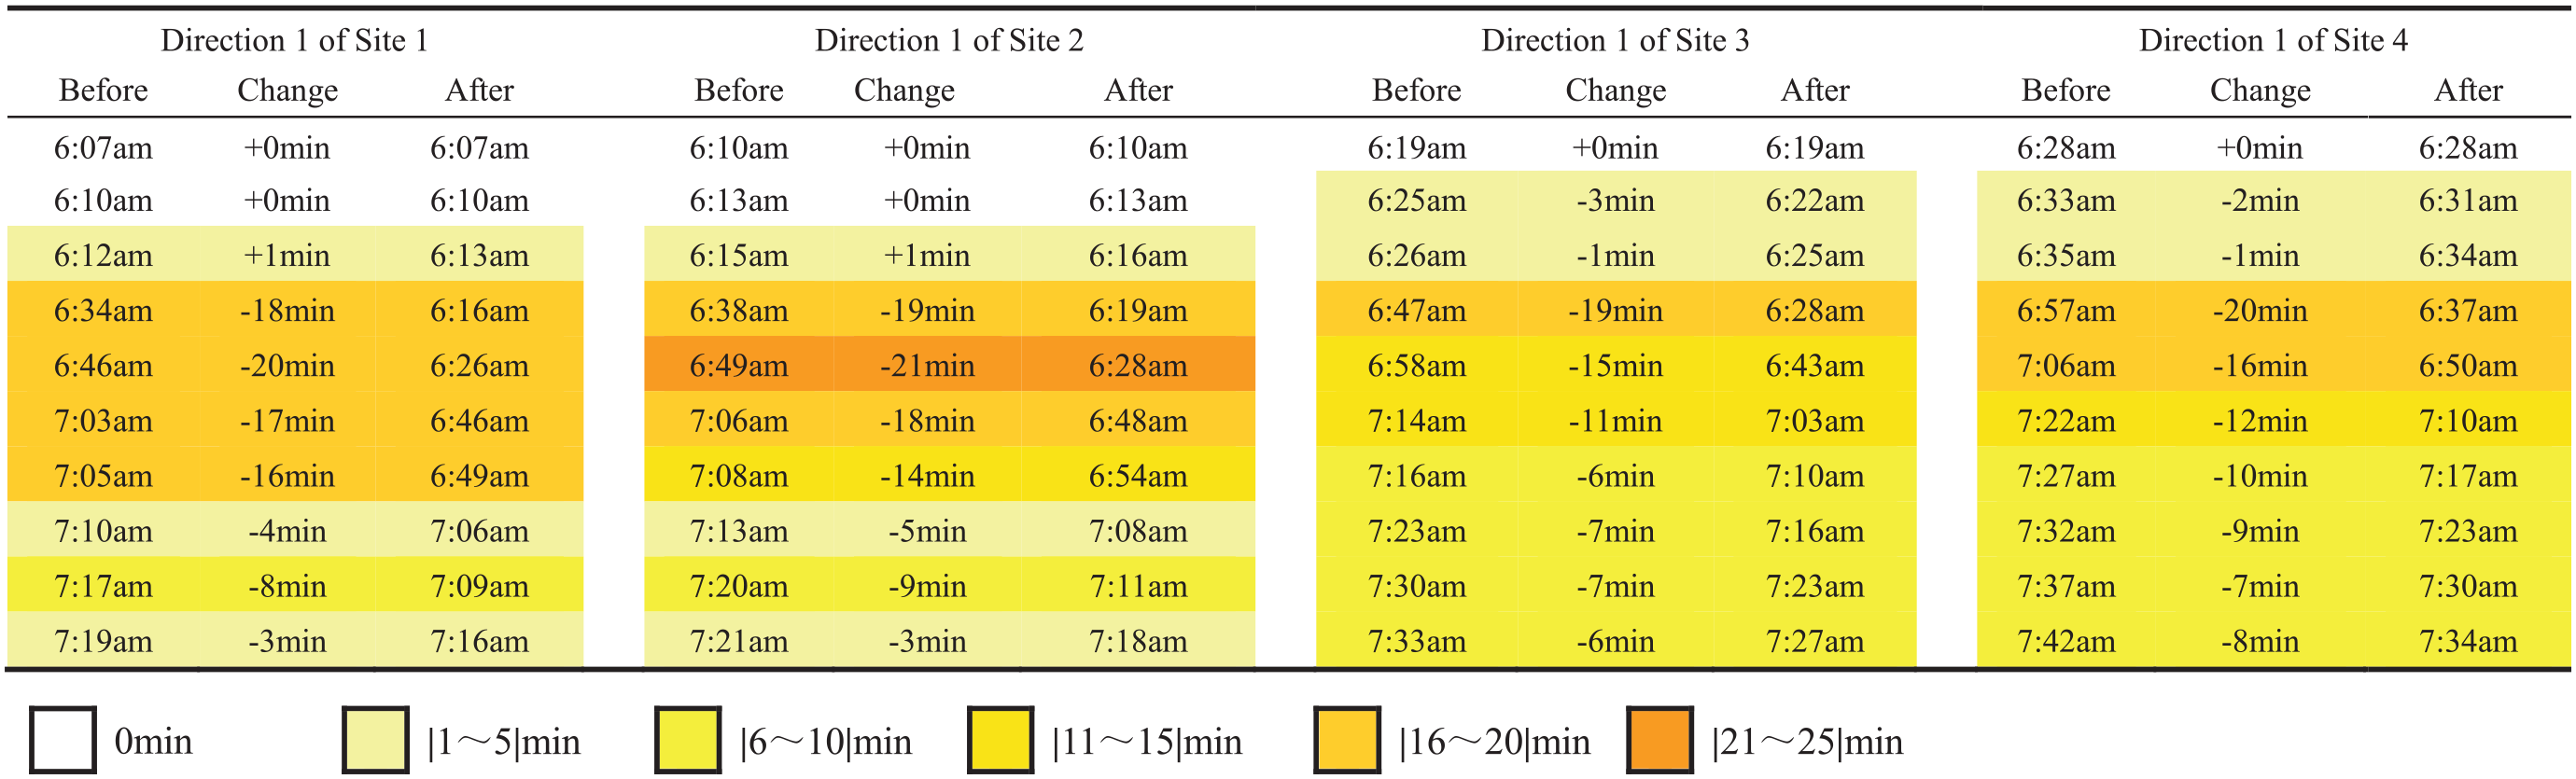
Selected Bus Schedule Changes for Four Stops in Direction 2
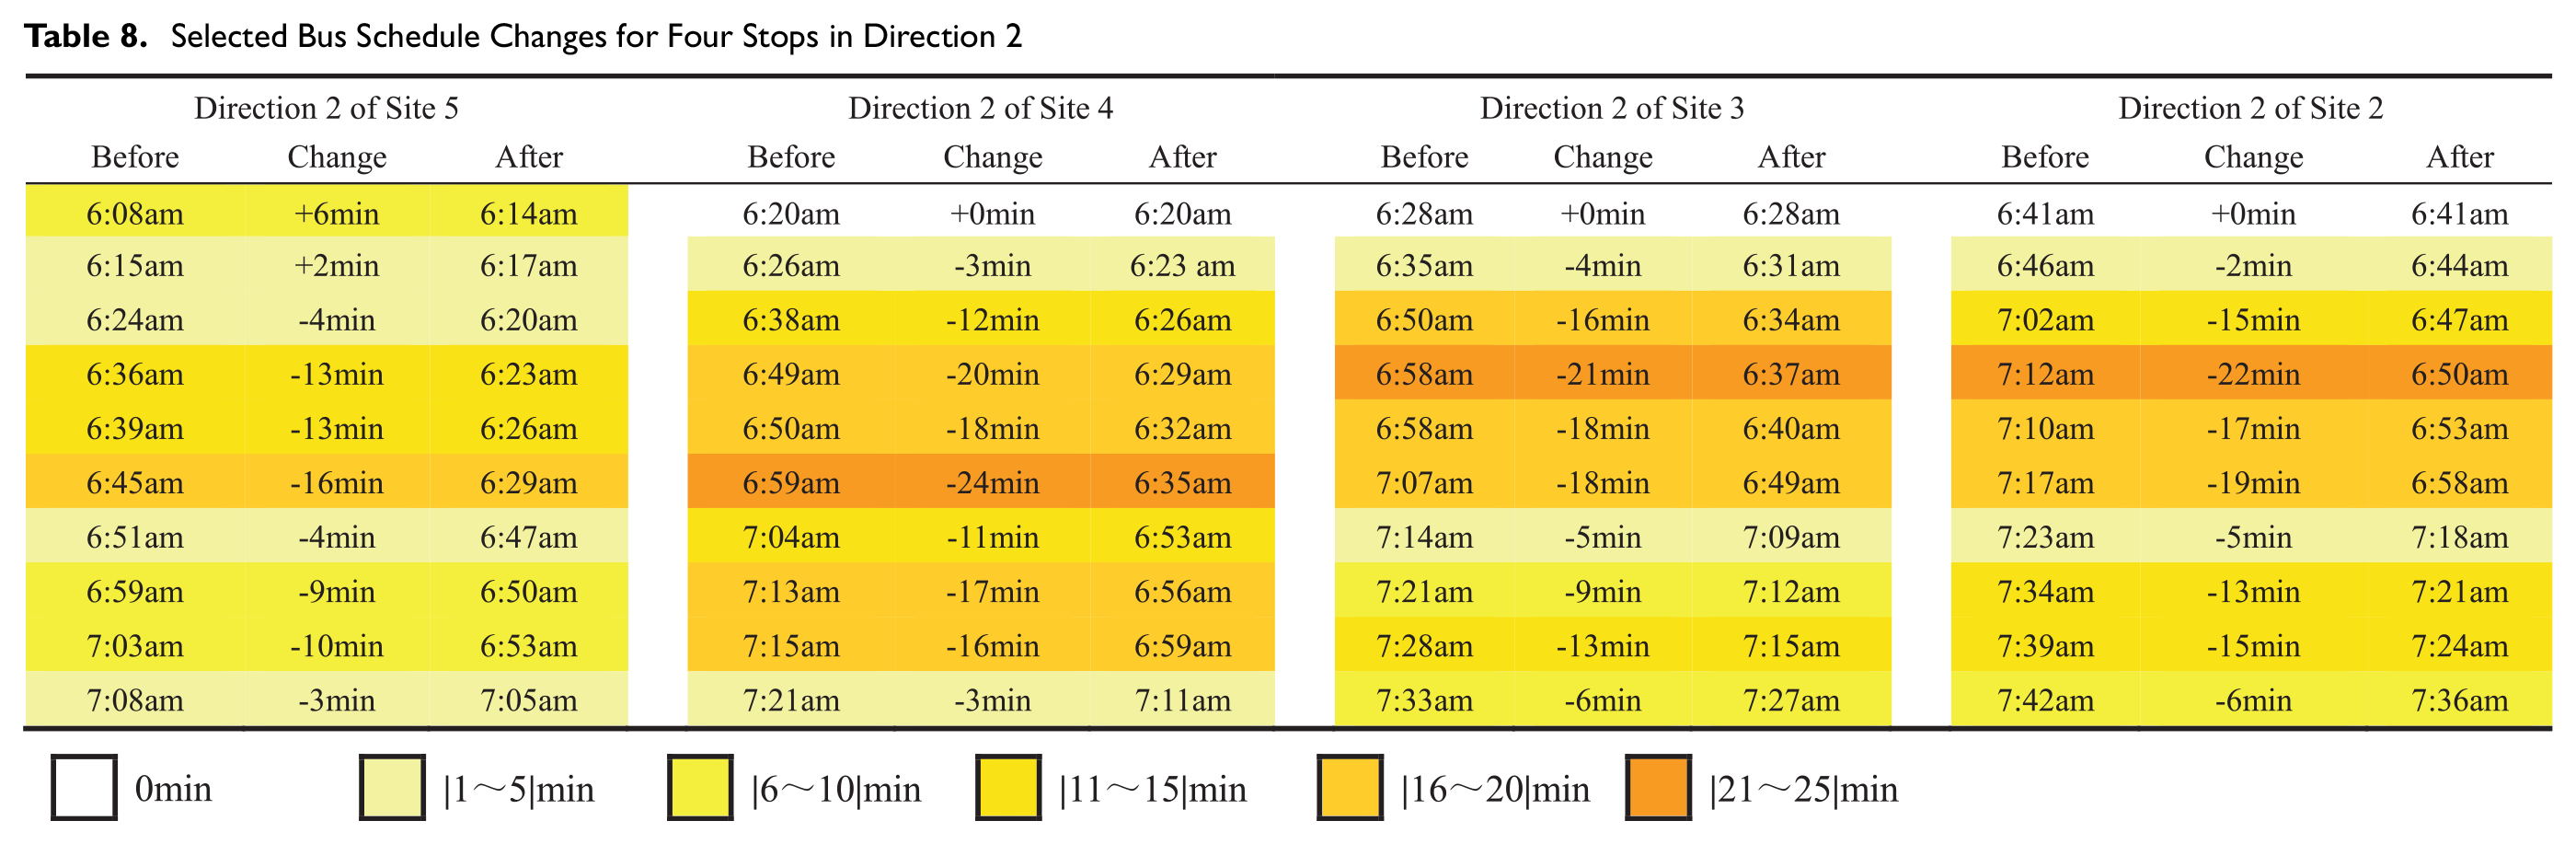
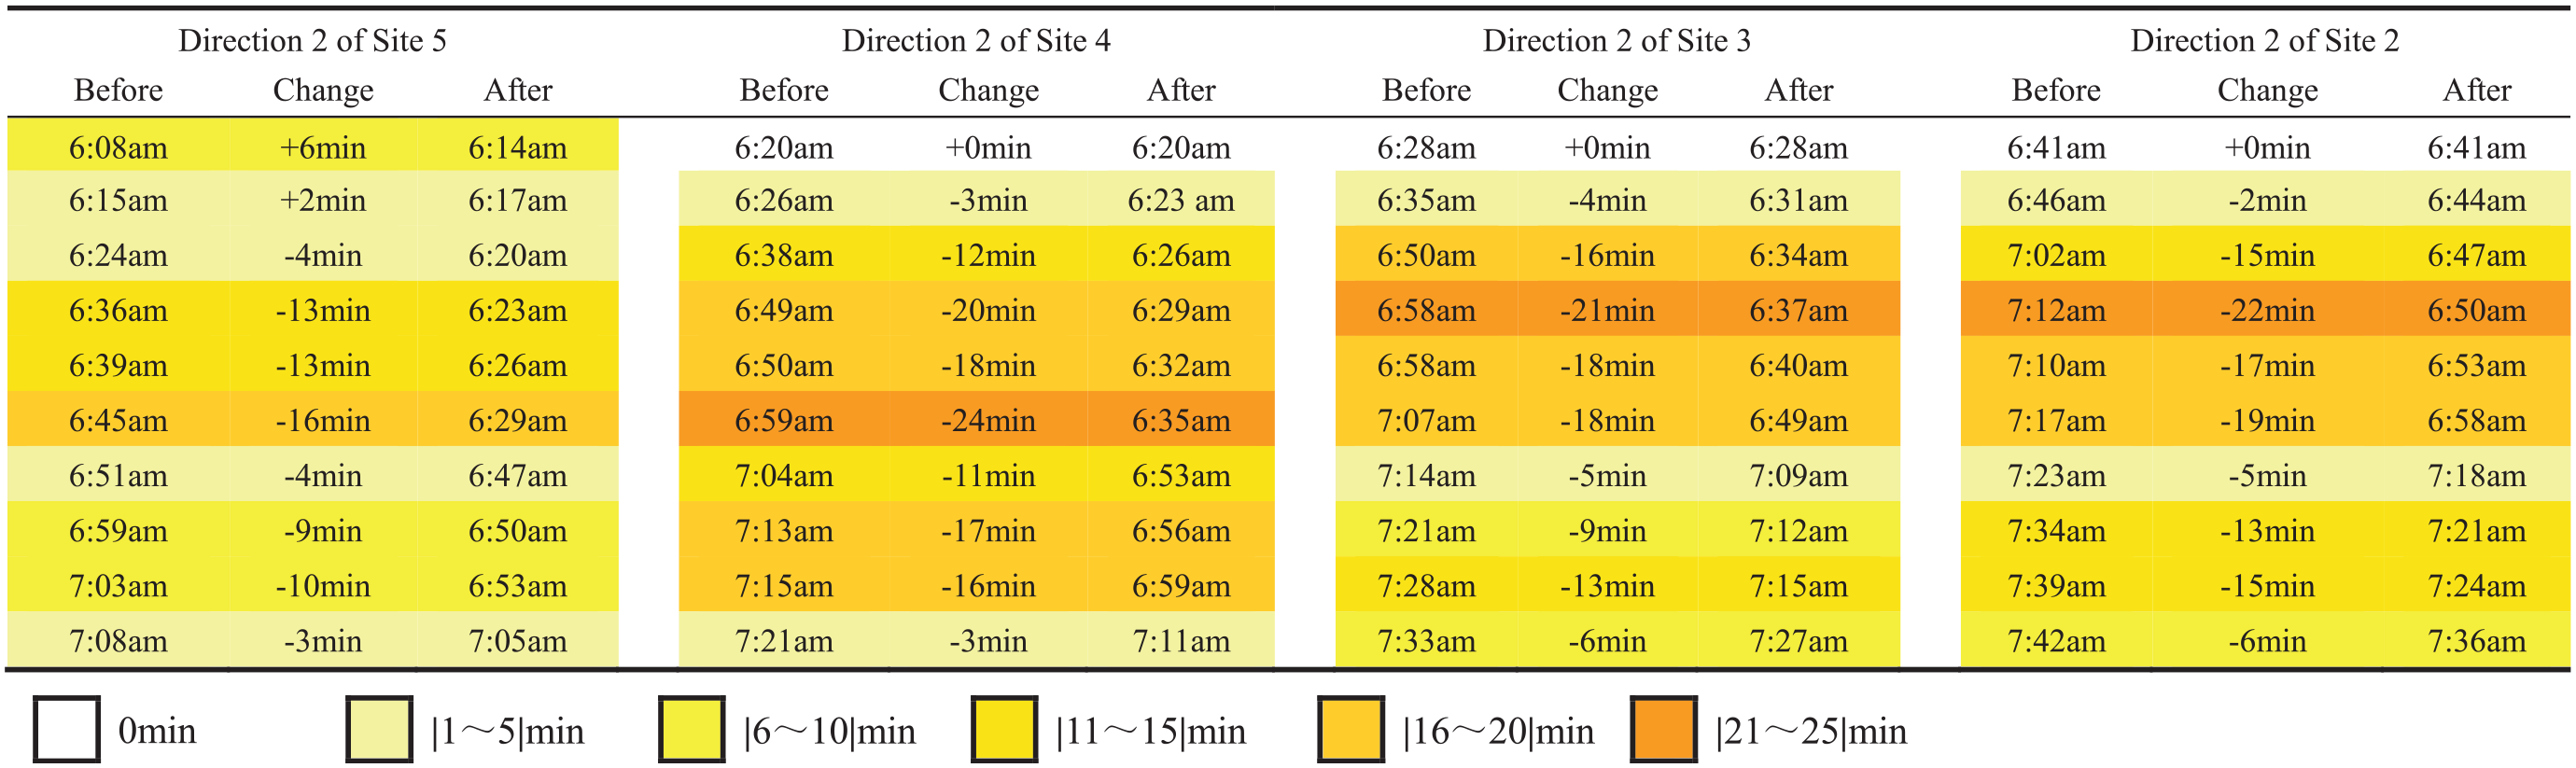
In addition, because of the high concentration of passengers during the morning and evening peak hours, government departments respond by increasing the number of operating vehicles. To further understand the situation of each station at a specific moment, we conducted statistics on the changes in bus schedules at each of the four stations in direction 1, as shown in Figure 4. As shown in Figure 4, the bus schedules of the four stations in direction 1 are changed more in the morning peak and the last bus. It is easy to understand that in recent years, the urban population has been growing, and more rural people are moving to the city to work, which leads to an increase in the number of passengers going to work in the morning and an increase in the number of people transferring to the bus. Because of the high concentration of passengers during the morning and evening peak hours, government departments will respond by increasing the number of vehicles in operation. So, the previous bus schedule has not been able to adapt to the situation today, and there is a need for appropriate adjustments to the bus schedule to alleviate the stranded bus platform transfer passengers.

Distribution of bus schedule changes at the four stops in direction 1.
In practice, the weighting of these two objectives is chosen as the best solution based on the decision-maker’s preference and the location of the bus stop. When the decision-maker prefers the most minor bus schedule change, the weighting factor
The passengers at this station tend to pay more attention to the cost of travel and have a greater demand for taking the bus. Therefore, decision-makers will pay more attention to the goal of minimal changes in the bus schedule to accommodate the needs of this type of passenger, so the weight factor of objective (1) is significant, and the solution corresponds to the first or second non-dominated solution chosen. The Xili Fating 2 and zoo sites have many parks, attractions, squares, and other entertainment places in Shenzhen, located in the city center. At the same time, they are adjacent to universities’ business and technology parks. Most of those who take the bus are tourists, office workers, and working people. They pay more attention to time efficiency and hope that the transfer time is shorter, so the weight of goal two is a relatively large. At this time, the decision-maker may choose the seventh or eighth non-dominated solution corresponding to the solution. Finally, the Wangjingkeng Country site is located in residential areas, as the ride is mostly for older adults. It is influenced by the habits of users, who prefer to follow the previous way and time and, if the bus schedule changes are significant, they often cause discomfort to elderly passengers; this should make goal one better so that the bus departure time changes as little as possible. At this point, decision-makers often choose the first or second non-dominated solution corresponding to the solution.
Comparison of Algorithms
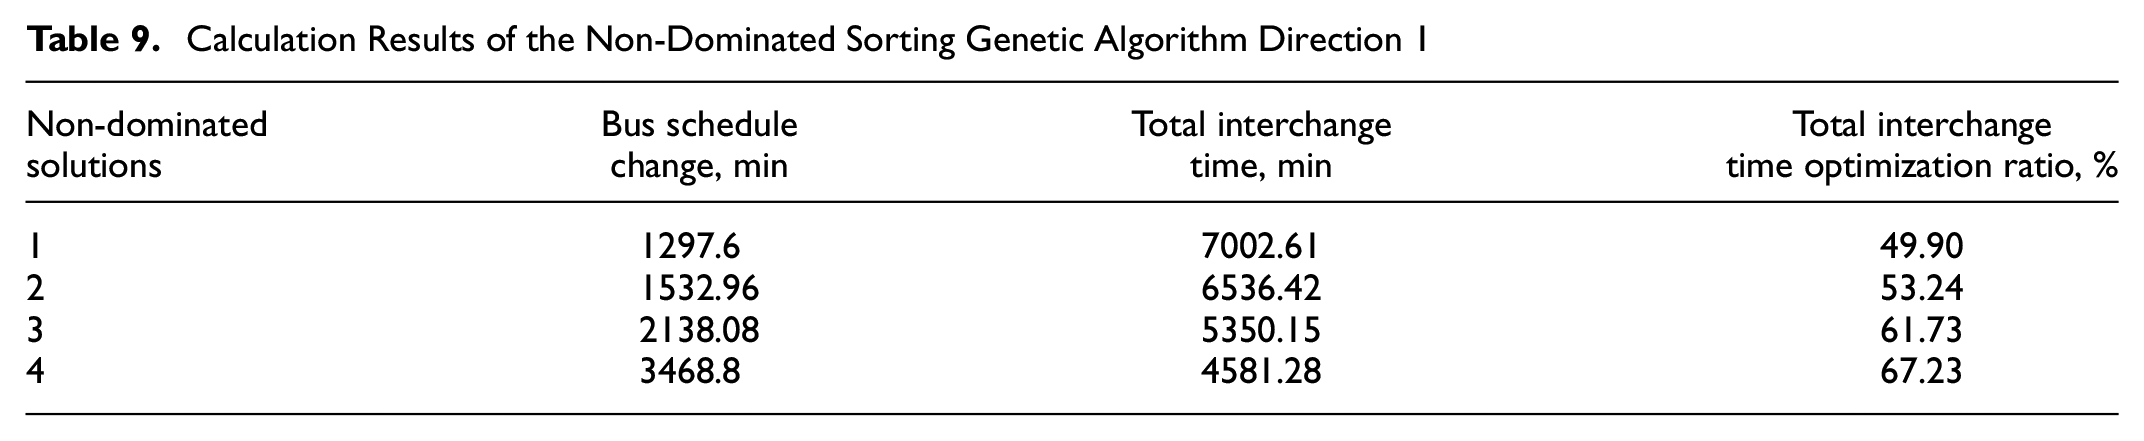
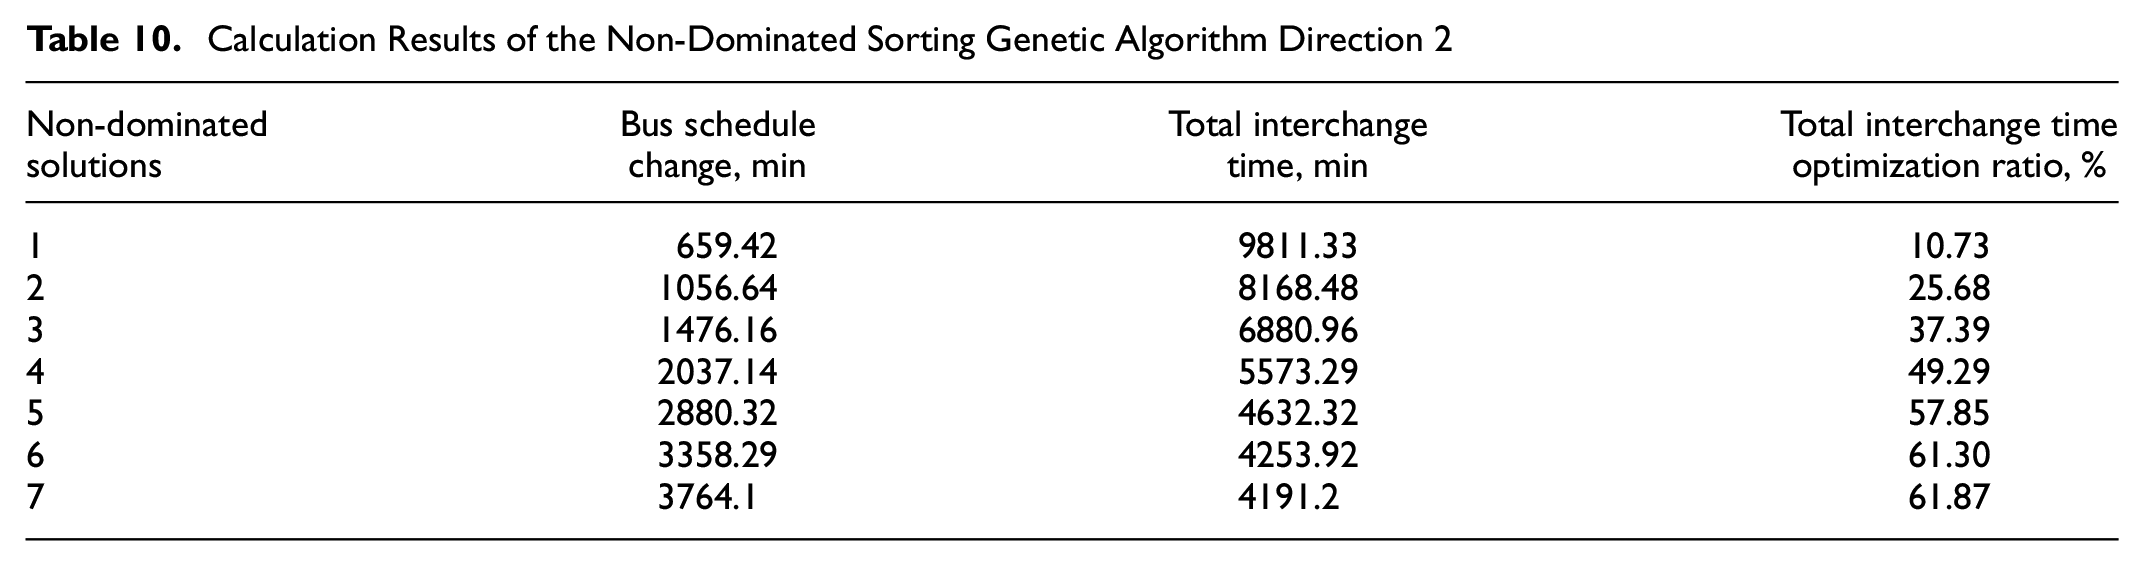
To verify the effectiveness of the augmented Chebyshev algorithm, the same model is tested in this paper using the multi-objective NSGA-II, which we invoked Tian et al. ( 33 ) to run the multi-objective optimization model of this paper and compare it with the augmented Chebyshev algorithm. Among them, the relevant parameters of the NSGA-II are set as follows: the population size is 200, the number of iterations is 100 million, the cross-variance probability is 0.85, and the variance probability is 0.15. Finally, four representative non-dominated solutions are obtained in direction 1, and seven in direction 2 represent non-dominated solutions. The results of two objective function values are shown in Tables 9 and 10.
Calculation Results of the Non-Dominated Sorting Genetic Algorithm Direction 1
Calculation Results of the Non-Dominated Sorting Genetic Algorithm Direction 2
In the case test, the comparison results of the two algorithms to explore the set of representative non-dominated solutions are shown in Figures 5 and 6. AWTA represents the augmented Chebyshev algorithm and NSGA-II describes the genetic algorithm. It can be seen from the figures that both algorithms can find non-dominated solutions. However, the augmented Chebyshev algorithm finds more representative non-dominated solutions than the genetic algorithm, and it is significantly better than the genetic algorithm with respect to the quality of solutions. From here, it can be seen that the NSGA-II has too much change in the departure time of the target bus schedule in the problem model, which also leads to the negative effect of the long total passenger transfer time; therefore, although the NSGA-II can obtain four representative non-dominated solutions, the optimization effect is not apparent even with significant changes in the bus schedule. This is reflected in the NSGA-II not being robust to the problem of optimizing models for rail–bus connections. It is not the optimal method with respect to optimization effectiveness, and does not provide the decision-maker with a better optimization solution.

Pareto front-facing ratio for the direction 1 algorithm.

Pareto front-facing ratio for the direction 2 algorithm.
It can be concluded that using the augmented Chebyshev algorithm compared with the NSGA-II not only ensures the quality of the solution but also converges better and yields more solutions. It has a larger optimization ratio for the total transfer time, which can significantly reduce the passengers’ transfer waiting time, which has an essential impact on improving passenger satisfaction and provides a good optimization solution for the decision-maker. In addition, the solution time of the non-dominated solution of the model is 37,164.59 s for the NSGA-II and 184.80 s for the augmented Chebyshev algorithm, indicating that the traditional genetic algorithm is more complex than the augmented Chebyshev algorithm in solving the original problem model, which leads to a slower solution speed.
In summary, from the analysis of the examples in this section, it can be concluded that the improved augmented generalized Chebyshev algorithm is more suitable for solving the dual-objective rail transit connection problem than the multi-objective NSGA-II.
Analysis of Bus Schedule Changes
With the established studies on rail transit connections, there are more studies on optimizing rail metro schedules and fewer studies on bus schedule changes. This paper proposes adjustments to conventional bus schedules to reduce passenger transfer times and improve the efficiency of transfer management. Although many factors influence bus schedule changes, if there are large changes, they will not achieve the purpose of optimization and will cause dissatisfaction among bus riders, which will lead to a decrease in the number of bus riders and further increase the operating costs of bus operators. However, if the bus schedule is changed appropriately, the rail–bus connection problem will also be optimized. In this paper, the data in Tables 9 and 10 show that the total passenger transfer time decreases as the magnitude of bus schedule changes increases, and introducing a penalty factor in the incremental model improves the robustness of the model solution. It can be seen that changing the bus schedule has a significant impact on optimizing the total passenger transfer time. However, decision-makers should consider the actual situation of different stops on different routes, reasonably weigh the weight of the two objectives, and assess the operating cost of public transportation and the quality of interchange service to appropriately adjust the bus schedule to reduce the total passenger transfer time.
Conclusions
This study proposes a schedule bi-objective optimization model from two perspectives: overall passenger transfer time and bus schedule alteration, with bus departure interval and departure, which stops at each transfer station, as decision variables. Objective (1) minimizes the overall passenger transfer time, and objective (2) minimizes the bus schedule changes. This dual-objective consideration allows the study to integrate the passenger demand and operational efficiency of the transit system, which is of practical application. Then, we design an augmented Chebyshev algorithm to solve the model, which obtains the Pareto front of the problem by getting a good set of non-dominated solutions with good convergence. A group of actual IC swipe card data is used for validation, which increases the credibility and practicality of the study results. The calculated results are also compared with the conclusions derived from the NSGA-II. The results show that the augmented generalized Chebyshev algorithm is better than the NSGA-II in optimization, and the total passenger transfer time is reduced by 68.06%, which indicates that the use of the augmented generalized Chebyshev algorithm to solve this kind of bi-objective optimization model has greater advantages and application potential.
In essence, urban rail transit transfer time is regulated collaboratively between the metro and bus, so we must consider both urban rail transit and bus factors. Based on the limitations of personal competence, this study has some shortcomings, such as some possible assumptions and simplifications in model building, which may limit the accuracy and applicability of the study. Also, the quality and reliability of the IC swipe data can affect the accuracy of the results of the study. As well as solving the model, other algorithms may be more suitable for the problem, or parameter tuning of the algorithm can improve the results. Therefore, a more comprehensive selection and comparison of algorithms must be considered to ensure a more comprehensive and reliable conclusion. These limitations and shortcomings do not negate the value and contribution of the study; rather, they help us to improve further and expand the direction of the study. In future studies, we will first consider the urban rail transit’s running and departure times rather than just the bus’s departure and running times. Secondly, our analysis considers bus route interchanges only under ideal conditions, and we can continue to discuss the impact of the optimization on other non-interchange stations. Moreover, we would like to use some optimization algorithms to perform a more accurate hyperparameter search for the NSGA-II, aiming to obtain a more scientific comparison of the algorithm results. In addition, we would like to apply the model with appropriate adjustments to other optimization contexts to verify further the superiority and adaptability of the augmented Chebyshev algorithm.
Footnotes
Acknowledgements
All three authors share the full results.
Author Contributions
The authors confirm contribution to the paper as follows: study conception and design: F. Tian, J. Liang, R. Chen; data collection: F. Tian, J. Liang, R. Chen; analysis and interpretation of results: F. Tian, J. Liang, R. Chen; draft manuscript preparation: F. Tian, J. Liang, R. Chen. All authors reviewed the results and approved the final version of the manuscript.
Declaration of Conflicting Interests
The author(s) declared no potential conflicts of interest with respect to the research, authorship, and/or publication of this article.
Funding
The author(s) received no financial support for the research, authorship, and/or publication of this article.