



Abstract
Seamless, accurate, and reliable traffic information is critical for planning and operational strategies in traffic management. Urban networks are increasingly being equipped with various types of detectors to collect continuous traffic data. However, the widespread installation and management of these detectors at all intersections and road sections are limited by cost constraints and various problems. Moreover, the direct integration and utilization of heterogeneous data sources are challenging because of their distinct and interconnected characteristics. This study introduces a multimodal deep learning model, combining closed-circuit television (CCTV) and dedicated short-range communication (DSRC) data, to estimate lane-level urban traffic volumes. The proposed model employs a multilayer perceptron to extract features from each modality. These features are then fused and used as input into a recurrent neural network model that estimates the lane-level traffic volume. We present the multimodal deep learning model in three forms: (1) fusion of traffic volume, occupancy, and queue length from CCTV data; (2) fusion of traffic volume from CCTV data with travel time from DSRC data; and (3) fusion of different attributes from CCTV and heterogeneous DSRC data. In addition, we develop a single-modality model that solely utilizes CCTV data on traffic volume to compare the performance with the proposed multimodal model and identify scenarios where the multimodal approach is essential. The proposed model demonstrates significant improvements over the single-modality model, providing enhanced accuracy for higher temporal resolutions and lanes that permit left or right turns.
Seamless, accurate, and reliable traffic information is critical to traffic planning and operational strategies. Therefore, it is important to continuously collect, process, and provide traffic information ( 1 , 2 ). With the recent advancements in the data storage and data analysis technology, a vast amount of traffic-related information is being collected and processed in real-time. Presently, various types of traffic data are being collected from autonomous vehicles’ sensors as well as infrastructure detectors (e.g., vehicle detection systems [VDSs], dedicated short-range communication [DSRC], and closed-circuit television [CCTV]). This type of real-time traffic information plays a crucial role in addressing major transportation challenges by providing instantaneous and accurate data on the current state of the traffic flow. Such information serves as a key component for urban traffic planners and operators, enabling them to optimize route planning, traffic management, and emergency responses ( 3 ).
In practice, however, most volumes of traffic data from multiple sources or systems are frequently incomplete and distorted such as missing, limited, and sensor noise ( 4 ). These limitations in traffic data are caused by maintenance issues, malfunctions of traffic sensors, and restrictions on installation costs of traffic sensors. Widespread deployment of traffic detectors in the entire urban network poses a challenge because of the high installation costs ( 5 ). In addition, the recognition and collection range of the detectors is limited, resulting in a constrained spatiotemporal range of the collected data. For instance, CCTVs have a narrow spatial coverage, which can result in missing data between intersections where it becomes impossible to gather traffic information, as shown in Figure 1. Even in the case of autonomous vehicles, the vehicle sensor and roadside detectors have to work in tandem to achieve a high-level driving atmosphere. However, compared to the fast-paced evolution of the technology associated with autonomous vehicle sensors and advanced roadside detectors, research in generating missing traffic information is still lacking ( 6 ).
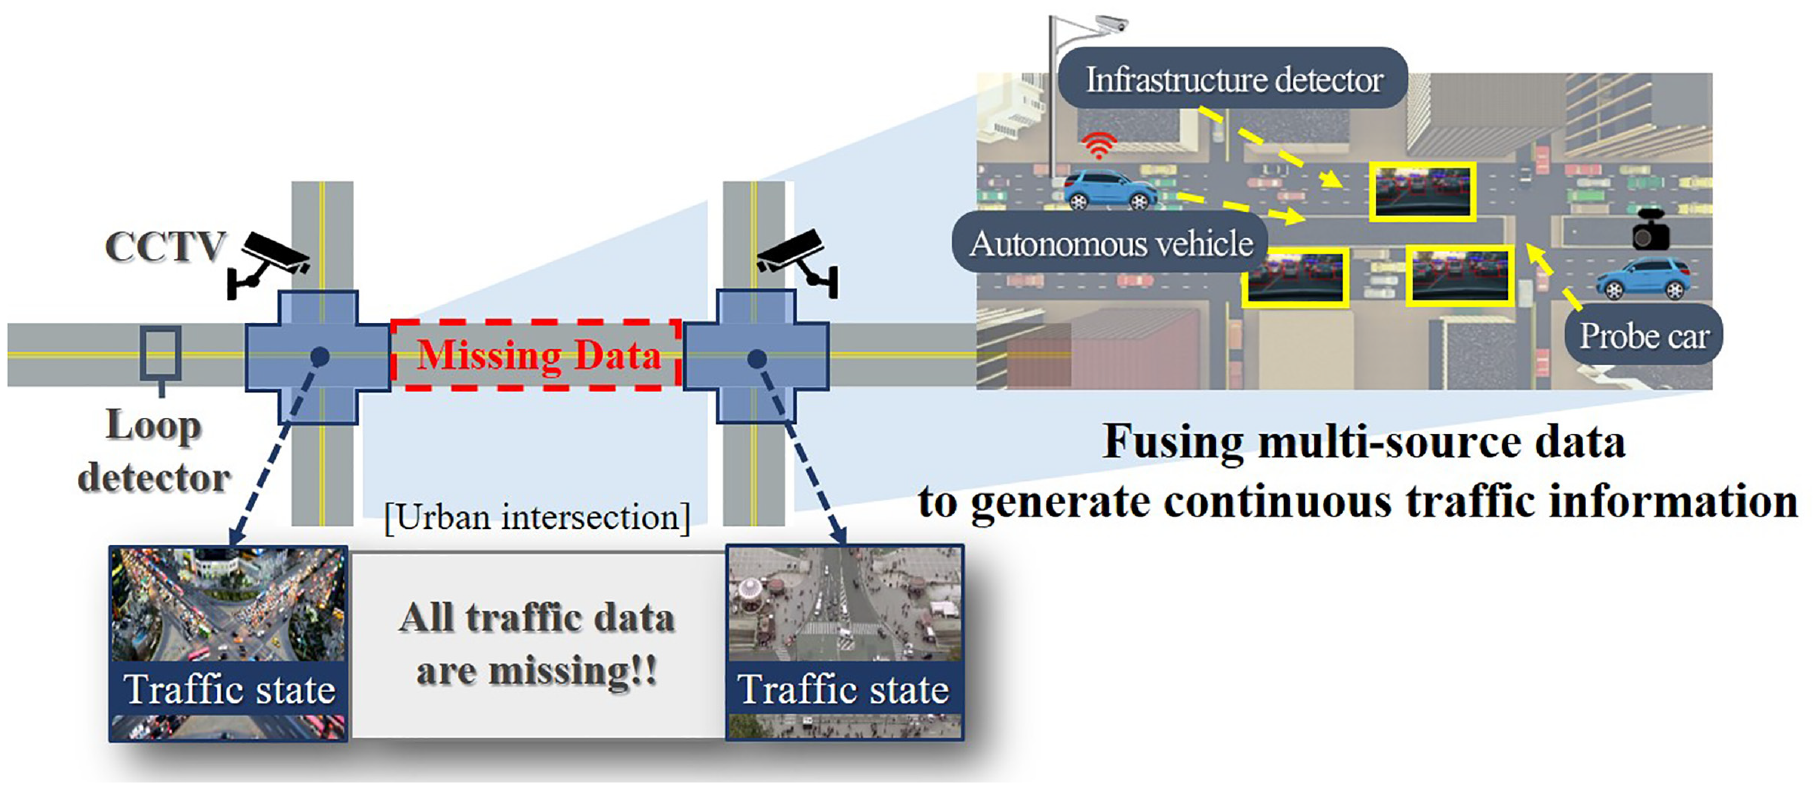
Description of missing data segments at urban intersections.
To solve these critical problems, studies have been conducted to generate accurate traffic information by fusing heterogeneous data sources. Since individual detectors have limitations, generating more accurate traffic information may be possible by fusing the multiple traffic information ( 7 , 8 ). The traffic information collected from multi-sensor data differs with respect to spatial resolution (e.g., point information or section information), form (e.g., text or image), and collection range. The data representing a common phenomenon and having these different characteristics are defined as multimodal data ( 9 , 10 ). These multimodal data hold the potential to be used as complementary information, but direct integration and utilization of multimodal data at the data level are difficult on account of their different characteristics. Therefore, multimodal deep learning models have been spotlighted as a suitable methodology for learning a common semantic space represented by multimodal data. Multimodal deep learning models use deep learning networks to fuse features extracted from each data source, automatically capturing the dependencies of multimodal data. This multimodal deep learning model generates high-resolution information and produces much-improved performance compared with the use of only a single-modality data. As a result, multimodal deep learning models are able to reduce the uncertainty of missing data and provide continuous and reliable traffic information for the decision-making process ( 2 ).
In this study, the multimodal deep learning model is applied to an urban network to estimate the lane-level missing traffic volume by fusing the CCTV data and link-based DSRC data. The contributions of this study and its applications are as follows. Firstly, cost reduction of additional installation of traffic detectors in missing data segments is achievable by generating high-accuracy traffic information through the multimodal deep learning model. Secondly, the model’s architecture allows for the flexible and adaptable incorporation of new information (e.g., social media data) without significant setbacks. While this study primarily focuses on CCTV and DSRC data, its generalizability to a wider range of multiple data sources is possible. Finally, through this model, an efficient traffic operation management strategy can be established by utilizing the generated traffic information for each lane, improving road safety by providing traffic information such as preemptive lane change guidance and alternative route suggestions. Furthermore, the expected outcomes involve a reduction in funding requirements for detectors, stemming from fewer installations and lower maintenance needs.
Literature Review
Previous studies have fused empirical data, such as missing data estimation, traffic state estimation, and traffic flow prediction, for more efficient and accurate transportation modeling. These studies focus on capturing spatiotemporal correlations by using data fusion algorithms, such as the Kalman filter ( 1 ), the Cokriging approach ( 2 ), Bayesian inference ( 3 ), and the k-nearest neighbor algorithm ( 4 ). In addition, most studies attempt to use secondary data to complement the primary data by fusing probe vehicle trajectory data (i.e., Global Positioning System [GPS] and Bluetooth data) and fixed detectors, such as traditional loop detectors ( 3 – 6 ) and license plate recognition cameras ( 7 ). Unlike existing data fusion algorithms, artificial intelligence (AI)-related algorithms (e.g., deep learning and machine learning) can perform nonlinear modeling and parallel tasks at the same time. In an environment where various data are collected in real-time, such an AI-related algorithm is needed to fuse multiple sensor data, which can yield robust results.
Multimodal models learn a common semantic subspace represented by multiple sensor data. Multimodal learning aims to reduce the heterogeneous gap between multimodal data while preserving the specific property of each modality ( 8 ). Recent studies have shown that the hierarchical heterogeneity and dependency of multimodal data can be captured automatically by using a deep learning network ( 9 – 13 ). As a result, it is possible to generate traffic information by complementing the nonlinear and non-stationary multimodal traffic data.
Researchers used the multimodal deep learning model to fuse heterogeneous information collected from a single type of sensor ( 9 – 11 ). Du et al. ( 9 ) predicted short-term traffic flow by fusing heterogeneous traffic information, such as traffic speed and travel time, along with traffic flow. The representation features of different modalities were fused through convolutional neural networks (CNNs) and gated recurrent units (GRUs) with the attention module. The proposed multimodal deep learning model showed the best performance, and the superiority of the model was emphasized by its high accuracy in peak traffic.
Of the studies using multimodal deep learning with a single type of sensor, some studies performed lane-level analysis ( 10 , 11 ). Ke et al. ( 11 ) proposed a two-stream multi-channel CNN model for multi-lane traffic speed prediction considering the influence of traffic volume. The proposed model extracted the correlation between lanes and concatenated the speed–volume features of loop detector data to predict the traffic speed accurately. Similarly, Lu et al. ( 10 ) suggested a convolutional long short-term memory model to predict the lane-level traffic speed by concatenating the traffic volume and the speed information provided by remote traffic microwave sensors. The proposed model synchronously captured the spatiotemporal dependencies and correlations of lane-level traffic flow.
In addition, previous studies have been conducted by fusing the information of similar properties from multi-sensors ( 12 – 14 ). Li et al. ( 12 ) imputed the missing value of space mean speed by fusing the space and time mean speed collected from different sensors. This study indicated that the proposed model outperformed the traditional imputation model, especially when a week’s worth of data is continuously missing. Chen et al. ( 13 ) predicted traffic events by fusing traffic event information from social media data with the traffic volume collected from the Caltrans Performance Measurement System (PeMS) data using a multimodal generative adversarial network. Finally, Min et al. ( 14 ) combined adjacent traffic speed information collected from VDS and DSRC data to estimate the traffic speed for the missing data segment in VDS data. The proposed model outperformed the arithmetic average model and single-modality model, demonstrating robust results across various periods, including peak hours.
Although these pioneering studies ( 9 – 14 ) outperformed baseline models, there are two limitations. Firstly, the use of multimodal data in existing studies is applied to highways, where traffic is in the free flow state with no intersections. On urban networks, the traffic state estimation is more challenging because of traffic signals, diverse transportation modes (e.g., pedestrians and personal mobility), and various road events (e.g., construction and crash sites) ( 6 ). The second limitation is that the existing studies did not simultaneously consider dependencies of heterogeneous information within a single type of data and dependencies of multiple sensor data.
To solve this research challenge, this study aims to estimate the missing traffic volume at the lane-level of an urban network by simultaneously fusing heterogeneous traffic information and multiple sensor data. Therefore, the proposed model can capture the dynamic traffic flow characteristics of a single data sensor and the highly nonlinear characteristics of multimodal data.
Data Description
Description of Study Site
In this study, the Daejeon metropolitan area in South Korea was selected as the study site to estimate the traffic volume for each lane in the missing data segment using a multimodal deep learning model. The Daejeon metropolitan city government established an intelligent transportation system (ITS) to solve traffic problems ( 15 ). The ITS has been installed and expanded to major points and intersections in Daejeon to collect and provide various traffic information in real-time through the operation of a traffic data warehouse. The smart intersection system collects real-time information according to the type of vehicle, the lane, and the direction of rotation through CCTV cameras and deep learning-based image processing techniques. Accordingly, it provides optimal signal time through the analysis of big data to improve the traffic flow at intersections. The spatial scope of this study includes Hanbat-daero, Seo-gu, and Daejeon. The study site has three CCTV cameras and five link-based DSRC data, and it is about 1.4 km from Link 1 to Link 7, as shown in Figure 2. The aim of this study was to estimate the traffic volume of CCTV-B Lane #5, that is, the outside lane marked as the target site in Figure 2.
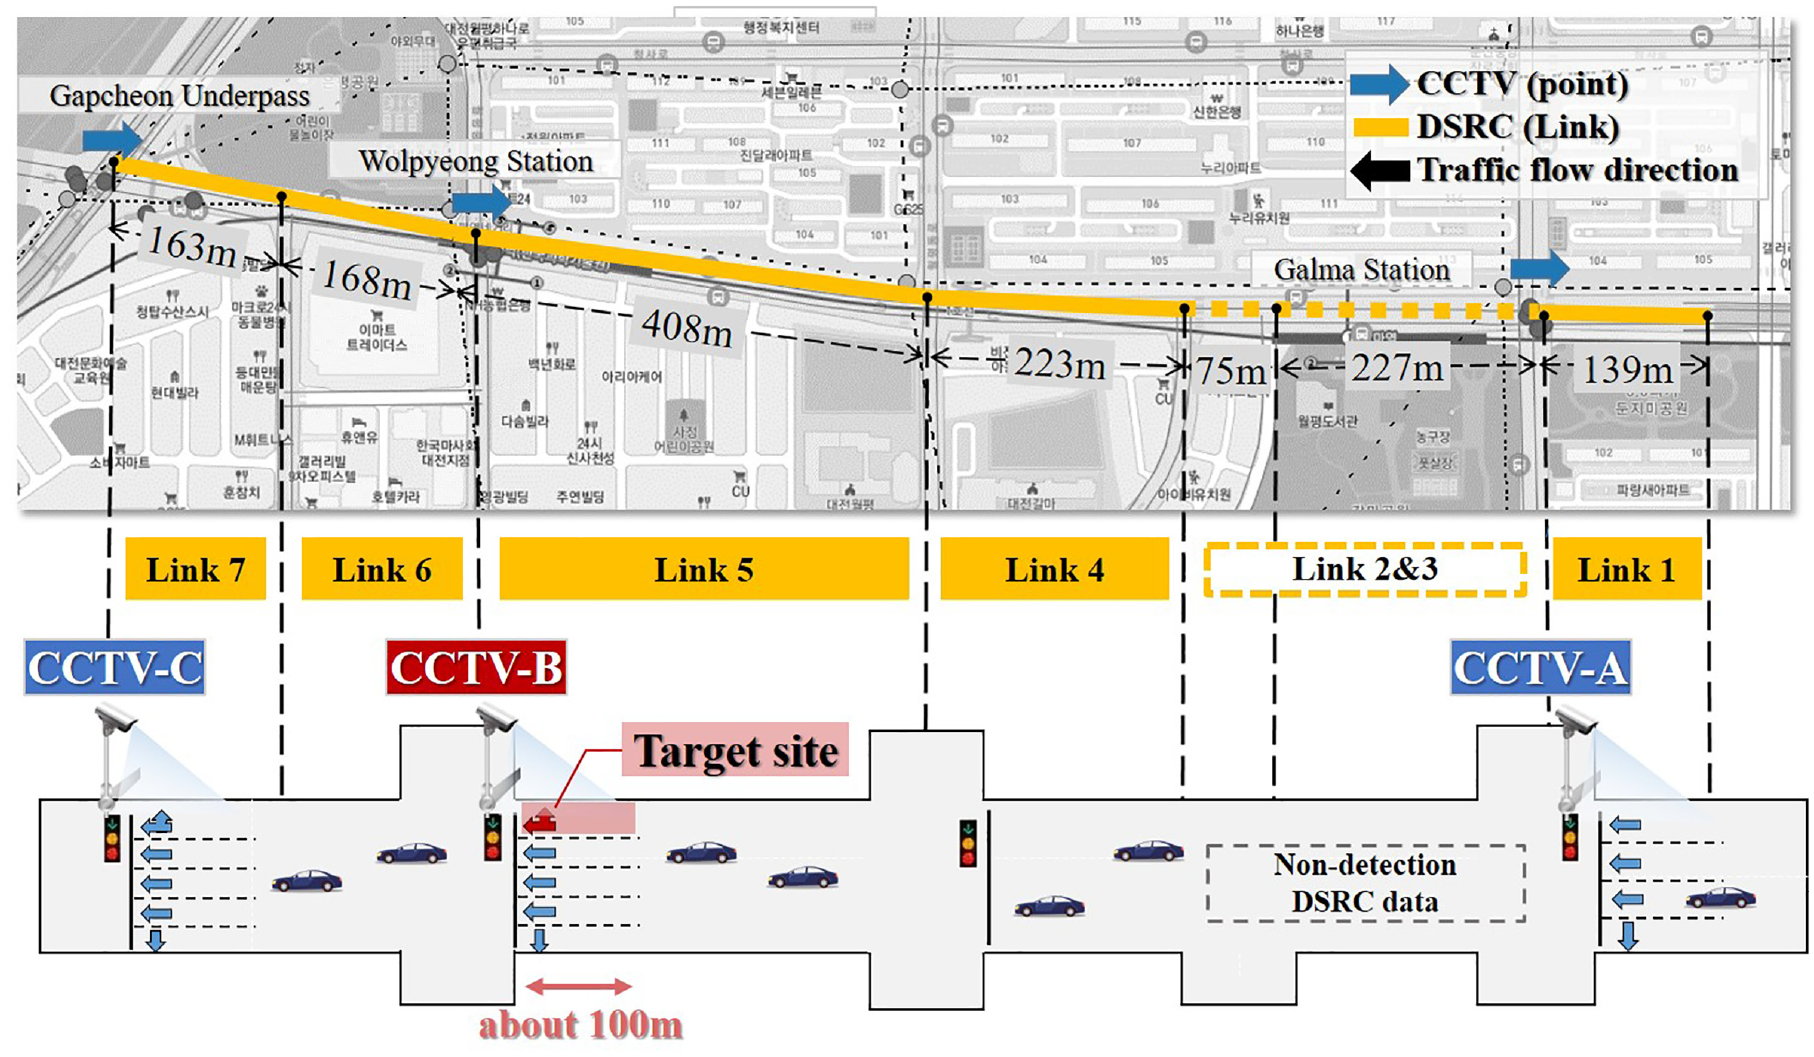
Description of the Daejeon study site.
Description of the CCTV and DSRC data
The National Traffic Data Open Market provides CCTV and DSRC data for Daejeon. Tables 1 and 2 show descriptive statistics of CCTV and DSRC data. CCTV data are provided as 5-min aggregated lane-level data, and the data include 36 different bits of information, such as the ID/direction of the camera, the lane number, the moving direction of passing vehicles, occupancy, traffic volume, and queue length. Since traffic flows in different lanes show different but correlated patterns, available lane-based data are required for an accurate and reliable estimation of traffic volumes ( 10 , 11 ). DSRC data also are aggregated in 5-min periods, and the data provide various information, such as the link ID, route direction, roadside equipment, travel speed/time/number of vehicles collected, link-based travel speed, and travel time. The DSRC data for Links 2 and 3 are not used because the data is non-existent. The final dataset contains daily 24-h traffic data aggregated in 5-min periods from March 7 to March 27, 2022.
Descriptive Statistics of Closed-Circuit Television (CCTV) Data

Note: The values in the parentheses are standard deviations.
Descriptive Statistics of Dedicated Short-Range Communication Data
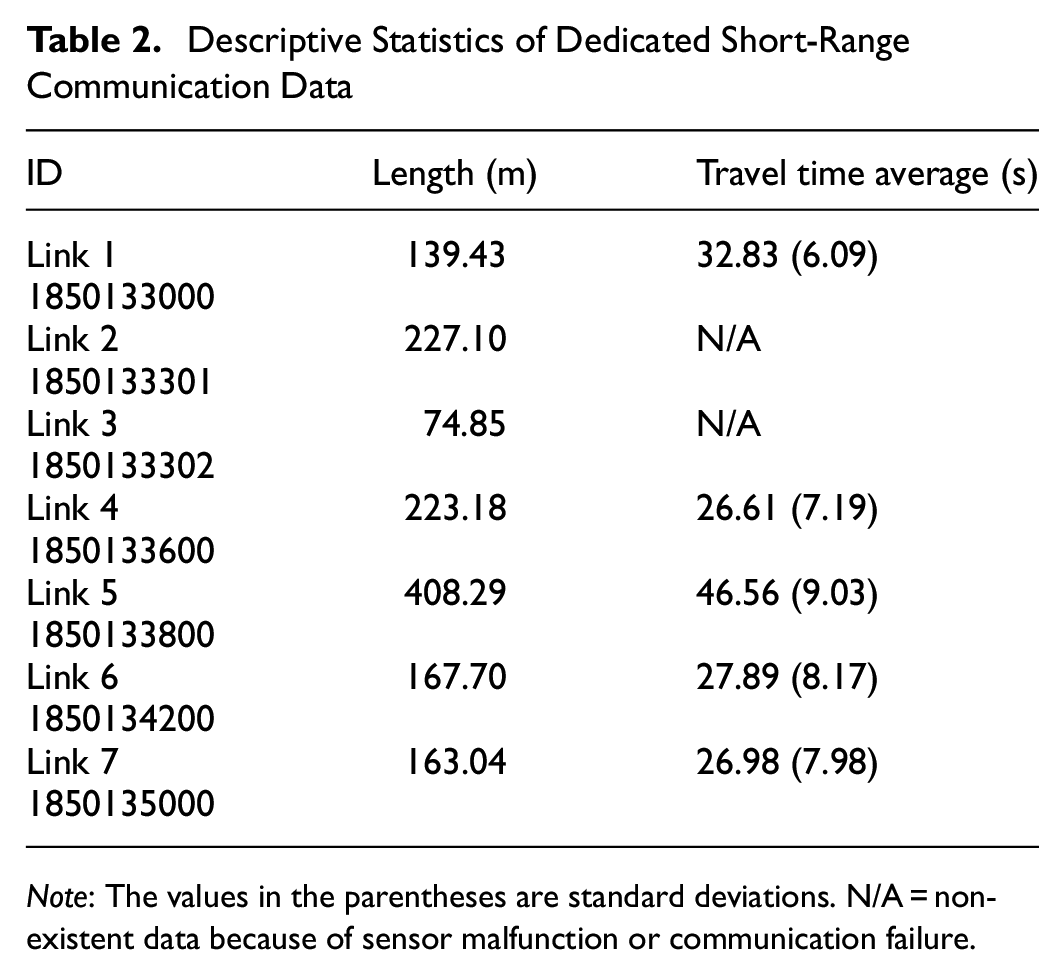
Note: The values in the parentheses are standard deviations. N/A = non-existent data because of sensor malfunction or communication failure.
CCTV data provide lane-level traffic flow information. Since most studies do not have lane-level data, the same traffic pattern is assumed for all lanes. However, it is important to analyze the traffic flow for each lane because a sudden change in the surrounding lane can greatly affect the traffic pattern of the target lane ( 10 , 11 ). Fixed sensors, such as CCTV, cannot be installed everywhere and have limited detection range, resulting in spatial discontinuity in the data ( 5 ). This study utilizes DSRC data to complement the limitations of the CCTV data and vice versa. DSRC provides the trajectory data, and it currently is used extensively. On the other hand, DSRC does not collect lane-level data and cannot provide the total traffic volume without a penetration rate of probe vehicles ( 6 ). Consequently, this study aims to improve the single-modality of CCTV data by fusing DSRC data to yield higher accuracy in estimating traffic volume.
Methods
Problem Definitions
This study aims to estimate the missing traffic volume data of the target site shown in Figure 2. Although the data of the target site are available, we assume that the data of the target site have not been collected and are used only for validation. Specifically, the target site for estimation is located at CCTV-B in the outside lane (Lane #5). In the case of urban networks, traffic flow is significantly different for each lane because of the influence of factors such as traffic signals. Figure 3 presents the moving direction of each lane of CCTV-B and the different characteristics of the traffic flow (e.g., occupancy, traffic volume, and queue length) as a box plot. Therefore, this study estimated the traffic volume in the outside lane where the right-turn queue might affect the vehicles going straight ahead.
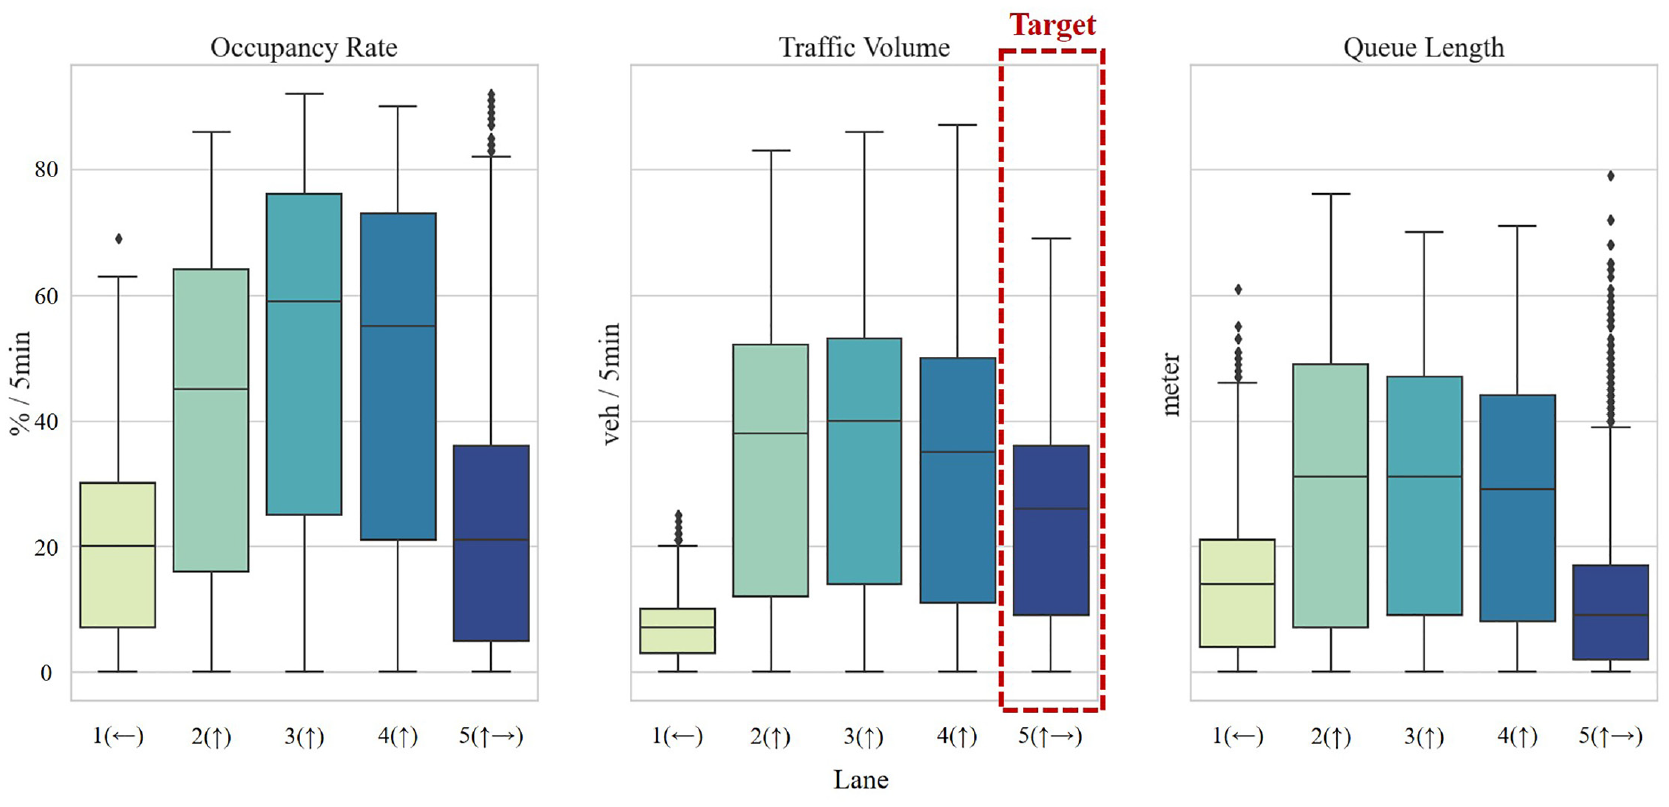
Box plot of the traffic information for individual lanes in CCTV-B.
Multimodal Deep Learning Model
The proposed multimodal deep learning model in this study consists of four models with the three steps shown in Figure 4. Each step consists of (1) feature extraction, (2) feature fusion, and (3) the estimation of traffic volume. Firstly, the feature extraction model that extracts the features of the sensor data to generate the input data of the multimodal deep learning model utilizes a multilayer perceptron (MLP) network. Secondly, the fusion step creates input data for the estimation model (Model 4) by fusing the extracted features. The fusion considers the product and the concatenation fusion used in previous studies. Concatenation fusion is applied to one model, while product fusion is applied to another. Finally, the estimation model utilizes a recurrent neural network (RNN) to estimate the traffic volume by receiving the fused data. This study’s multimodal deep learning model is divided into three types. The first involves a multimodal deep learning model that leverages different attributes extracted from CCTV data. By incorporating both the occupancy and queue in Modality 2, it aims to simultaneously consider distinct attribute information from the same sensor. The second is a multimodal deep learning model that fuses the multiple sensor data. The third is a multimodal deep learning model that fuses different attributes from CCTV data and multi-sensor data obtained from DSRC. Figure 4 presents an opportunity to discuss the potential extension of the model to predict other important metrics beyond traffic volume. Specifically, the model could be adapted to predict metrics such as travel time or queue length, given the estimated traffic volume. This expansion would enhance the model’s utility and provide a more comprehensive understanding of traffic dynamics.
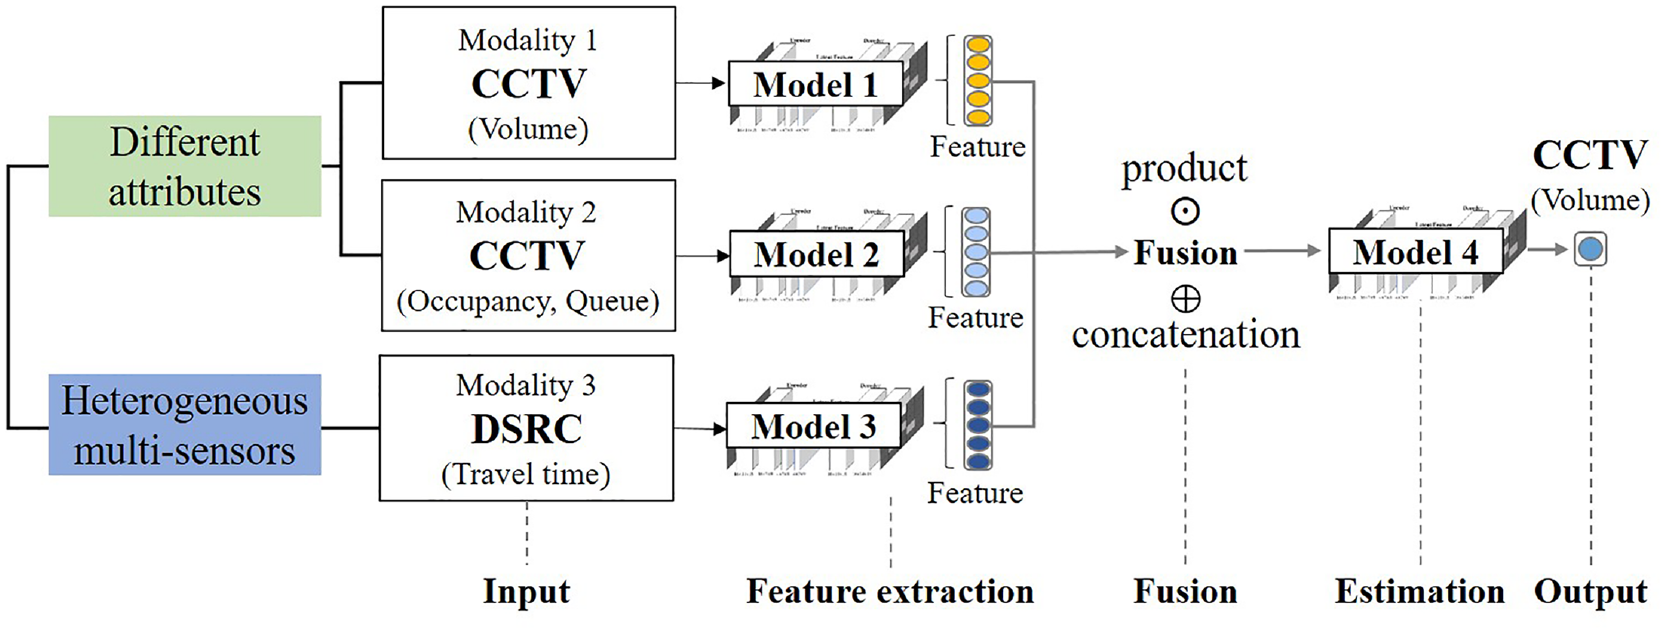
Structure of the proposed multimodal deep learning model.
Feature Extraction
Previous studies have focused mainly on lane-level prediction using CNNs for the extraction of features ( 10 , 11 ). Since the number of lanes of sensor points is the same, a grid-type matrix is constructed and used as CNN input data. However, this study cannot incorporate the CNN because the number of lanes is different for each intersection where the CCTV is installed. Furthermore, the CNN pooling process can lead to the loss of information located at the edge ( 16 ). Therefore, the extraction of features using the CNN is not suitable to estimate the traffic volume of the outside lane in CCTV-B for this study.
Multilayer Perceptron
In this study, a MLP neural network was used to extract the features of the individual data. The MLP can approximate the nonlinear relationship between multiple inputs and outputs in time-series data better than traditional time-series models, such as autoregressive integrated moving average (ARIMA) and Kalman filtering models ( 17 ). The MLP uses a feedforward architecture and consists of an input layer, several hidden layers, and an output layer. The input layer projects the input data and forwards information to the hidden layer. The hidden layer is comprised of a set of neurons and multiple fully connected linear layers. The information in the input layer is processed in the hidden layer, and it becomes nonlinear through an activation function, such as the rectified linear unit (ReLU). Finally, the generated result is propagated to the output layer. For training the network, the MLP uses a supervised learning technique called a back-propagation algorithm to adjust the connection weights between layers to reduce the error between the input and the generated output.
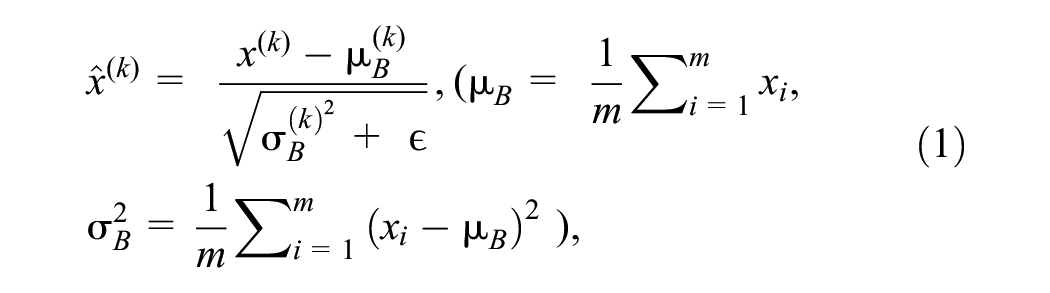
Figure 5 describes the framework of the feature extraction model using only CCTV volume data (Model 1 in Figure 4). The size of the input features equals the number of lanes each CCTV detects. To explain further, the size of the input feature is the sum of four lanes of CCTV-A, four lanes of CCTV-B excluding the target lane, and five lanes of CCTV-C, resulting in 13 input features. The input size was updated through an empirical approach that involved iteratively adjusting the number of hidden neurons from 32-64-16. This allowed for the testing of different configurations of hidden neurons and helped fine-tune the model’s performance to achieve better results. The size of the output feature is equal to the size of the input features. All MLP models in the feature extraction step include three hidden layers, that is, the batch normalization layer, the ReLU activation function, and a dropout layer. Batch normalization normalizes each layer’s inputs to address the internal covariate shift problem (Equation 1) ( 18 ). Compared to other activation functions, such as sigmoid and tanh, the ReLU is a straightforward, effective activation function that produces zero when it is less than zero (i.e., negative) and produces itself when greater than zero (Equation 2) ( 19 ). Furthermore, the ReLU does not saturate for large positive input values. This property enables the ReLU to avoid the vanishing gradient problem, which occurs when the gradient becomes very small, leading to slow learning. Dropout layers are used to regularize and prevent overfitting the model:

where

Illustration of the feature extraction model using closed-circuit television (CCTV) volume data.
Feature Fusion
The extracted feature vectors contain different information that can be correlated with each other. In this study, we separately apply concatenation and product fusion to merge the extracted feature vectors and form one multimodal feature representation. Concatenation has a more flexible structure than other methods. Therefore, it has been used extensively in previous studies related to multimodal deep learning ( 10 , 11 , 13 ). The concatenation preserves the unique characteristics of each modality and compensates for the shortcomings of the different data. The feature product amplifies information by producing two feature vectors in matrix form. Therefore, it is possible to provide all possible combinations of information to the multimodal model. These fusion methods are represented mathematically in Equations 3 and 4:


where
Estimation of Traffic Volume
The RNN model is used to estimate the traffic volume of the target site, and it is shown as Model 4 in Figure 6. As shown in the figure,

where
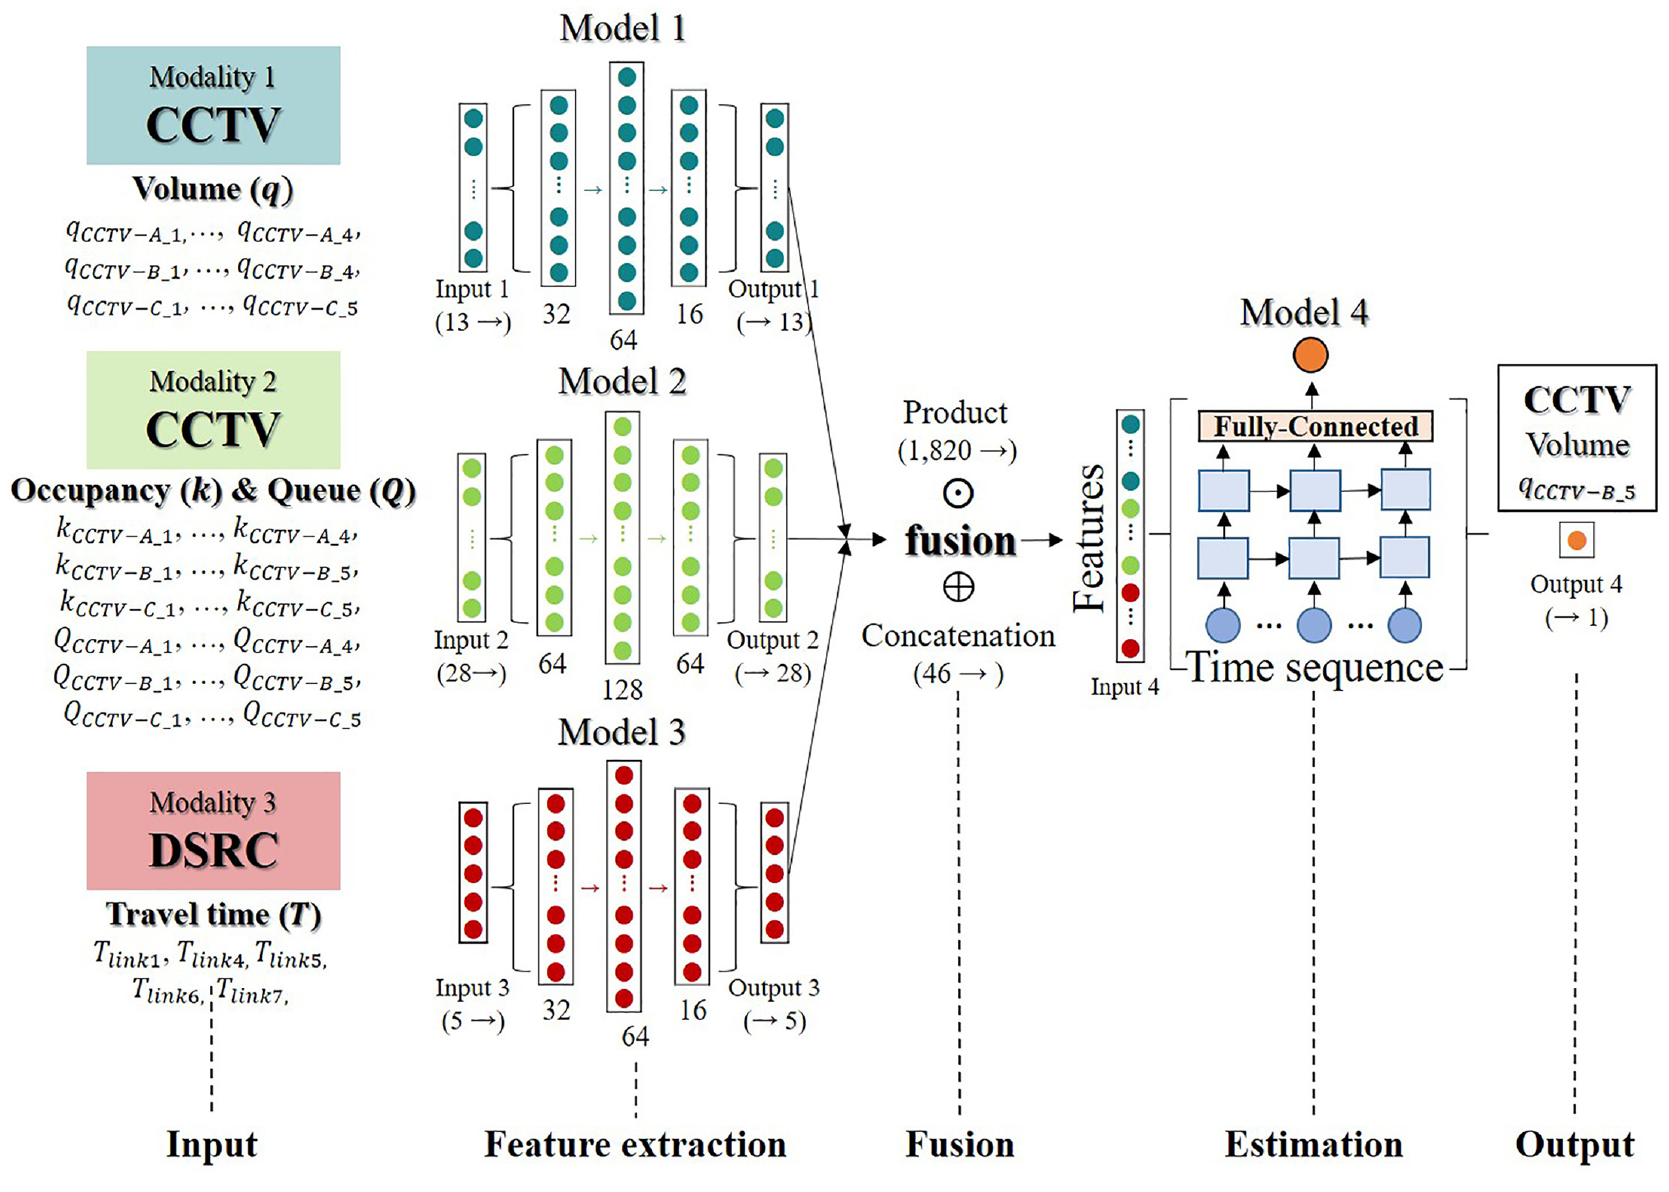
Description of the proposed multimodal deep learning model.
We used earlier 70% of the dataset for training and the rest for validation. The min-max scaler method was used to normalize the range in the input data. For each value in the input data, the min-max scaler subtracted the minimum value and then divided it by the range so that all values were between 0 and 1. The Adam optimizer was used in this study as an algorithm for updating the weights. The Adam optimizer is an efficient stochastic optimization method that requires only a first-order gradient with little memory requirement (Equation 6) ( 20 ). Lastly, the models are trained by reducing the root mean square error (RMSE) loss function (Equation 7). The learning rate is set to 0.001, and the number of training epochs is 100:


where
Four models were developed in this study to compare the performance of the proposed multimodal deep learning model. These four models are the single-modality model, the multimodal deep learning model with different information from single sensor data, the multimodal deep learning model with multiple sensor data, and the multimodal deep learning model fusing different attributes and multi-sensor data simultaneously.
-
-
-
-
To evaluate the performance of the four models, three performance measures were used in this study, that is, (1) the mean absolute percentage error (MAPE), (2) the mean absolute error (MAE), and (3) the RMSE. The mathematical expressions of the MAPE, MAE, and RMSE are shown in Equations 8–10:



where
Results
Empirical Analysis
The deep multimodal model was applied to the Daejeon urban network, and the missing traffic volume was estimated by fusing empirical CCTV and DSRC data. Specifically, the missing traffic volume of the target site was estimated by fusing three CCTV sensors, including lane-level traffic information, such as traffic volume, occupancy, queue length, and travel time information of five links from the DSRC data. The final dataset contained a total of 6048 records for three weeks.
Results of Traffic Volume Estimation
As a result, the average RMSE losses for training and validation of the proposed multimodal deep learning model fused by concatenating the different attributes and multi-sensor data were 0.068 and 0.092, respectively. Similarly, the average RMSE losses for training and validation of the proposed model fused by product were 0.069 and 0.088, respectively. Figure 7 represents the mean errors of the multimodal deep learning models. The mean error of the proposed model fusing different attributes and multi-sensor data using the concatenation and product were −0.0115 and 0.076, respectively. These values indicated that the errors are unbiased.
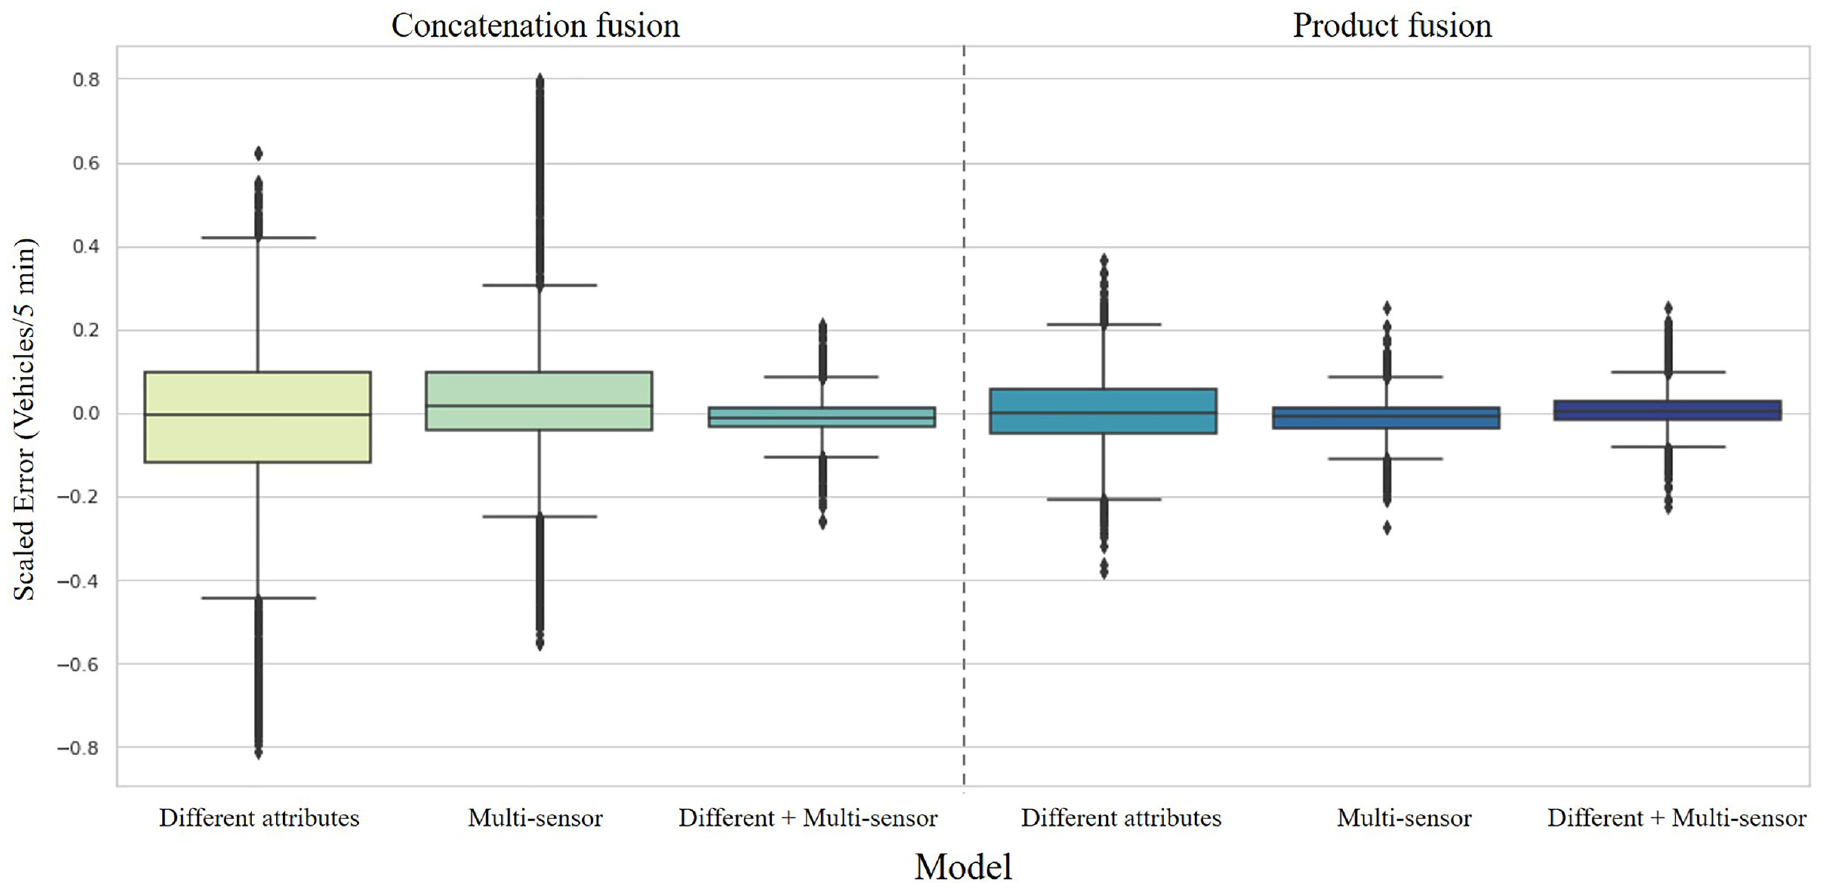
Error box plot of the multimodal deep learning models.
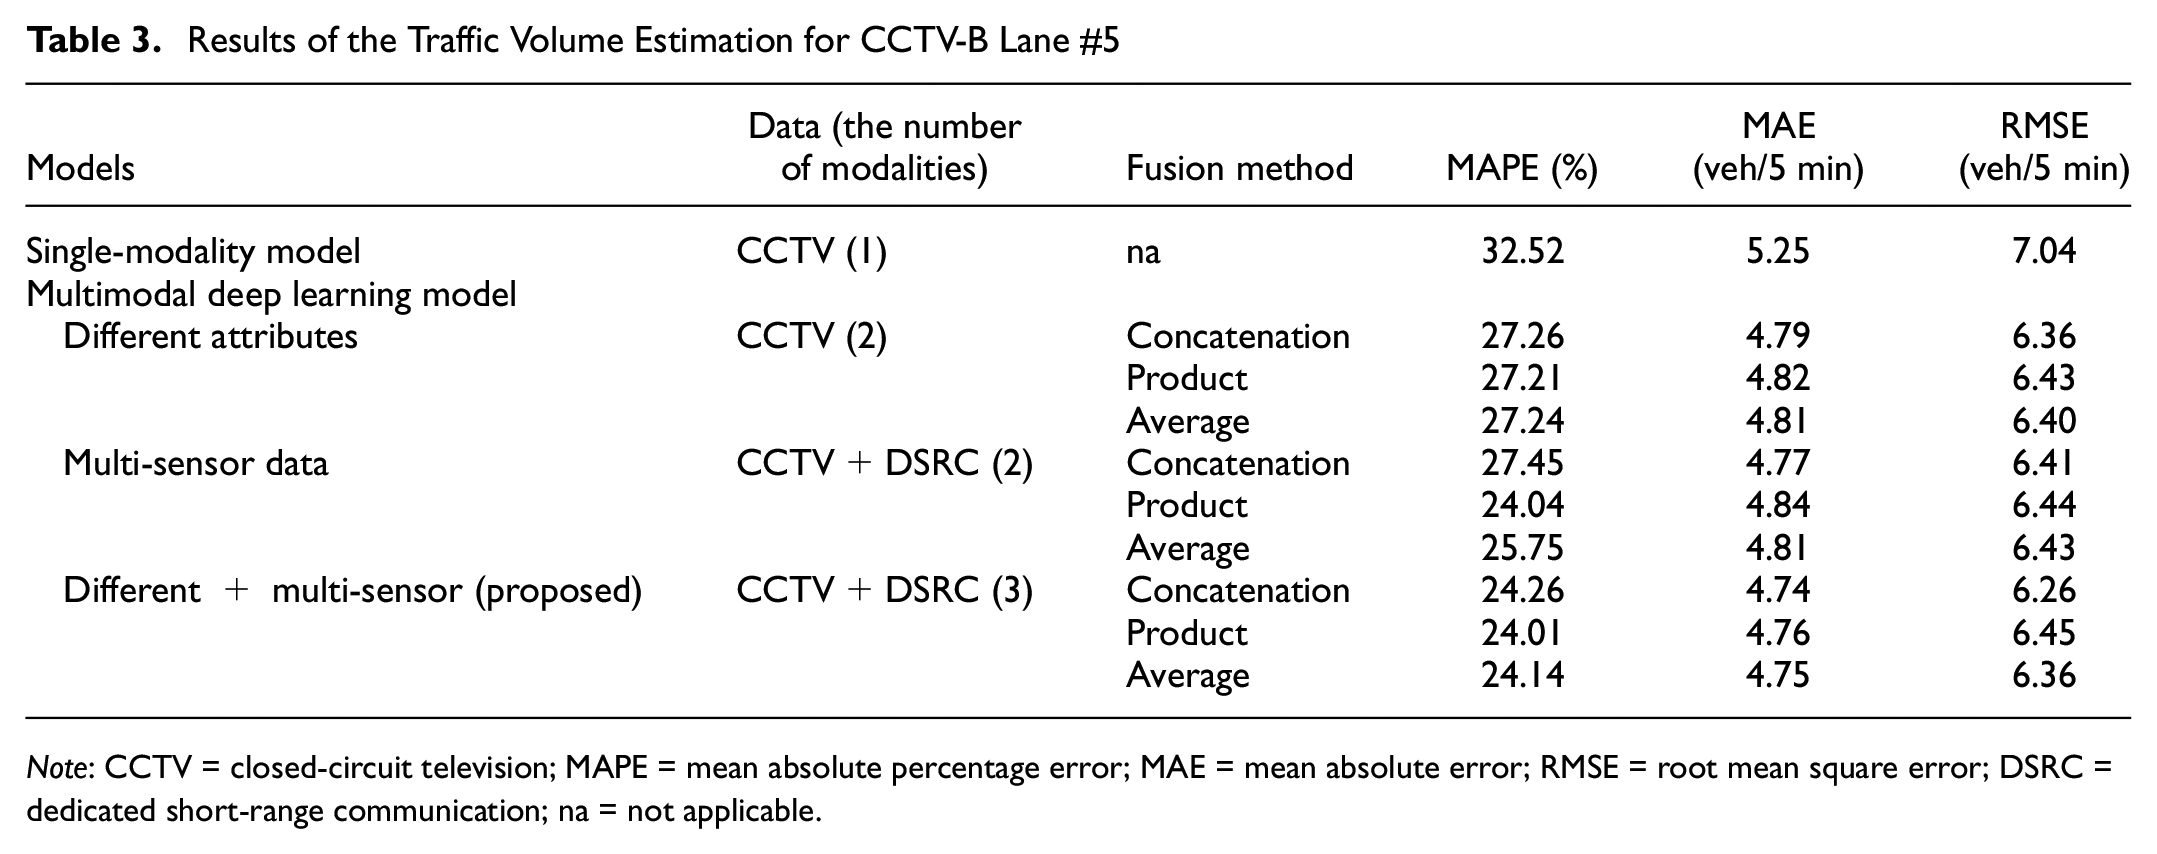
Table 3 reports the quantitative results of each model by three performance measures. The results show that the multimodal deep learning model fusing different attributes of CCTV data with the travel time of DSRC data has a comparatively better estimation accuracy. The RMSEs of the single-modality and three multimodal deep learning models are 7.04, 6.40, 6.43, and 6.36 veh/5 min, respectively. The results of the MAPE for the four models are estimated at 32.5%, 27.2%, 25.8%, and 24.1%, respectively. These results indicate that the accuracy of each model is 67.5%, 72.8%, 74.3%, and 75.9%, respectively. These results indicate that the multimodal deep learning model considering relationships of different attributes in the CCTV data improves performance to 5.3%p (percentage point) compared with the single-modality model. The multimodal deep learning model fusing the traffic volume of the CCTV data with DSRC data enhances the performance to 6.8%p compared with the single-modality model. The proposed multimodal deep learning model considering both relationships enhances the performance to 8.4%p compared with the single-modality model. The results indicate a great accuracy, which is consistent with many previous studies ( 9 – 14 ). The proposed multimodal deep learning model fusing different attributes of CCTV data with the travel time of DSRC data improves the performance to 3.1%p compared with the multimodal deep learning model fusing different attributes of CCTV data. In conclusion, the dependencies of the two sensor data considerably influence the missing data estimation and the proposed model simultaneously captures nonlinear relationships for different attributes and multiple sensor data. Although the performance of the multimodal deep learning model improved compared to the single-modality model, the overall accuracy of the estimation result is not as high as in previous studies using the historical values of a target as input features ( 17 , 21 – 23 ). Applying the model to an urban network could be a plausible reason for these results. Urban networks introduce increased complexity because of factors such as frequent lane changes, interactions with pedestrians and cyclists, variations in traffic density, and the presence of diverse road users. This complexity may present greater challenges for the model’s performance in accurately predicting traffic dynamics. The other reason is that the target lane is not used as an input feature.
Results of the Traffic Volume Estimation for CCTV-B Lane #5
Note: CCTV = closed-circuit television; MAPE = mean absolute percentage error; MAE = mean absolute error; RMSE = root mean square error; DSRC = dedicated short-range communication; na = not applicable.
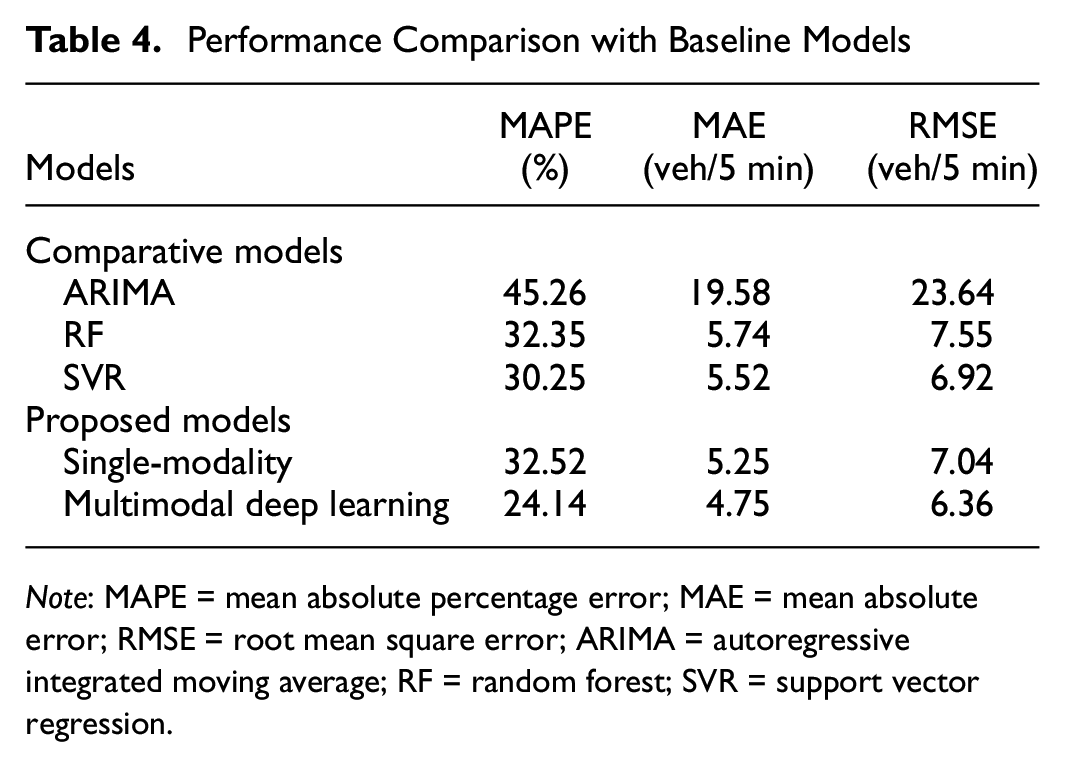
Three additional analyses were conducted to manifest the performance of the multimodal deep learning model. Initially, we implemented three baseline models for comparison. The ARIMA is one of the traditional time-series methods for traffic prediction. The appropriate values of parameters
Performance Comparison with Baseline Models
Note: MAPE = mean absolute percentage error; MAE = mean absolute error; RMSE = root mean square error; ARIMA = autoregressive integrated moving average; RF = random forest; SVR = support vector regression.
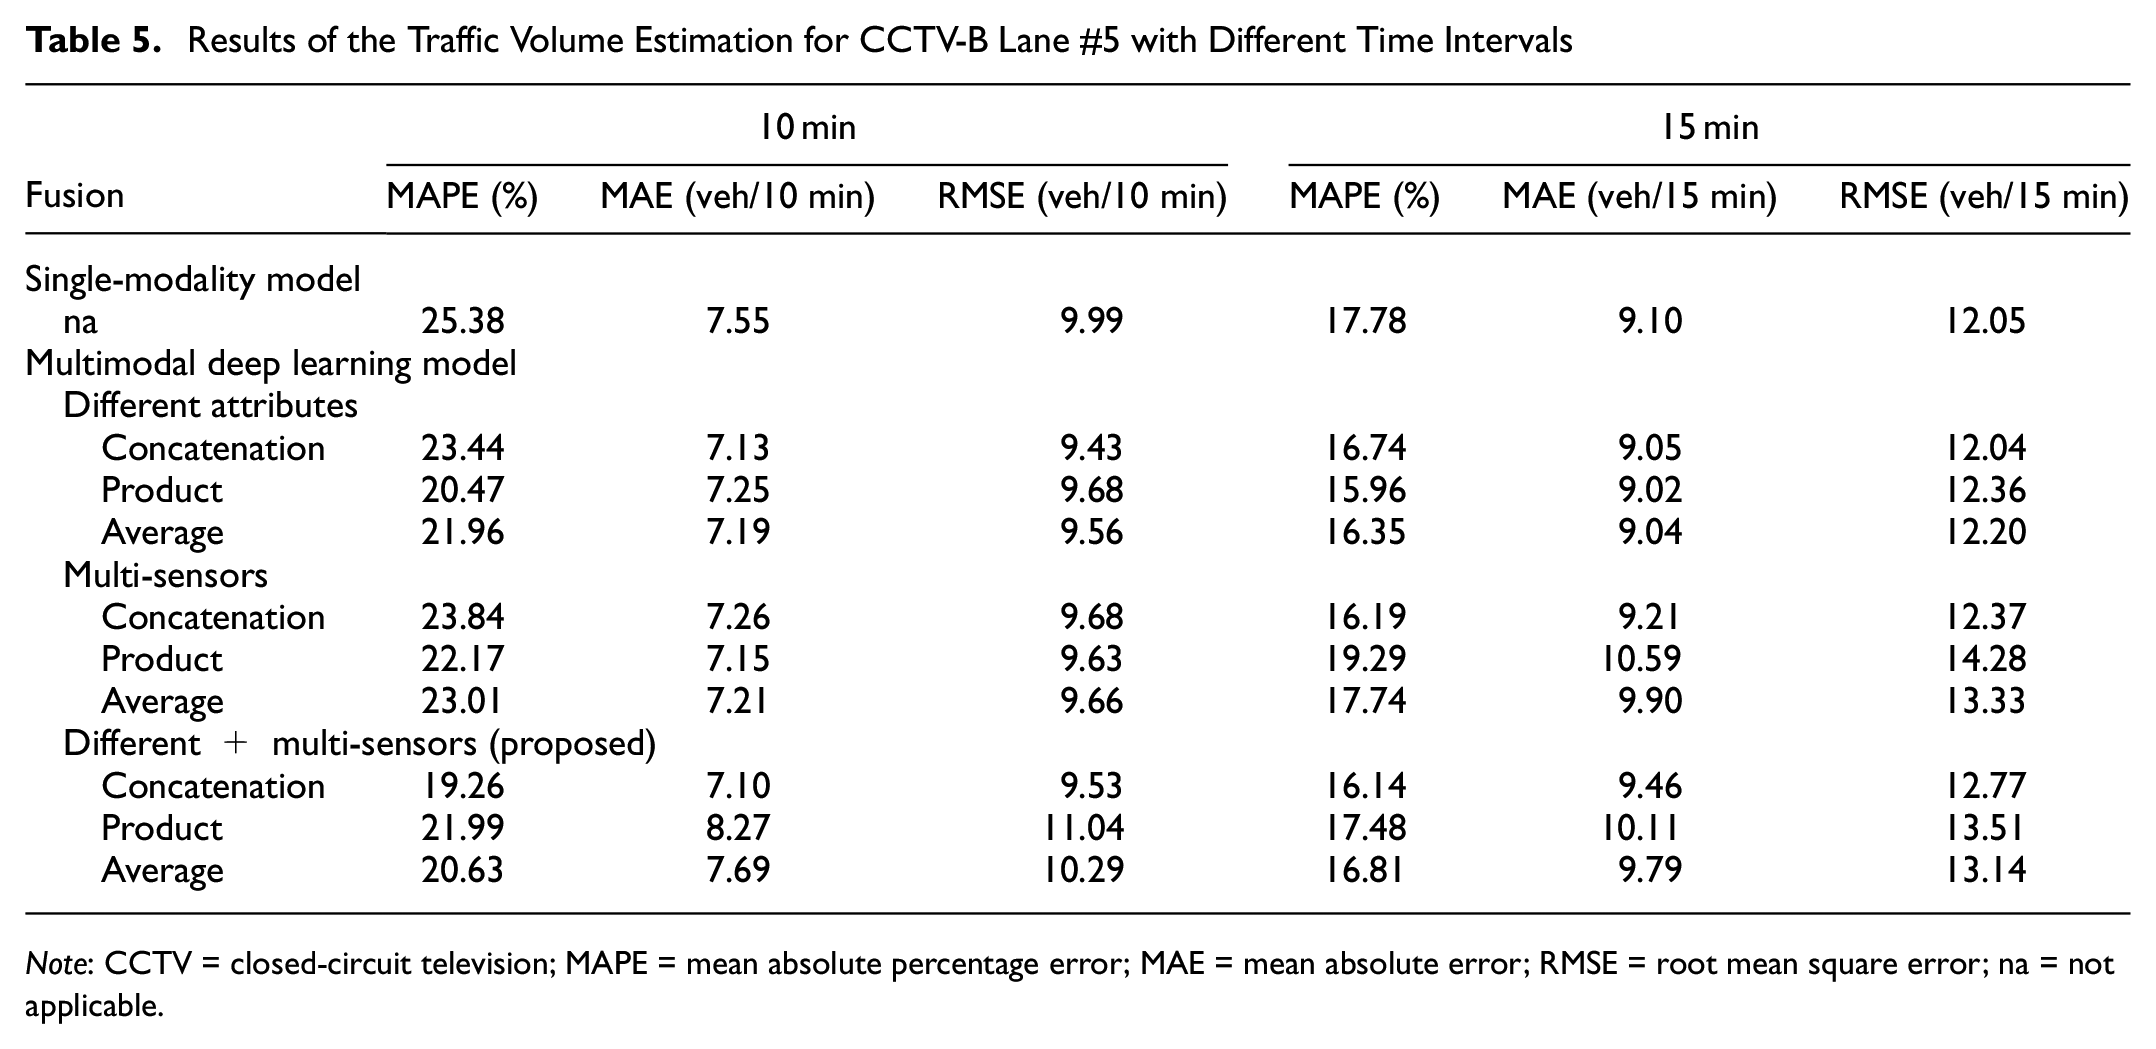
Subsequently, further analysis was performed to examine how the time interval affects the results. We applied the proposed model for 10 and 15 min. Table 5 shows that the accuracy of the model improves for both single-modality and multimodal deep learning models as the data aggregation time interval increases. However, with the decrease in the time interval, the estimation accuracy differences between multimodal deep learning models and the single-modality model become larger. In other words, when the temporal resolution is high, the performance of the single-modality model is insufficient compared to the multimodal deep learning model, which showed sufficient accuracy.
Results of the Traffic Volume Estimation for CCTV-B Lane #5 with Different Time Intervals
Note: CCTV = closed-circuit television; MAPE = mean absolute percentage error; MAE = mean absolute error; RMSE = root mean square error; na = not applicable.
Results of Traffic Volume Estimation by Lanes
The proposed multimodal deep learning model has a flexible structure. Therefore, it is easy to apply to different lanes of CCTV-B. The different types of lanes are divided into an inside lane, three middle lanes, and an outside lane, similar to Lu et al. ( 10 ).
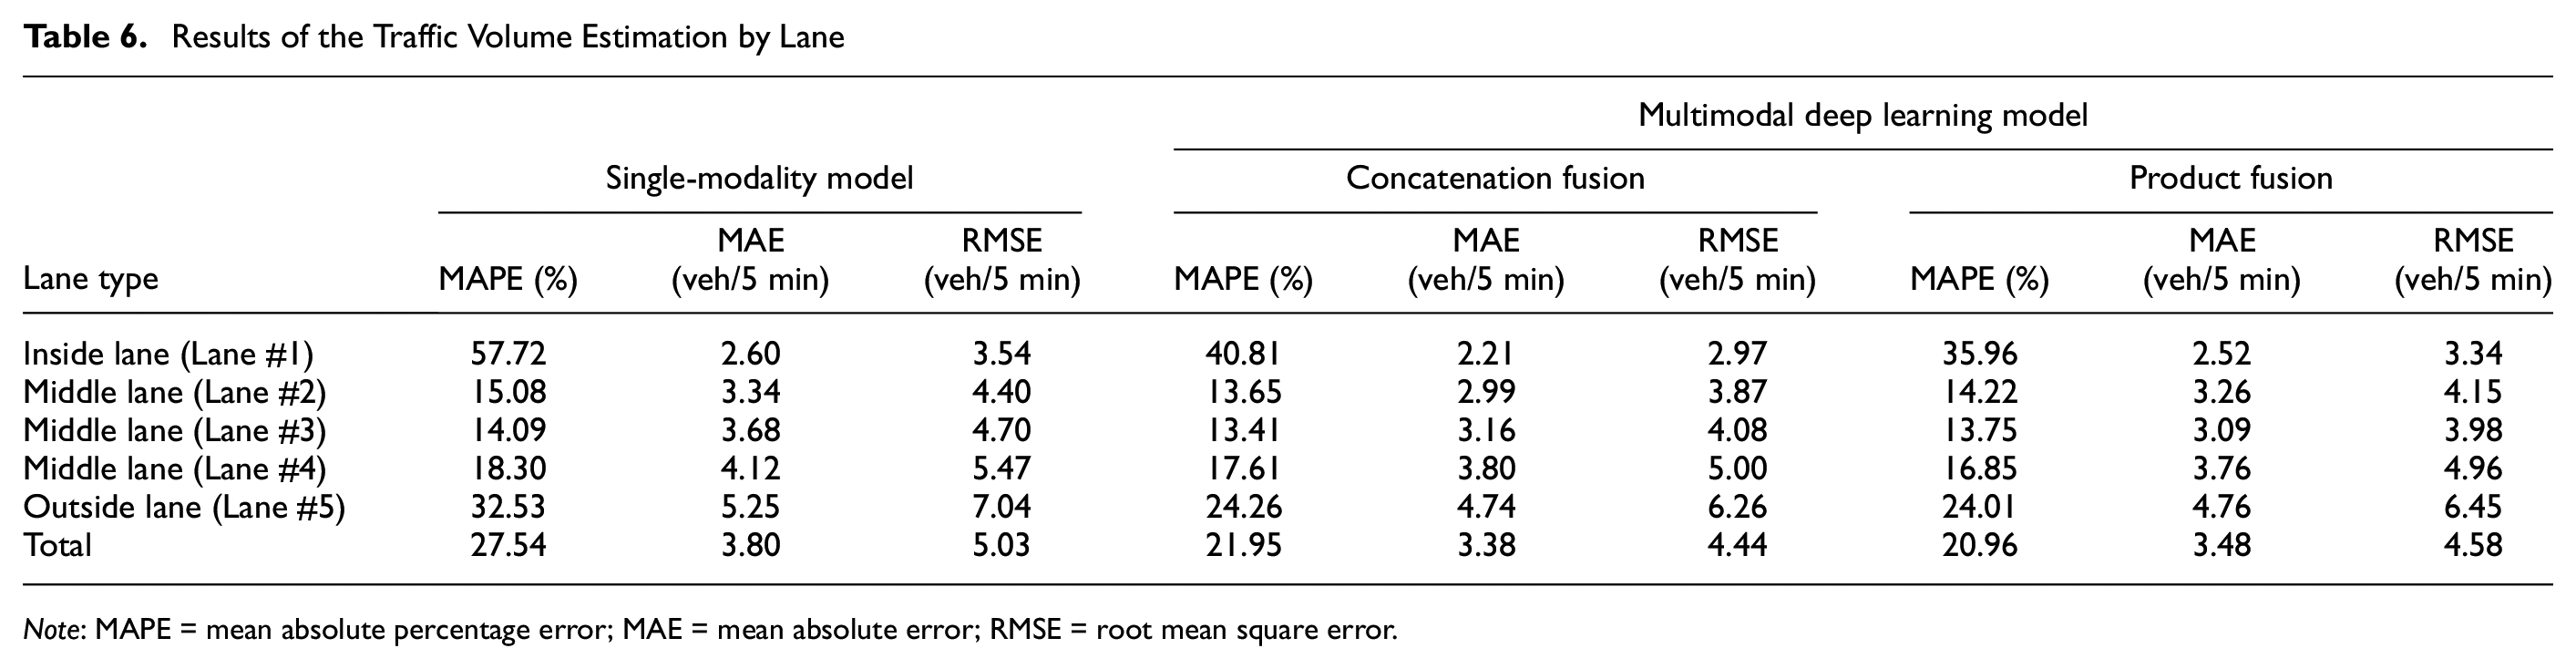
We explored the estimation accuracy of the single-modality model (using only CCTV data) by lane. The analysis in Table 6 shows that single-modality model performed with higher accuracy in the middle lanes. As for the inside and outside lanes, the estimation accuracy was insufficient. This result is because the traffic flow is quite different from lane to lane, as mentioned in the problem definitions. To compensate for the single-modality model’s result, further analysis was conducted to compare the performance accuracy with the deep multimodal model. The estimation results for each lane of the deep multimodal model using three performance measures are represented in Table 6. Likewise, the errors in the middle lanes are lower than in the inside and outside lanes. The inside lane (Lane #1), which is a left-turning lane, and outside lane (Lane #5), where vehicles can turn right, have relatively low traffic volume and occupancy, and outliers of those lanes may increase the estimation difficulty, compared to the middle lanes consisting of vehicles staying in the lane.
Results of the Traffic Volume Estimation by Lane
Note: MAPE = mean absolute percentage error; MAE = mean absolute error; RMSE = root mean square error.
The traffic volume estimation by lane demonstrated in Table 6 indicates that both single-modality and multimodal models show good accuracy in the middle lanes. In the case of the middle lane, the single-modality model is sufficient, but in the case of inside and outside lanes (Lanes #1 and #5), multimodal deep learning that fuses multi-sensor data is required because of lower accuracy results in the single-modality model. Traffic patterns can vary with inside and outside lanes experiencing different conditions. The single-modality model struggles to estimate the side lanes because of factors that are not well-captured by CCTV traffic volume alone. In contrast, multimodal deep learning models leverage complementary information, such as the occupancy rate, queue length of CCTV, and travel time of DSRC, to estimate the complexities of the side lanes. In the urban network, there is the presence of outer lanes that permit right turns. Given that this characteristic can potentially affect signal control in urban areas, as well as the overall functionality of the road network, it becomes crucial to employ lane-level analysis techniques utilizing multimodal deep learning models.
Figure 8 shows the proposed multimodal deep learning model estimation result of scaled traffic volume and ground truths for Lanes #3 and #5 (target), including four weekdays and two weekends. The proposed model fits the trend and variability of traffic volume well. Lane #3’s case shows that the proposed model can capture the trend of traffic volume and make a stable and reliable estimation even during morning and evening peak hours on weekdays.

The estimation results of the proposed multimodal deep learning model.
Conclusions
Even in the era in which collecting various traffic data has become a norm, there are still missing data segments where traffic information cannot be collected. Previous studies used multimodal deep learning models to improve transportation modeling, but most of them were conducted on highway networks. Also, these studies focused on capturing the relationship between multi-modalities, but the characteristics of the input data were limited.
In this study, a multimodal deep learning model is applied to estimate lane-level missing traffic volume at an urban network by fusing CCTV and DSRC data. Specifically, the traffic volume, occupancy, and queue length of the CCTV data and travel time of the DSRC data are considered to estimate the missing traffic volume. To evaluate the estimation performance, the results of the single-modality model are compared with multimodal deep learning models. As a result, the multimodal deep learning model considering different attributes and multi-sensor relationships improves the performance to 8.4%p compared with the single-modality model.
The main contributions of this study can be summarized as follows. (1) The study applied a multimodal deep learning model in a complex urban network. The estimated traffic information has the potential to improve traffic light signaling, which could reduce queue length. (2) This study simultaneously captures the dependency of different attributes (i.e., traffic volume, occupancy, and queue length of CCTV data) and heterogeneous multi-sensor data (i.e., CCTV data and travel time of DSRC data). (3) As a result, the model utilized in this study exhibits notable enhancements in comparison to the single-modality model, particularly when the aggregation time unit is reduced and in the inside/outside lanes where traffic volume is lower.
This study trained the loss function using information collected from the detector as the ground truth. However, we plan to expand the research to segments without installed sensors, intending to utilize simulations or drone data as the ground truth in future research. To enhance the generalizability of the proposed model, future research could involve the evaluation and validation of different lanes and links across various countries. Furthermore, enhancements can be made to the proposed model by utilizing various information from different data, such as vehicle type information from CCTV data and trajectory information from GPS data. In addition, we plan to compare some models using the same set of multimodal data. On a final note, GRUs should be considered to further improve model architecture and performance in specific time intervals, such as weekends, and the application of an attention mechanism within the multimodal model should be explored to quantify the interrelationships of each modality.
Footnotes
Author Contributions
The authors confirm contribution to the paper as follows: study conception and design: J.H. Min, H.S. Shin, D.-K. Kim; data collection: J.H. Min; analysis and interpretation of results: J.H. Min, H.S. Shin, D.-K. Kim; draft manuscript preparation: J.H. Min, H.S. Shin. All authors reviewed the results and approved the final version of the manuscript.
Declaration of Conflicting Interests
The author(s) declared no potential conflicts of interest with respect to the research, authorship, and/or publication of this article.
Funding
The author(s) disclosed receipt of the following financial support for the research, authorship, and/or publication of this article: This work was supported by a Korea Institute of Police Technology (KIPoT) grant funded by the Korea government (KNPA) (No.092021C28S02000) and the Basic Science Research Programs through the National Research Foundation of Korea (NRF) funded by the Ministry of Education (2022R1A6A3A13072806 and 2022R1A2C2012835).
