



Abstract
Contractors are paid incentives/disincentives based on achieved in situ asphalt concrete (AC) density. Ground-penetrating radar (GPR) has been proven feasible for predicting in situ density of AC pavements using various empirical and fundamental approaches. However, to use fundamental equations for density prediction, aggregate dielectric constant must be known beforehand. Destructive cores are usually extracted from the pavement to back-calculate the aggregate dielectric constant. This cancels out the non-destructive benefit of the GPR technology. In this study, GPR is used to quantify the dielectric constant of 10 different aggregates commonly used in AC mixes in Illinois, U.S. The sampled aggregates included limestone, dolomite, trap rock, granite, and crushed gravel. The purpose was to initiate an aggregate dielectric constant database that would help predict AC density nondestructively and accurately. By using the aggregate database, GPR would help contractors estimate achieved density in real-time without prior calibration. This technology would save energy, time, and cost. Simulations using gprMax and a sensitivity analysis are presented to illustrate the effect of aggregate dielectric constant on AC bulk dielectric constant and, consequently, on AC density predicted by the Al-Qadi Lahouar Leng model. A new procedure to determine the aggregate dielectric constant using the electromagnetic mixing theory is detailed. Advanced chemical tests confirmed that the aggregate dielectric constant is a function of its elemental/mineral compositions. Finally, laboratory and field data were used to validate AC density prediction using the aggregate database. The establishment of an aggregate dielectric constant database would improve the accuracy of GPR in nondestructive AC density prediction.
Keywords
Ground-penetrating radar (GPR) is a subsurface nondestructive investigation technique that uses electromagnetic (EM) waves. It provides a radargram that could be used to identify subsurface features. GPR may be used to estimate material relative permittivity, which is a complex quantity describing the material’s reaction to external EM fields. More recently, and especially for pavement applications, the dielectric profiling system (DPS) has been used. The relative permittivity of asphalt concrete (AC) is affected by its characteristics, including density, moisture content, binder content, aggregate type, size, and shape, and age ( 1 , 2 ). From a GPR point of view, materials are distinguished based on three EM properties: electric permittivity, magnetic permeability, and conductivity. Therefore, knowledge of these properties for paving materials under various conditions is necessary when interpreting GPR results. AC is considered a lossless, nonmagnetic, and nonconductive material. Consequently, the real part of the relative permittivity or the dielectric constant is the main property governing EM wave propagation in AC. Detailed explanation of GPR principles can be found in Annan ( 3 ). A practical guide for application of GPR to pavements may be found elsewhere ( 4 ).
AC density is an important quality control/quality assurance parameter and is directly related to pavement structural capacity and performance ( 5 – 8 ). GPR is a feasible technique for predicting in situ pavement AC density using various empirical and fundamental approaches ( 9 – 15 ). GPR is time and cost effective and has a relatively large coverage area, making it suitable for density prediction during AC layer compaction ( 16 – 18 ). However, some reported results for predicting AC density from GPR data are not generalizable, because of utilizing empirical approaches. An empirical relationship is usually developed for a specific AC mix and is not valid for other AC mixes. On the other hand, fundamental approaches based on EM mixing theory could be applied to predict AC density. The mixing theory establishes a relationship between the bulk dielectric constant of AC and the dielectric constants and volumetric proportions of its components. Volumetrics of AC components could be easily obtained from the AC job mix formula. AC consists of three main components: asphalt binder, air, and aggregates. The “relative” dielectric constants of binder and air components are known to be approximately 3 and 1, respectively. Nevertheless, the aggregate dielectric constant is a function of its chemical composition and varies considerably from one type to another. Prior knowledge of the aggregate dielectric constant enables accurate AC density prediction.
Aggregate dielectric constant could be determined by extracting cores from the pavement after construction, determining their density by standard gravimetric methods and using the cores’ density to back-calculate the aggregate dielectric constant ( 19 , 20 ). This approach is destructive, time consuming, requires safety measures, and limits the application of this technology in real-time during AC compaction. A laboratory dielectric measurement system was recently proposed to measure dielectric constant of laboratory pucks prepared according to the AC mix design at different densities ( 21 ). A relationship is established between the measured dielectric constant and the density. This relationship can be used in the field along with DPS to estimate the in situ AC density for the same mix. This calibration step would be omitted if the aggregate dielectric constant is known, particularly considering that puck measurements are affected by edge diffraction errors.
In this study, simulations were performed using gprMax to show the major effect of aggregate dielectric constant on the AC bulk dielectric constant. Then, a sensitivity analysis was presented to show the effect of aggregate dielectric constant on the predicted density. To develop an aggregate dielectric constant database, 10 various aggregate types commonly used in Illinois, U.S. (e.g., limestone, dolomite, granite, crushed gravel, and trap rock), were tested by GPR to determine their dielectric constants using a new testing procedure. Using readily available dielectric constant values from the database allows predicting AC density nondestructively and makes the real-time monitoring option feasible. The test procedure, calculations, and results are presented here. Subsequently, advanced chemical characterization tests were conducted on the aggregate samples to understand the effect of minerology on the dielectric constant. Finally, GPR data from laboratory experiments and field projects are presented as examples for using the established aggregate database.
Dielectric Constant Estimation
The determination of an accurate dielectric constant is essential to predict AC density using GPR. For example, AASHTO PP98-19 sets 0.08 as a threshold for dielectric variation in air-coupled dielectric constant measurement ( 22 ). The dielectric constant of materials may be estimated by various methods, including coaxial-line method, resonant cavity perturbation (RCP) method, free space method, and transmission/reflection method ( 23 ). For pavement applications, the dielectric constant could be estimated using the reflection amplitude method, which is based on Fresnel’s coefficients. Air-coupled antennas are mounted at approximately 18 to 20 in. above the pavement surface. These antennas send EM waves into the ground and receive the reflected signals, which are then analyzed to extract meaningful information about the pavement structure. The reflection amplitude method (Equation 1) requires two amplitudes as inputs, namely Ap and Ac, which represent the pavement surface reflection amplitude and the calibration reflection amplitude, respectively. A perfect reflector, usually a copper plate, is placed beneath the antenna to obtain the calibration amplitude. Ap and Ac should be obtained in the same setting, with the same antenna height, resolution (number of samples per scan), and acquisition rate (scans per second) for accurate calculation of the dielectric constant.

where
Ap = the pavement surface reflection amplitude,
Ac = the calibration reflection amplitude, and
The reflection amplitude method is simple and widely applicable for pavements. Another popular method for dielectric constant estimation is the two-way travel time (TWTT) method or time of flight. In this method, TWTT may be extracted from the GPR signal, which represents the time taken by the waves to travel in both directions through the AC layer. TWTT can then be used for calculating the dielectric constant (Equation 2). However, this approach requires prior knowledge of the AC layer thickness, and the determination of the TWTT might not be accurate because of noise and wave attenuation.

where
t = TWTT (s),
c = the speed of light in vacuum (3 × 10⁸ m/s),
d = AC layer thickness, and
The TWTT method is recognized as providing a more representative assessment of layer properties as it considers the bulk of the layer and not only the surface reflection. There are other approaches for dielectric constant estimation. Equations 1 and 2 are used in this study.
Density and Compaction Estimation
The pavement dielectric constant may be used to estimate the AC pavement density. The Al-Qadi Lahouar Leng (ALL) model (Equation 3) is a fundamental approach based on the EM mixing theory. The model relates the AC dielectric constant (

where
The volumetric parameters can be obtained from the asphalt plant or the AC job mix formula before pavement construction and compaction. The AC dielectric constant is obtained from the GPR signal, and the dielectric constant of the asphalt binder is approximated as 3. For the dielectric constant of the aggregates, this study proposes obtaining it from a database. The percent of air voids (AV) can then be derived from

The percentage of AV or compaction (the 100% complement) depends on the mix properties ( 25 ). Generally, the percentage of AV is required to be between 2% to 7% for Superpave-designed AC to avoid premature failure of the pavement ( 26 ). Contractors are paid incentives/disincentives based on achieved in situ density. They achieve that through rolling patterns, based on their experience, or control strips/test pads. Therefore, there is a need for technology that could assist contractors (and owners) to determine when desired density is achieved. Such technology would result in energy, time, and cost savings.
As seen in the ALL model,
Sensitivity Analysis
Aggregate dielectric constant affects the AC bulk dielectric constant. To illustrate this, simulations of an AC layer with various aggregate dielectric constants were conducted using open-source software gprMax ( 28 , 29 ). GprMax solves Maxwell’s equations using finite difference time domain technique and provides the resulting EM fields. Therefore, material EM properties, such as the dielectric constant, could be calculated. The model used is a heterogeneous pavement model where different-sized aggregate, binder, and air particles were generated using random sequential adsorption method, Figure 1a. The model includes a transmitting antenna, a receiver antenna and a perfect matching layer, which is necessary to eliminate EM waves reflected from the boundaries of the model. The model was proposed and validated for dry and wet pavements at various moisture content levels ( 30 ). In this analysis, it was used to simulate dry AC at 7% AV content. Aggregate dielectric constant values of 6, 7, and 8 were used to simulate different aggregate types, which are typical values for Granite, Dolomite and Limestone, respectively. Figure 1b shows the effect of changing the aggregate dielectric constant on the reflected GPR signal. The AC bulk dielectric constant changed from 5.12 (Granite) to 5.87 (Dolomite) to 6.06 (Limestone).
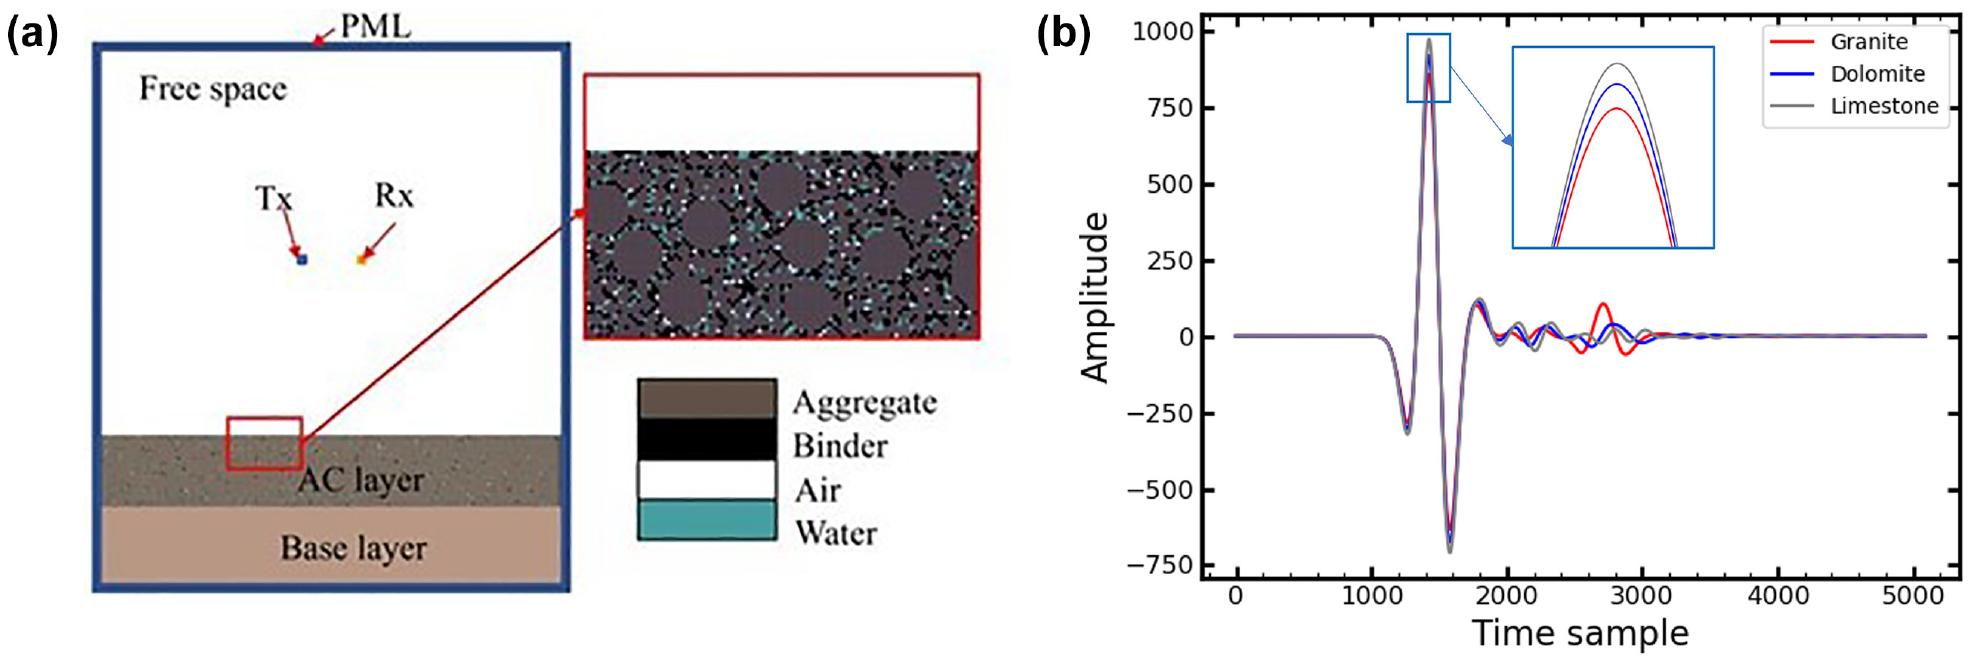
(a) Diagram for the heterogeneous asphalt concrete (AC) model in gprMax and (b) effect of aggregate dielectric constant on simulated ground-penetrating radar signal.
The AC density predicted by the ALL model is also sensitive to the aggregate dielectric constant. To quantitively determine this effect, three typical scenarios were studied: aggregate dielectric constants of 6, 7, and 8.2, along with three AV contents of 4.0%, 7.2%, 10.0% (typical for field AC mixes). For each scenario, aggregate dielectric constant values ranging from 5.5 to 8.5 were used and the predicted density (AV content) was calculated using the ALL model. Figure 2, a and b , present the sensitivity of the predicted density and AV to the input aggregate dielectric constant. For density, error is shown in percent difference, while, for AV, error is shown in absolute difference.

Effect of aggregate dielectric constant on (a) predicted bulk density (Gmb) and (b) predicted air voids (AV).
Evidently, modification in aggregate dielectric constant significantly changes predicted AC density/AV. In the first case, with true aggregate dielectric constant of 6% and 4% AV content, when 6.5 is used as the aggregate dielectric constant, predicted AV content is 7% (3% absolute error), which is significantly different from 4%. Effects are even more pronounced for mixes with lower density (higher AV content), which aligns with the analysis by Wang et al. ( 31 ). This observation is reasonable, and as would be expected. Aggregates comprise around 80% to 85% of the AC mix by volume. Therefore, slight changes in aggregate dielectric constant would significantly affect the AC bulk dielectric constant. This would affect further the calculations of AC density and other mix properties such as the moisture content. Therefore, determining the dielectric properties of aggregates used in AC accurately is essential. To overcome that, establishing an aggregate database has been initiated in this work. The detailed testing methodology and analysis are presented next.
Methodology and Analysis
In rocks or aggregates, the dielectric constant depends on several material characteristics, including minerology, texture, porosity, crystal structure, and water content ( 1 , 2 , 32 ). Aggregates from around Illinois were sampled, and test slabs were built to calculate their dielectric constants. The sampled aggregates were all of size CM16 for consistency. CM16 is an aggregate gradation band specified by Illinois Department of Transportation (IDOT) which corresponds to 100% passing the 0.5 in. (12.5 mm) sieve size. The aggregate’s size was kept relatively small compared to the antenna wavelength to avoid EM wave diffraction from aggregate edges. In this test, a 2 GHz antenna with a wavelength of 5.9 in. (150 mm) in vacuum was used.
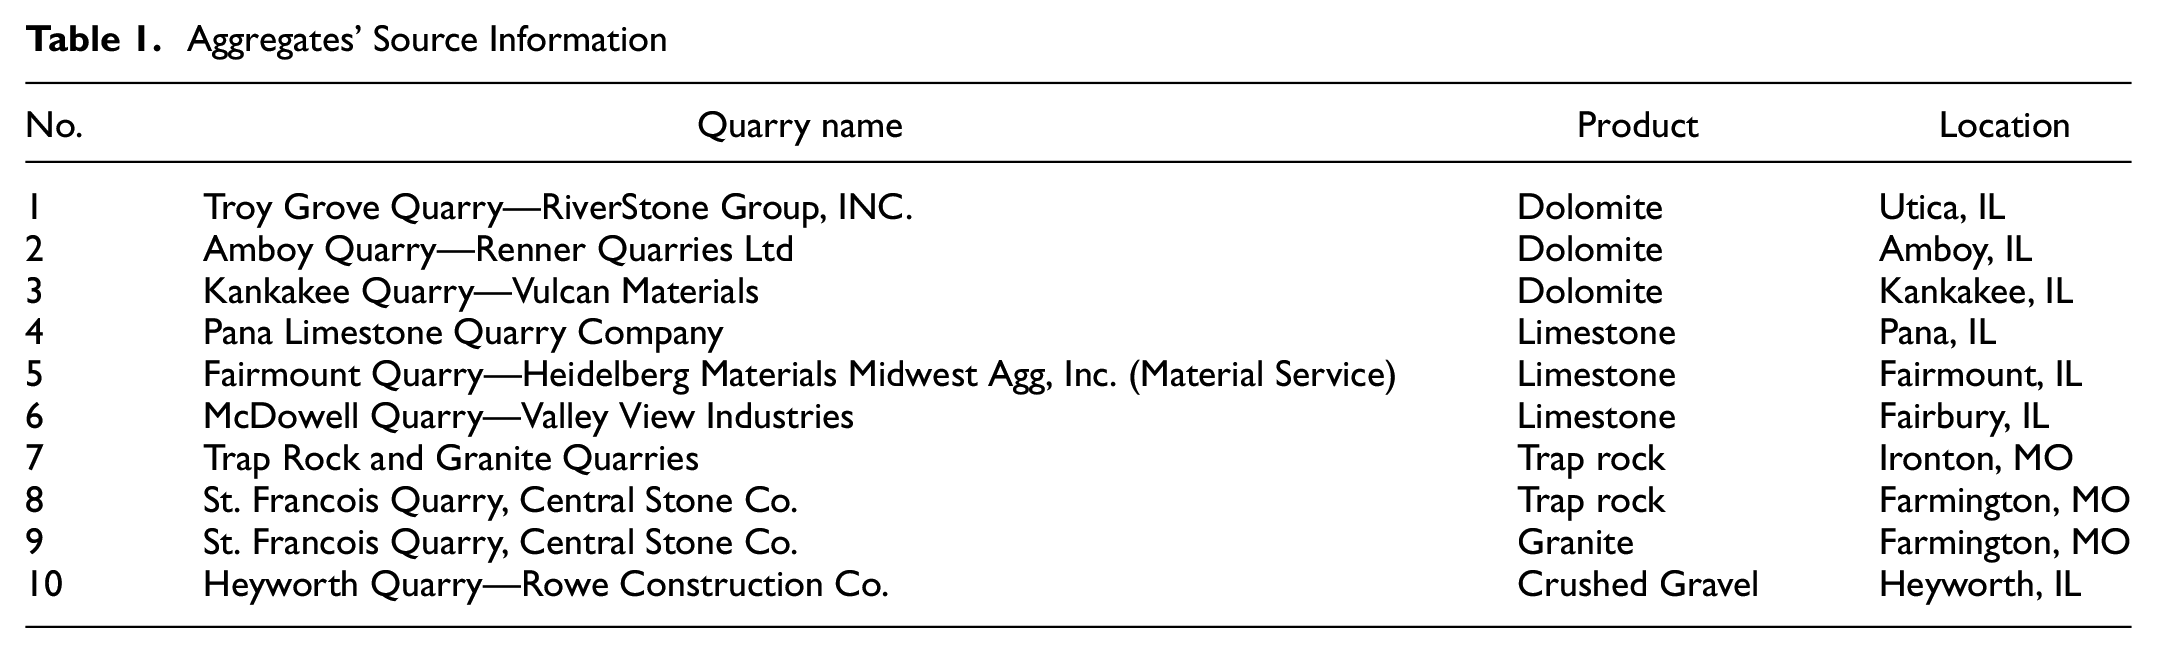
Table 1 presents the source quarries of the 10 aggregate products sampled from Illinois. First, the aggregates were dried overnight (24 h) in an oven at 230°F (110°C) to ensure a dry condition (Figure 3a). The dried aggregates were stored in sealed buckets until testing to avoid water adsorption from the air (Figure 3b). This is particularly significant because moisture has a high dielectric constant of 78 at 68°F (20°C) compared to aggregate materials. Therefore, the existence of a small amount of moisture could hinder the measured dielectric constant of the aggregates. In addition, the drying process simulates the condition of aggregates in AC mixes, which are usually heated and completely dried in the drum at the plant before being mixed and coated with asphalt binder.
Aggregates’ Source Information
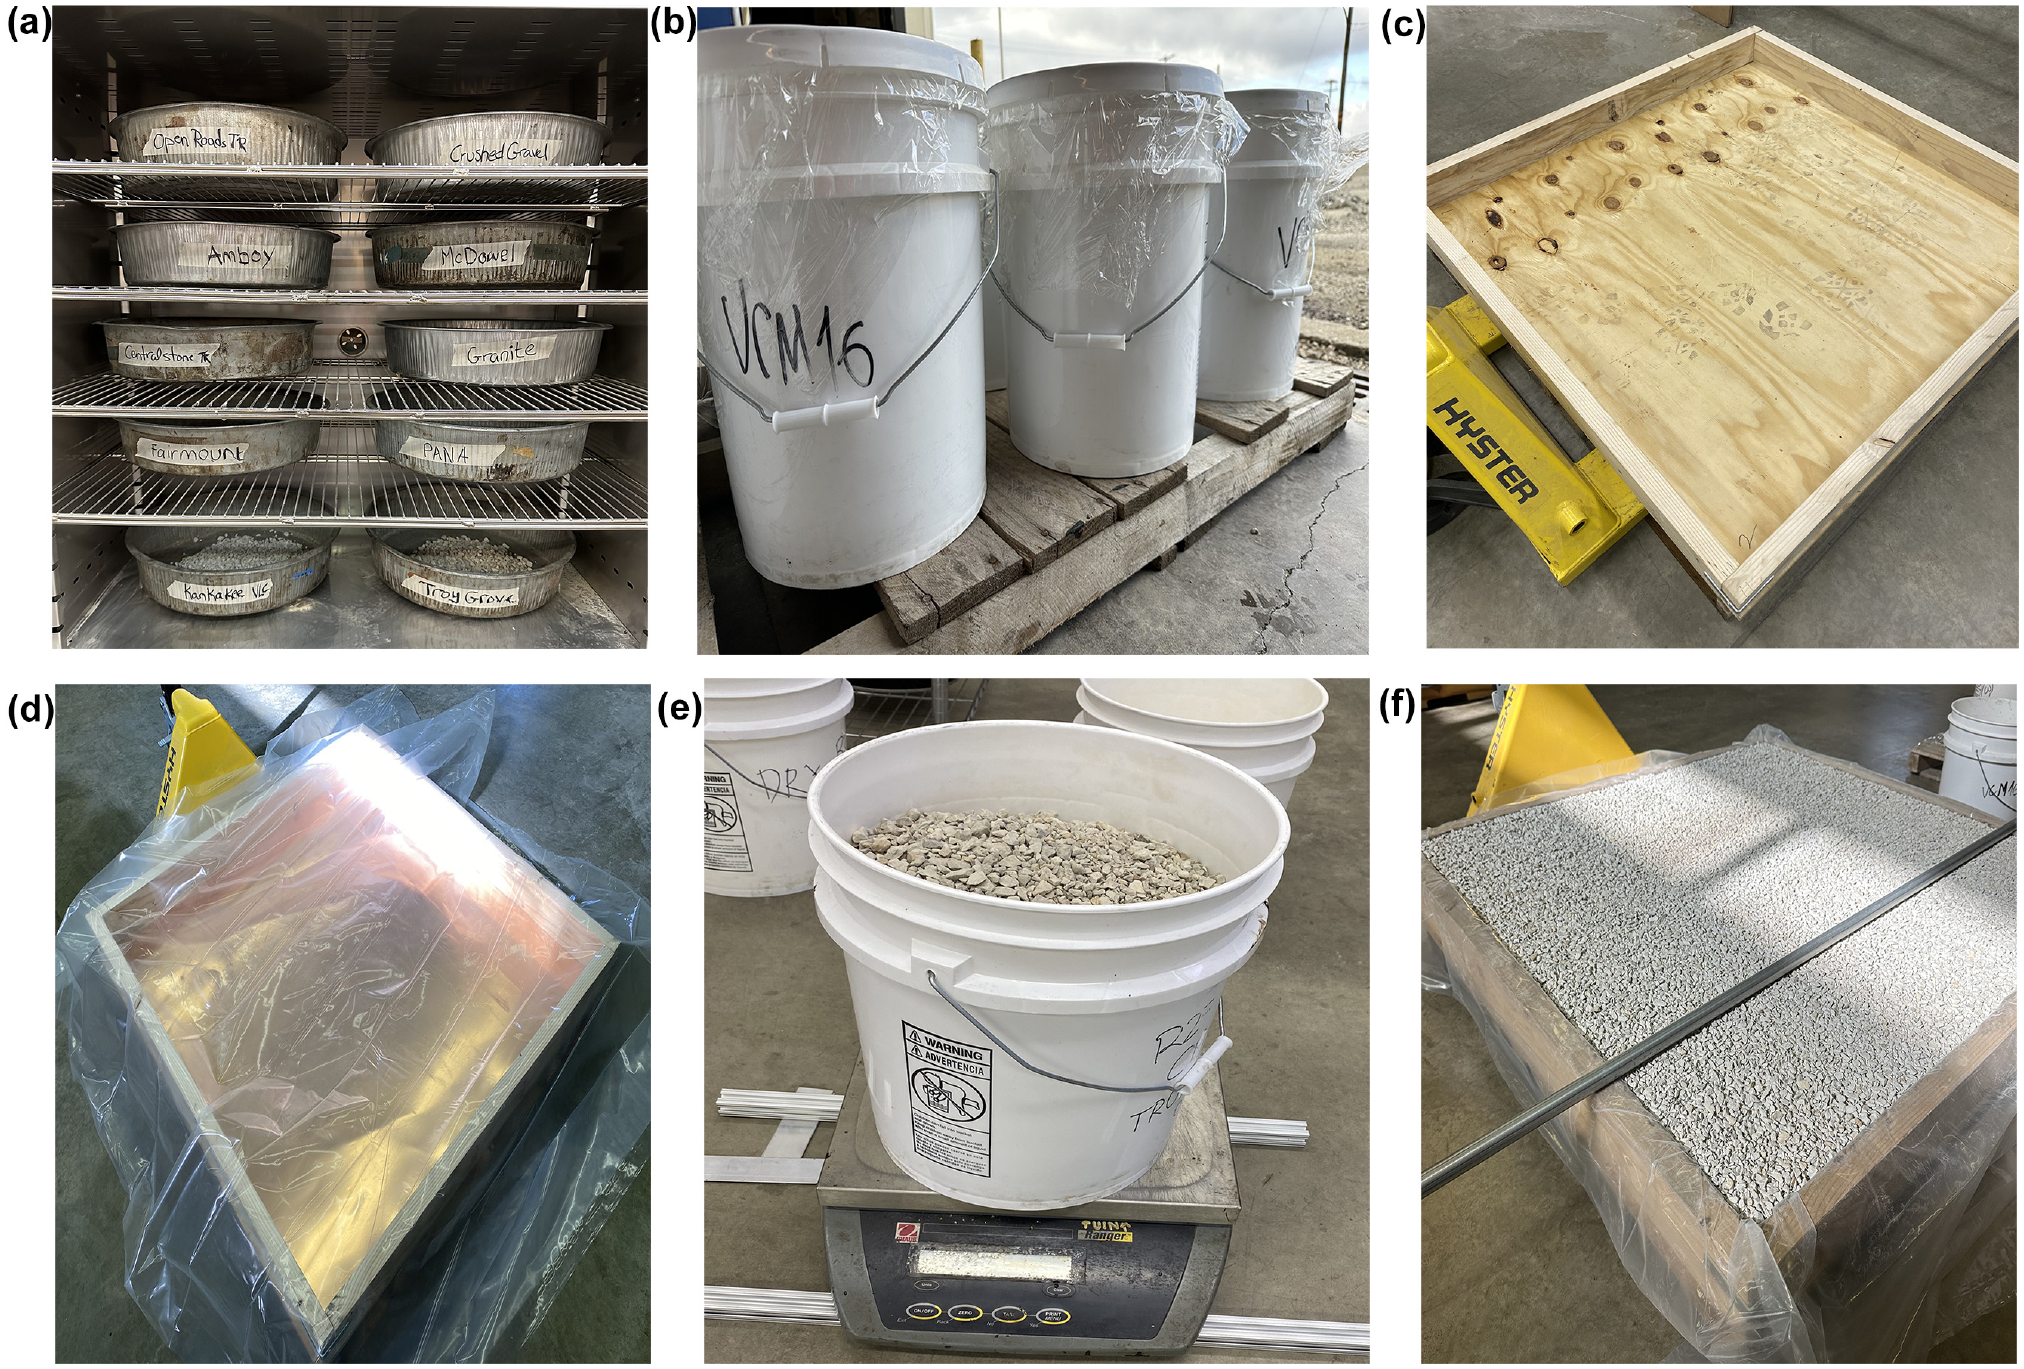
(a) Stacks of aggregates in a conventional oven, (b) dried aggregates’ buckets sealed with plastic wrap, (c) built wood frame, (d) copper plate inserted at the bottom of the wood frame and covered with a thin plastic sheet, (e) weighing of aggregates’ bucket before adding to the wood frame, and (f) surface leveling using a metallic rod.
A wood frame of dimensions 4 ft × 4 ft × 4 in. (1,220 × 1,220 × 102 mm) was prepared (Figure 3c). The wood frame dimensions allow a footprint (geometric spreading) of the antenna at 8 in. (200 mm) height to avoid EM wave edge diffractions. A copper plate was inserted at the bottom of the frame (Figure 3d). The copper plate allows accurate determination of TWTT for dielectric constant calculation using Equation 2, by amplifying the reflection from the bottom of the aggregate specimen. Also, a thin plastic sheet was used to facilitate cleaning, frame reuse, and retention of fine aggregates (Figure 3d). Each dried aggregate bucket was weighed before and after pouring the aggregates into the wood frame to accurately determine the weight of the added aggregates (Figure 3e). The aggregates were placed gently into the wood frame to avoid any aggregate breakage or unintended compaction. The thin plastic sheet was pulled gently during the process to prevent entrapping air. Eight to nine standard 5 gal buckets were needed to completely fill the testing frame. The surface was leveled using a metallic rod to minimize wave scattering, and excess aggregates were returned to the buckets (Figure 3f).
For GPR testing, Figure 4 illustrates the test setup. The air-coupled antenna was mounted above the wood frame by supports. Calibration scans were taken on a copper plate at the same height, rate, and resolution as the tested aggregates. Because of the gentle placement of aggregates in the wood frame, the aggregates had a uniform distribution along the depth, resembling the loose unit weight (LUW) of the aggregates. This was confirmed by comparing the achieved unit weight (weight of aggregates added/volume of wood frame *1,000 kg/m3) with the actual LUW tested following AASHTO T-19 specification ( 33 ). Readings were taken within 1 h after placing the dried aggregates and scanned every 5 min. Each scan duration was approximately 15 s at 92 scans/s rate. Most scans were taken at 1,024 samples per scan to ensure high resolution. The 15 s results were averaged into one trace or A-scan. The dielectric constant calculated by Equations 1 and 2 matched because of homogeneity of the layer along the depth.
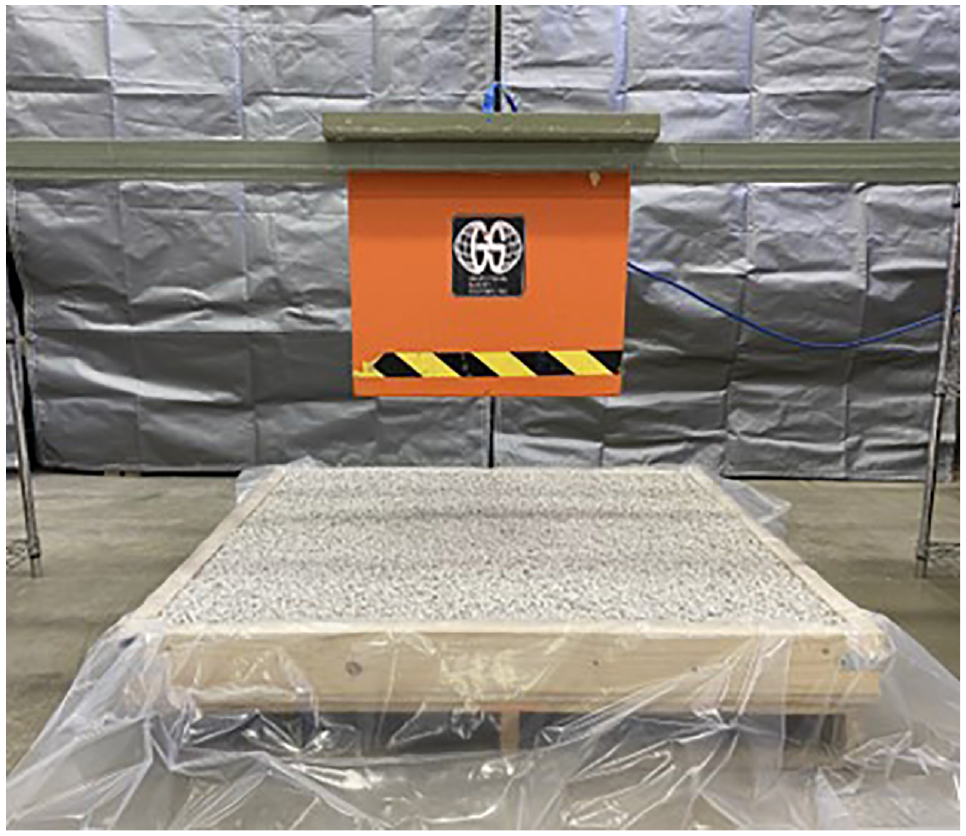
Ground-penetrating radar test setup for aggregates.
Figure 5 shows an example GPR trace from the aggregate specimen. The x-axis shows the time window for the scan (12 ns in this experiment). The bulk dielectric constant may be calculated by Equation 2, where the TWTT is simply the time difference between the top reflection (

where
Vagg = volume of aggregates (m 3 ),
Wagg = total weight of aggregates added to the slab (g), and
Gsb = bulk specific gravity of aggregates (provided by IDOT).
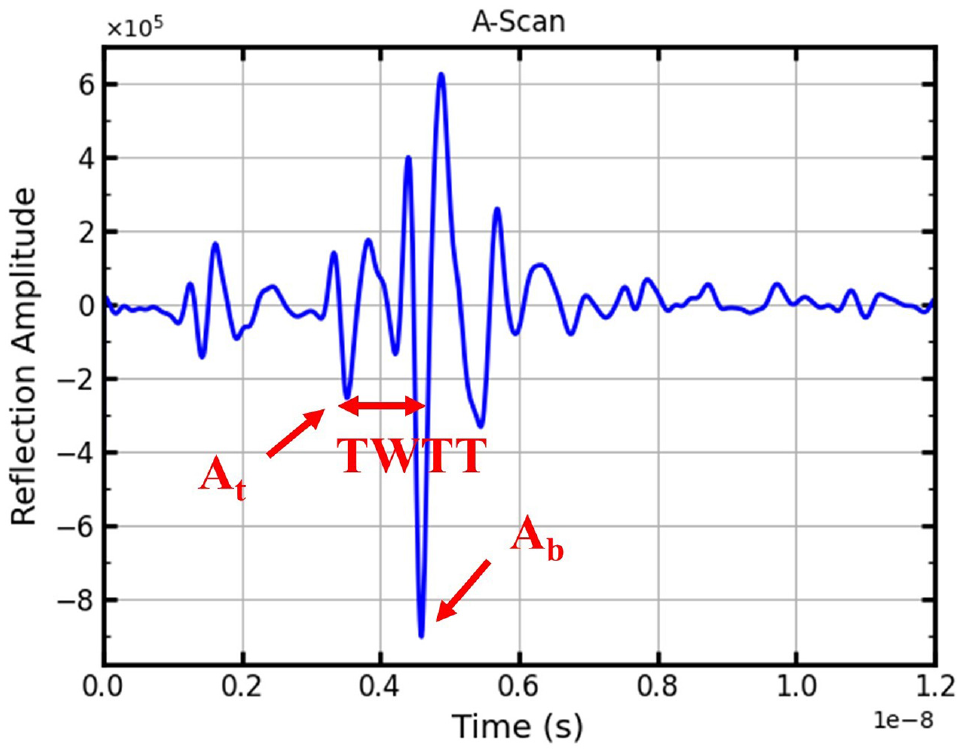
Example ground-penetrating radar trace from aggregate slab.
The Bottcher mixing theory model (Equation 6) is the base model for the ALL density prediction model; therefore, it was chosen for consistency. In this case, the only mix components are air and aggregates, and Equation 6 could be transformed into Equation 7 using a shape factor of u = −0.3 to account for irregular-shaped aggregate inclusions. This shape factor was derived by nonlinear curve fitting for six different AC mixes with various densities and different properties ( 35 ).

where
subscript eff = the effective or bulk,
subscript 0 = the background medium,
subscript i = the ith inclusion component, and
u = a factor to account for the shape of inclusions.

Data processing included simple shift removal, signal instability, and height corrections ( 36 ), and Fourier interpolation for low-resolution data points. Table 2 shows the calculated aggregate dielectric constant values.
Aggregates Dielectric Constant Database
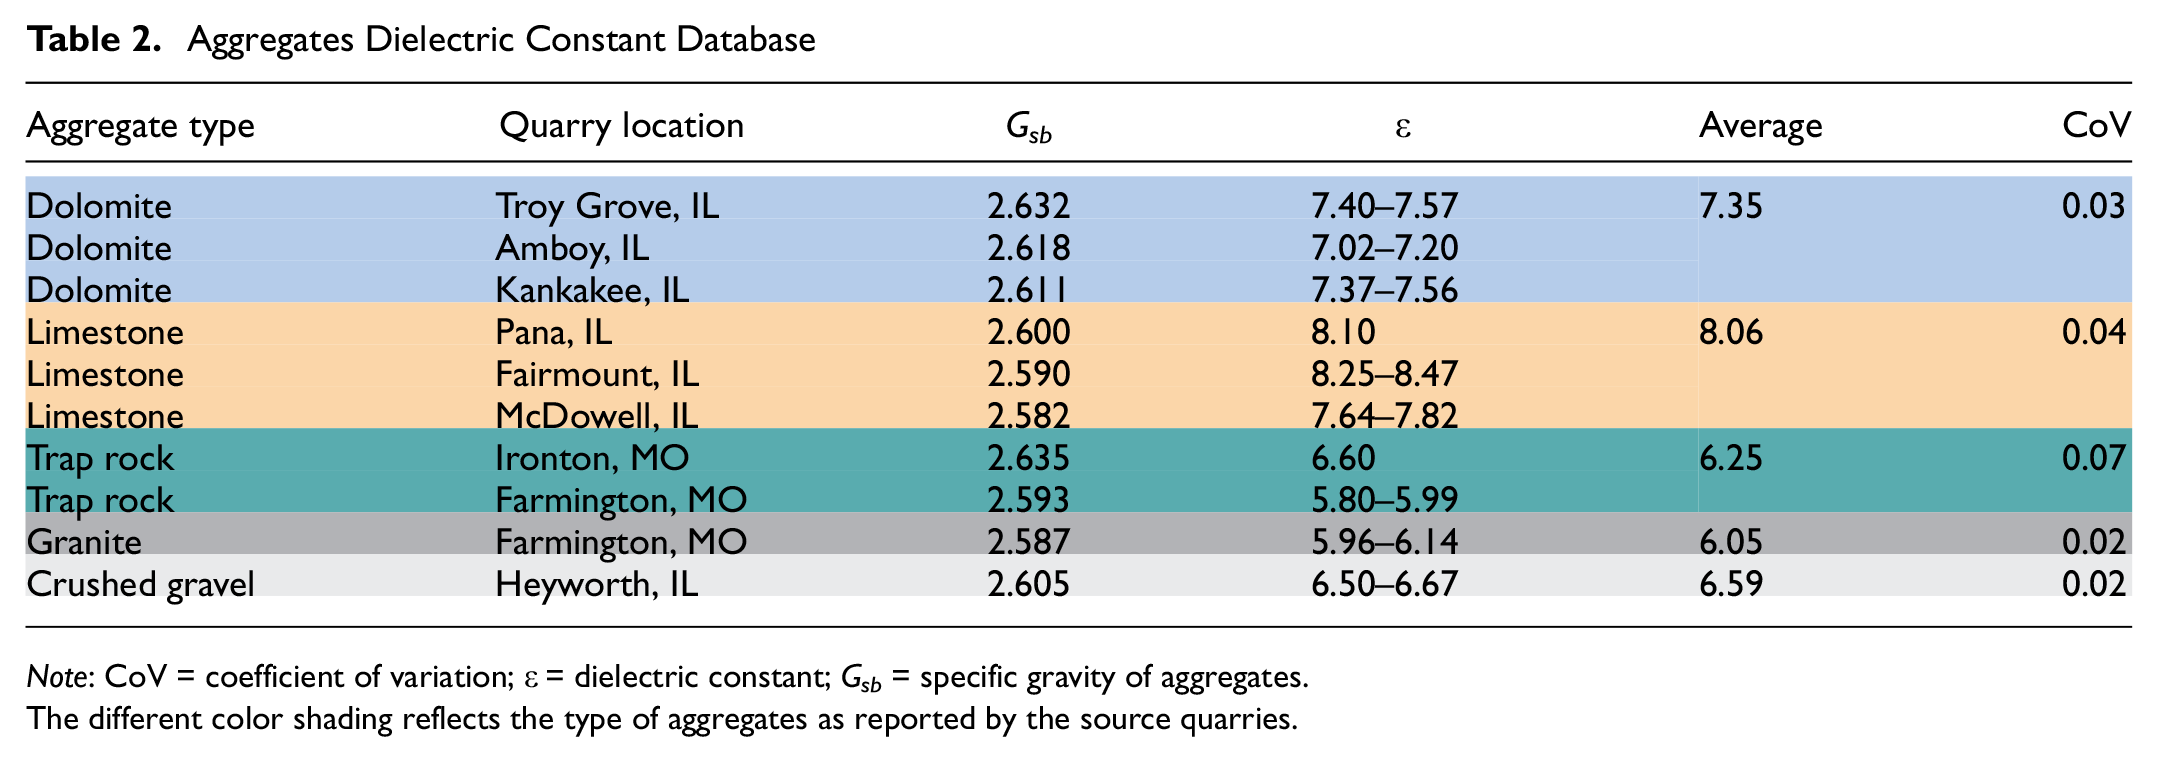
Note: CoV = coefficient of variation;
The different color shading reflects the type of aggregates as reported by the source quarries.
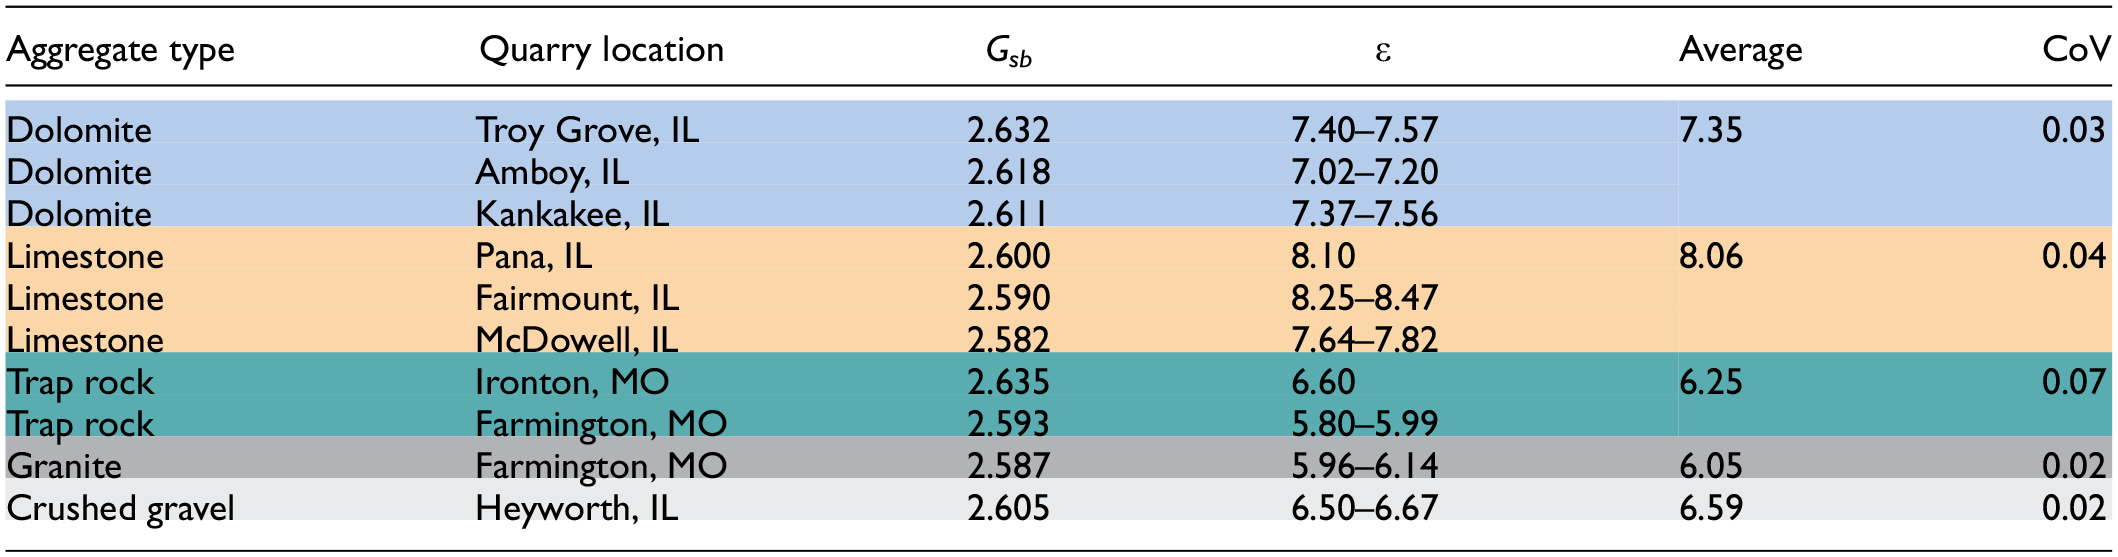
From Table 2, there is a small range of dielectric constant values for some of the tested aggregates. This variation could be attributed to surface wave scattering caused by the rough aggregate surface, or prolonged testing, which may have caused some humidity to diffuse into the aggregate sample. For the same type of aggregate (e.g., limestone), the dielectric constant differed per source as a result of minerology, crystal structure, and geometric shape. Average values in Table 2 could be directly used in AC density prediction models. The obtained values agree with reported values in the literature ( 27 ). For a deeper understanding of the minerology effects on dielectric constant, samples from the 10 aggregates were chemically characterized at the Materials Research Laboratory at the University of Illinois Urbana-Champaign.
Advanced Chemical Analysis
X-ray diffraction (XRD) and X-ray fluorescence (XRF) tests were performed for compound (mineral) and elemental characterization, respectively. Two samples from each aggregate were tested to check variation within aggregate type. XRD allows for classification of the aggregate types using main minerals detected based on crystal structure. For example, for the three dolomite aggregates, the dolomite mineral (MgCa(CO3)2) was dominant (>90%), and for limestone aggregates, calcite (CaCO3) was dominant (>85%). The two different trap rock aggregates showed significant difference in their mineral composition: the one from Ironton mainly had 68% sanidine (KAlSi3O8) and 32% silica (SiO2), while the from Farmington had 45% silica and 44% albite (NaAlSi3O8). This might explain the difference in their dielectric constants in Table 2. Trap rock is a broad category of dark non-granitic igneous rocks. Sampled granite had about 48% silica (SiO2), 31% albite (NaAlSi3O8) and 21% sanidine (KAlSi3O8), which is similar to the composition of the trap rock obtained from the same quarry; therefore, it showed similar dielectric results. For the crushed gravel, one sample was classified as limestone while the other was classified as dolomite, which suggests that these aggregates are highly variable in crystal structure and further analysis such as elemental characterization should be done.
XRF analysis provided the elemental composition, which can offer insights into impurities and elemental effects on the dielectric properties. For example, Figure 6 shows the effect of calcium (Ca) and silicon (Si) contents on the aggregate dielectric constant for the 20 samples. As expected, dolomite and limestone aggregates with high Ca content exhibited relatively high dielectric constants. In contrast, aggregates with more Si content, such as granite and trap rock, had lower dielectric constants. This is because of the higher dielectric constant of the Ca element compared with that of Si. Generally, aggregates with similar elemental composition had similar dielectric constant results. Also, the limestone samples with the highest dielectric constant from Fairmount had around 8% iron (Fe), which would significantly increase the dielectric constant. Granite had the highest percentage of Si (around 78%). This explains its relatively low dielectric constant compared with other aggregate types in Table 2. The two crushed gravel samples have similar elemental composition; however, they have different crystal or mineral structures. This resulted in XRD classification of one as dolomite while the other as limestone. Nevertheless, the crushed gravel samples have a high Si content (higher than Ca or magnesium [Mg] commonly seen in limestone and dolomite). Therefore, the calculated dielectric constant is lower than that of limestone or dolomite. The Si content was not detected in the crushed gravel XRD results. This could be caused by overlapping peaks in the XRD spectrum or high amorphous content ( 37 ). Table 3 briefly presents the XRF results by averaging the results of two samples for each aggregate. Only the top three elements by weight percentage are presented here, whereas each aggregate type had at least 11 elements detected.

Effect of chemical elements on aggregate dielectric constant.
Main Elements Detected in Aggregates by X-ray fluorescence by Percent Weight

Note: Al = aluminum; Ca = calcium; Fe = iron; K = potassium; Mg = magnesium; Si = silicon.
This simple chemical analysis shows the direct connection and correlation between aggregate minerology and dielectric properties. The elemental composition was found to be more influential than mineral composition, especially when impurities that alter dielectric constant exist (e.g., Fe). In general, chemical composition could assist in predicting the dielectric properties of aggregates.
Validation and Discussion
For validation, a highway mix and a Federal Aviation Administration-approved airport AC mix were tested using GPR. The density was predicted by the ALL model using aggregate dielectric constants directly from the established database. The airport AC mix was sampled from Sandeno East, IL (Figure 7a), reheated and mixed in a mobile mixer (Figure 7b), and placed and compacted into a 4 in. (100 mm) layer using hand tamping (Figure 7c). Figure 7d shows the resulting AC specimen and the test setup. The bulk dielectric constant
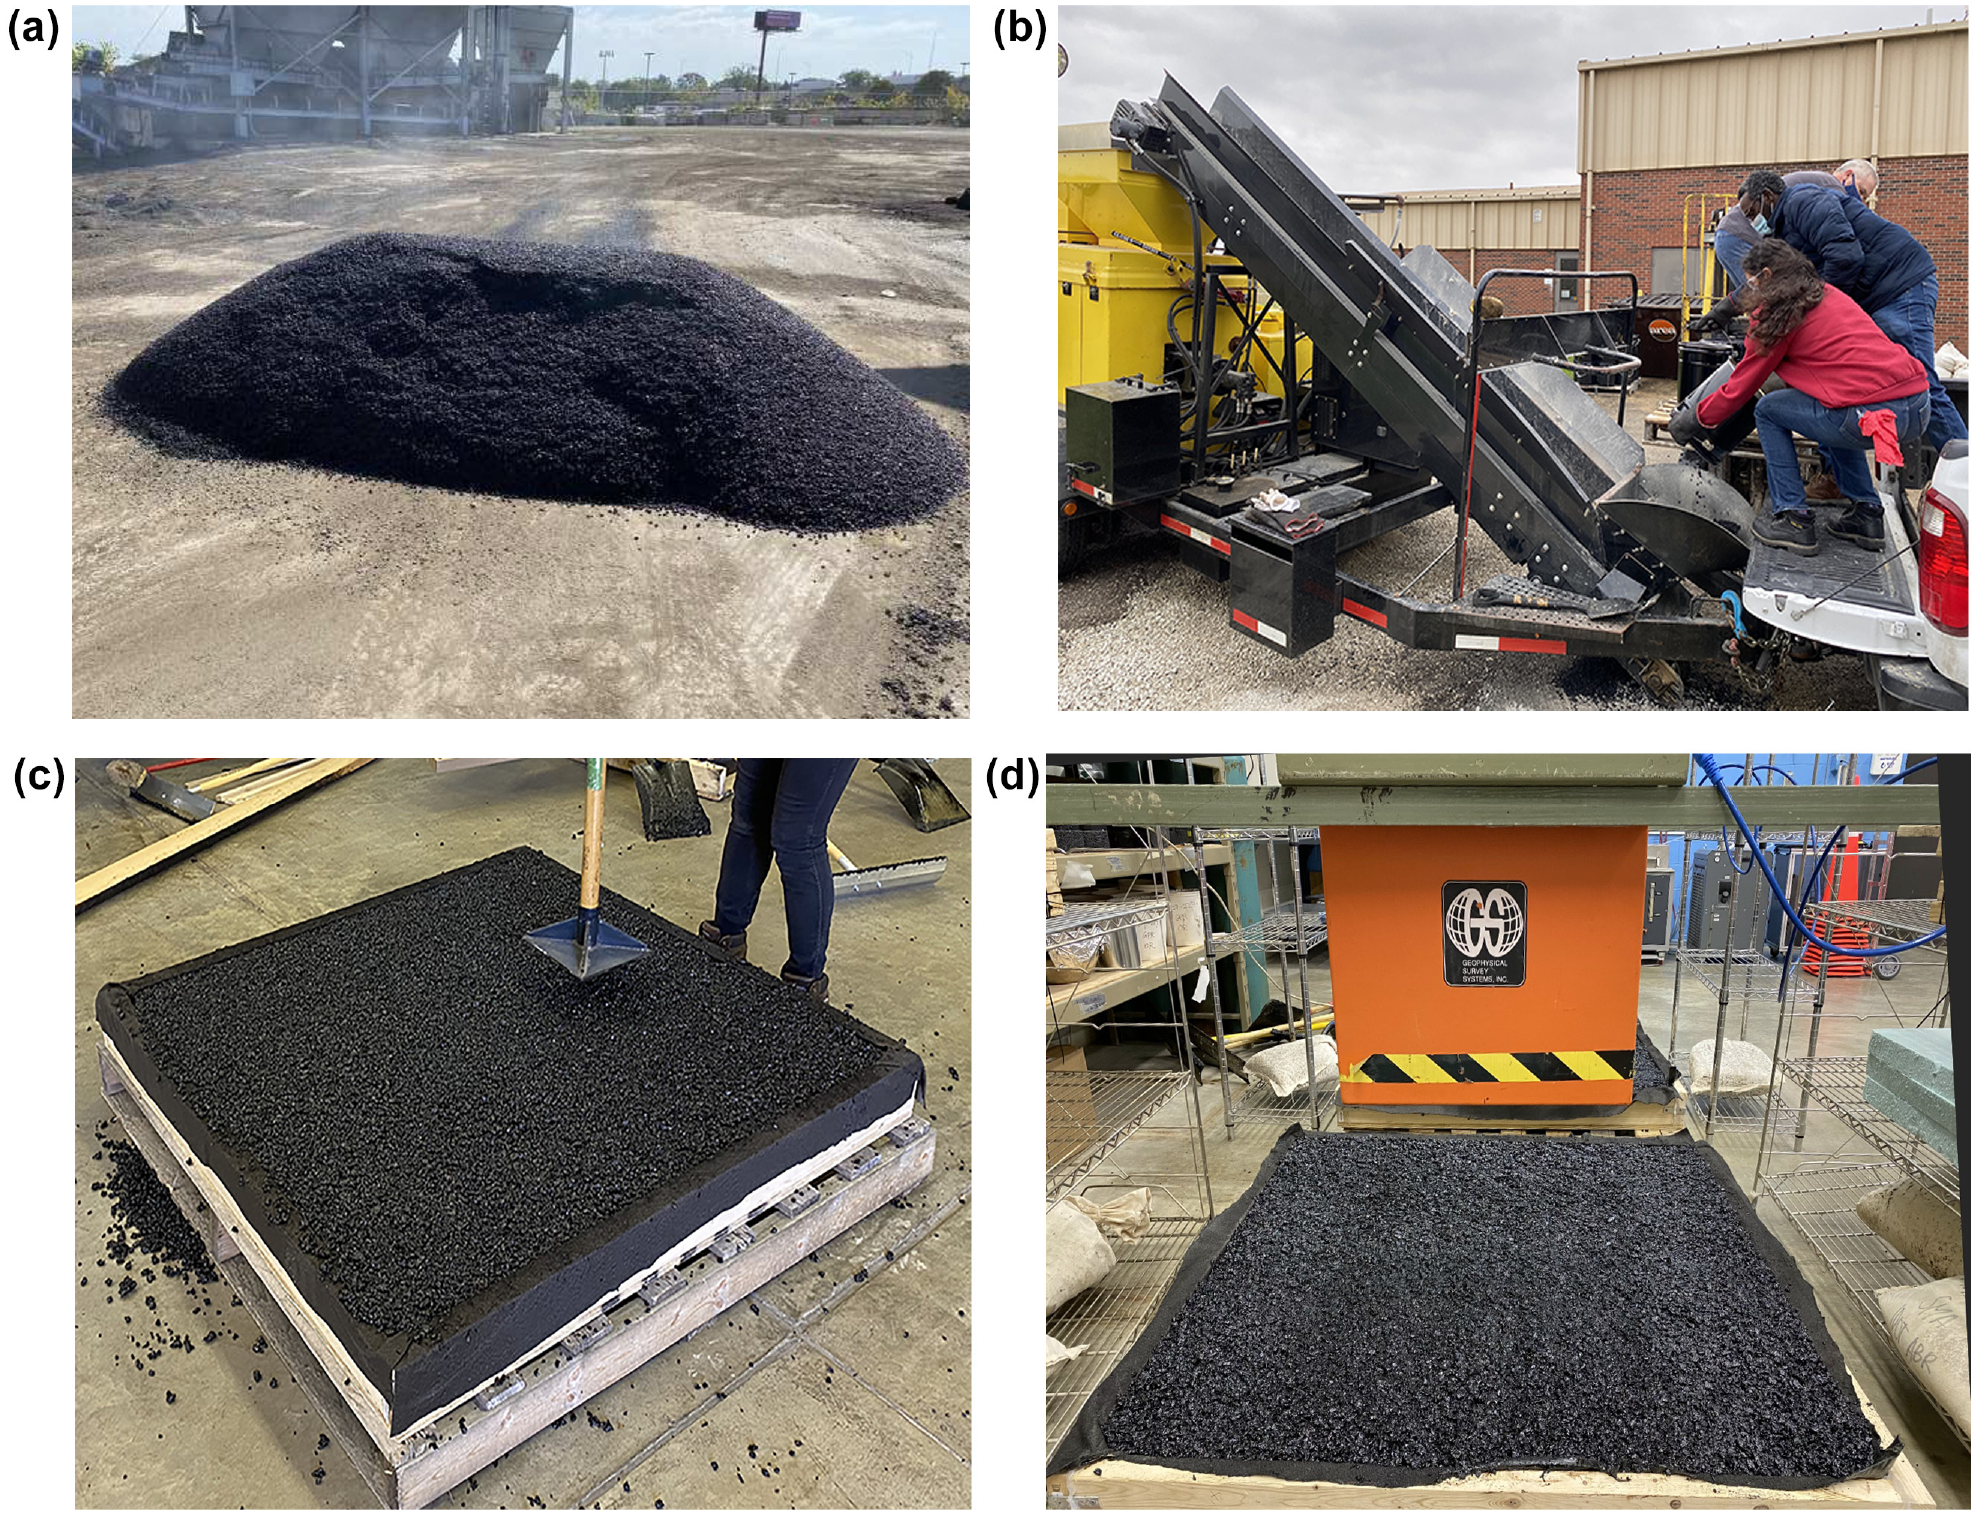
Asphalt slab preparation and testing: (a) sampling from Sandeno East, IL, (b) reheating and remixing, (c) hand tamping, and (d) ground-penetrating radar test setup.
Laboratory Test Slab Inputs and Density Prediction

Note: AV = air voids;
A Home Depot parking lot in Joliet, IL, was used for field validation in September, 2022. The project was paved by Gallagher Asphalt, and included a 12 in. (300 mm) reconstruction in three AC lifts: 6 in. (150 mm) binder, 4 in. (100 mm) intermediate, and 2 in. (50 mm) wearing surface. Figure 8 shows the construction site and pavement cross-section.

Home Depot parking lot, Joliet, IL: (a) construction and (b) asphalt concrete cross-section. Photo: Lama Abufares.
GPR data were collected before, during, and after construction of the first lift. The length of one lane segment was approximately 780 ft (238 m). Equation 1 was used to estimate the dielectric constant for several locations continuously along the lanes. Later, the nuclear gauge operators reported AV of 7% to 7.5% for sporadic locations for the first lift on the first lane. This project mix used 60% aggregates from Thornton, IL, and 20% from Manteno, IL; both quarries produce mainly limestone. Table 5 presents the AC density and AV content calculated using the ALL model for the last continuous scan on the first lane. The estimated dielectric constant was averaged over the lane for the comparison. The predicted Gmb is 2.341 which corresponds to 7.9% AV.
Home Depot Asphalt Concrete Mix Inputs and Density Prediction

Note: AV = air voids;
The results are close to the values produced by the nuclear gauge. The difference in results in this case could be attributed to the following: 1) averaging the dielectric constant across the lane; 2) the use of 20% fractionated reclaimed asphalt pavement, for which the aggregate type is unknown and has aged binder; and 3) the accuracy of the nuclear gauge can be questionable.
The aforementioned cases demonstrate the potential of predicting accurate AC density using GPR. However, it is evident that aggregate type and mineralogy have significant impact on AC density prediction. Therefore, creating an aggregate dielectric constant database is essential to ensure accurate AC prediction using GPR.
Conclusions
A new protocol is proposed to estimate the dielectric constant of aggregates used in AC mixes using GPR and EM mixing theory.
The sensitivity of AC bulk dielectric constant and predicted density to aggregate dielectric constant highlights the importance of establishing an aggregate database for real-time nondestructive AC density prediction in asphalt pavements.
Advanced XRD and XRF analyses confirm that aggregate dielectric constant is influenced by aggregate mineralogy and chemical composition.
A 10-aggegate database was established for the State of Illinois. The aggregate database may be extended to other states to include all aggregates used in the pavement industry. The aggregate database approach was validated against laboratory and field tests.
The feasibility of modeling dielectric properties of aggregates using their minerology can be further researched and used in AC density prediction. Also, the effect of having different aggregate types (and reclaimed asphalt pavement or additives) in the same mix should be investigated.
Footnotes
Acknowledgements
The authors would like to acknowledge the help of Qingqing Cao, Mohammad Fakhreddine, Javier Garcia Mainieri, Egemen Okte, and ICT research engineers Greg Renshaw, Mohsen Motlagh and Uthman Mohammad Ali for their help throughout this study. Chemical characterization tests were carried out in the Illinois Materials Research Laboratory Central Research Facilities, University of Illinois Urbana-Champaign.
Author Contributions
The authors confirm contribution to the paper as follows: study conception and design: I. Al-Qadi, L. Abufares; data collection: L. Abufares, I. Al-Qadi; analysis and interpretation of results: L. Abufares, I. Al-Qadi; draft manuscript preparation: L. Abufares, I. Al-Qadi. All authors reviewed the results and approved the final version of the manuscript.
Declaration of Conflicting Interests
The author(s) declared no potential conflicts of interest with respect to the research, authorship, and/or publication of this article.
Funding
The author(s) disclosed receipt of the following financial support for the research, authorship, and/or publication of this article: This publication is based on the results of research funded by the Federal Highway Administration (FHWA) as part of the Accelerating Market Readiness (AMR) award. Federal Grant or other Identifying Award Number: 693JJ32150008.

The authors are representatives of the Illinois Center for Transportation (ICT). The contents of this paper reflect the views of the authors, who are responsible for the facts and the accuracy of the data presented here. The contents do not necessarily reflect the official view or policies of ICT. This paper does not constitute a standard, specifications, or regulations.