



Abstract
Travel time reliability (TTR) holds significant importance as an evaluation index in the transportation industry. To simplify TTR calculations at the network level in engineering applications, this paper re-examines the highway network from the perspective of system theory, regards it as a road network system consisting of multiple subsystems, and proposes a framework for calculating the TTR of the highway network based on the information entropy model. The information entropy model is employed to quantify the level of disorder within the temporal distribution, thereby substituting the need for fitting or deducing the distribution function as practiced in conventional methodologies. The design of roadway indicators considers the social attributes of the transportation network, making reliability not solely dependent on temporal data. For the case study, we used data from the electronic toll collection gantry system on the Xi’an bypass highway. The results indicate that the TTR of the inner ring within the ring network is significantly higher than that of the outer ring. Furthermore, the reliability of the network is lower than that of any sub-section, during both peak and off-peak hours. The applicability of the proposed computational framework is demonstrated and the nature of the results is explored in comparisons with traditional metrics and time prediction attempts. The approach to the TTR evaluation problem from a novel perspective presented in this research omits the procedure of fitting the time distribution function and avoids being affected by its heterogeneity, making TTR calculation and extension more efficient and convenient.
Keywords
Since the 1990s, the study of travel time reliability (TTR) has attracted increasing attention. Numerous studies have been conducted to show that TTR is a vital aspect of the transport system and reflects the system’s level of service ( 1 , 2 ). It not only influences the choice of travel behavior of travelers, but also serves as a reference factor for managers in their planning processes. The concept of TTR was first introduced in 1991 and was defined as the ratio of a vehicle’s travel time in a congested road network to its travel time in a free-flow state ( 3 ). The TTR of a transport network is also considered to be the probability of passenger flows reaching their destinations within a specified time ( 4 ). Additionally, TTR plays a crucial role in guiding various transportation planning efforts. For instance, in freight transportation, routes characterized by higher TTR should be prioritized ( 5 ). Moreover, during emergencies necessitating evacuation or rescue operations, the failure to consider the TTR of the road network in devising evacuation or rescue pathways can significantly raise the likelihood of rescue delays, consequently amplifying the adverse impact of the disaster ( 6 – 8 ). For these reasons, the study of evaluation methods for TTR in road networks holds practical significance.
The measurement of TTR is typically inferred indirectly by assessing the variability of travel times. The prevailing approach is to fit a distribution function based on data or deduce the time distribution function from uncertain sources, and subsequently evaluate the reliability ( 9 ). The standard deviation and coefficient of variation are commonly employed as parameters to describe the variability of travel times, and they can be determined by examining the distribution of travel times ( 10 ). According to the highway capacity manual, the planning time index and the buffer index are suggested as the main indicators for the evaluation of highway time reliability ( 11 ). Several studies have suggested that the lognormal distribution provides the best fit for travel times, while others obtained a better fit using the Burr distribution as an indicator for assessing TTR ( 12 , 13 ). Nevertheless, owing to the skewed distribution of travel times, reliability estimates based on the mean or variance may be biased. Therefore, a study has introduced a percentile reliability metric that takes into account both the width and skewness of the distribution ( 14 ). Moreover, some scholars have also noted the relevance of the concept of entropy in information theory to TTR, which involves not only the variance but also the probability density function, in contrast to the traditional approach based on entropy. As a result, information entropy models have been used to evaluate and analyze the TTR of road networks and bus routes ( 15 , 16 ). Meanwhile, research has also been done to extend TTR from a predictability perspective based on the Lempel–Ziv algorithm in information theory, which provides an upper limit on travel time predictability ( 17 ).
The majority of applications involving TTR concentrate on selecting travel behavior and assessing system performance ( 18 ). Furthermore, TTR is recognized as a crucial attribute of the freight system, potentially surpassing the significance of transport speed ( 19 ). Given its practical significance, TTR also plays a role in road pricing strategies and traffic assignment modeling ( 20 , 21 ). Simultaneously, this paper posits that as emergency management systems continue to advance globally, TTR will become an indispensable indicator in route planning and decision-making related to rescue operations.
Based on the previous review, we believe that there are several additional areas of difficulty that need to be improved.
(1) Traditional approach lacks generality and efficiency. The classical measure relies on statistical standard deviation to achieve reliability evaluation of travel time through fitting or deriving a distribution function. Nonetheless, owing to the correlation between distinct distribution functions and diverse fitting tests, and the resulting variation in outcomes from these tests, this approach lacks generality and efficiency. Furthermore, the cumulative distribution function and its inverse function used to fit the time distribution may not have a closed-formed expression (e.g., Gamma distribution), which will directly affect the efficiency of reliability calculations ( 22 ).
(2) Not convenient to expand to network level. The commonly used TTR measurement framework typically involves four steps: extracting link data sets, constructing link models, developing route models, and establishing network models. It is widely recognized that TTR is a critical evaluation metric for assessing the operation of a road network, and therefore, management requires a modeling framework that is as simple and quick as possible to extend reliability to the network level, so that TTR can perform its evaluation function.
(3) Relying only on data-driven and hard-to-guarantee data accuracy. Researchers have primarily relied on data collected by loop detectors and radar sensors, or GPS devices to evaluate and analyze TTR ( 23 – 25 ). However, owing to the limitations imposed by the size of the installed monitoring equipment and the number of GPS users, the obtained data may not always provide an accurate representation of road conditions, thereby raising concerns about the temporal accuracy of the dataset.
In this paper, we aim to address these issues from a new perspective to complete the reliability evaluation. An information entropy model is proposed for evaluating TTR at the highway network level. It utilizes data obtained from electronic toll collection (ETC) gantry systems established on the highway network.
This paper is organized as follows. A computational framework is introduced in the second section, and we describe the ETC gantry system and data processing problems in the third section. In fourth section TTR analysis, discussion of results and model verification are presented. The final section presents conclusions and future work.
Methodology
The foundational theory and modeling of information entropy are introduced in the section on modeling. Additionally, an information entropy model is proposed to calculate TTR at the road network level, framed within a systems theory perspective. Following that, the road network weight section provides detailed elaboration of the computational framework and model parameters as proposed in this study.
Modeling
The concept of entropy originated in thermodynamics and has been applied in various fields after its introduction to information theory to describe the current disordered state of a system at present ( 26 ). For example, the information entropy model is frequently employed in network systems and communications for anomaly traffic detection ( 27 ). Additionally, it also serves as an assessment model for environmental quality evaluation ( 28 ). A highway network system is a type of transportation system and its operational condition is profoundly influenced by internal and external factors. Consequently, the utilization of an information entropy model can effectively assess the level of disorganization of the highway network system, and can always integrate the system’s internal and external influences in the assessment process.
To quantify TTR through the information entropy model, a foundational understanding of specific concepts and their properties, particularly entropy, is essential. Entropy is the measure of uncertainty in a random variable. Generally, a higher entropy value indicates a greater degree of uncertainty and chaos within the system. The information entropy model typically comprises two primary components: one calculates the extent of disorder within the internal state, whereas the other computes the overall entropy value of the system.
Random variables may be discrete or continuous, assuming the system


Then, the information for each state is:

The information entropy of the system is expressed as:

For the continuous system

where
According to Equation 5, it can be assumed that
Inspired by general systems theory ( 29 ), the behavior of a system relating to that of its constituent components and the interrelationships between those components, we regard the highway network as a network system constituted by several segment systems, as shown in Figure 1. The highway network forms a very complicated and stochastic system since it is a part of a huge social system and is affected by both its internal and external systems. Concurrently, it is recognized that entropy serves as a metric for the uncertainty inherent in a random variable, and travel time can be precisely classified as a random variable. Therefore, we formulate a TTR calculation framework based on the information entropy model. As mentioned above, the approach considers the degree of chaos in the network system and can also extract information concerning the uncertainty of the random variable representing travel time, where the calculation of entropy value has a substantial correlation with reliability.
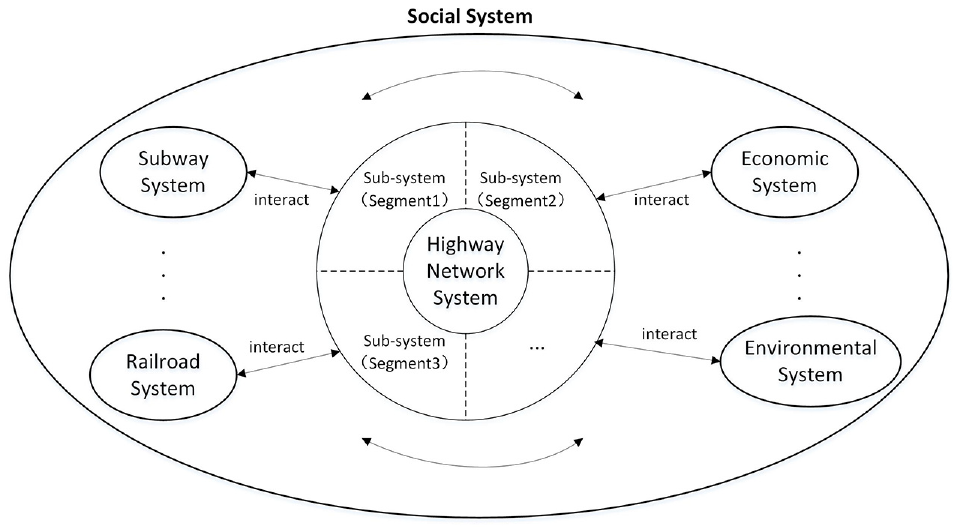
Highway network system observed based on system theory perspective.
The highway network is regarded as a discrete system consisting of multiple segments, with travel time represented as a discrete variable. Varying combinations of travel times for these segments represent a random state of the system. The normal operation of the road network is assumed, without accounting for adverse weather conditions, traffic accidents, or other factors. Based on the above formula, the following model is established to represent the time uncertainty information contained in each road segment (



where


where
Road Network Weight
Most of the traditional measurements rely only on travel time data, which makes it difficult to estimate reliability at the network level, and it is not possible to take into account the influence of the nearby environment and the properties of the road segment on the calculation results.
Therefore, four environmental factors and two own attribute factors are selected from the perspective of system theory to establish the weights of each road segment
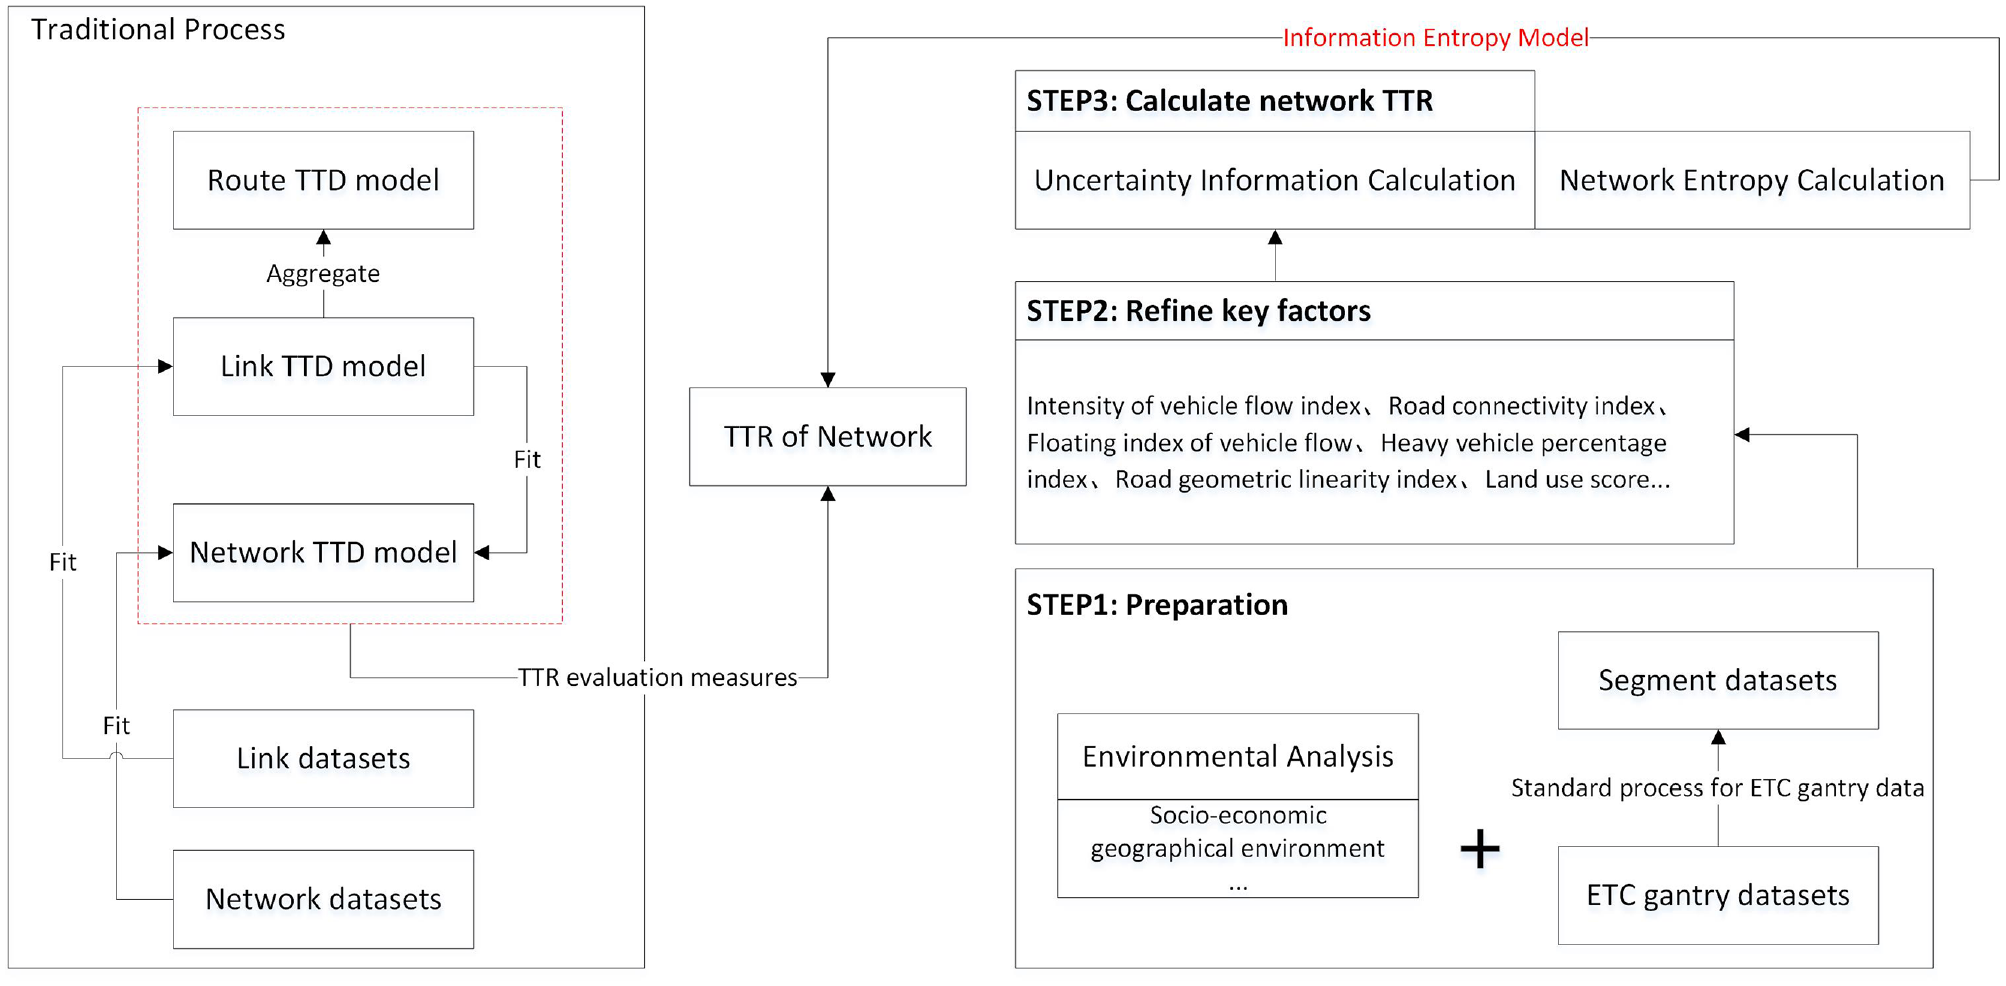
Framework of the proposed approach versus traditional process. (Color online only.)
The reliability index for each road segment could be calculated from the six weighting indices as follows:
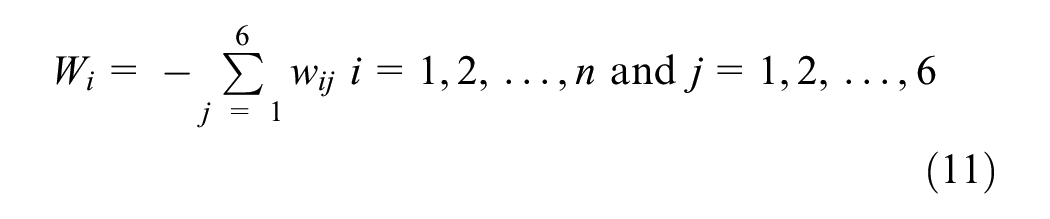

where
(1) Intensity of vehicle flow index
This index is defined as the ratio of the volume of traffic on the study segment to the total volume of traffic in the road network during the study period. The index is given by

where
(2) Road connectivity index
For the observed segment of highway, the vehicle has two traffic patterns: the vehicle travels all of the observed highway mileage or only part of the observed highway mileage. The number of vehicles belonging to the first category of traffic modes is referred to as OD traffic, whereas the number of vehicles falling under the second category is termed “partial traffic”. Generally, the average speed of OD traffic is higher than that of partial traffic, as vehicles in the latter mode may spend more time waiting in queues at entrance or exit ramps. Since the uncertainty of travel time on the evaluated segments necessitates considering the interaction between these two modes of traffic, the road connectivity index is devised to reflect the impact of OD and partial flows on the overall travel time on the road. This index is determined by the ratio of OD flow on the segment to the total flow during the study period and can be calculated using the following equation.

where
(3) Floating index of vehicle flow
This index is designed as the ratio of the difference between the maximum and minimum traffic volumes on a road segment to the average traffic volume during the study period. The index can be expressed as:

where
(4) Heavy vehicle percentage index
The presence of varying percentages of heavy vehicles has a substantial impact on both traffic flow and average speed ( 31 ). Typically, as the proportion of heavy vehicles increases, the average road speed decreases, consequently resulting in fluctuations in travel time. Therefore, the percentage of heavy vehicles is regarded as a crucial factor strongly influencing road travel time. In this study, we define this index as the ratio of heavy vehicle traffic to total traffic on the road during the study period, which can be calculated using the following equation.

where
(5) Road geometric linearity index
In the case of this paper, a continuous highway is chosen as the study road network. It is divided into several adjacent subsections with approximately the same geometric linearity. The index is defined as the ratio of the length of each subsection to the total length of the road network, and the calculation formula is expressed as follows:

where
(6) Land use score
Considering the distinct functions of various city areas, akin to poi data, their impact on traffic flow characteristics in those regions is direct. For instance, taking the city under investigation as an example, its tertiary industry gross domestic product (GDP) accounted for approximately 63.57% of the regional GDP in 2021, signifying a considerably higher traffic volume in the commercial area compared with other regions. According to urban land use planning, the land use attributes are divided into four types: commercial, residential, cultural, and industrial. The value of this index is determined based on the land use attributes of the areas adjacent to the segments. Commercial area generally receives the highest score, while industrial area gets the lowest. Specific scoring rules and the case scores in this paper are shown in Table 1.
Guidelines for Index Values for Determining the Score of Land Use

Data Description
Level 1 ETC Gantry System
This paper employs data collected by the ETC gantry system to assess the reliability of travel times at both road segments and network levels. The data undergo analysis and filtering to derive a rational road network travel time, which is subsequently utilized in an information entropy model to calculate the level of TTR.
The ETC gantry, a device placed to identify vehicle information on highways (as shown in Figure 3), began to be extensively installed on China’s highways in 2019. Up to now the total number of ETC vehicle users in China has exceeded 100 million. Such a huge coverage scale forms a large traffic operation sensing network. In this network, vehicles act as nodes, and their travel behavior is accurately sensed and quantified. Unlike GPS data, which may lack complete vehicle information on the road, the data obtained from this sensing network, covering the entire highway range, are more comprehensive and realistic. The significant advantage of the gantry information lies in its capability to provide full road network coverage, allowing researchers to accurately reproduce vehicle trajectories and calculate more realistic travel times. As a result, ETC gantry data have been increasingly utilized for traffic flow prediction studies in recent years ( 32 ). The information collected by the system will be transmitted to the terminal big data platform in real time, providing researchers with an enormous amount of gantry data for analysis and mining ( 33 , 34 ). The output is then fed back to pedestrians and decision-makers to enhance the travel experience and improve the service level of the road network.
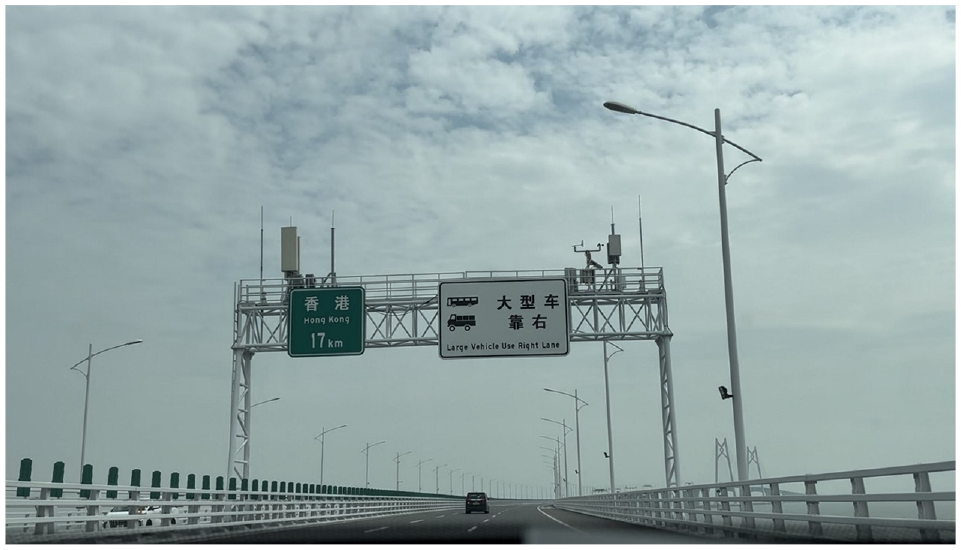
Electronic toll collection (ETC) gantry.
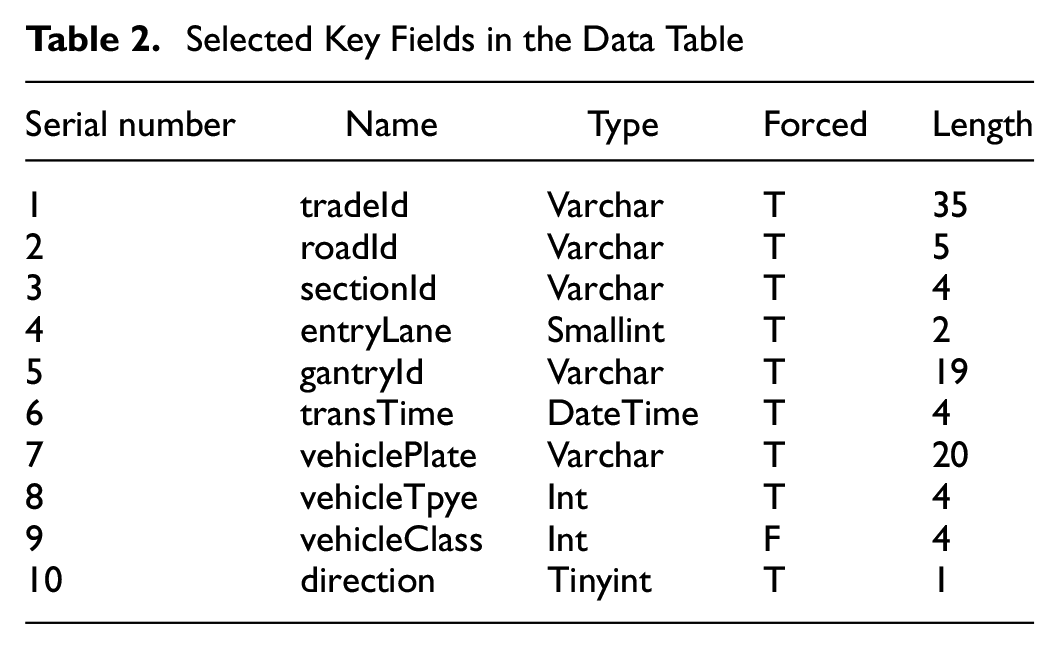
The ETC gantry system has functions such as sectional billing, flow survey, video monitoring, speed screening, and so forth. It is mainly installed with lane controllers, Road Side Unit (RSUs), high-definition (HD) cameras, and HD plate image recognition equipment (including fill light equipment). The gantry data are generally divided into three categories: gantry transaction data, gantry image data, and license plate recognition flow data. Each data set contains hundreds of items. Table 2 selects some of the key fields of the data table to display.
Selected Key Fields in the Data Table
Level 2 Data Analysis
In this section, the authors study the Hechizhai interchange to Qujiang interchange of the Xi’an City bypass highway network in China to estimate the road network’s TTR, as shown in Figure 4. The road network segment is abstracted in Figure 5, comprising four pairs of ETC gantries with a total length of 12.4 km, divided into two travel directions: the inner ring (Qujiang → Hechizhai) and the outer ring (Hechizhai → Qujiang). As shown in the diagram, the road network is divided into six segments, denoted S1 to S6, depending on the location of the gantries and the direction of travel. Notably, S1 and S6 represent segments of the same path in different directions, spanning 6.1 km. Similarly, S2 and S5 are 3.7 km long, while S3 and S4 are 2.6 km in length.
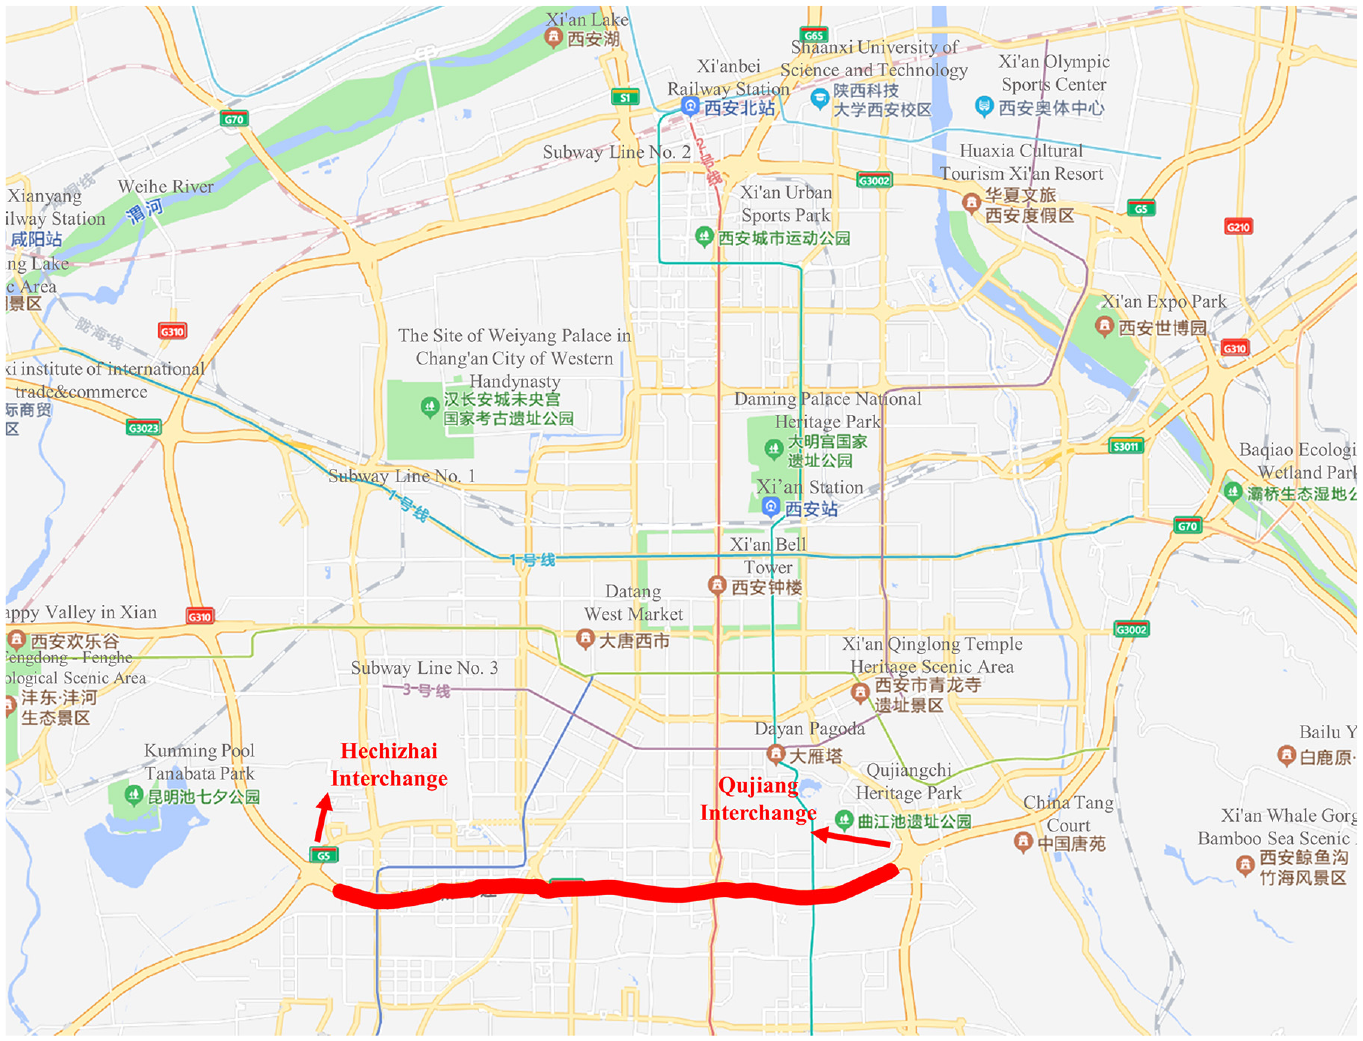
Hechizhai interchange to Qujiang interchange of the Xi’an City bypass highway network.
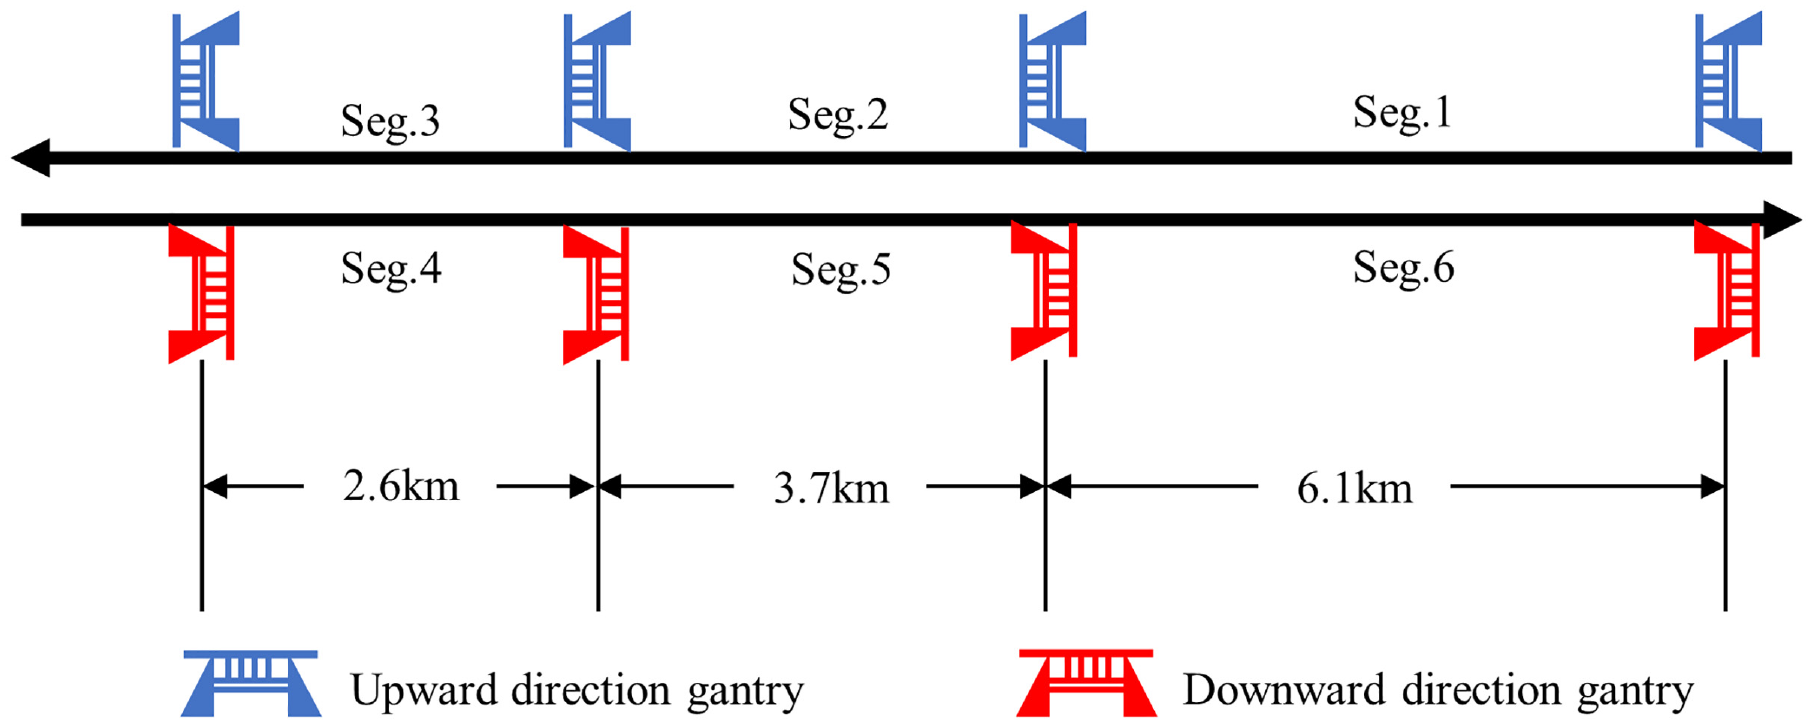
Abstracted segments of the road network.
Five keywords were selected for TTR analysis: gantryId, vehiclePlate, transTime, vehicleClass, and vehicleTpye. The vehiclePlate is unique and is used to locate data for each vehicle. Vehicle type statistics obtained according to vehicleTpye, and vehicleClass data can discriminate between special vehicles and ordinary vehicles. Vehicle travel times are obtained using transTime data from adjacent gantries. ETC gantries are numbered according to the direction of travel as gantry 1, gantry 2, and so forth.

where
The ETC dataset is classified by gantry number and also contains several redundancies. For this reason, we propose a standard process for data processing to increase the analytical possibilities of the dataset. Firstly, the ETC dataset is divide into individual segment datasets. An ideal segment data set would include two neighboring gantry data sets, with each vehicle plate appearing twice to record the entrance and departure gantry data. Subsequently, the segment data are further categorized based on time into two sets: peak hour data (07:30–09:00) and off-peak hour data (09:00–10:30). Finally, some anomalous data collected owing to equipment failure and some inappropriate data captured by special travel tracks must be eliminated to make the travel time dataset universal and valid. Data with the following characteristics should be excluded:
(1) data for license plate records that appear only once or more than three times in the segment data set;
(2) data where the exit gantry ID is the same as the entrance gantry ID;
(3) data with abnormal exit and entrance gantry transaction times, mainly refer to that the exit moment is earlier than or equal to the entrance moment;
(4) data of special vehicles (police vehicles, military vehicles, ambulances, etc.), which are discriminated using the vehicleClass data;
(5) data of abnormal travel time (too long or too short).
When carrying out data processing, the abnormal numbers and inappropriate data in categories (1), (2), (3), and (4) above are first deleted, and then handling the fifth type of data. The data processing flow is shown in Figure 6, and the distribution of travel times (for a particular day) before and after processing the abnormal data is compared in Figure 7. Notably, the post-processing time distribution exhibits a tendency toward normal distribution. It is imperative to highlight that this article assumes normal traffic conditions on the highway and does not account for the effects of severe weather or traffic accidents.
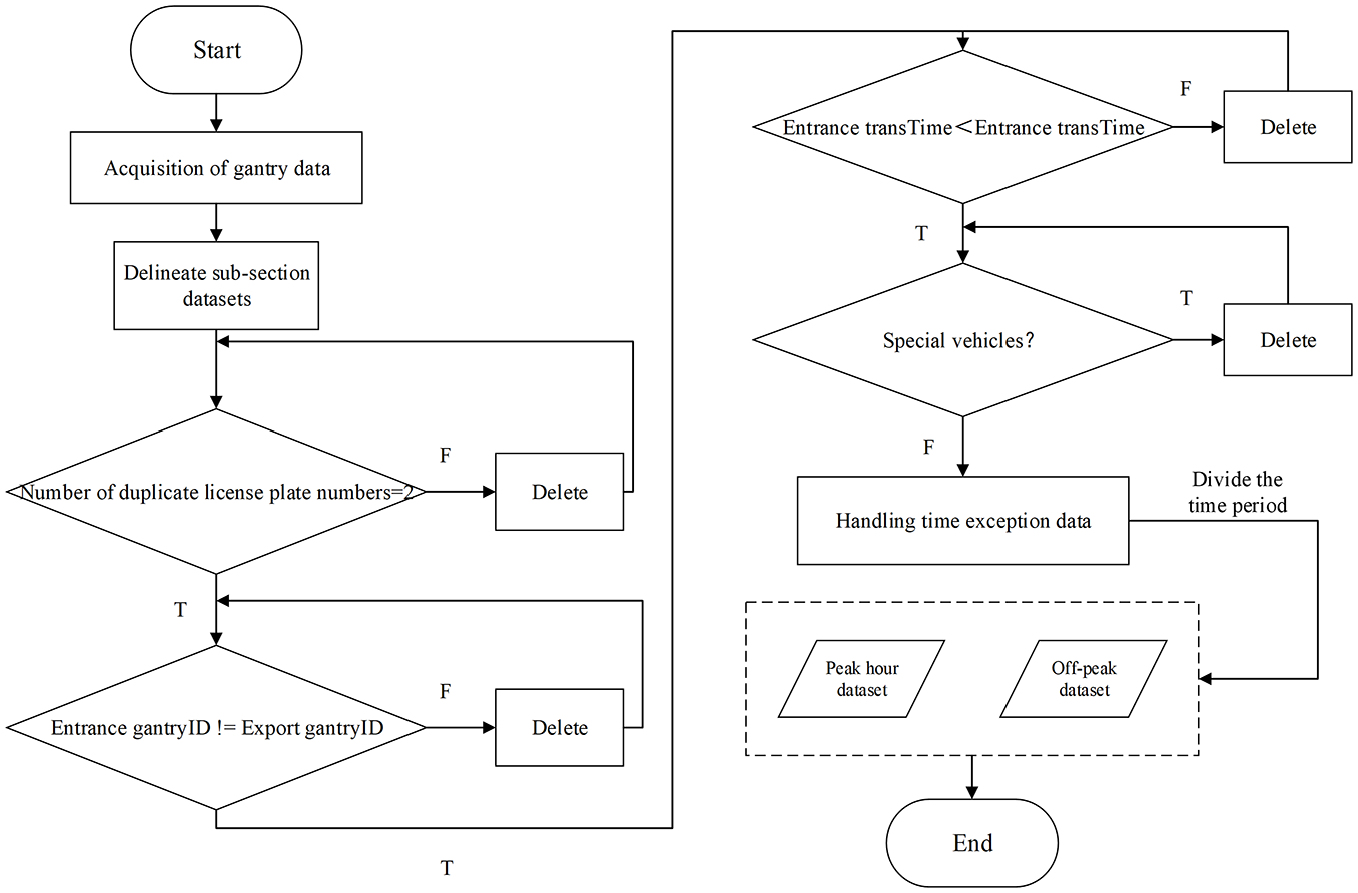
Flow chart of data processing.
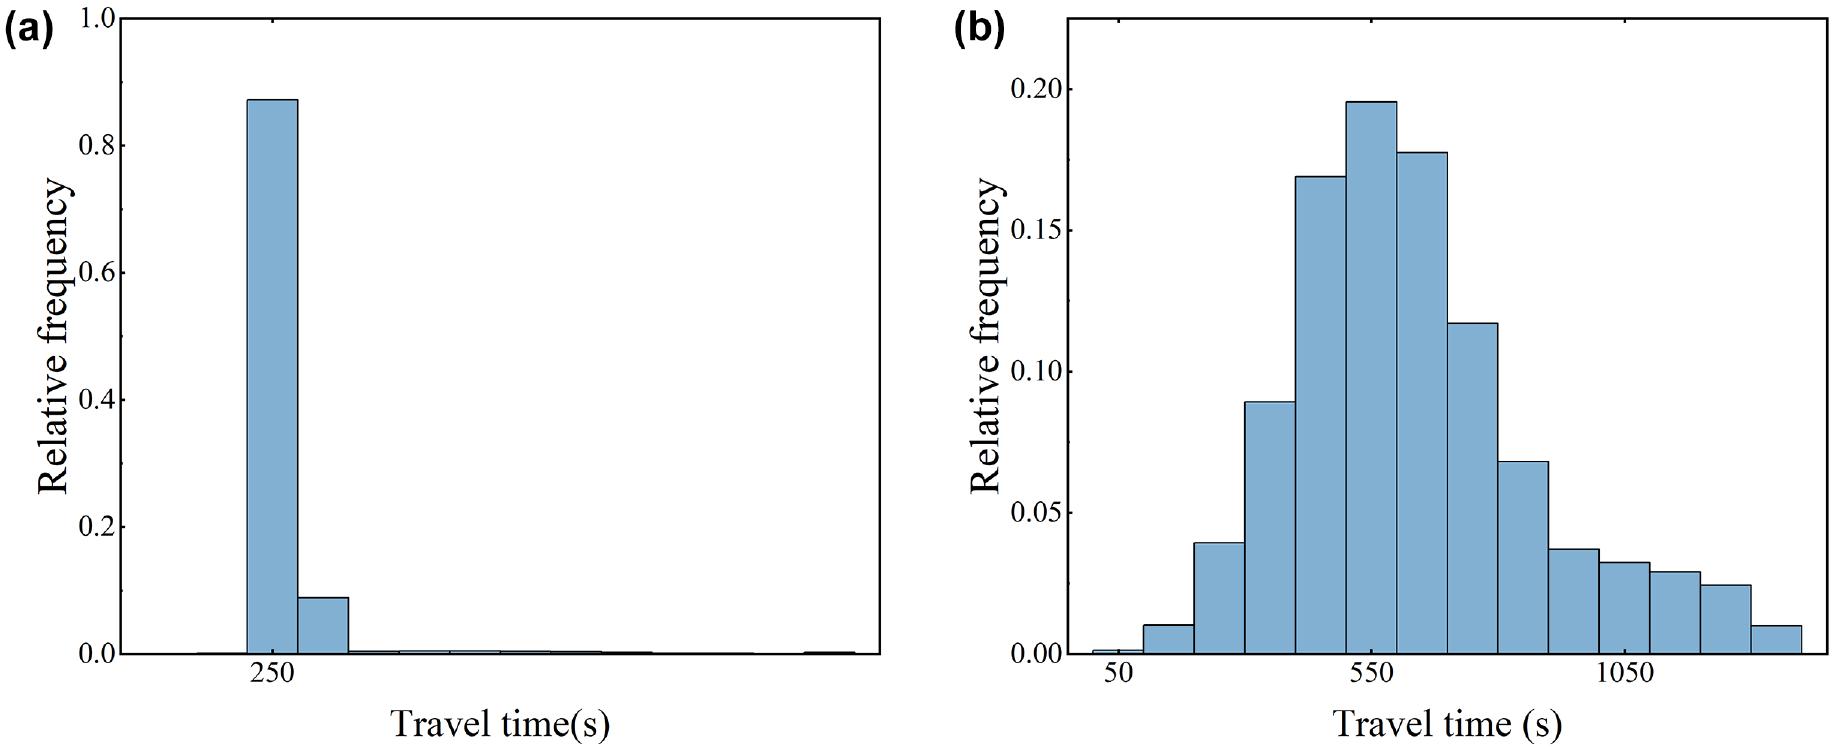
Frequency distribution histogram of travel times (for a particular day): (a) before handling abnormal data and (b) after handling abnormal data.
Results Analysis
Level 1 TTR Analysis
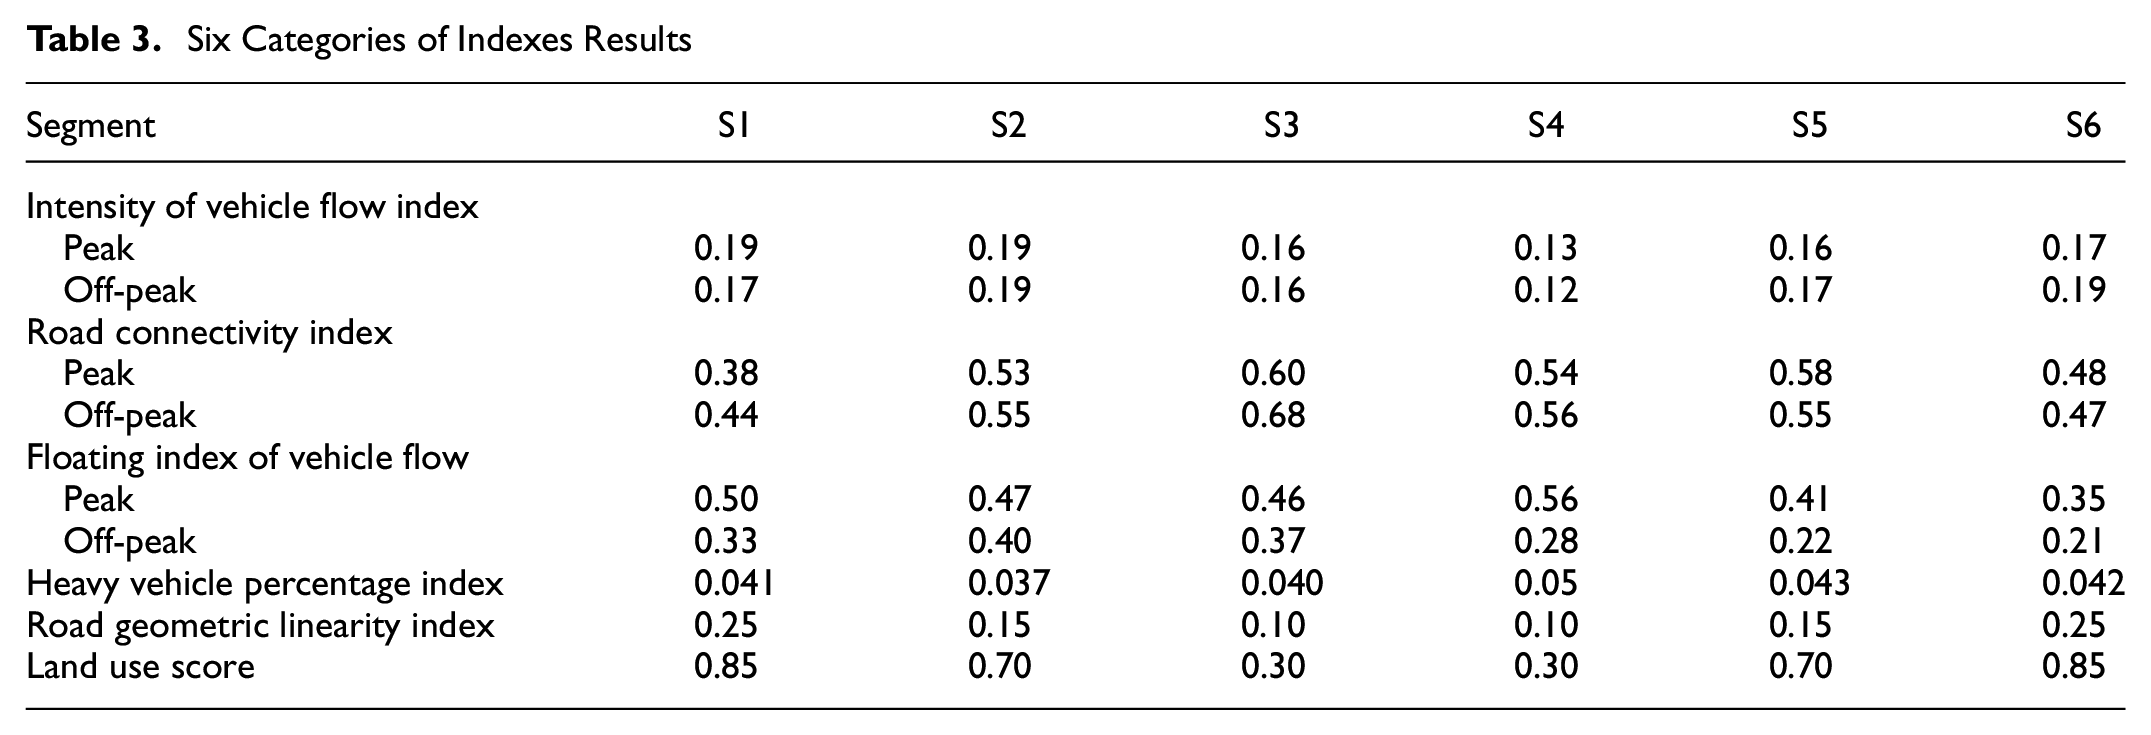
Before initiating the computation of TTR within the highway network, an evaluation of the weighting index for each segment is necessary. As previously indicated, the first five indexes are calculated according to Equations 13 to 17 and the land-use scores could be obtained according to Table 1. The trends in the weighting index for the first four categories are illustrated in Figure 8. The results of the six categories of indexes are shown in Table 3.
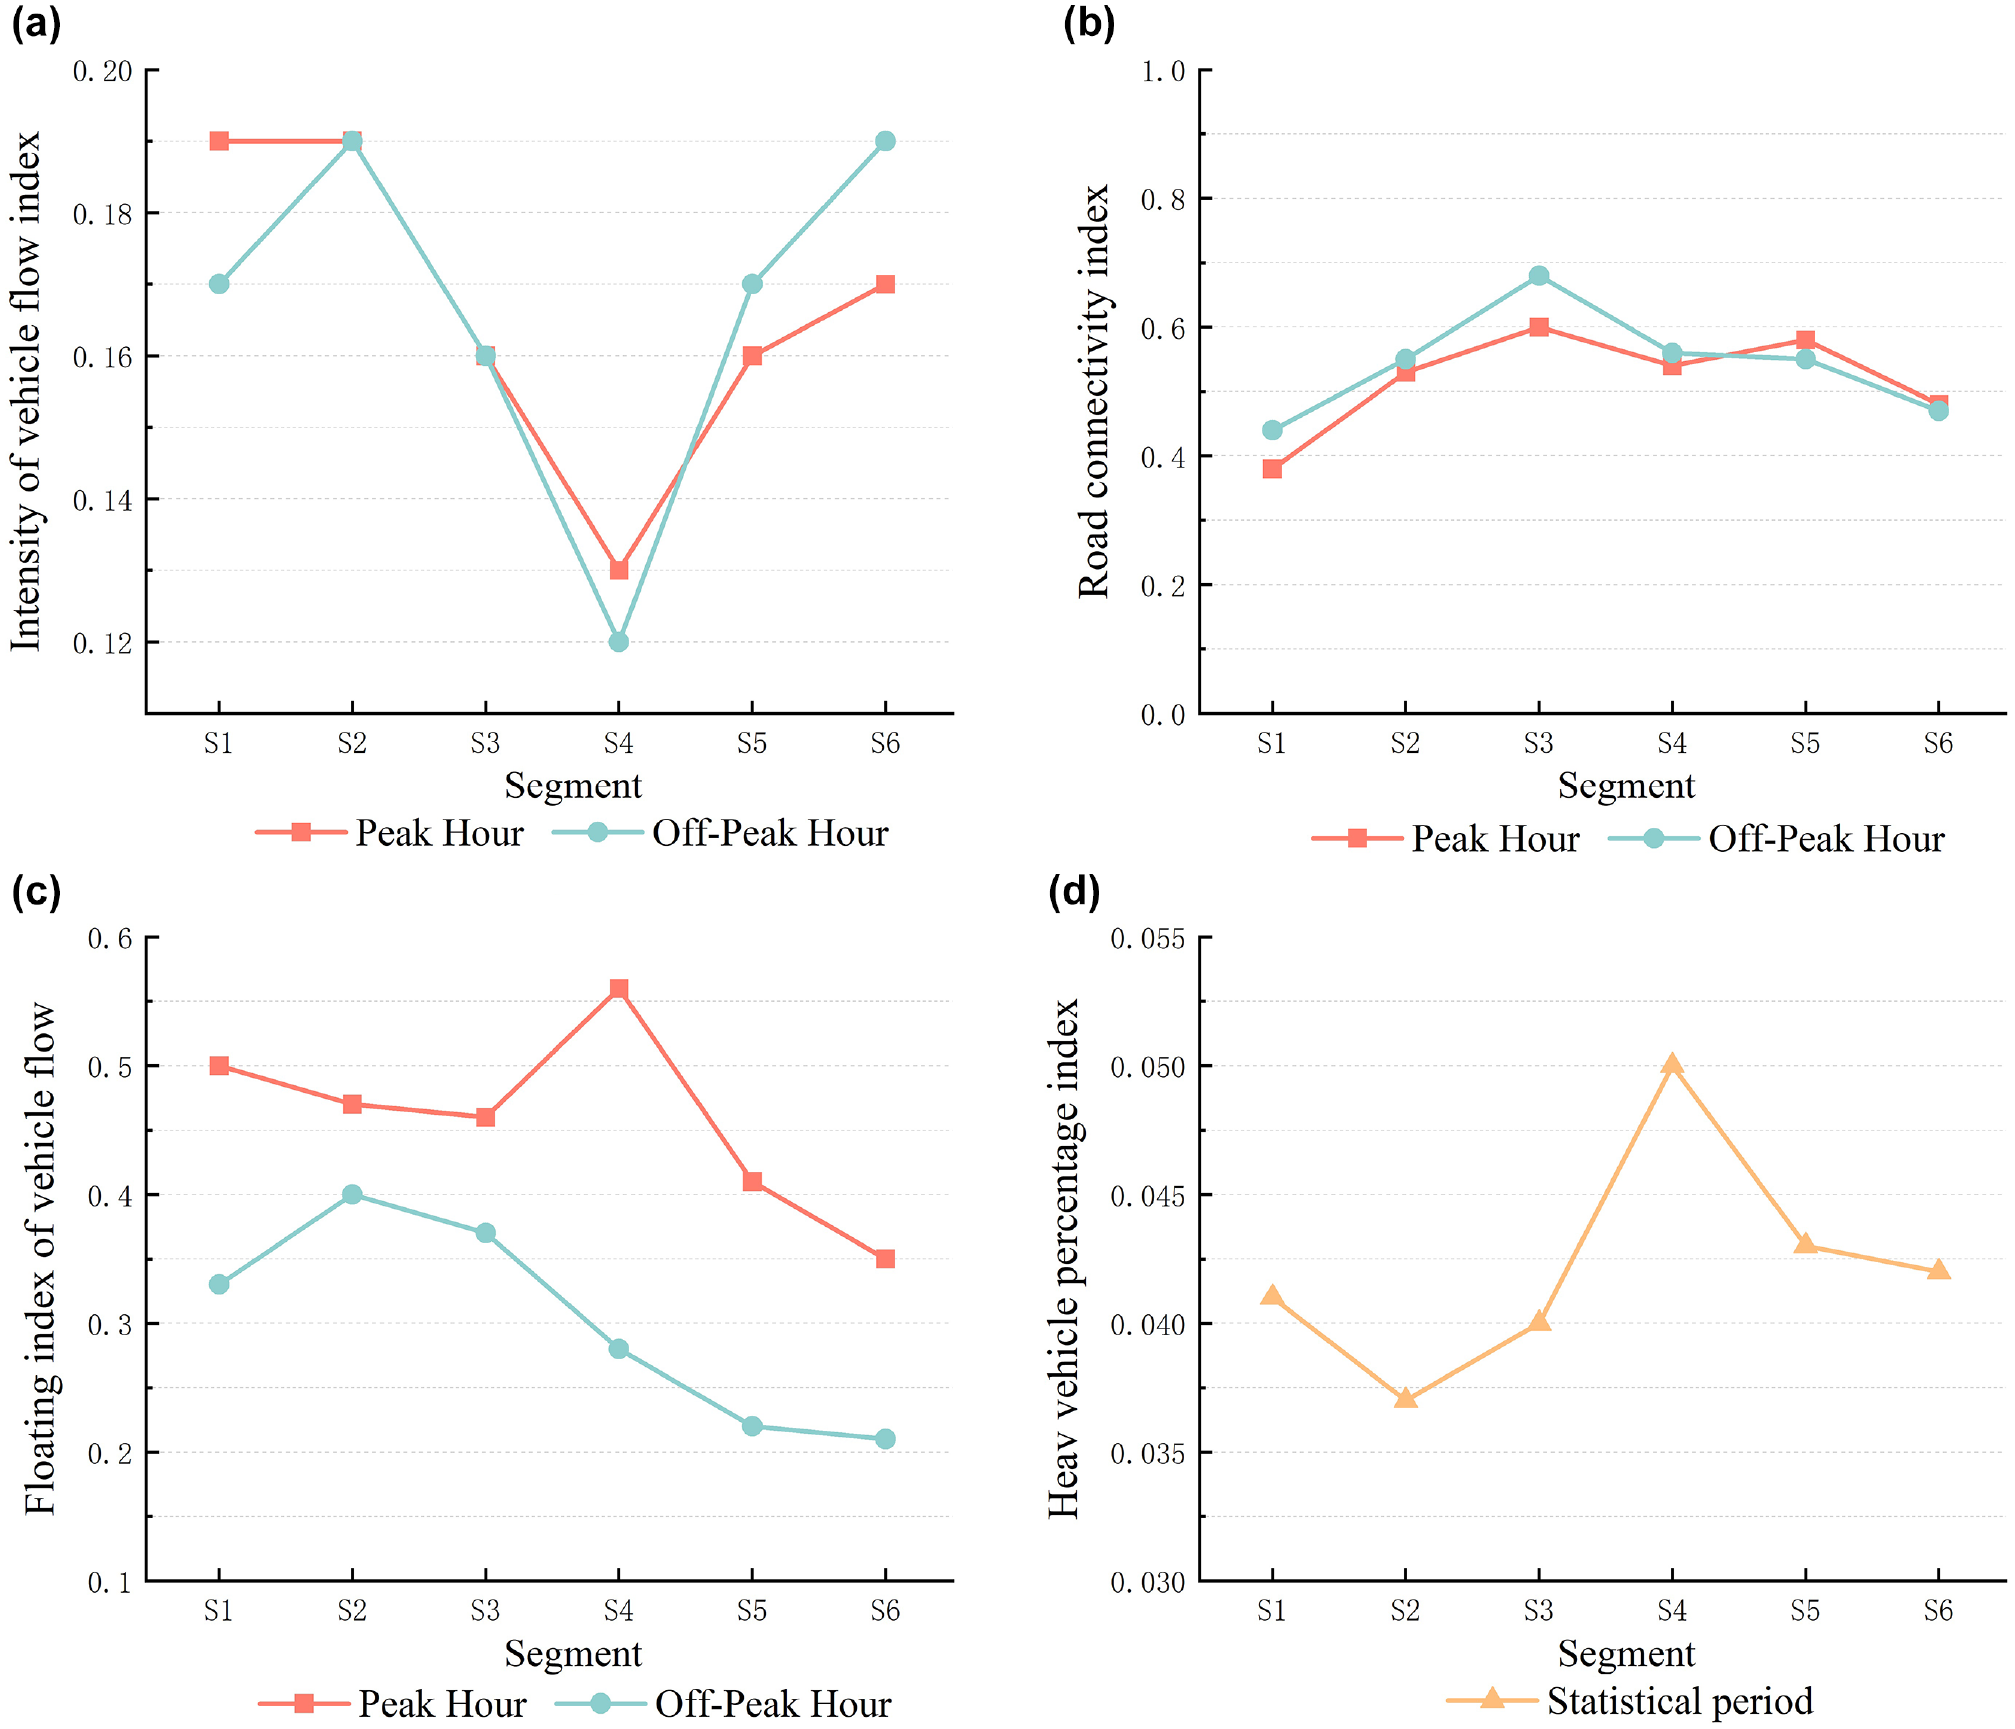
The trends in the weighting index for the first four categories: (a) Trends in Intensity of vehicle flow index, (b) Trends in Road connectivity index, (c) Trends in Floating index of vehicle flow, and (d) Trends in Heav vehicle percentage index.
Six Categories of Indexes Results
From the Figure 8, on various road segments, the performance of each of these index values varies significantly. Second, they exhibit a changing pattern that is essentially the same during peak and off-peak hours. This suggests that the metrics selected for this study are capable of capturing the spatial and temporal characteristics of each road segment subsystem.
The proposed model uses the weighting data from Table 3 to calculate the experimental results of the road network TTR at different
(1) the TTR of the road network is lower than the reliability of any road section at all levels of
(2) for a ring road network such as the Xi’an bypass, the level of TTR along the inner ring (near the urban area side) is usually higher than that of the outer ring;
(3) both the network and segments are more reliable in peak hours than in off-peak hours (no major traffic accidents occurred).
Results of Travel Time Reliability for Each Segment and Whole Network.
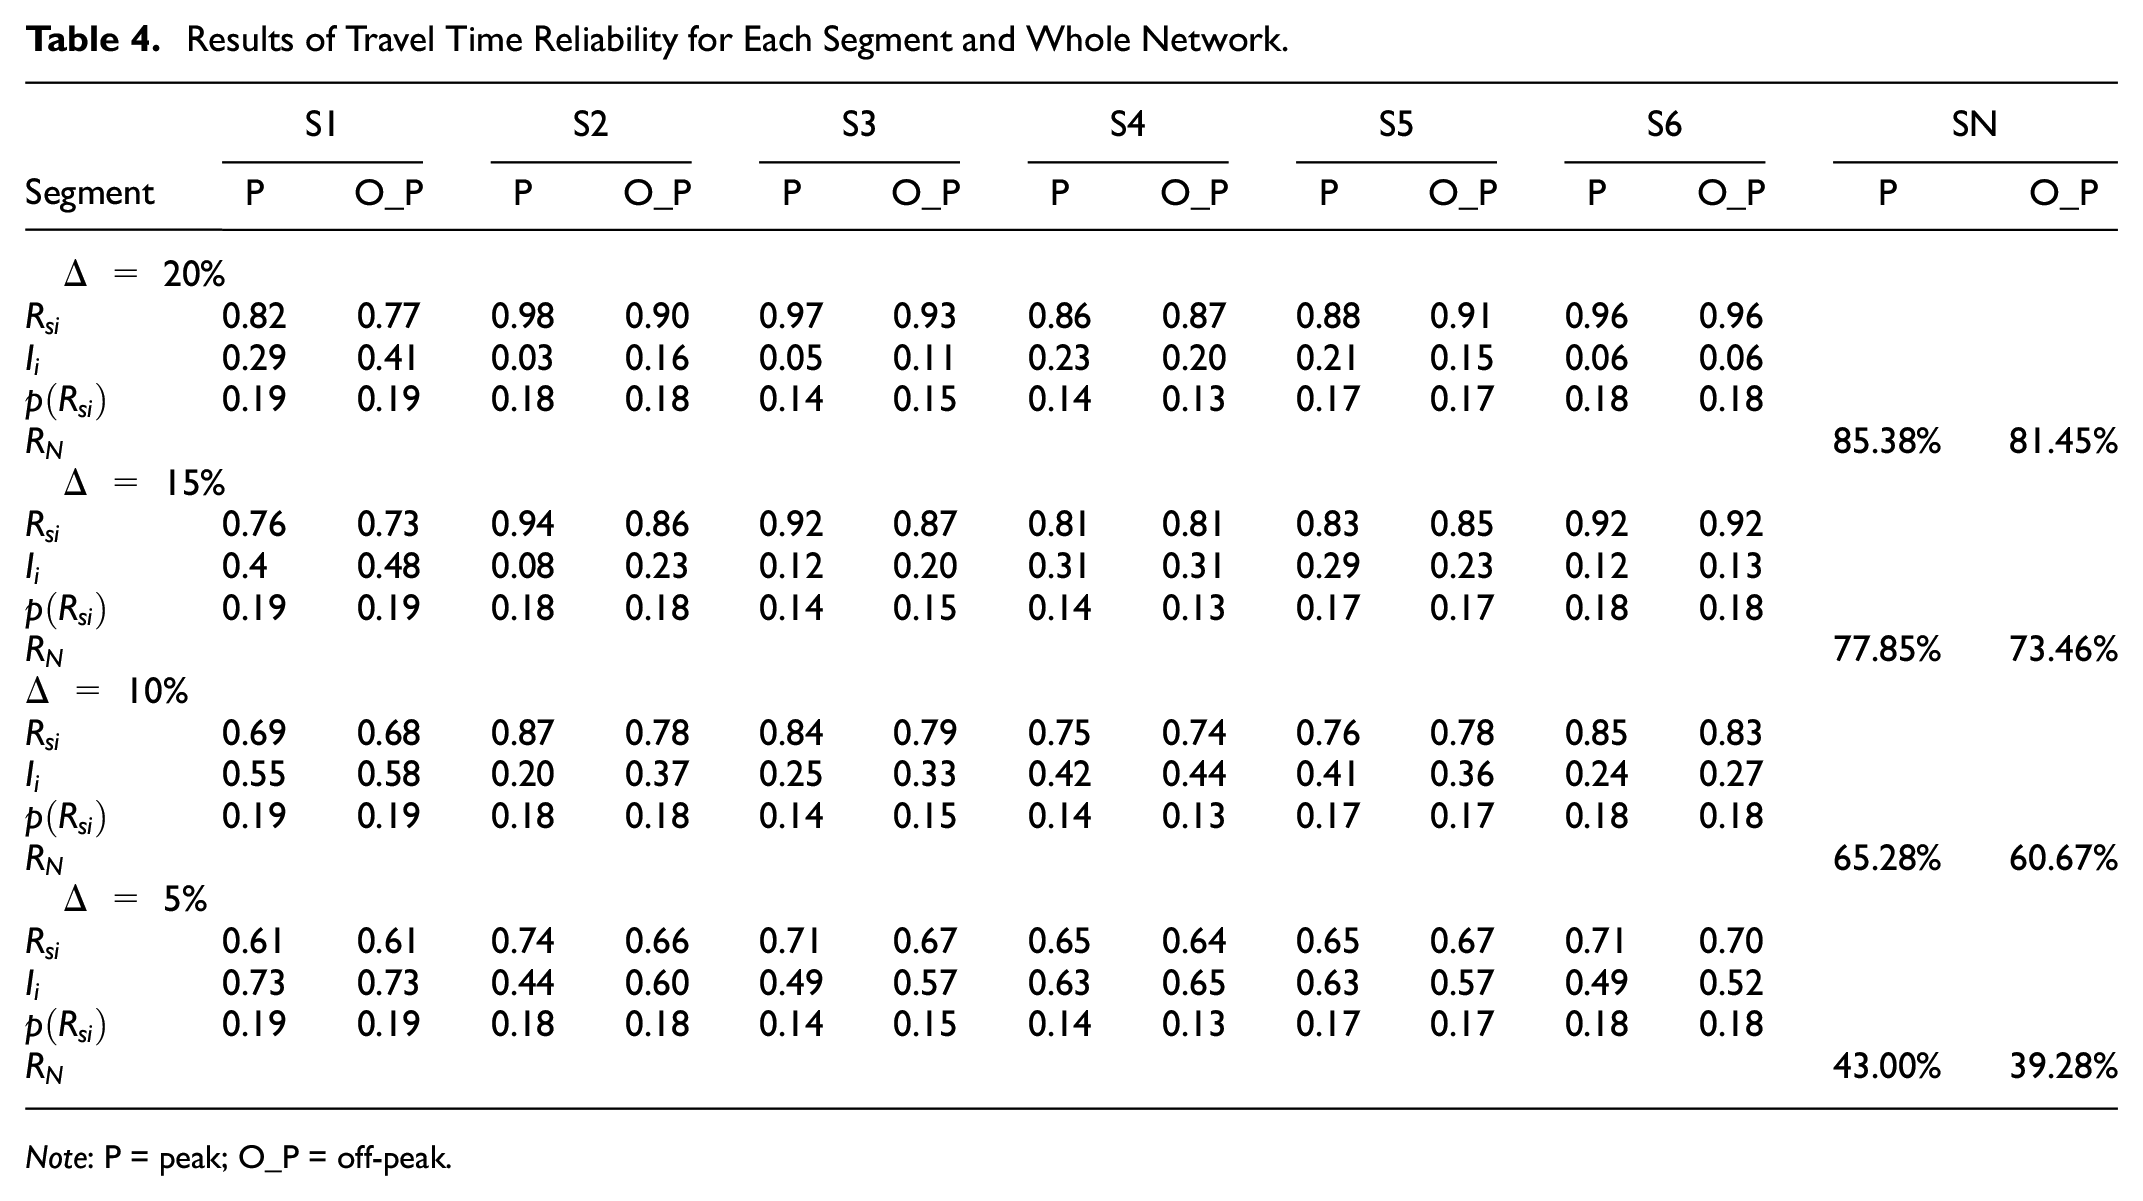
Note: P = peak; O_P = off-peak.
Level 2 Discussion of Results
From the segment perspective, it is found that the reliability levels of the segment are similar at different
As regards the whole highway network, the TTR of the road network is lower than that of any road section. This has similarities with the previous studies that the reliability of a series system is always less than the reliability of the least reliable link ( 30 ). Secondly, this paper finds that reliability levels are higher during peak hours and along the inner ring (S1, S2, S3) than during off-peak hours and the outer ring (S4, S5, S6). To explain this phenomenon, we analyzed the inner and outer ring road flows, as shown in Figure 9, and found that the inner ring road sections have an average of about 10,000 more vehicle trips per week compared with the outer ring road sections. Meanwhile, as a practical thing, commuter (work or school) vehicles leaving the main urban area make up the majority of inner ring traffic, which is comparable to peak hour traffic. while the outer ring traffic is dominated by vehicles entering the city from suburban and provincial freight, with a higher proportion of heavy vehicles and a more complex distribution of vehicle types. Because the data selected for this paper exclude the presence of traffic accidents, it can be argued that with higher volumes or higher lane occupancy, the reliability of travel time is higher on high-volume sections than on low-volume sections if no traffic accidents occur. The reasons for this are outlined below.
Vehicles traveling on high-volume sections are easily restricted by variable speeds and lane changes, thus the speed is generally maintained at a lower level. With no traffic accidents occurring and regardless of how fast or slow the traffic is moving, there would be a smoother overall traffic flow and minor fluctuations in the passage times of adjacent vehicles.
Inner ring traffic and peak hours traffic have more vehicles with commuting as the purpose of travel, and drivers will be more restrained in their driving behavior to avoid being late for work or school.
The entire Xi’an bypass highway has been arranged with the ETC gantry system. When passing through the ETC gantry, drivers need to reduce their speed to complete the toll counting, and this speed change will have a greater impact on traffic flow in off-peak hours road conditions where the average speed is higher.
In conclusion, traffic travel times during peak periods offer better predictability, and management units need to especially note that individual driving behaviors during off-peak periods may have a greater impact on TTR. Furthermore, if one wants to improve the overall TTR of the road network, perhaps real-time dynamic speed limits during the low-peak period is an effective way.
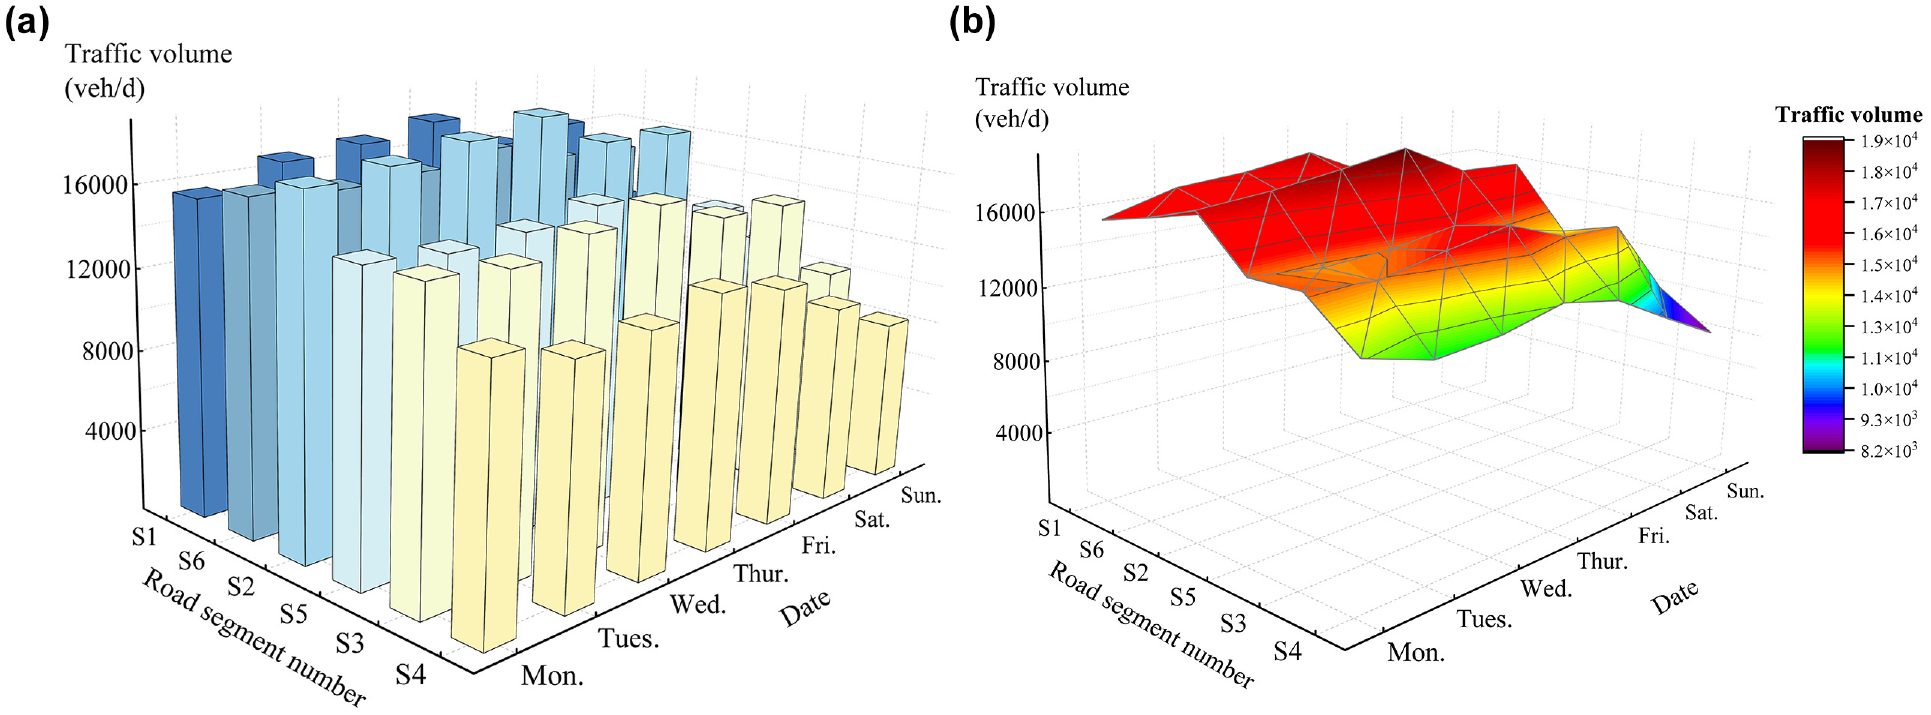
Three-dimensional map of traffic changes in each road section during the week: (a) Three-dimensional histogram of traffic changes and (b) Three-dimensional heat map of traffic changes.
Level 3 Model Verification
Before validating the suitability of the model calculations, we chose and juxtaposed certain classical metrics with the reliability
a)
b)
c)
Both standard deviation (SD) and coefficient of variation (COV) primarily indicate the extent of variability and fluctuations in time from a holistic standpoint, providing valuable benchmarks for operational and managerial units. In contrast, the planning time index (PTI) pertains to the traveler’s perspective, with the prevailing belief that a lower PTI corresponds to a higher level of service or road efficiency.
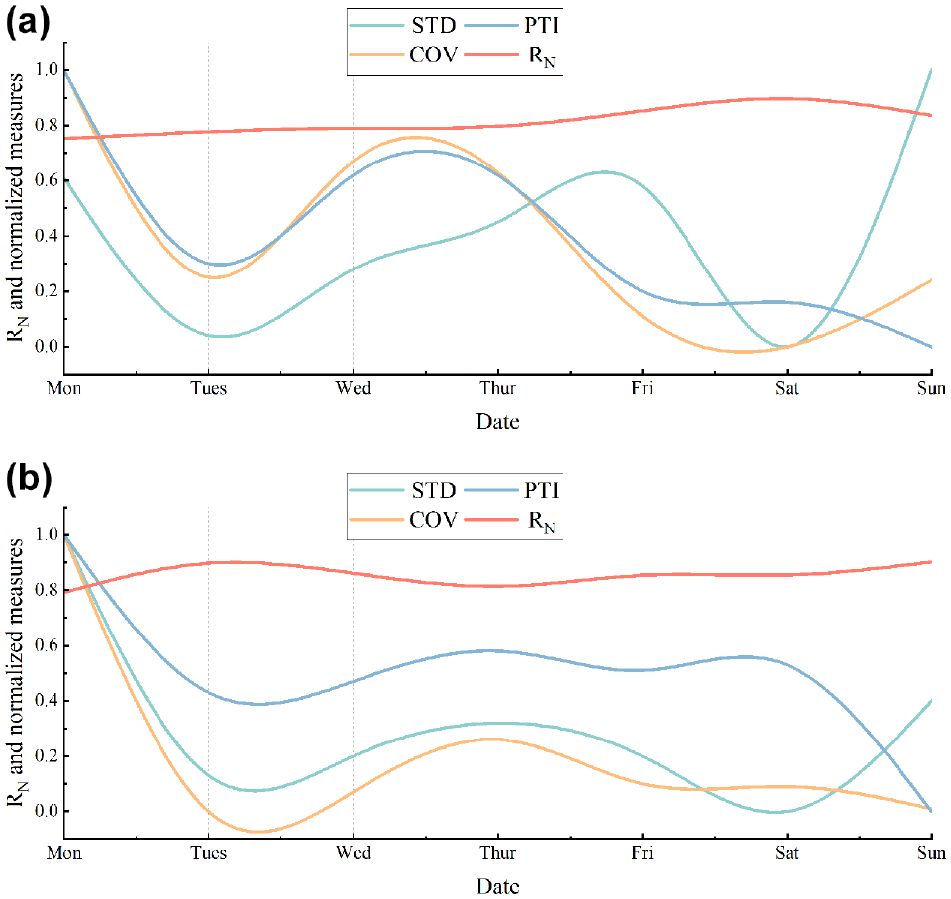
Comparisons of measures for highway network: (a) off-peak hour and (b) peak hour.
The examination of the figure indicates that both ST and COV exhibit comparable trends during peak and off-peak hours. This connection arises from the similar connotations of these two metrics. Specifically, during peak hours, both SD and COV demonstrate lower values, signifying a diminished degree of travel time dispersion. Secondly, the
To verify the reliability results of the model calculation are practical and consistent with the actual situation, this paper attempts to predict the average travel time range for the next cycle using data from different periods guided by the obtained TTR results. Seven separate data periods were tested: one business day to five business days, weekends, and a full week. The upper and lower time limits are calculated as follows.


where
The accuracy of the predicted range is reflected by the ratio of the deviation of the actual value from the nearest boundary to the predicted range (RDR). The RDR value is negative if it is within the predicted range and positive if it deviates from the predicted range; a smaller RDR value indicates that the actual travel time is closer to the center of the predicted range. The test results are shown in Table 5.
Predicted Time Range by Using Actual Time of Sampling Period
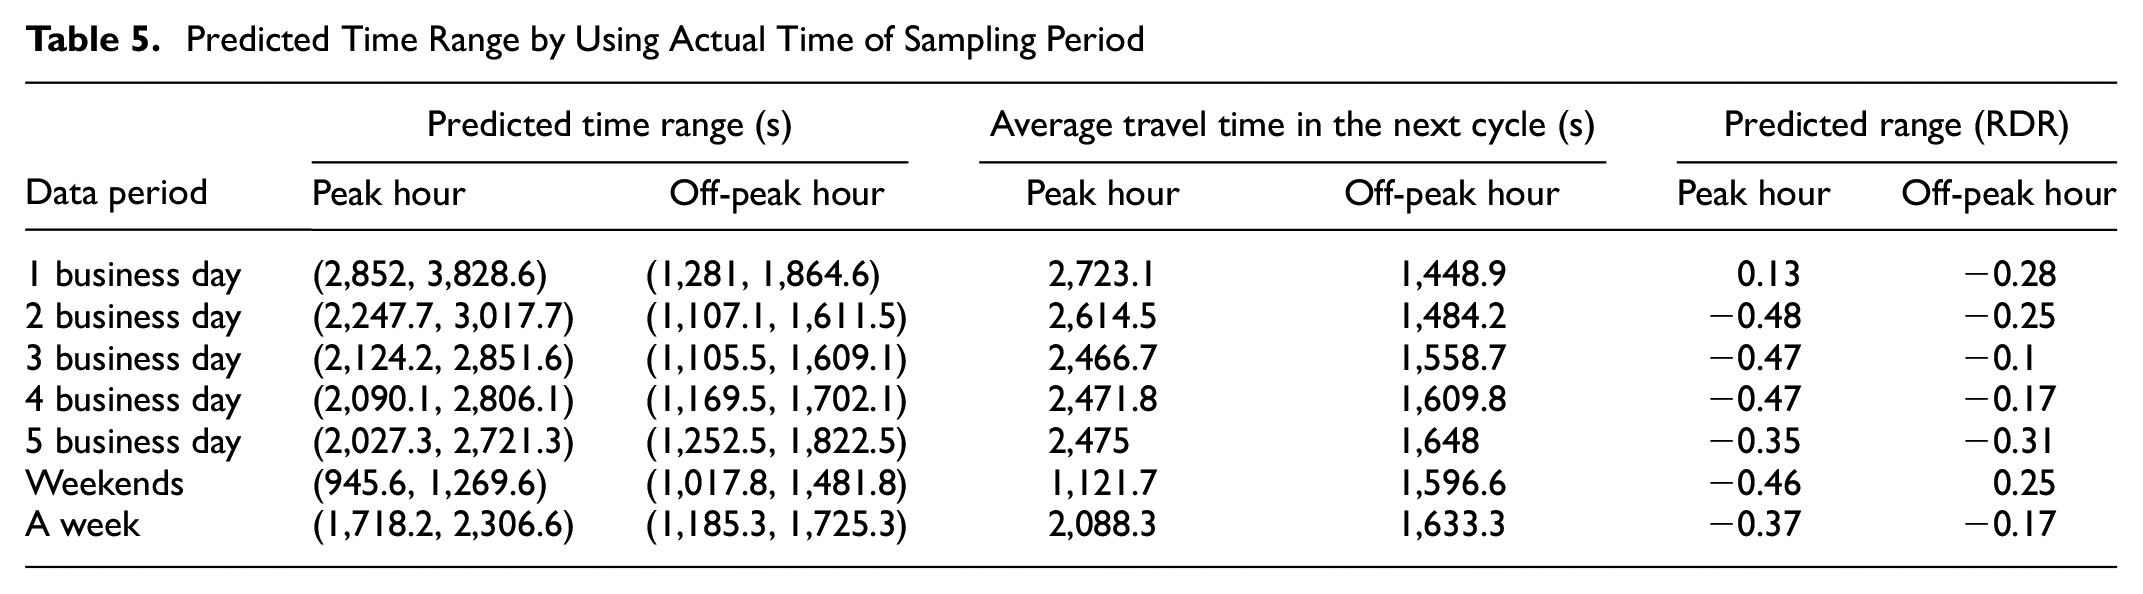
The test results are deemed acceptable, with the average travel time for the next cycle largely within the predicted range. This observation further underscores the practicality of our TTR calculation model and its applicability for temporal prediction. More specifically, solely two out of the 14 prediction tests exhibited actual values that deviated from the projected range. One of them was using peak hour data for only one business day, and the other was using off-peak hour data for two days of the weekend. This phenomenon arises owing to the intricate challenge associated with accurately predicting travel patterns based solely on data from a single weekday, further compounded by the heightened variability of individuals’ travel behaviors during weekends.
Conclusion and Future
This research provides a re-examination of the highway network from a systems theory perspective, considering it as a social subsystem comprising intrinsic subsystems that are influenced by external systems. Subsequently, to facilitate the convenient evaluation of TTR at the road network level, the paper proposes an information entropy model for calculating TTR values. For our case study, we utilized data obtained from recently extensively deployed ETC gantry systems, and we presented a standardized data processing flow for ETC gantries to enhance the analytical potential of the ETC gantry data. The findings of the case experiment demonstrate the model’s applicability in analyzing the TTR of the highway network and its ability to predict the range of travel times for future periods. Additionally, it exemplifies the success of our endeavors to address the issue of road network hierarchy through a systems theory approach using an information entropy model.
Compared with traditional reliability measures, it has been pointed out that entropy-based methods can incorporate probability density functions on top of variance ( 16 ), while summarizing the computational framework based on the information entropy model proposed in this paper. The main improvements are outlined below.
1) The method proposed in this paper eliminates the need to fit the cumulative distribution function of time for individual road segments. This ensures that the entire computational evaluation process remains free from the heterogeneous interference caused by the time distribution function.
2) The uncertainty in time can be measured directly and easily extended to TTR assessment at the road network level. In this paper, the method generates intuitive TTR results for individual road segments and the network, reducing solution complexity while demonstrating good scalability and inclusiveness (Figure 2). This facilitates the application of TTR as a performance evaluation index for road networks by relevant operations management departments.
3) Not just relying on travel time data, but incorporating social attribute impacts. This improvement results in a dual-driven reliability estimate, providing a more realistic depiction of the traffic state within the road network.
In the meantime, the paper also makes some contributions to this field. We approach the highway network from a systems theory perspective and examine the macro-level influences on TTR which serves as a unique benchmark for calculating TTR in large-scale road networks. Additionally, we also present a standardized data processing flow and a concise introduction to the ETC gantry system, which could serve as a valuable data source for intelligent transportation systems research.
It is crucial to emphasize that the methodology presented in this paper was initially crafted to offer management units a convenient and expeditious means of conducting TTR assessments. The applicability of this methodology is limited to highway environments, primarily tailored for network-level TTR assessments. Consequently, conducting detailed reliability analyses on urban or designated roads using this methodology proves challenging.
In future studies, examining the coupling relationship between different transportation networks and incorporating additional socio-economic benefit evaluation indicators can enhance our understanding of the value and reliability of the highway network system. Furthermore, considering the extensive coverage and reliable data provided by the ETC system, we have plans to conduct more microscopic exploration that can enhance the management of the highway network.
Footnotes
Acknowledgements
We are grateful for the original toll data provided by Shaanxi traffic management bureau, P. R. China.
Author Contributions
The authors confirm contribution to the paper as follows: study conception and design: Linwei Li. Yinli Jin; data collection: Lairan Wang. Libing Liu; analysis and interpretation of results: Linwei Li, Yinli Jin, Peng Gao; draft manuscript preparation: Linwei Li. All authors reviewed the results and approved the final version of the manuscript.
Declaration of Conflicting Interests
The authors declared no potential conflicts of interest with respect to the research, authorship, and/or publication of this article.
Funding
The authors disclosed receipt of the following financial support for the research, authorship, and/or publication of this article: This work was financially supported by the National Key Research and Development Program of China under Grant (2019YFB1600703).
