
Abstract
On-demand transit (ODT) systems are increasing in number and size. To evaluate and quantify outcomes, the research team utilizes the mobility energy productivity (MEP) metric, which is a holistic accessibility measure, to analyze and compare the mobility of various transportation modes in Arlington, Texas. The MEP tool is applied to the ODT system in Arlington, Texas, as well as to five existing transportation modes (driving, transportation network company, transit, biking, and walking). Six ODT scenarios are also analyzed and compared. The analysis is focused on the opportunities that an ODT system presents for transportation disadvantaged communities (DACs) with low rates of car ownership. Although driving received the highest MEP score—a finding typical for a U.S.A. city— the results for the ODT system reveal that it serves those in DACs effectively, helping to achieve an equity design goal. ODT improved the average MEP score across the service area by 83% when considering only accessible, nonprivate vehicle modes (biking, transit, and ODT). For the ODT scenarios, decreasing the wait time by 50% compared with the baseline scenario led to a nearly 160% increase in the MEP score, whereas increasing the ODT travel speed by 21% led to an 80% improvement in the MEP score. As analyzed through the MEP tool, this paper demonstrates how ODT can enhance mobility, particularly for DACs. The results of an MEP analysis can be used by researchers and transit agencies to compare transportation modes and improve the effectiveness of transportation systems across a service area.
Keywords
On-demand modes of transportation have grown in popularity since the emergence of Uber and Lyft in 2010 and 2012, respectively. As of 2019, 36% of U.S. adults used transportation network companies (TNCs), which is significant considering only 15% of the U.S. population used these services in 2015 ( 1 ). This growth has been primarily because of their ability to provide a convenient, flexible, and efficient service across large metropolitan areas (high coverage). To provide this service, TNCs leverage multiple technological innovations, including digital data collection to inform real-time analytics and decision-making (e.g., routing, matching vehicles to riders, repositioning). In recent years, the same technologies and methods have been adopted in the public domain as well, with many city governments and transit agencies deploying on-demand transit (ODT) services to improve service flexibility and coverage. Although customer satisfaction rates have been high ( 2 – 5 ), system-level evaluations of ODT’s ability to connect travelers with important destinations considering user costs (both travel time and monetary) and energy efficiency are limited. In this study, six scenarios were selected to quantify trade-offs between ODT design strategies and optimal operations, and evaluate the benefits and risks of ODT for disadvantaged communities (DACs). Ultimately, this research provides a framework for a holistic, objective evaluation of ODT—spatially and across population groups—that can be applied to other emerging modes and service models to inform planning and design.
The evaluation framework used for this analysis was based on the mobility energy productivity (MEP) metric developed through the U.S. Department of Energy’s (DOE) Energy Efficient Mobility Systems program ( 6 ). The overall goal of MEP is to design a uniform way of quantifying a mode or service’s ability to connect users with important goods, services, and employment, weighted by travel time, cost, and energy efficiency. Previous studies have analyzed level of service ( 3 , 7 ), operational/user costs ( 7 , 8 ), and energy efficiency/emissions ( 9 – 11 ). However, a gap remains in relation to system-level evaluation, which considers the various metrics together and their respective interactions. Additionally, MEP enables a robust scenario evaluation that can provide valuable insights into service design and operations based on local objectives.
This research leverages the MEP framework to evaluate one of the largest ODT systems currently operating in the U.S.A. The ODT system in Arlington, Texas has approximately 75 minivans and a service area of 100 sq mi. This sprawling, lower-density region, which is also rapidly growing, has voted down four consecutive ballot measures to fund a traditional fixed-route transit system. Instead, the region has embraced ODT during its first five years of service (operations began in 2017), evidenced by the numerous service area expansions that now include the whole of Arlington. Additionally, this car-centric, suburban region resembles many U.S. cities designed and developed in the 20th century to support private vehicle use, which at the same time makes traditional fixed-route transit costly and ineffective. Therefore, this analysis addresses two important challenges: evaluating accessibility in a suburban domain with insufficient public transit services and few choices beyond private vehicles; and evaluating an emerging mobility service (ODT) within that domain. A similar framework can be used to assess alternative modes and services in other cities globally or glean insights into the operation of ODT in lower-density cities based on the early findings from Arlington.
In recent years, ODT deployments have accelerated across the U.S.A. The research team defines ODT as a transportation service managed or co-managed by a public entity (e.g., transit authority, city department) in conjunction with a contract operator) in specific areas and at certain times of the day that services a demand using real-time requests. These systems are typically app-based but can also be requested by phone or by street hailing. In contrast to traditional fixed-route systems, which often use large diesel buses and have a fixed schedule as well as fixed stop locations, ODT systems typically use smaller vehicles such as minivans and have flexible stop locations. In a certain sense, ODT is similar to the current model for paratransit. However, paratransit traditionally serves specific populations, whereas ODT aims to serve the full population of its service area. Paratransit also typically requires 24–48 h advance planning, whereas ODT can be requested at any moment during the daily service window. As shown in Figure 1, ODT is most popular in the U.S.A. in rural or suburban environments, where given the lower population density, it can better supply services to meet demand compared with high-demand, higher-density areas, where fixed-route transit may be a better fit. However, ODT can also be used in urban areas for serving first mile/last mile links, connecting riders with public transit hubs such as railroad stations, providing transportation to a customer’s destination, and/or servicing customers at certain times of day at which the mass is not critical. Such services typically have payment options electronically embedded in the app for seamless ticketing, or in some instances are provided free of charge.

The number of ODT system deployments: (a) over time between 2015 and 2022, and (b) classified by system type.
Previous ODT research has focused primarily on level of service and accessibility ( 13 – 16 ), but several studies have evaluated ODT holistically, including an assessment of accessibility, travel time, cost, and energy consumed. Many studies also focus on rural or suburban areas rather than more densely populated communities ( 17 , 18 ). This study proposes using the MEP metric developed by Hou et al. ( 6 ) to evaluate ODT systems holistically. MEP is a holistic metric that quantifies mobility in a defined region for various travel modes, considering travel time, energy consumption, and cost. MEP is an appropriate tool for evaluating ODT systems, because it enables comparison with other travel modes (such as driving, TNC, or biking) and considers those aspects of traveling that are important to the traveler (including wait time, user cost, and availability in certain areas). This study applies the MEP metric to ODT through a case study of an ODT system in Arlington, Texas—one of the largest cities in the U.S.A. to have such a system in place.
Case Study: Arlington, Texas
Arlington, Texas, is situated between Fort Worth and Dallas. It spans approximately 100 sq mi, has a population of 394,602, and a population density of 4,113 per square mile as of 2020 ( 19 ). The racial composition of Arlington (as of 2020) is white (35%), Hispanic/Latino (of any race) (31%), Black (23%), Asian (8%), American Indian, Native Hawaiian, or Other Pacific Islander (0.4%), and mixed (9%) ( 20 ). The median household income from 2017 to 2021 was $65,481 ( 19 ). Arlington has an overall poverty rate of 14% and an unemployment rate of 5.4%, both of which are significantly above the national averages of 11.6% and 3.6%, respectively ( 21 – 23 )
The DOE uses a climate and economic justice screening tool as a method for identifying 27,251 census tracts as disadvantaged nationally ( 24 ). If a census tract meets the threshold for one of the following eight categories for burden—energy, climate change, health, housing, legacy pollution, transportation, water and wastewater, and workforce development—and an associated socioeconomic burden, it will be marked as disadvantaged. For this study, only those DACs meeting the transportation category threshold were used. These are defined by the U.S. Department of Transportation (DOT) as areas that are at or above the 90th percentile for diesel particulate matter exposure, transit barriers, or traffic proximity and volume, as well as being at or above the 65th percentile for low income ( 24 ). The transportation DACs in Arlington are highlighted in Figure 2.

Arlington transportation disadvantaged communities.
Arlington’s main districts are displayed in Figure 3, and these would be considered the main attraction points for riders. The Viridian (Zone 6) is an award-winning community created according to a master plan. It offers homes and an elementary school, as well as other amenities. The international corridor (Zone 7) consists of Arlington Airport and several other companies. Downtown (Zone 1) has several points of interest such as Theatre Arlington and the Arlington Museum of Art. Finally, the entertainment district (Zone 5) has Six Flags Over Texas (theme park), the AT&T Stadium, and several other points of interest.

Main districts in Arlington.
Arlington has no traditional public transit but does have the following: a trolley in the entertainment district; Handitran, which is designed for the elderly and persons with disabilities; Metro Arlington Xpress, which was shut down in 2017; Mission Arlington transportation services; Ride2Work; the Trinity Railway Express (TRE); the University of Texas at Arlington shuttle; and taxi services. Furthermore, in an attempt to offer students more transit modes, the university launched a bike share program consisting of 250 electric bikes to promote efficiency and micromobility. The service costs $1.25 to unlock plus $ 0.40/minute, with a 50% discount on every ride for those on a low income (apply via the app) ( 26 ). There are also limited transit lines from outside of Arlington that run through the city boundary.
The most common mode used for commuting to work in Arlington is driving alone (81% in 2020). Further, in 2020, 10% carpooled and 6% worked at home ( 27 ). The remaining 3% commuted by walking, public transit, taxi, motorcycle, bicycle, or other modes such as scooter ( 27 ). Arlington has a comparable average commute time compared with the average U.S. worker (27.2 min and 26.9 min, respectively) ( 27 ). In September 2016, Arlington’s mayor and city council formed the Transportation Advisory Committee (TAC) to establish a vision for transportation in Arlington. The results were recommendations that served as guidance for the city council. The TAC looked at different target populations for which to design transport services, key destinations, and six priority corridors. With input from the community, the TAC also identified the best modes for connecting riders with destination points within the six corridors. These were shortlisted to four modes of transportation, the first being the ODT service ( 28 ).
Arlington ODT Service
Stemming from the recommendations of the TAC, Arlington’s rideshare service launched in December 2017, servicing the city and the CentrePort TRE station with affordable prices. The system began by covering 8 sq mi and has since expanded to include nearly 100 sq mi (the entire city area). The on-demand rideshare service is a public–private partnership operated by Via. The service is cheaper for users than traditional TNC ride-hailing services and offers flexible on-demand stops (no fixed routes). Customers request a ride using a smartphone app or by phone. They are then assigned a “virtual bus stop” at which to meet the vehicle, which is typically within a block or two of the rider’s location. Rides are shared, and Via’s dispatching software determines how to aggregate requested rides. The service—referred to as “Arlington On-Demand”—operates Monday–Friday 6:00 a.m. to 9:00 p.m. and Saturday 9:00 a.m. to 9:00 p.m. Wait time averages 12–15 min. The fare is between $3 and $5 per person per ride and is based on the distance traveled, as outlined in Table 1, except for trips between CentrePort and any other point in Arlington, which are a flat $3.00 per trip. There is no surge pricing, and weekly and monthly passes are also offered ( 29 ). Riders can pay using a credit, debit, or prepaid card, although there is a cash option for those who need it ( 30 ).
Arlington On-Demand System Prices Based on Trip Distance

Arlington’s ODT system fleet consists of approximately 75 six-passenger vans, 10 of which are wheelchair accessible. The majority (about 50) of these vans are traditional hybrid vehicles. The rest are gasoline powered. The service provides 15,000 rides per week with 4,100 weekly active riders. Since launching, the service has provided over 1.8 million rides. According to a Via intercept survey performed through the smartphone app, 66% of the survey respondents are nonwhite, 66% have a household income below $25,000, and 77% do not have a car. Figure 4 shows the smartphone app interface when ordering a ride.

Screenshots from Arlington’s ODT system smartphone app when requesting a ride.
Methods and Data
Overview of the MEP Metric
The goal of the DOE’s Energy Efficient Mobility Systems program is to increase mobility and improve energy efficiency at the same time. There are different mobility metrics for quantifying individual factors such as energy efficiency or travel time (e.g., biking score or average travel time index), but not the overall quality of mobility. Researchers at the National Renewable Energy Laboratory observed that the quality of mobility was fundamentally associated with the number of goods, services, and employment opportunities a person could access within a reasonable time budget, as well as reasonable cost and energy. This resulted in Hou et al. ( 6 ) developing the MEP metric, which quantifies the efficiency of accessing opportunities (jobs, goods, and services) against the resources needed for such mobility—travel time, energy, and cost ( 6 ). Equations 1 and 2 outline how MEP is calculated and the values of weighting parameters, as developed by Hou et al. ( 6 )


where
The metric is isochrone based, and measures the cumulative intervening opportunities within various travel time thresholds (10, 20, 30, and 40 min). MEP is computed at the square kilometer pixel resolution, and the scores are aggregated to known geospatial boundaries (such as city, metropolitan area, etc.), using population proportion (at the square kilometer resolution) as the weighting factor. MEP scores are computed on a trip-by-trip basis for every combination of origin and destination using each available mode, that is, one mode and one activity at a time, and are aggregated across modes and activities to provide a holistic assessment of the quality of mobility that could be provided at a location. The metric can compare different planning approaches and measure the effect of implementing different mobility technologies. When investment decisions are being made, MEP can provide information about the trade-offs between different modes of transportation, thereby helping policymakers, urban planners, and transit agencies make the best decisions for a certain region based on desired outcomes. The data required include the following: (a) network and travel time information for each mode; (b) land use and employment trends; (c) energy consumption and economic cost for each mode; (d) frequency of engagement for each activity; and (e) population information ( 6 ). A higher MEP value means that the location provides access to a variety of many more opportunities through many more modes in a time-, energy-, and cost-efficient manner.
MEP has been used in previous studies. For example, the metric was used as an evaluation tool for research aimed at integrating predictive optimal energy management strategies and intelligent traffic systems. The study resulted in a cumulative improvement of MEP when optimizing an energy management system and a traffic management system ( 31 ). The DOE SMART Mobility Consortium used MEP to quantify the impact of shared, electric, and automated options on urban mobility ( 32 ), and the American Consortium for an Energy-Efficient Economy leveraged the MEP metric to suggest policies that enable sustainable travel alternatives to driving ( 33 ). Finally, Hanrahan et al. ( 34 ) recently used the MEP metric to evaluate the impact of electric bikes on enhancing the mobility of low-income essential workers in Denver, Colorado.
Data Preparation and Scenario Definition
This study evaluated the quality of mobility in Arlington, Texas, by utilizing the MEP metric. The primary intent was to quantify the quality of mobility offered by the ODT system compared with existing modes as well as the impact of various policy and operational performance levers on the ODT system. The mobility provided by existing modes in the city was also calculated using MEP.
The MEP computation is powered through several data sets. First, the Arlington city boundary was obtained from the city’s website ( 35 ), and then divided into 1-km by 1-km pixels. This resulted in 306 pixels being used in the ensuing calculation. Second, the travel networks and driving speeds within the study area were obtained from a third-party source. Third, population and employment data were obtained from the U.S. Census Bureau ( 36 , 37 ), and land use data were obtained from a third-party data provider. The MEP computation requires the calculation of the number of opportunities accessible to the population in each region. For this, the opportunities were grouped into six categories following the 2017 National Household Travel Survey classification ( 38 ): (a) education, daycare, and religious activities; (b) health care; (c) retail (e.g., shopping, errands); (d) meals (e.g., groceries, restaurants); (e) recreation (e.g., entertainment, sports), and (f) jobs (or employment). Isochrones (areas that can be reached from a known starting point within a given amount of travel time) were first computed for each mode from the centroid point of a square kilometer pixel for travel time thresholds of 10, 20, 30, and 40 min. These isochrones were intersected with a land use layer to quantify the number of opportunities (pertaining to each of the six categories noted above) that can be reached with a given travel time threshold using a given mode. The isochrones could extend beyond the study area boundary, thus the analysis accounted for the opportunities that could be reached outside the study area. The opportunities measure was weighted using the time, cost, and energy efficiency parameters pertaining to each mode to provide a numeric score that depicts the time-, cost-, and energy-efficient access that can be realized through that mode in that location.
The MEP scores of five existing modes—driving, TNC, transit, biking, and walking—were also calculated to provide context with regard to the effectiveness of the ODT system. Although traditional transit services are not available in Arlington, some out-of-city transit lines run through the city boundary, which was accounted for in the transit MEP computation. Information on the transit lines’ routes, schedules, speeds, stops, dwell times, and so forth, was obtained from the General Transit Feed Specification ( 39 ). The energy parameters of driving, transit, TNC, and ODT were taken as 0.9, 0.65, 1.35, and 0.71 kWh per passenger mile, respectively, whereas for biking and walking the energy parameter was taken as 0 ( 40 ). The energy parameters were derived from previous MEP studies using driving and transit; a modification factor for TNC and ODT, which considered deadheading rates and vehicle occupancy, was used ( 40 ). Similarly, the cost parameters per passenger mile were $ 0.625 for driving, $ 0.25 for transit, $1.54 for TNC, and $ 0.96 for ODT, whereas the cost was assumed to be $ 0 for biking and walking. These figures consider the costs to the users, not the operating agency, and were calculated using the U.S. Internal Revenue Service mileage rate ( 41 ) and the average price for transit ( 42 ) and TNC ( 43 ) stated in previous studies. The average cost of $ 0.96 per passenger mile for ODT reflects the fare structure outlined in Table 1 and average distance traveled for ODT trips. However, the Arlington ODT system fare structure has a maximum cost of $5.00, regardless of trip distance, which is not reflected in the cost model for the MEP calculation. The MEP calculation included 4 min of parking time for driving and 7 min of wait time for TNC.
To explore the cost- and energy-efficient ways of improving the mobility provided by the ODT system, six different ODT scenarios (including one baseline scenario) were defined by varying energy, cost, passenger occupancy, travel speed, and wait times. The baseline scenario is intended to reflect the system as it is currently operating, with an assumed travel speed of 70% of driving (because of longer travel distances and stopping time associated with picking up and dropping off other riders), a wait time of 15 min (reported by the City of Arlington), average vehicle occupancy of 2.5 people (also reported by the City of Arlington), and an average cost of $ 0.96 per passenger mile. To evaluate various improvements to the ODT system, in addition to the baseline scenario, five other scenarios were created. Each scenario improves one of the following parameters—energy consumption, cost, average vehicle occupancy, travel speed, or wait time—as outlined below and in Table 2:
The
The
The
The
The
ODT Scenarios and Inputs Compared with Baseline Scenario
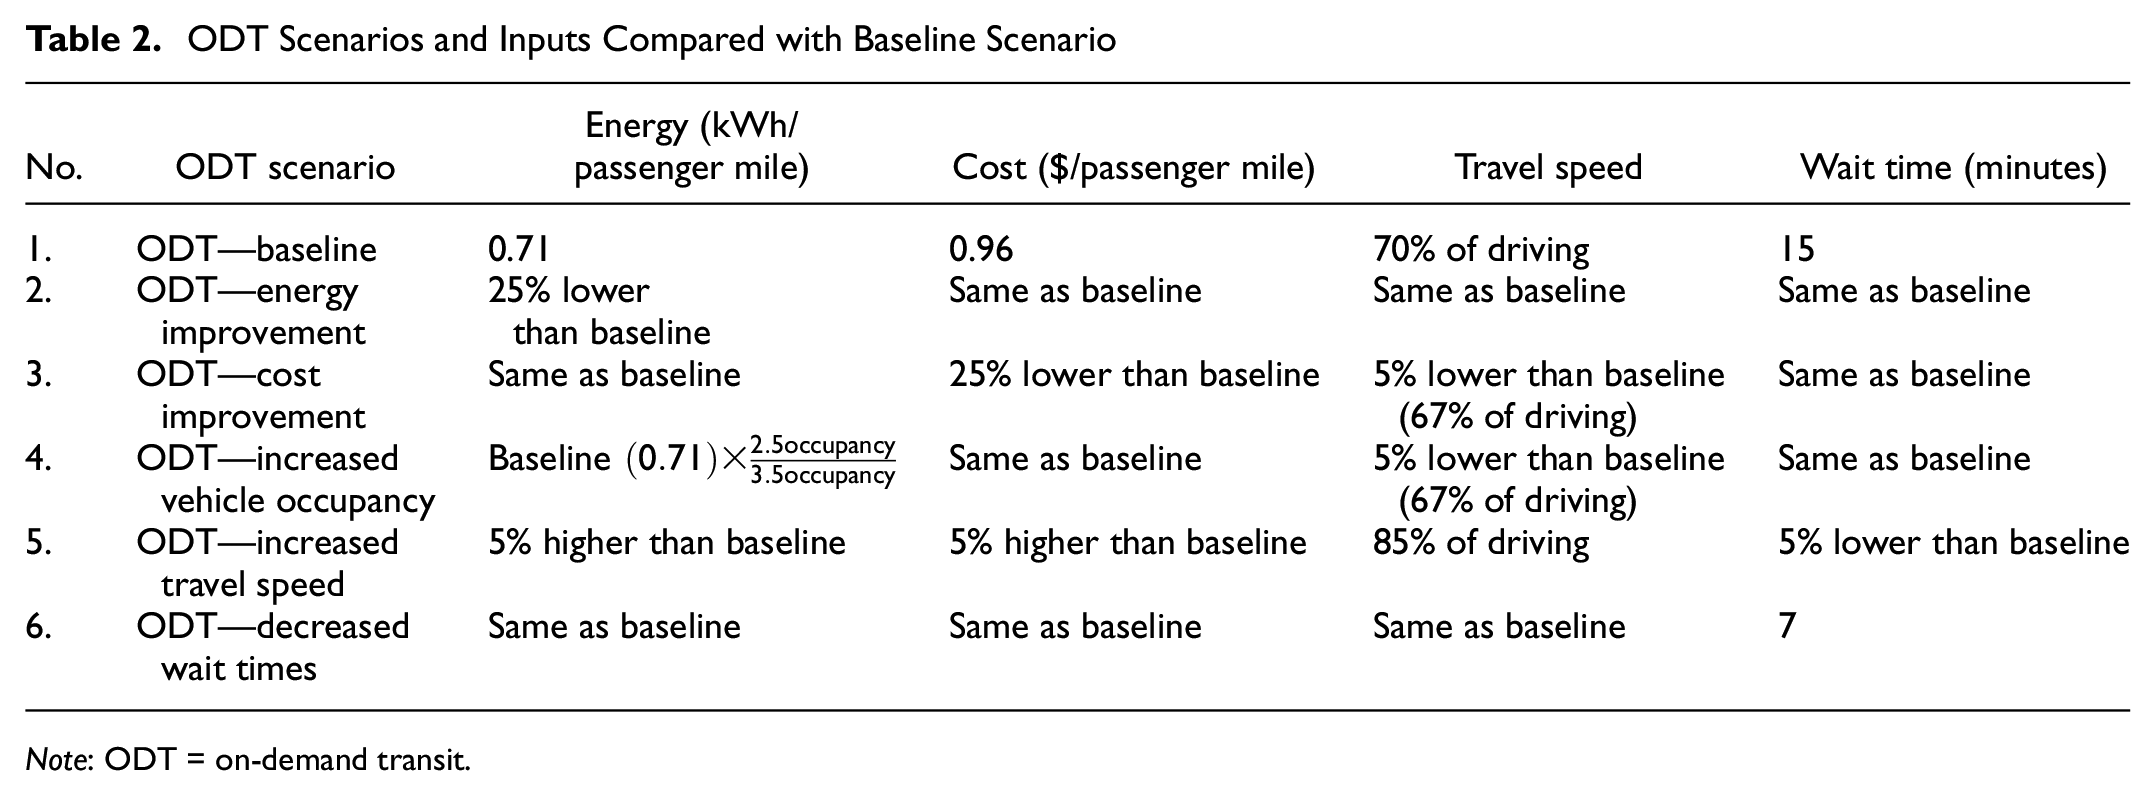
Note: ODT = on-demand transit.
The specific input values used in the MEP computation for the six ODT scenarios and five travel modes are shown in Table 3.
Inputs for MEP Analysis for Different Modes, Including ODT Scenarios
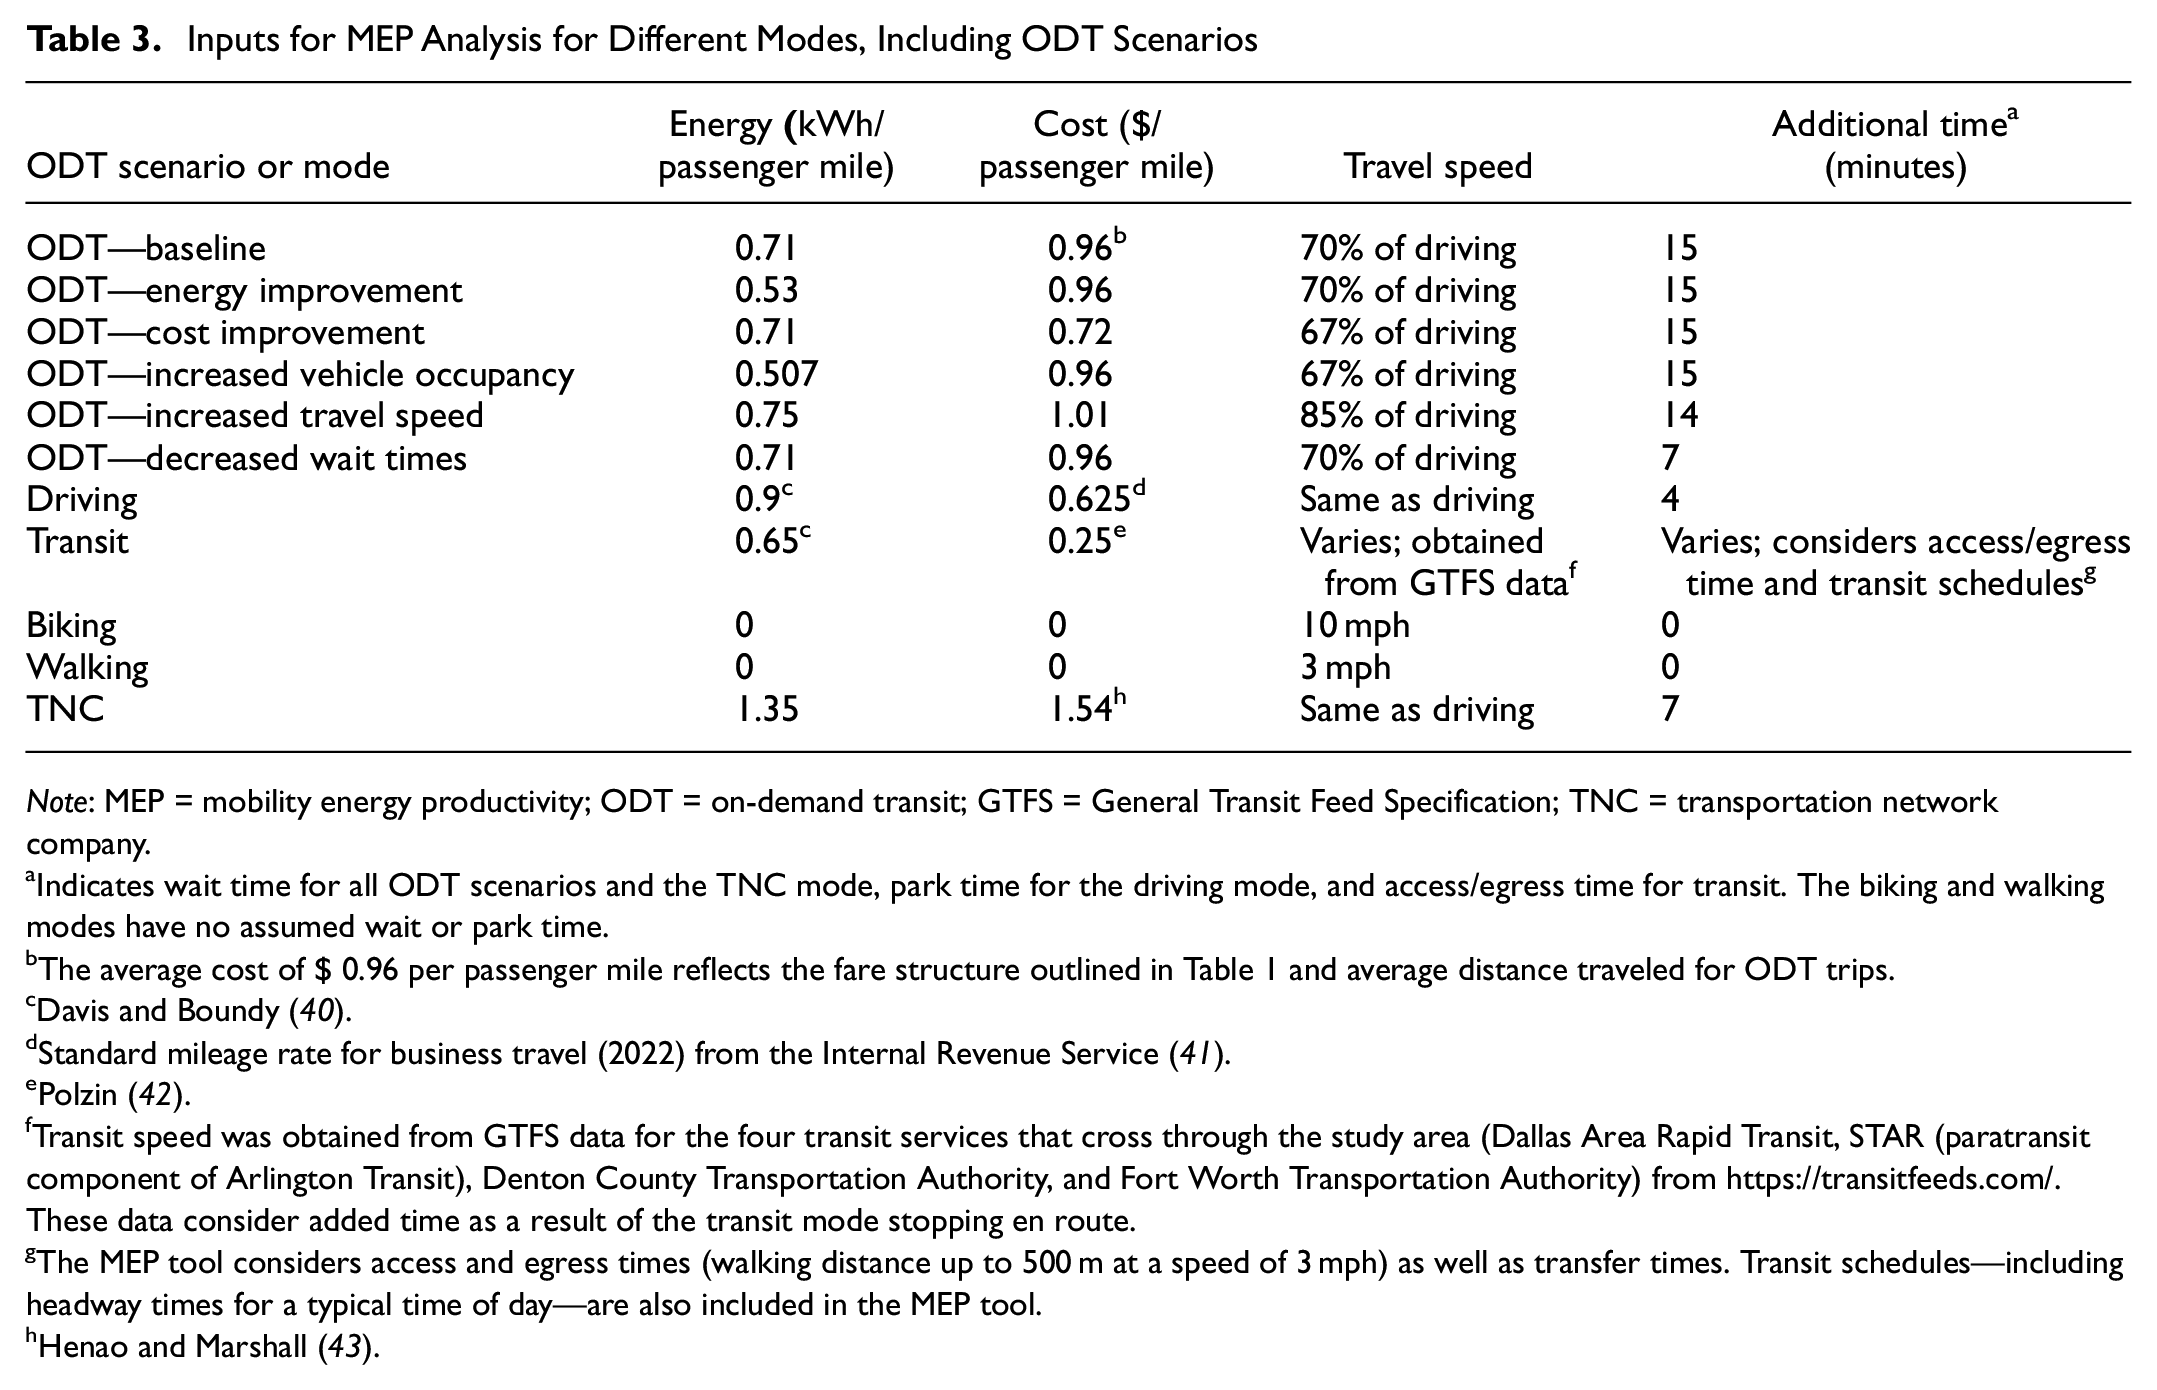
Note: MEP = mobility energy productivity; ODT = on-demand transit; GTFS = General Transit Feed Specification; TNC = transportation network company.
Indicates wait time for all ODT scenarios and the TNC mode, park time for the driving mode, and access/egress time for transit. The biking and walking modes have no assumed wait or park time.
The average cost of $ 0.96 per passenger mile reflects the fare structure outlined in Table 1 and average distance traveled for ODT trips.
Davis and Boundy ( 40 ).
Standard mileage rate for business travel (2022) from the Internal Revenue Service ( 41 ).
Polzin ( 42 ).
Transit speed was obtained from GTFS data for the four transit services that cross through the study area (Dallas Area Rapid Transit, STAR (paratransit component of Arlington Transit), Denton County Transportation Authority, and Fort Worth Transportation Authority) from https://transitfeeds.com/. These data consider added time as a result of the transit mode stopping en route.
The MEP tool considers access and egress times (walking distance up to 500 m at a speed of 3 mph) as well as transfer times. Transit schedules—including headway times for a typical time of day—are also included in the MEP tool.
Henao and Marshall ( 43 ).
Analysis and Results
Population-weighted average MEP scores were computed by taking the population proportion weighted summation of raw (unweighted) MEP scores for each pixel in the study region. The resulting citywide, population-weighted average MEP scores for Arlington, Texas for each mode and ODT scenario are shown in Table 4.
Population-Weighted Average MEP Scores for Different Modes and ODT Scenarios

Note: MEP = mobility energy productivity; ODT = on-demand transit; TNC = transportation network company.
The highest average MEP score, at nearly 120, is for driving a private vehicle. This is expected for the Arlington area, which like much of the U.S.A. has a large network of roads, abundant parking, and limited walkability. In addition, there are high driving MEP scores throughout the Arlington city boundary, indicating adequate driving coverage in nearly all areas, as shown in Figure 5. TNC has the next-highest MEP score (46) because of similar travel times to driving a private vehicle and short wait times. Walking and transit have very low MEP scores—0.6 and 0.2, respectively—as a result of limited pedestrian infrastructure and nearly nonexistent traditional public transit services (only transit from outside Arlington that goes through the city boundary and limited specialized services such as a trolley in the entertainment district are available).

MEP scores by 1-km2 pixel for the driving mode.
The baseline ODT scenario has a similar MEP score to that of the biking mode (approximately 15 and 18, respectively). This indicates that the ODT system is roughly equivalent to biking; however, ODT provides access for those with mobility challenges or the elderly who may not be able to bike or feel comfortable doing so, and also offers protection from the weather. Unsurprisingly, studies have shown that inclement weather, including hot/cold temperatures, reduces bicycle travel ( 44 ). Therefore, Arlington’s limited bicycle infrastructure and hot weather presents challenges for the biking mode. In contrast, the ODT system provides a comfortable service for all in nearly all weather conditions. In addition, whereas the pixels with high biking MEP scores are concentrated closely around the downtown area, the pixels with strong ODT system MEP scores radiate further beyond downtown Arlington.
To examine how ODT can complement existing accessible travel modes by providing greater accessibility to goods and services using a smaller, more flexible public transit service (compared with a fixed-route system), two maps were created. Figure 6 shows how MEP scores vary spatially across Arlington for two different mode scenarios: (a) biking + transit; and (b) biking + transit + ODT. The first scenario represents the modal options accessible to residents before the Arlington ODT service came into existence. Because nearly 80% of ODT riders do not have access to a car, because Arlington has limited pedestrian infrastructure, and because TNC is not an affordable option for many residents, the research team defined existing accessible modes as the biking mode and transit mode. However, it is important to note that traditional transit is extremely limited in Arlington, leading to the poor MEP scores in Figure 6a. In MEP analysis of other cities with developed transit systems, transit MEP typically scored in the range of 1–5 ( 45 ). The second scenario shows the changes in MEP after the introduction of ODT (Figure 6b). Note that the scale of MEP scores in Figures 6a and 6b are different from the scale of the driving mode MEP map in Figure 5. The MEP scores in the figure reflect the MEP score for each pixel; population weighting was only applied when aggregating scores to a larger area or region.

MEP scores by 1-km2 pixel for: (a) the biking mode + transit mode, and (b) the biking mode+transit mode+ODT baseline scenario.
Based on the analysis above, ODT improved MEP scores by 83% when considering only existing accessible modes (biking, transit, and ODT). However, this increase is largely a result of the lack of an existing fixed-route transit service in Arlington. In addition to MEP scores increasing with the introduction of ODT, another important finding was that ODT improved MEP equally (approximately) across the entire service region. This is important because coverage across various population groups and built environments is a goal of the service. Finally, using a quantitative metric such as MEP to evaluate emerging transportation modes and services allows decision-makers to quantify and visualize costs and benefits across numerous scenarios. In this case, ODT provides significant mobility benefits to a location such as Arlington, which is a sprawling, lower-density region lacking a robust public transit system.
Five additional plausible ODT scenarios that could improve the ODT service—compared with the baseline scenario—were also analyzed. The MEP scores for these range from 15.44 (baseline) to 40.09 (decreased wait time). The best-performing ODT scenarios were decreased wait time and increased travel speed (160% and 80% increase in MEP score compared with the baseline ODT scenario, respectively). This is understandable, given that improving the travel time will significantly increase the accessible opportunities as measured by MEP.
The cumulative distribution function—or percentage of the MEP scores below a certain value—across 1-km2 pixels for each ODT scenario is shown in Figure 7. This figure shows the distribution of MEP scores by pixel, with lines further to the right of the graph indicating higher scores. The percentage of MEP scores below a certain value can be deduced from the graph. For example, for the decreased wait time scenario (black line), 80% of the pixel MEP scores are less than or equal to 50. In contrast, approximately 80% of the baseline scenario (dashed red line) pixel MEP scores are less than or equal to 20. The figure shows how the cost improvement, increased vehicle occupancy, and energy improvement scenarios have similar MEP score distributions to the baseline scenario, whereas the increased travel speed and particularly the decreased wait time scenarios have higher MEP scores. In other words, reducing the travel and wait time has the greatest impact on MEP score for the ODT scenarios, resulting in improved system performance.

Cumulative distribution function of MEP scores by 1-km2 pixel for all six ODT scenarios.
Arlington ODT Equity Analysis
The main value proposition for the ODT service in Arlington is that it provides a viable mobility option for anyone not able to own or operate a vehicle in the Arlington area. Previous transit offerings in Arlington were essentially nonexistent. Although a few services existed, they did not provide a systematic solution for noncar owners/operators. With the introduction of ODT, a cost-effective alternative that approached the level of service of a higher-cost TNC service (essentially a modern taxi service) was established. MEP results for Arlington’s ODT system show the best results closer to downtown, with reduced MEP values farther into the suburbs (note that cost model used in the system may have an impact on this). However, MEP scores were improved across the entire service area, indicating improved coverage for all neighborhoods and population groups.
Figure 8 highlights MEP improvements in transportation DACs as defined by the U.S. DOT. The average MEP score for these communities was improved by 72% with ODT compared with existing accessible modes (biking and public transit only). Because nearly 80% of ODT riders do not have access to a car, the ODT system may provide significant mobility advantages. It should also be stressed that before the existence of ODT, the primary contribution to nonprivate vehicle MEP was biking. MEP does not consider the percentage of people who cannot ride a bicycle, or limitations on bicycle use because of the weather (rain, snow, extreme heat, etc.). Compared with previous services classified as “public transit,” whose combined MEP was 0.20, the baseline ODT MEP (15.44), was significantly higher.

MEP scores by 1-km2 pixel in transportation DACs for (a) the biking mode+transit mode, and (b) the biking mode+transit mode+ODT baseline scenario.
From an urban planning perspective, it is worth mentioning that MEP scores are higher in the main districts of Arlington. This is logical, because both the number and proximity of services increase with higher-density development. However, downtown Arlington and the entertainment district are close to DACs, providing a point of advantage for the Arlington government with regard to improving mobility in the urban districts.
Discussion
This paper demonstrates the methodology for applying the MEP metric to evaluate an ODT system, a methodology that can be applied to other ODT systems globally. Although this analysis was only performed for the ODT system in Arlington, the findings may extend to other systems. MEP also provides a unique way of comparing different transport modes holistically and quantitatively as well as comparing the impact of service parameters on a novel mode.
The case study of Arlington, Texas, revealed the most effective levers for improving the ODT system in this area. Total travel time—including wait time and travel speed—is the factor that has the greatest impact on the MEP score for Arlington’s ODT system. Therefore, Arlington transport stakeholders should consider travel and wait time as top priorities when designing or improving the system. Wait time specifically has the largest impact on the ODT scenario MEP scores.
MEP scores also have a spatial output that enables the performance of a system to be analyzed across subareas. In the case of Arlington, the ODT system increases the MEP scores in both DACs and non-DACs. This meets one of Arlington’s goals, which is to increase the ease of mobility in historically disadvantaged communities. In addition, transit agencies can use MEP scores and maps, such as those included in Figures 6 and 8, to determine where future investments in transit improvements should be made. For example, one region near downtown Arlington lacks biking and transit infrastructure, illustrated by its low MEP score and light orange color on the MEP maps. Infrastructure investments in this area may help increase mobility.
Although MEP is a powerful tool for analyzing the mobility of ODT and other transit modes, the metric also has limitations. First, MEP scores do not capture every benefit or disadvantage of a particular mode. For example, although the baseline ODT scenario has a low MEP score, the system still provides value through expanding access to the senior and/or disabled population and allowing waiting indoors (compared with an outdoor bus stop). Second, the cost parameters for riders only use average estimates on a per passenger mile basis, whereas transportation cost and affordability is a larger decision based on car ownership, miles traveled, and related sunk costs. Third, only travel time, cost, and energy are considered. Other considerations, such as the impact of inclement weather conditions on modes, are not incorporated. Certain issues could be addressed through the addition of scenarios, for example, an inclement weather scenario, in which the speed of biking is penalized most heavily (increasing total travel time), followed by a smaller speed penalty for driving modes (ODT, TNC, driving, and bus transit). Another way inclement weather could be addressed is through the addition of a “comfort” metric for each travel mode, perhaps determined from surveys; however, mode preferences and comfort are subjective and difficult to quantify. Similarly, access metrics generally are unable to account for factors that are difficult to quantify, such as customer satisfaction, vehicle cleanliness, and a feeling of safety. Finally, the differences in value between wait time and travel or parking time as far as individuals are concerned are not considered. All time spent traveling is weighted equally. In addition to these limitations in relation to the MEP tool, the current MEP analysis for the ODT mode (as well as all other modes) assumed that ODT provides access to opportunity destinations beyond the Arlington city boundary, which elevated the MEP scores, especially for pixels near the city boundary.
Conclusions
This study demonstrates how the MEP metric can be used for evaluating ODT systems. Through a case study of Arlington, Texas, the researchers found wait time and travel speed were the factors that had the greatest impact on an ODT system. The variability in MEP scores across the area of Arlington was also shown, with DACs benefiting the most from ODT. MEP maps can reveal which areas of a community are best served by a transit system, and which lack access. This spatial aspect can reveal inequities and lead to meaningful improvements for communities.
There are multiple areas for future research. MEP could be applied to additional ODT systems, particularly in areas where there is a robust existing public transit system (unlike in Arlington). The impact of expanding an ODT service area could also be investigated. A sensitivity analysis could be performed to analyze the impact of factors such as parking time on MEP score. Finally, MEP could be used to analyze additional transportation modes, including paratransit, to compare these with ODT.
Footnotes
Acknowledgements
The research team at the National Renewable Energy Laboratory thank Ann Foss at the City of Arlington for providing vital information and data used in this paper, and Joshua Sperling, Venu Garikapati, and Jeff Gonder for their detailed reviews.
Author Contributions
The authors confirm contribution to the paper as follows: study conception and design: A. Henao, R. Grahn, S. Young, B. Powell; data collection: S. Acharya, R. Zakaria, A. Henao; analysis and interpretation of results: B. Powell, R. Grahn, A. Henao, S. Young, S. Acharya, R. Zakaria; draft manuscript preparation: B. Powell, R. Zakaria, S. Acharya, R. Grahn, A. Henao, S. Young. All authors reviewed the results and approved the final version of the manuscript.
Declaration of Conflicting Interests
The author(s) declared no potential conflicts of interest with respect to the research, authorship, and/or publication of this article.
Funding
The author(s) disclosed receipt of the following financial support for the research, authorship, and/or publication of this article: Funding provided by the U.S. Department of Energy Office of Energy Efficiency and Renewable Energy Vehicle Technologies Office's Technology Integration program as part of the Technologies in Communities initiative.
This work was authored by the National Renewable Energy Laboratory, operated by Alliance for Sustainable Energy, LLC, for the U.S. Department of Energy (DOE) under Contract No. DE-AC36-08GO28308. The views expressed in the article do not necessarily represent the views of the DOE or the U.S. Government. The U.S. Government retains and the publisher, by accepting the article for publication, acknowledges that the U.S. Government retains a nonexclusive, paid-up, irrevocable, worldwide license to publish or reproduce the published form of this work, or allow others to do so, for U.S. Government purposes.