



Abstract
Transportation projects are notorious, among both the public and transportation professionals, for missing their intended cost and schedule targets as a result of project complexity and uncertainties. The significant discrepancy between cost estimates and final project costs remains a major concern for state Departments of Transportation (DOTs). Several risk factors, including estimation errors and price fluctuations, contribute to these discrepancies and are typically managed by adding a contingency to project estimates. Cost escalation can also result from inadequate adjustment for inflation in estimates, given the current economic environment and the lengthy duration of major transportation projects. This paper summarizes how several state DOTs apply contingencies to mitigate the impact of certain risks and adjust their State Transportation Improvement Program (STIP) revenues and costs to account for inflation. The study surveyed 13 state DOTs to understand how contingencies are applied to the three major components of transportation projects (construction, right of way, and utilities). Additionally, interviews were conducted with 15 state DOTs to understand how they address inflation, particularly as it pertains to the STIP process. The results indicate that most DOTs apply contingency allowances to their project estimates during the early project development and maintain some level of contingency allowance at the plans, specifications, and estimate (PS&E) stage. As for addressing inflation, most state DOTs include inflation of the project cost in the project estimates to the time of bid letting or year of expenditure. The findings of this study can benefit state DOTs that are reassessing their strategies for implementing contingency and inflation within their STIP.
State Departments of Transportation (DOTs) oversee a large portfolio of transportation infrastructures. They are responsible for planning, designing, constructing, maintaining, and operating transportation infrastructure such as highways, bridges, and railways ( 1 ). Transportation projects, however, tend to suffer from cost escalations ( 2 , 3 ). The significant discrepancy between cost estimates early in a transportation project and the final project costs represents a major concern to state DOTs ( 2 ). Based on a sample of 258 transportation infrastructure projects worth $90 billion in the United States, costs were underestimated in nine out of ten projects, with an average cost overrun of 28% ( 4 ). Several factors contribute to such poor performance, including project complexity and uncertainties. Transportation projects are known for their high risks and the complexities in which they are executed while coordinating with multiple stakeholders, including utility providers and local municipalities, which can be particularly complex in urban areas ( 5 , 6 ). Underestimating project costs will result in overruns and influence the state’s DOT budget allocation. On the other hand, overestimating project costs will reduce the number of authorized projects that a state DOT can let and delay letting projects that are needed by the community ( 3 ).
Risk management processes vary across the different state DOTs, according to Leca Perez ( 7 ). For the most part, however, all the state DOTs’ risk management programs resemble those described in the Project Management Body of Knowledge (PMBOK) guide ( 8 ). For most of the DOTs reviewed in a study by Leca Perez in 2020 ( 7 ), the level of risk analysis depended primarily on project size and complexity. Moreover, a common DOT practice was to combine the risk management process with cost estimating and scheduling. For example, Washington State DOT (WSDOT) considered both cost and schedule risk-based estimates where a range of possible values is provided along with the corresponding probability distributions ( 7 ).
State mandates play a crucial role in shifting funding from one project type to another, reflecting changes in policy focus. For example, WSDOT redirected funds to “Complete Streets Projects” pursuant to a legislative order. This mandate, effective from July 1, 2022, for projects over $500,000, emphasizes designing state highways with “complete streets” principles. These principles ensure that the roads accommodate all users, including pedestrians, bicyclists, and public transport riders, enhancing safety, mobility, and accessibility ( 9 ).
Typically, state DOTs generate multiple cost estimates for a particular project, sometimes over a range of 10–20 years before the project’s letting date ( 10 ). For example, Connecticut DOT creates four contract cost estimates: 1. programming, 2. preliminary design, 3. semi-final design, and 4. final design ( 11 ). As the letting date for a project approaches, the accuracy of cost estimates tends to improve. This is largely because the project’s scope, design, and specifications become more clearly defined, decreasing the uncertainties associated with the estimates ( 10 , 11 ). One of these uncertainties that poses significant challenges to state DOTs is known-unknown risks ( 2 , 3 , 10 ). These risks include planning and estimating errors and minor price fluctuations ( 2 ). To account for these risk items, estimators and policymakers adjust the estimate by adding a contingency ( 2 , 12 ). The Office of Inspector General audit recommended that the Federal Highway Administration (FHWA) account for contingency in projects classified as “major” by the FHWA. Major projects are defined as those requiring federal support and having costs exceeding $500 million ( 13 ). Apart from known-unknown risks, inflation is another risk that must be considered when estimating the cost of transportation projects. According to Tellier ( 11 ), it is crucial to incorporate inflation adjustment into cost estimates if the letting date of a project is more than a year from the date of creating the estimate.
The overarching objective of this study is to examine the practices of various state DOTs as they relate to adjusting project estimates for contingency and inflation. As for contingency, the study focused on the three major components of the transportation project: construction, right of way (ROW), and utilities. Three surveys were developed (one for each project component) to capture the responses of state DOTs in the application of contingencies and their risk management/cost estimation processes. With regard to inflation, state DOTs were contacted to understand how they address inflation particularly as it pertains to the STIP process.
Background
Cost Contingency Practices Among DOTs
Several definitions of the term “contingency” in the context of project management were found in the literature. According to the Project Management Institute, contingency reserve is defined as: “The amount of funds, budget, or time needed above the estimate to reduce the risk of overruns of project objectives to a level acceptable to the organization” ( 8 ). Hollmann offered two definitions for the term contingency ( 14 ). For project teams, contingency is defined “as an amount of money or time in the budget and schedule to cover uncertainties (i.e., risks) that statistically speaking we expect to be incurred just as we expect to spend for concrete and steel” ( 14 ). As for business management, contingency is “an amount of money that will be returned to them if the project team does its job right, that is, they do not expect it to be incurred” ( 14 ). Virginia DOT (VDOT) defines contingency as “money that has been added in addition to the final cost estimate as a precaution for unforeseen instances, such as weather delays and/or changes in scope” ( 15 ). Several state DOTs account for contingency in their estimates. However, the way contingency is accounted for in the estimate varies across state DOTs. Several factors contribute to determining the contingency amount, such as the project type, size, complexity, estimate development stage, and the estimator’s judgment.
The Office of Federal Lands Highway, a division within the FHWA, developed the Project Development and Design Manual (PDDM) ( 16 ). The latest supplement to the engineer’s estimate subsection of the PDDM instructs designers and estimators to incorporate a contingency at all stages of design, with the exception of the final stage, which is defined as the design being 99%–100% complete. For the scoping estimate, the manual recommends adding a 20% contingency. During the preliminary stage, it suggests incorporating a 15% contingency to the estimate. Lastly, the manual specifies that a 10% contingency should be added during the plan-in-hand phase, and a 5% contingency in the pre-final phase ( 16 ). As for DOTs, South Carolina DOT adds 10%–15% contingency to bridge projects ( 17 ). In comparison, New York State DOT (NYSDOT) applies different contingency factor ranges for various project phases with the approval of the project manager or regional estimate engineer with expertise in risk management ( 18 ). At the initial project proposal phase of NYSDOT projects, the contingency factor ranges between 25% and 40% and reaches 5%–10% at the advance detailed plan submission, the detailed engineer’s estimate phase ( 6 ). Similarly, Georgia DOT applies a sliding contingency scale to various estimate stages and assigns risk levels (low, medium, medium/high, and high) to different project types ( 19 ). The higher the project’s risk level, the greater the added contingency percentage. For instance, bicycle projects, considered low risk, receive a 5%–10% contingency at the concept estimate stage, while high-risk new construction projects are allocated a 10%–20% contingency ( 19 ). VDOT created a spreadsheet template named “estimate workbook” with suggested contingency percentages for different project components (i.e., preliminary engineering, ROW, and construction) in each phase ( 20 ). Additionally, the percentages are clustered according to three risk levels: low, medium, and high ( 20 ). Apart from applying percentages to the base estimate, other DOTs with mature risk management programs handle contingencies differently. For example, WSDOT utilizes Monte Carlo simulation (MCS) for cost estimation as part of its project risk management ( 21 ).
Adjusting Cost for Inflation Practices by DOTs
Inflation is defined as “an increase in the amount of money necessary to obtain the same amount of goods or services before the inflated price was present,” according to Blank and Tarquin ( 22 ). In the United States, the U.S. Bureau of Labor Statistics generates the consumer price index (CPI) which is typically used to measure inflation ( 23 ). The U.S. Federal Reserve Board has a target inflation rate of 2%, based on the core CPI ( 24 ). In the context of transportation infrastructure projects, state DOTs typically consider the impact of inflation on their projects. VDOT defines inflation as “an increase of expenditure levels resulting from a considerable and prolonged rise in prices and other costs through time without changes in project scope” ( 15 ). According to Turochy et al. ( 15 ), inflation is a major obstacle in producing a quality cost estimate and it should be incorporated into the estimate based on the year of advertising the project.
Our review of the websites of state DOTs revealed that there are several practices for adjusting project estimates to account for inflation. Several state DOTs utilize fixed percentages to adjust project estimates for inflation. These percentages can be simple, as with the New Jersey DOT ( 25 ), or compounded, similar to the approach taken by Michigan DOT, which adopts the FHWA’s recommended percentage of 4% ( 26 ). NCDOT adjusts the estimates for inflation differently for different project components. For one major project (I-26 Widening), a 3% annual inflation rate was applied to both utility relocations and construction estimates, whereas a 4% rate was utilized for the ROW acquisition estimate ( 27 ). Other state DOTs create inflation forecasts while considering the bid price trends and the overall economic trends, for example, Ohio DOT ( 28 ). Specifically, Ohio DOT generates three (high, most likely, and low) five-year construction cost inflation forecasts ( 28 ). At WSDOT, the estimates are adjusted for inflation before generating the MCS distribution estimates ( 21 ). It is worth noting that some state DOTs, such as Oregon DOT, consider inflation to be part of the project’s contingencies ( 29 ). In summary, there is no consensus on how estimates should be adjusted for inflation among different state DOTs.
Research Methodology
The goal of this study was to survey state DOTs to learn about their practices on contingency and inflation. As for contingency, the research team worked with NCDOT personnel to distribute the online survey through the American Association of State Highway and Transportation Officials (AASHTO) to solicit information about other states’ application of contingency factors and their risk management/cost estimation processes. Three different versions of the survey (i.e., the contingency-related surveys) were used, one for each of the three main project components (construction, ROW, and utility relocation). Qualtrics survey platform was utilized to create the three surveys and capture the data.
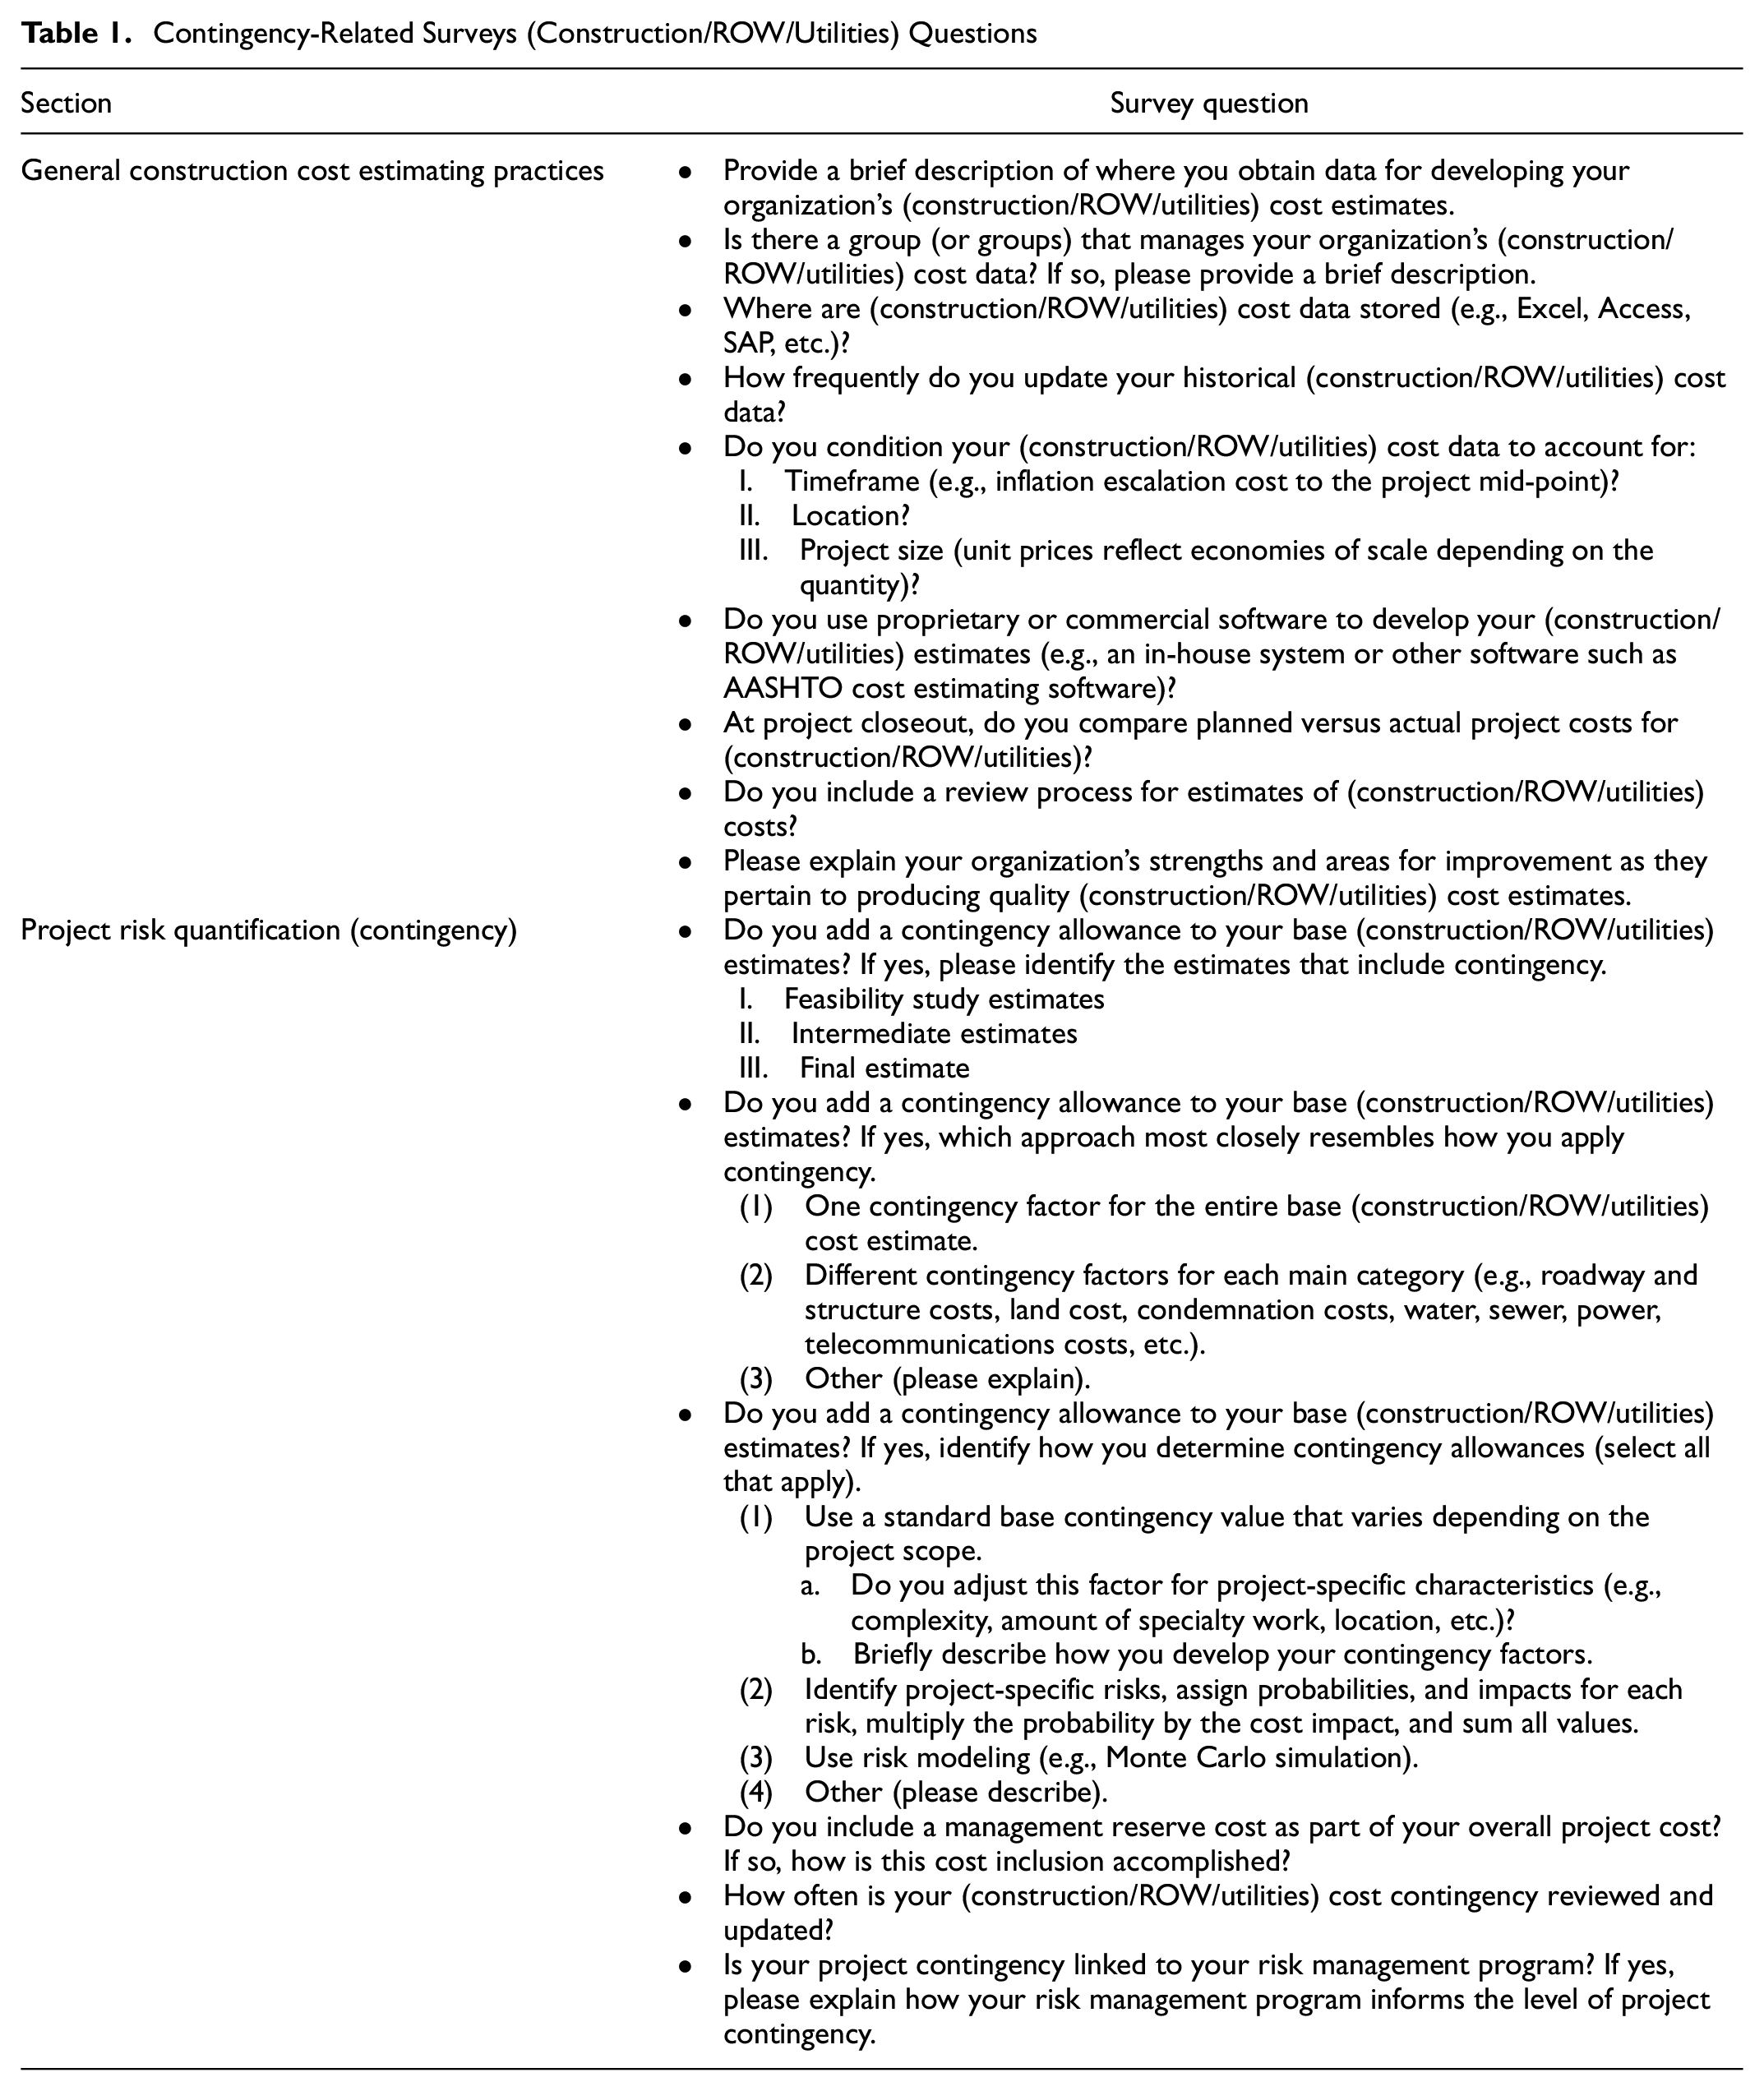
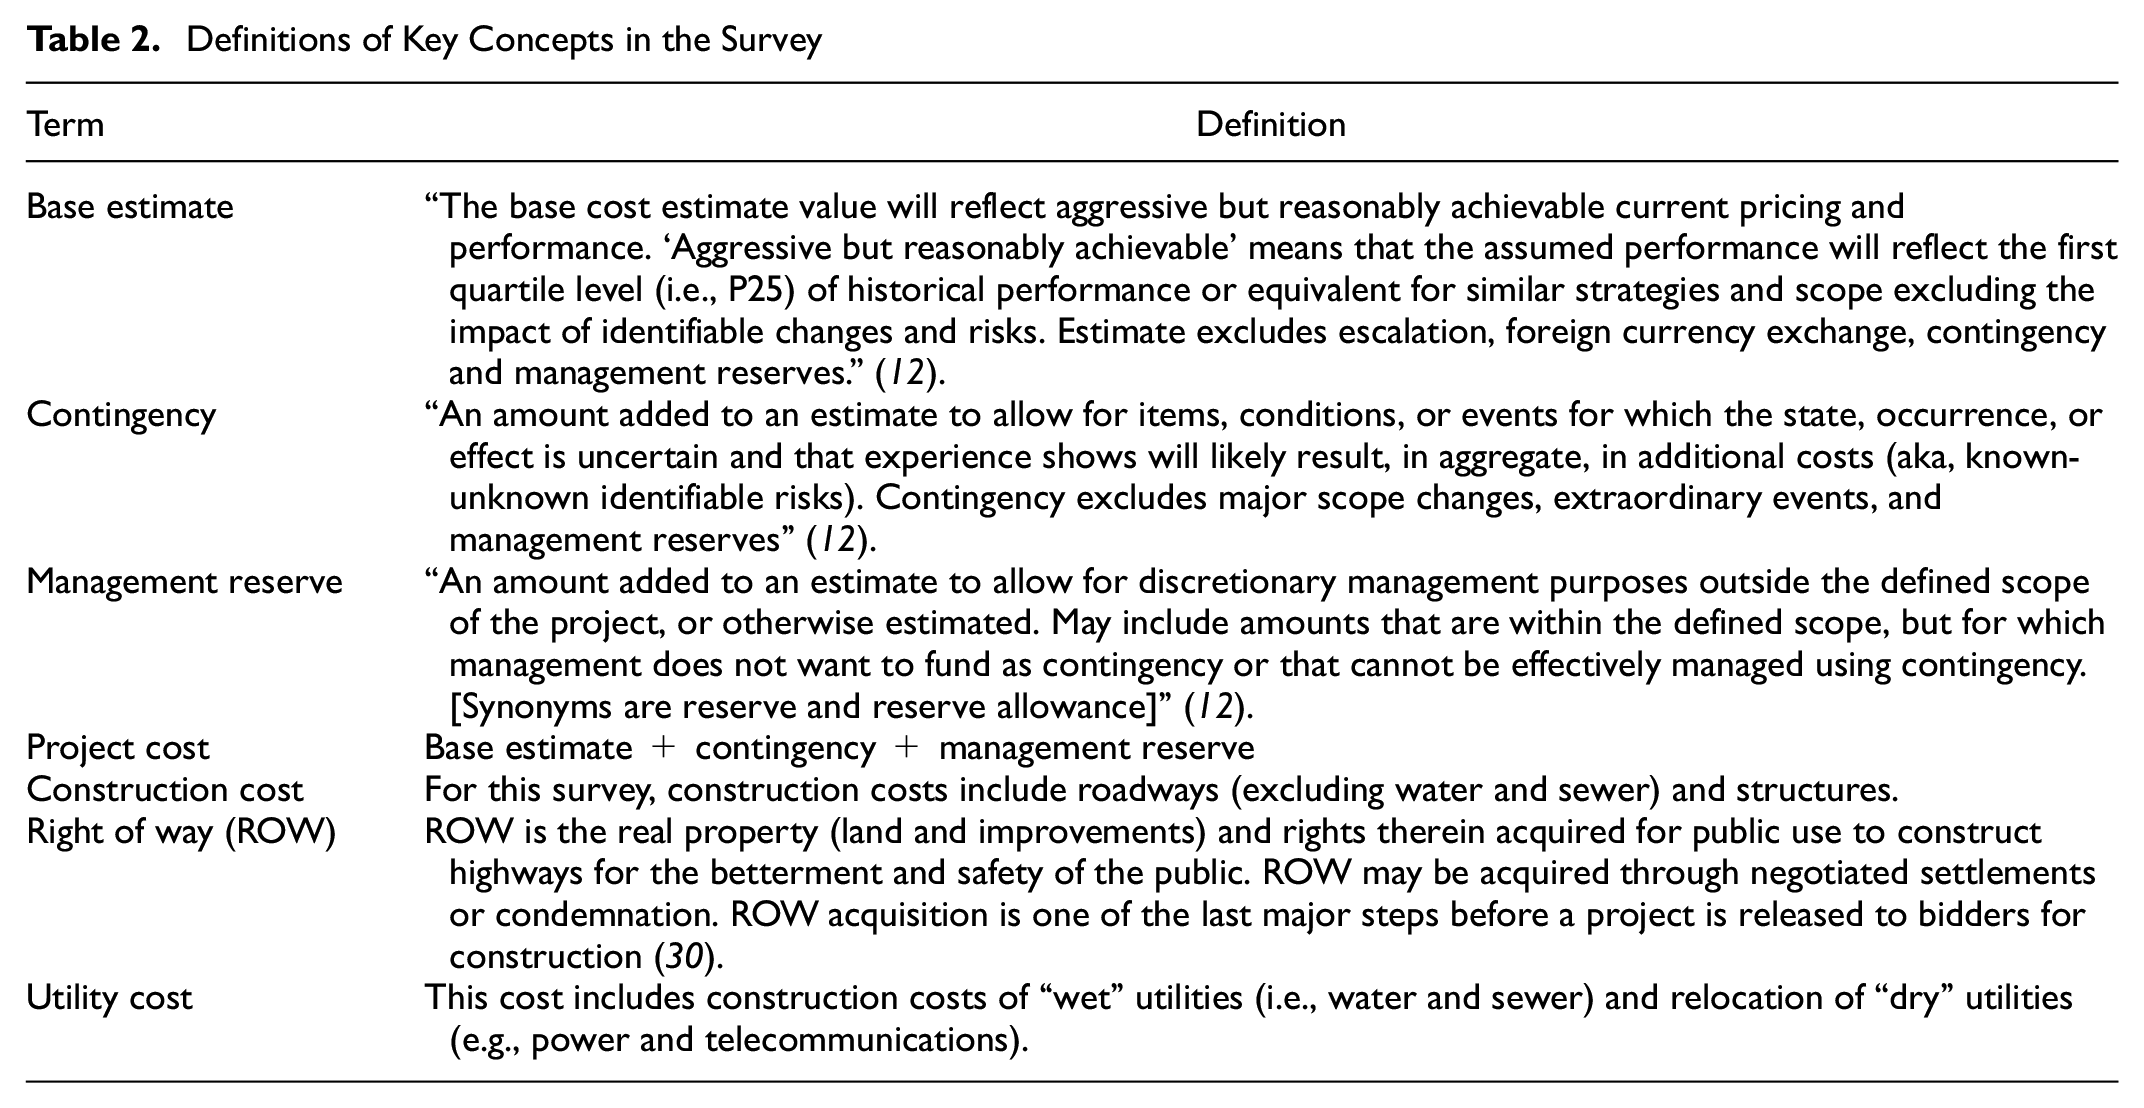
Table 1 reports the questions on the contingency-related surveys. Each of the three survey versions provided a list of definitions for key concepts to the respondents to ensure a clear understanding and accurate responses. These definitions are also listed for reference in Table 2. As for understanding inflation practices by different state DOTs, the research team contacted subject-matter experts from each state DOT. To qualify as a subject-matter expert in this study, the expert must have been actively involved in the STIP within their respective organization for at least 10 years. The objective of the inquiry was to understand the methods that other state DOTs follow to address inflation, particularly as they pertain to the STIP process. In addition to collecting information on how inflation is handled, the duration of the STIP was gathered for each state DOT that participated in the interviews.
Contingency-Related Surveys (Construction/ROW/Utilities) Questions
Definitions of Key Concepts in the Survey
Survey Findings on Contingency, Reserve, and General Estimating Practices
This section describes state DOTs’ estimating practices and is based on a broad survey conducted by the research team that was designed to learn more about contingency, reserve, and general estimating practices for the three main project components (construction, ROW, and utility relocation). The research team created three separate surveys, one for each project component of interest (construction, ROW, utility relocation).
Construction Contingency, Reserve, and Estimating Practices
A total of 13 responses were obtained from cost estimation subject-matter experts who represented state DOTs that covered most regions (East, West, South, Southwest, and Midwest) of the United States. These experts had an average of 18 years of experience in their respective organizations and 14 years of experience in estimating projects. They reported their respective DOT’s construction contingency, management reserve, and other estimating practices.
Construction Contingency Allowance
Nearly two-thirds of the 13 DOTs add a contingency allowance to their base construction estimates, mostly for feasibility and intermediate estimates. Fewer (25%) include contingency in their final estimate. Of those respondents that include a contingency in their estimates, 50% use one contingency factor for the entire estimate, 13% apply different contingency factors for each main component, and 38% use a varied approach described as follows:
Apply contingency factors for each main category in small and medium-sized projects and probabilistic risk-based cost estimating for larger, riskier projects.
Are in the process of transitioning from the use of one overall contingency factor to discipline-specific contingencies.
Use MCS (P70) to establish contingency values for major estimate items that comprise more than 1% of the total construction cost.
Of the 13 DOT respondents, 38% determine contingency using a risk-based approach by identifying project-specific risks, assigning probabilities and impacts to each risk, and multiplying the probability by the cost impact. Nearly 25% of the respondents use a standard contingency that depends on the level of scope definition. A smaller percentage of respondents (12%) use risk modeling, such as MCS, to determine the contingency factors. In addition, 25% of the respondents reported other approaches that are scalable between deterministic risk for less risky “low-dollar” projects and risk modeling through MCS for “high-dollar” and higher-risk projects.
When asked about ways in which contingency is linked to their DOT risk management program, 55% of the respondents reported that their DOT does not specifically link contingency to their risk management program. For DOTs that do, contingencies are defined primarily by the risks identified for larger, high-profile projects. Some DOTs are working on a process to link risk to contingency in most of their projects. The responses were inconsistent with the frequency of the review process for contingency allowances. Some DOTs perform this task annually as part of the STIP development process, but some respondents were unsure of their organization’s contingency review and update policy.
Construction Management Reserve Allowance
Nearly two-thirds of the 13 state DOTs who responded to the construction-related survey do not include reserve funds in their project estimates. The comments from some respondents whose DOTs include reserve funds are as follows:
For every project, 3.5% is in reserve.
Project managers include all reserves and contingencies in their estimates and use historical data to determine these values.
Reserve is used for some projects with FHWA oversight for construction overruns. A number is identified during the cost estimate review and is then included in the total cost of the project.
Sources of Data for Construction Cost Estimation
To develop construction cost estimates, more than 85% of the 13 DOT respondents review their previous internal bid history. Some rely on bid-based estimation data from the AASHTOWare Project Preconstruction and Data Analytics and the WebTransport Reports databases. In addition, design engineers occasionally obtain information from suppliers and industry to determine the costs of unique items without historical information. Most respondents condition their cost data for project location (85%), timeframe (54%), and project size (77%), reflecting economies of scale for larger projects with greater quantities.
Frequency of Updating Construction Cost Data
The frequency of updating historical construction costs varies widely among these 13 DOTs, with more than 60% of the surveyed departments reporting monthly as bids are received, or quarterly. Less than 40% of the respondents reported annual updates. It is worth noting that updating historical construction costs may be independent of applying them as a way to estimate future costs and contingencies. Regardless of the frequency of historical construction cost updates, cost contingency policies are typically only reviewed annually.
Management of Construction Cost Data
Respondents across the 13 state DOTs reported that a group manages their construction cost data. Nearly all 13 DOTs reported having separate data managers, including information technology personnel, the State Office Engineer, the Project Controls Office, and others. The different organizational structures of different agencies may contribute to the variety of data managers that house these data. Data storage systems typically utilize Microsoft products (such as Excel and Access), whereas others deploy third-party software, such as AASHTOW, which includes data storage.
Quality Control Practices for Construction Estimates
More than 75% of the 13 DOTs have a formal review process for estimating construction costs, at least for high-dollar or high-risk projects. Approximately half of the respondents reported that their DOTs at least compare planned versus actual project costs for construction at the conclusion of projects. However, applying lessons learned to future estimating policies is less common.
Strengths and Weaknesses of Construction Estimating Approaches
When respondents were asked about the strengths and weaknesses of their current estimating processes, several trends emerged related to staffing constraints, poor staff retention, and minimal training for new staff, which consistently limited the functionality of the surveyed estimation professionals. Many areas for improvement were identified, the most common of which is accounting for inflation, which is inadequately addressed by most DOTs’ current estimating policies.
Construction Contingency, Reserve, and Estimating Practices
A total of 13 responses were obtained from ROW cost estimation subject-matter experts who represented state DOTs covering most regions (East, West, South, Southwest, and Midwest) of the United States. These experts had an average of approximately 23 years of experience in their respective organizations and 16 years of experience in estimating projects.
ROW Contingency Allowance
Of the 13 respondents, around 71% add a contingency to their base ROW costs, with most DOTs including a contingency in all of their estimates (feasibility, intermediate, and final). ROW contingency allowances vary depending on the nature of the project and its location, but generally cover changes in the project scope, eminent domain proceedings, and final settlements. Projects that affect commercial corridors generally have higher ROW contingency allowances compared with projects located in rural areas. One DOT uses contingency allowances for time, counteroffers, condemnations, and appraisal costs. One DOT applies a condemnation percentage to the total land, damages, and easement costs to account for typical negotiated settlements and litigation. It then adds a contingency allowance to account for unknowns such as potential hazardous material, or a well/drain-field not reflected properly in plans, or when one or two extreme condemnation instances occur. The risk management aspect of ROW acquisition is based on the likelihood that the agency will pursue an eminent domain.
ROW contingency allowances are typically based on a standard value that depends on the project’s specifics. However, one respondent’s DOT uses a standard contingency factor that is not dependent on project-specific factors. Some DOTs also base their contingency levels on project-specific risks by assigning cost impacts and probabilities of occurrence, using both deterministic and probabilistic risk-based approaches. One respondent stated that if the scope of work is simply to add better shoulders and the risk of change is limited, then the DOT will include a lower contingency allowance. However, if the unknown impacts are numerous, then the DOT will add a higher contingency allowance. The same respondent also noted that, at the early prescoping/scoping phases, the DOT might apply a higher contingency allowance but reduce it during the project’s life cycle. When the DOT is at the ROW notice-to-proceed (NTP) stage, a contingency allowance may still be applied, but typically, the allowance is much lower than in the earlier phases.
Responses about the frequency of ROW contingency reviews and updates varied, but the following responses were typical:
Project-by-project: standard contingency percentages are assessed for their suitability for each project.
Quarterly, during project cash flow meetings.
Annually.
Almost never.
ROW Management Reserve Allowance
The inclusion of management reserve funds for ROW is uncommon. Only one respondent’s organization adds a reserve allowance of 17%–20% (after contingency is added to the base ROW estimate).
Sources of Data for ROW Cost Estimation
Generally, the sources of ROW cost estimation data include any or all tools and data that are available from local governments, market participants, the U.S. Geological Survey, the U.S. Department of Environmental Protection, and water management districts, which together maintain information related to parcel boundaries, future land use/zoning, roads, drainage systems, subdivision plans, municipal boundaries, urban area boundaries, state lands, tribal lands, hazardous waste sites, underground storage tanks, landfills, petroleum depots, protected/threatened endangered species, national marine fisheries, soils, drinking water wells, land cover, wetlands, aquatic preserves/sanctuaries, conservation and recreation lands, drainage areas, groundwater elevations, and flood-prone areas. The data also include historical information of actual costs for property acquisitions, which may be derived from analyzing sales data or evaluating local master plans, zoning codes, and/or land development plans and may include multiple listing service (MLS) data, appraisers’ and tax assessor’s records, Register of Deeds records, landowner information, and web-based services with county assessor data, as well as current sales data from court-house retrieval and eminent domain coordinators. Other insights about the sources of data for ROW cost estimation include the following:
The base estimate includes an administrative cost that covers the title report, appraisal, negotiation, and closing on a per-parcel basis.
ROW cost estimators generally perform estimates starting from the preliminary engineering phase through the post-ROW phase.
Excel spreadsheets are often used to prepare estimates.
ROW costs are typically conditioned for the timeframe, location, and size of the project.
A reliable cost estimate involves a quasi-appraisal of every property affected by the proposed project.
ROW estimates are typically twofold: one at the project’s conceptual stage and the other after the ROW limits have been set.
Frequency of Updates of ROW Cost Data
For nearly a third of the 13 DOTs, historical costs are not updated at all or are updated infrequently (e.g., every five years when the ROW manual is updated). For many of these DOTs, historical ROW costs are generally linked to acquisition business processes and are updated in real time. ROW costs can be updated at various project milestones, for example, initial prescoping, scoping, field inspection, and the ROW NTP and post-ROW NTP phases. One respondent reported that their DOT analyzes administrative costs and condemnation risks, such as trials, annually to verify if any tweaking of administrative costs and or trial/litigation costs is needed. Other respondents noted that ROW cost estimates are performed for each project and reflect present-day costs. Estimates are updated at different intervals, such as annually or at other time intervals or when design changes are needed, by request, or through the identification of new information.
Management of ROW Cost Data
Each of the 13 DOTs has its own method for managing ROW cost data and uses either centralized or decentralized approaches. In some instances, each district, region, or section manages its own ROW costs. One DOT allows its regions to have access to internal software for historical data when determining administrative and eminent domain costs. One DOT has a ROW office that manages all ROW activities for the department. Based on the survey responses, ROW data are typically stored in an office proprietary enterprise system on a secure internal server. Excel spreadsheets are used to calculate individual cost estimates, with approved estimates maintained in project files.
Quality Control Practices for ROW Estimation
Most of the 13 DOTs (85%) include a review process for ROW estimates, and some processes are more formal than others. Reviews are performed by district ROW administrators, internal staff, or both. Most DOTs (67%) do not compare their planned versus actual ROW costs. One respondent stated that such a comparison is not necessary because the DOT’s final costs are generally lower than its initial estimate, which includes a 50% condemnation factor. One DOT respondent stated that the DOT has the capability to compare planned and actual costs through its ROW management system but that this exercise is not formally conducted for each project. One respondent stated that the actual versus planned ROW costs are reviewed annually before updating all STIP estimates to identify potential adjustments to the ROW cost estimates. Another said that planned versus actual ROW costs are compared when staff members are available to do so and that the review process is based on a simple comparison between planned and actual costs. The respondent noted that the planned ROW costs are likely to be lower than the actual costs, and then they “dig deeper” to determine the lessons that may be learned from individual projects.
Strengths and Weaknesses of ROW Estimating Approaches
The respondents noted that the strengths of their DOT’s ROW estimating approach include constantly updating the data and capturing the proposed areas of impact. The approved on-call contract appraisers stay current with changing market trends through actual published sales data and current competitive contract bidding. A respondent reported that their DOT gains additional support from designers in providing ROW data sheets as early as possible to include the preliminary engineering phases and noted that this method is imperative to their DOT’s success. DOT personnel research the sales of each parcel affected and do not simply use assessments. They conduct field inspection of projects in the preliminary engineering phases and use Google Earth in every project. They also hold project meetings with the engineers to discuss ROW issues and potential solutions for cost savings, for example, impacts on parking/access. Each district has staff assigned to estimate the ROW costs. Most of these individuals (85%) have an appraisal background and specialize in valuation for condemnation purposes. The respondent noted that their DOT continually seeks ways to improve the quality of estimates, mainly by ensuring that data, maps, and plans are the most current available.
Weaknesses include mostly the challenge of capturing unforeseen litigation costs. One respondent stated that eminent domain attorneys, along with some of their appraisers, have become “creative” in their counteroffers and that litigating these cases has become extremely expensive. Areas for improvement include estimating legal fees, court settlements, and counteroffers, and having plans that do not change (i.e., adding drainage easements and sediment basins) during the acquisition process. One respondent noted that information provided in a detailed cost estimate could also be used against the DOT during condemnation actions (eminent domain). Other weaknesses include estimating relocation costs with limited information at estimate time and estimating legal costs in the presence of unknowns and the current litigious environment. Weaknesses can also relate to valuation because various factors can influence the cost of real estate.
Construction Contingency, Reserve, and Estimating Practices
A total of 12 responses were obtained from utilities subject-matter experts who represented state DOTs that covered most regions (East, West, South, Southwest, and Midwest) of the United States. These experts had an average of 21 years of experience in their respective organizations and 15 years of experience in estimating projects.
Utility Relocation Contingency Allowance
Only about 38% of the 12 responding DOTs add a contingency allowance to their utility agreement costs. Most of these allowances are for their feasibility studies and intermediate estimates, and an even smaller percentage of DOTs add a contingency allowance to their final estimates. Generally, the DOT uses one contingency factor for the entire base utility cost estimate. One respondent’s DOT uses different contingency factors for each type of utility (e.g., water, sewer, power, and telecommunications). One respondent reported that their DOT does not include contingency allowances because many utility companies already add them to their cost estimate. Most respondents whose DOTs include a utility relocation contingency allowance said they review their contingency values on an as-needed basis or yearly. None of the 12 DOTs link their utility relocation contingency to their risk management programs.
Utility Relocation Management Reserve Allowance
Most of the 12 respondents (80%) stated that their DOT does not include a management reserve for utility relocation costs. Only one DOT uses 3.5% of the total project cost as a reserve.
Sources of Data for Utility Relocation Cost Estimation
The sources of data for utility relocation cost estimation varied among the 12 respondents. For feasibility study estimates, DOTs generally obtain utility relocation cost data from historical project data, including previous utility agreements and invoices where average values are used at the program level. Estimating utility relocation costs involves direct communication with utility companies and historical data. Utility agreement estimates are provided for projects that are at the ROW stage. Approximately half of the respondents said that they condition their utility relocation cost data to account for location, project size, and timeframe. More than half of the respondents do not use proprietary or commercial software to develop utility relocation estimates. The remaining DOTs use either in-house software or the AASHTOWare Precon or Heavy Bid packages.
Frequency of Updating Data on Utility Relocation Costs
Responses on the frequency of updating historical utility relocation costs varied and include: “not at this time,” every two to five years, annually, and every bid letting.
Management of Utility Relocation Cost Data
Generally, a DOT’s utilities office or section is responsible for managing the utility relocation cost data. For one of the 12 DOTs, data are housed within the central office and used by regional and statewide utility coordinators. Three respondents stated that their DOT does not manage utility relocation cost data. One respondent stated that their section obtains estimates from utility companies for any reimbursable work but that they do not have or keep the information in a database form and request estimates for each situation as it arises. DOTs with a utility relocation cost data management system in place typically use software such as Excel, AASHTOWare Data Warehouse, or ProjectWise.
Quality Control Practices for Utility Relocation Estimation
All 12 respondents reported that their DOT compares the planned versus actual project utility costs, and one mentioned that such a comparison is one of their DOT’s metrics. Estimation quality control practices vary depending on the DOT. One DOT performs quality control during invoicing, and most utility agreements go through an audit process at the completion of the utility relocation. Utility companies are required to provide a detailed final invoice with supporting information. One DOT respondent said that recent/historical projects are reviewed not at project closeout but annually in an effort to learn and adapt when completing yearly updates to STIP cost estimates (for all eight years in STIP). Another DOT reconciles at the time of billing. More than 80% of the 12 DOTs include some form of review process for utility relocation cost estimates. One respondent stated that the DOT reviews cost estimates only if problems or concerns with the estimate are found. Another DOT reviews cost estimates, but at the time of the survey did not have good numbers to compare costs.
Strengths and Weaknesses of Utility Relocation Estimating Approaches
With regard to strengths, one of the DOTs relies on its experienced utilities managers/coordinators and information supplied by the utility company. Another DOT estimates its utility relocation costs and is trying to work out some planning level per mile (or per 100 ft) for relocating/replacing utilities to use in its planning-level estimates. The idea is that utility relocation costs for planning estimates would then be updated when estimates become available from the utility company. That is, the DOT updates its planning/STIP cost estimates with updated estimates from the utility company as that information becomes available during the design stage, but this information is typically not available until one to two years before bid letting. Areas for improvement include incorporating market price fluctuations that historical data may not capture and a cost estimating program that updates for industry changes. One respondent replied that no statewide database is available for their DOT and that a cost manual-type procedure is needed. One of the 12 DOTs does not produce its own estimates for utility relocation work but instead relies on information supplied by the utility company. This DOT currently does not have sufficient information for estimation purposes to be able to start such a process.
Inflation Survey Findings
The research team investigated the state-of-practice for applying inflation in the STIP process through a survey of state DOTs. A total of 15 state DOTs responded to the request for information which included two components: available revenue and project cost. For available revenue, six state DOTs assume that revenues will increase, three have mixed revenue assumptions (such as applying a reduction factor as a conservative approach), and the remaining six DOTs do not directly address inflation of revenue in their STIP process. For project costs, 15 state DOTs assume that project costs will increase. NCDOT handles inflation using a program budget model where inflation, claims, and supplementary agreements are funded using current STIP dollars as opposed to the project budget model where each project budget is sufficient to cover all costs.
Figure 1 provides a summary of the responses. Most state DOTs include inflation of the project cost in the project estimates to the time of bid letting. The length of the STIP relies on the DOT’s needs and funding priorities. In Figure 1, it is worth noting the following:
Adjust Available Revenue: Changes in available funding/revenue may result from assuming either that purchasing power will decline in future years (which would be the case if there are no changes in the revenue but inflationary factors erode the purchasing power of those funds) or that the behavior of system users will change (for example, with the gas tax, more or fewer gallons of fuel are consumed, which will lead to increases or decreases in the gas tax, respectively).
Increase Project Cost: Changes in the cost of completing projects are primarily assumed to be associated with inflationary factors (i.e., the same project will cost more in the future than it does today).
The up/down arrows represent an assumption that the revenue or cost will increase/decrease in the future.
N/A represents “not applicable.”
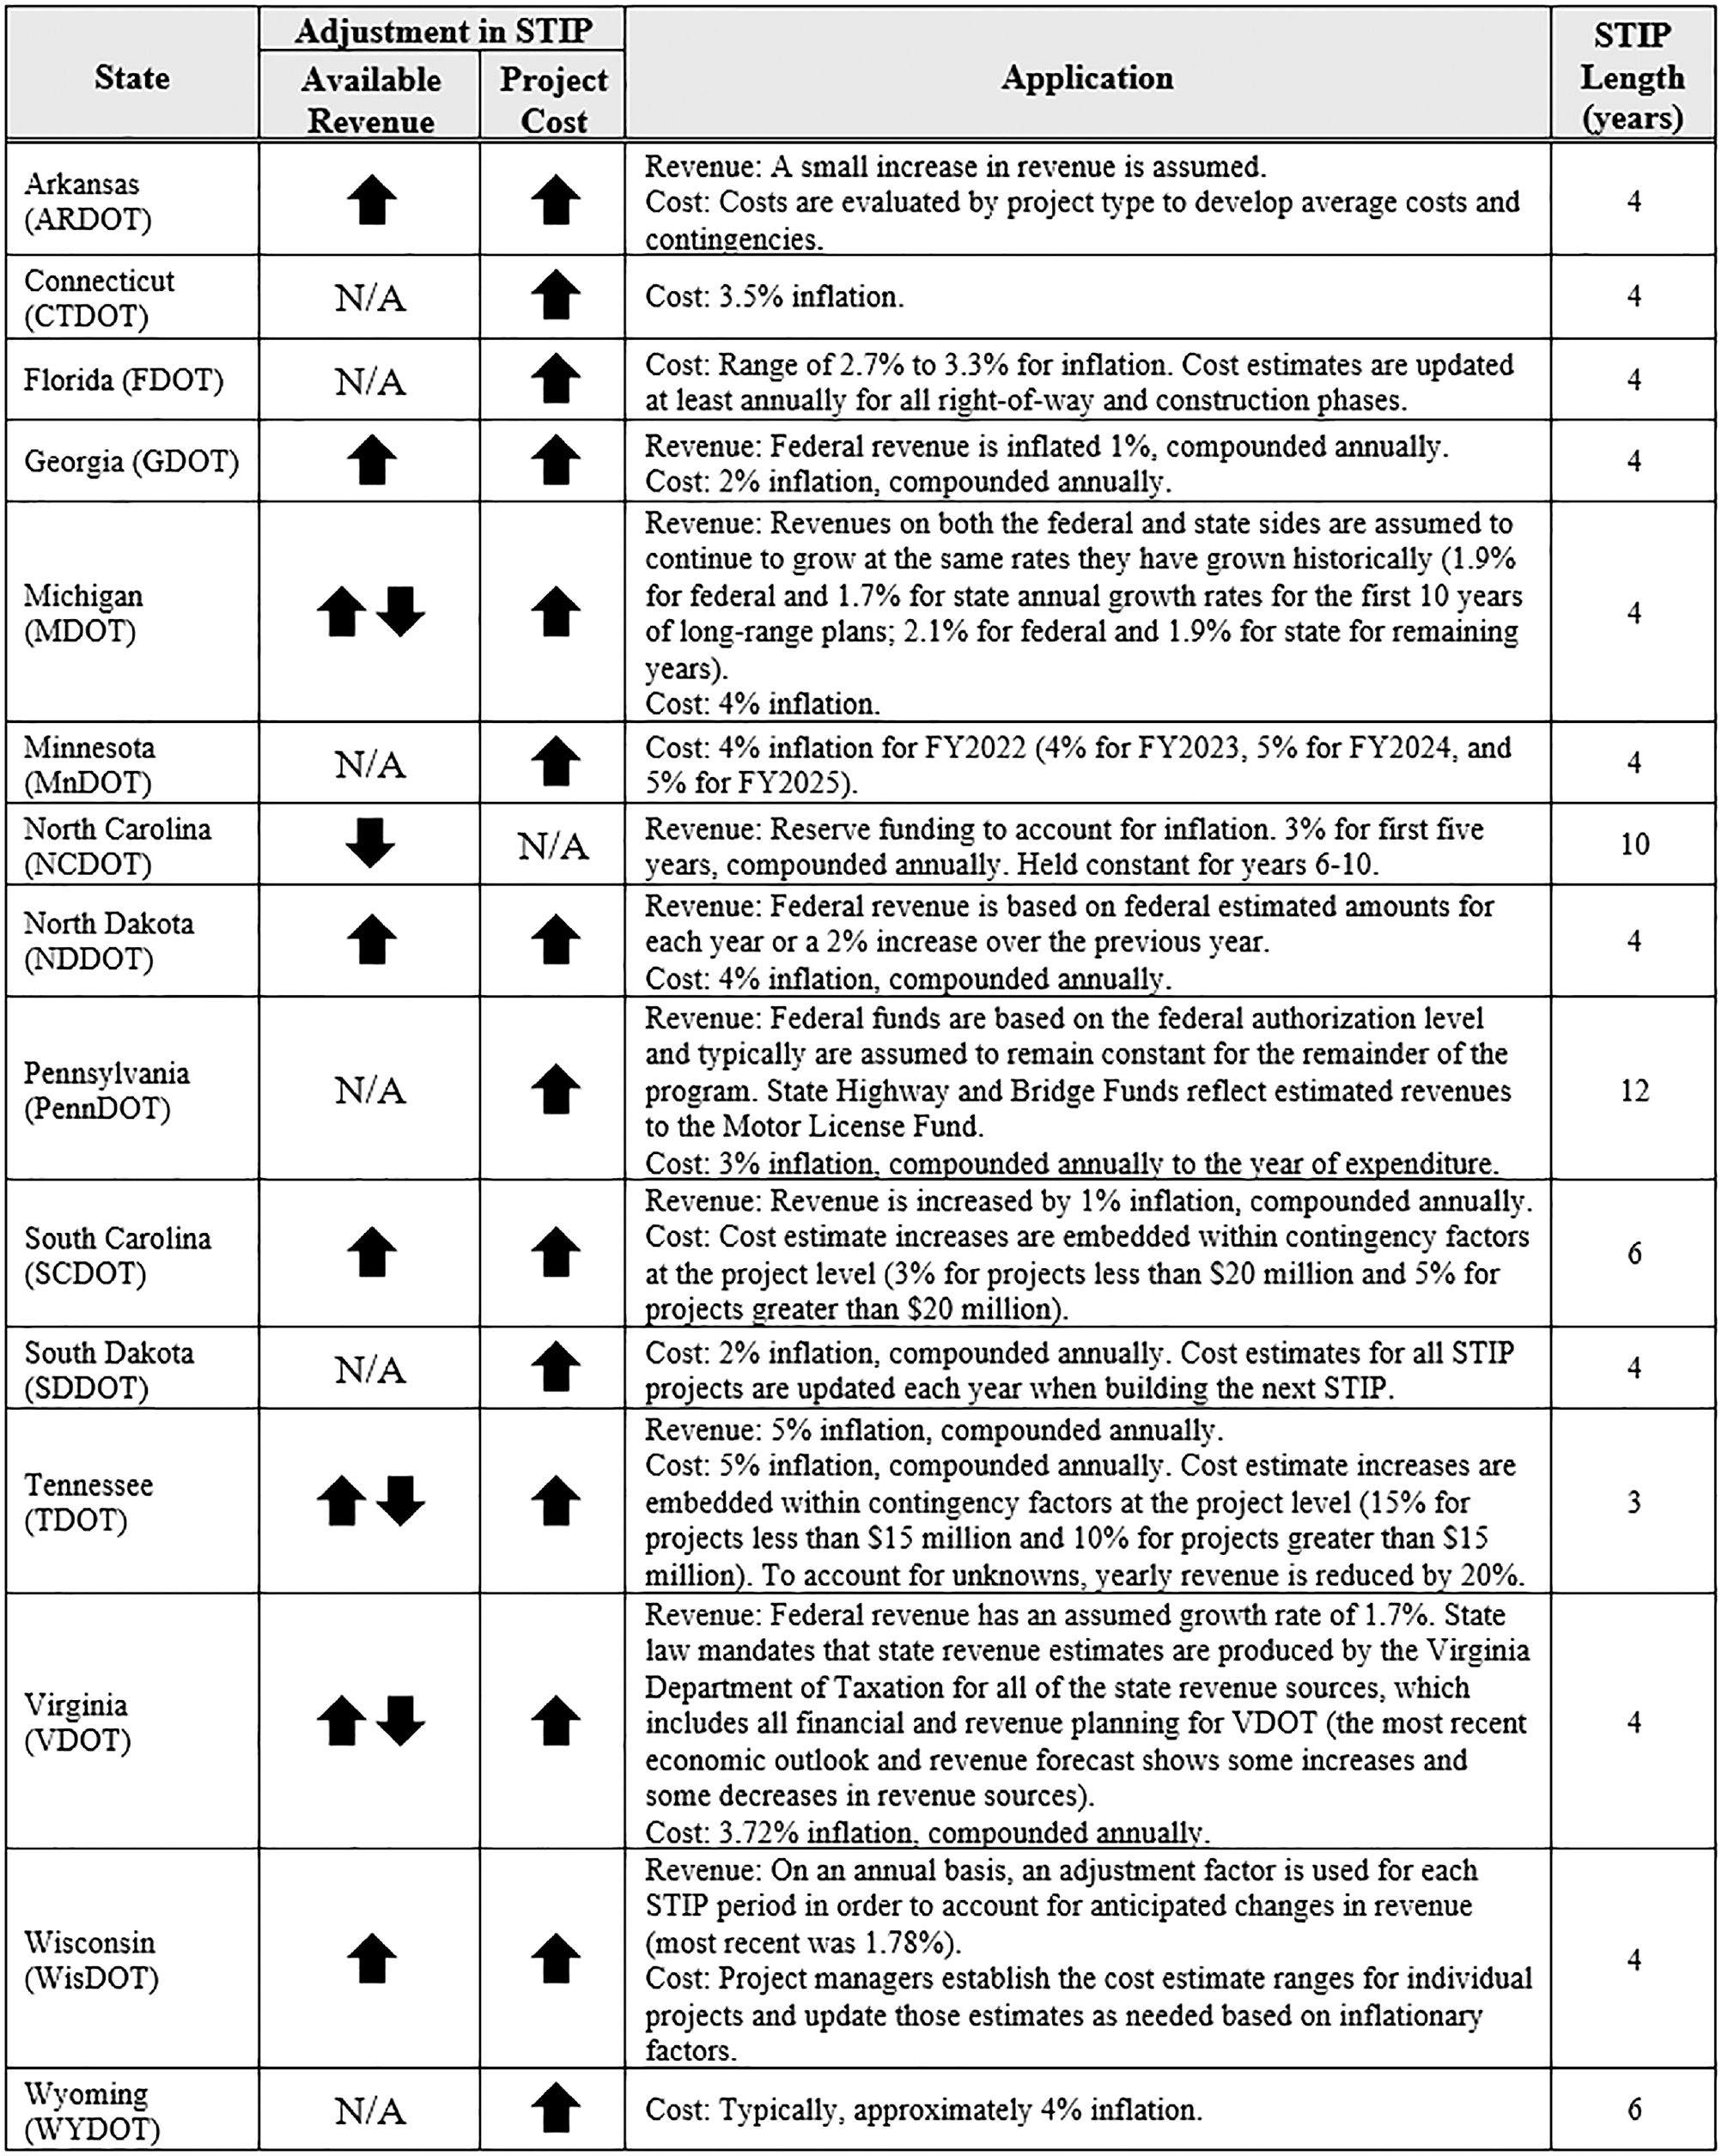
State Transportation Improvement Program (STIP) inflation responses by state Departments of Transportation.
It is worth noting that most state DOTs include inflation of the project cost in the project estimates to the time of bid letting or the year of expenditure. NCDOT accounts for inflation in a unique way compared with the other state agencies that responded to the survey—NCDOT reserves a portion of available funds for programming the STIP to account for inflation. This approach reflects a “funding side” approach as opposed to a “project cost side” approach to managing project portfolios. With a project cost approach, inflation is included in each cost estimate. The survey results indicate that inflation needs to be carefully considered in the estimating process. The current estimating process at NCDOT applies different contingency allowances to each of the three major project components: construction, ROW, and utility relocations.
Conclusion
This study has generated several insights that are beneficial for state DOTs that are assessing or reassessing their strategies for including contingencies and inflation within their STIP. The study reveals that most DOTs apply contingencies to their project estimates during the early stages of project development and maintain some level of contingency at the PS&E stage. The method used to determine contingency allowances also varies by state and by project characteristics. The survey findings revealed that NCDOT accounts for inflation in way that differs from the other state agencies that responded to the survey, in that NCDOT reduces the available funding to account for inflation. Michigan and Tennessee DOTs also have methods for reducing projected revenue forecasts. The survey results indicate that inflation needs to be carefully considered in the estimating process. While the study offers several insights into how different DOTs handle inflation and contingency, it has limitations that must be acknowledged. The small sample size is a major limitation of this study. A comprehensive follow-up study is necessary to increase the sample size. The follow-up study should also categorize different state DOTs by project type, transportation budget, and other factors influencing contingency variability. Additionally, statistical analysis should be utilized (e.g., analysis of variance [ANOVA] analysis) to evaluate trends and uncover differences in practices among different state DOTs. Furthermore, future investigations should evaluate various practices for incorporating contingency into estimating preliminary engineering costs and the necessary adjustments of these estimates to account for inflation. As for forecasting inflation, state DOTs should project values of economic indices (e.g., CPI) using appropriate time series methodologies, such as the auto regressive integrated moving average (ARIMA) method. Inflation considerations in a project cost side funding model are important, and thus the way inflation is determined and when it is introduced will need future study. Lastly, future investigations should assess the consequences or negative effects of state DOTs neglecting to account for inflation costs in project estimates.
Footnotes
Acknowledgements
The research team acknowledges North Carolina Department of Transportation for supporting and funding this project. We extend our thanks to the NCDOT personnel who participated in this research project for their time and hospitality. We are particularly grateful to David Wasserman, Jon Weathersbee, Forrest Dungan, Heather Fulghum, Sarah White, and Jennifer Evans. Without the help of all these individuals, the project could not have been completed in such a successful manner.
Author Contributions
The authors confirm contribution to the paper as follows: study conception and design: E. Jaselskis, D. Findley; data collection: A. Alsharef, D. Findley, T. Dudley, K. Pyo, G. Yang; analysis and interpretation of results: A. Alsharef, D. Findley, E. Jaselskis; draft manuscript preparation: A. Alsharef, D. Findley, E. Jaselskis. All authors reviewed the results and approved the final version of the manuscript.
Declaration of Conflicting Interests
The author(s) declared no potential conflicts of interest with respect to the research, authorship, and/or publication of this article.
Funding
The author(s) disclosed receipt of the following financial support for the research, authorship, and/or publication of this article: This work was supported by the North Carolina Department of Transportation (grant number 2021-21).
