



Abstract
Provision of visual guiding facilities to improve traffic safety is in disarray. This paper proposes a comprehensive system for evaluating the effectiveness of visual guiding facilities in freeway tunnels. Aimed at addressing the current problems, this paper presents an evaluation system based on three key factors: spatial right-of-way, driving human factors, and driving performance. To evaluate the proposed system, data were collected in tunnels under varying conditions during daytime and nighttime, before and after improvement. The evaluation system categorized spatial right-of-way into lateral, longitudinal, and vertical aspects, which mainly depend on the installation of visual guiding facilities. Driving human factors were evaluated based on visual performance, and the installation method of visual facilities focused on sight distance, sight zone, and visual load. Driving performance was also evaluated by considering vehicle operational characteristics, including the maintaining of speed, distance, and lane. The results demonstrated a considerable improvement in the evaluation level of the visual guiding system, achieving Level B compared with traditional improvement schemes during both daytime and nighttime scenarios. This evaluation system could be a valuable guide for managing and designing traffic engineering in tunnels.
The expansion of tunnel mileage has made tunnels a crucial part of road traffic, supporting the balanced growth of the economy. However, traffic crashes in tunnels, particularly rear-end collisions and collisions with fixtures ( 1 ), often a result of the monotonous environment and inadequate visual references ( 2 ), remain significant challenges. In response to energy conservation and emissions reduction efforts, various forms and combinations of visual guiding facilities have been employed in freeway tunnels in China to enhance traffic safety ( 3 , 4 ). However, such schemes, if lacking a scientific basis, cannot effectively fulfill their role in guiding and enhancing the driving environment and may even inadvertently increase optical illusions and driving load. Therefore, a practical and reasonable evaluation of the visual guiding systems used in freeway tunnels is necessary to enhance their effectiveness and facilitate essential redesign.
This study aimed to develop a comprehensive evaluation system for the combination of visual guiding facilities in freeway tunnels. The system, implemented under two environmental conditions, both before and after installation, was validated in relation to the operational status of an actual tunnel.
The purpose of this study was therefore to 1) establish a comprehensive evaluation system for the traffic-related safety of visual guiding systems, and 2) quantify and evaluate the effectiveness of the visual guiding system for driving safety.
Literature Review
Driving Behavior in Tunnels
Exhibiting safe and responsible driving behaviors in tunnels can reduce the probability of crashes and mitigate their severe consequences ( 5 ). Unlike open roads, tunnel environments can result in slower driving speeds and increased lateral deviation (i.e., staying away from tunnel walls) ( 6 , 7 ). The narrower the tunnel shoulder and lane width, the more cautious drivers are in regulating their vehicles’ speed and lateral position ( 8 , 9 ). In the access zone and exit zone, drivers generally maintain a greater distance between their vehicles and the roadside, whereas the opposite is true in the interior zone ( 10 ). Drivers exhibit significant braking behavior before entering tunnels and considerable accelerating behavior after leaving ( 11 ). However, for drivers familiar with the road, the average vehicle speed is significantly higher than for drivers who are unfamiliar with the road ( 12 ). Moreover, a wider lateral clearance can increase vehicle speeds and reduce speed dispersion, resulting in more stable operating speeds, but the lateral clearance should not be too wide ( 13 ).
Application of Traffic Engineering Facilities
Delineators and raised pavement markers (RPMs) are practical facilities that direct drivers’ attention to visual information, alleviating fatigue, and aiding in accurate speed perception ( 14 ). Additionally, deceleration markings ( 15 ) and edge markings ( 16 ) contribute to enhanced speed perception and enable drivers to maintain better control over their speed. The type of visual pattern and texture on tunnel sidewalls can significantly affect speed perception ( 17 ), driving behaviors ( 18 ), and heart rate ( 19 ). Light-colored tunnel sidewalls are more significant than bright lighting to keep drivers focused on the road ahead ( 20 ). Implementing retroreflective rings, which have increasingly been used in China’s tunnels in recent years, not only enhances drivers’ accurate perception of curvature ( 21 ) but also assists them in maintaining better lateral control over their vehicles ( 22 ). The frequency of such facilities in tunnels also affects drivers’ speed perception. However, it is essential to note that high-frequency implementation of facilities can lead to overestimating the current speed, whereas low-frequency may result in underestimations ( 17 ).
Evaluation of Traffic Safety
Research on road tunnel safety mainly focuses on driving safety, the operating environment, and comprehensive evaluations. Driving safety in tunnels can be evaluated based on visual search stability using Shannon’s entropy ( 23 ). Additionally, evaluations using the fusion model of pupil diameter, fixation, and heart rate has shown promising results in effectively improving tunnel safety ( 24 , 25 ). The traffic-related safety of tunnel groups can be comprehensively evaluated based on the analytic hierarchy process and entropy weight method according to the roads, traffic operation, traffic engineering facilities, and weather ( 26 ). Applying the Bayesian probabilistic network model, VISSIM, and extension matter-element method for comprehensive evaluation of tunnel traffic safety has proven effective ( 22 , 27 , 28 ). In addition to the conventional fixation, saccade, and pupil area, indicators for evaluating visual load in tunnels now include the maximum transient vibration value of pupil area ( 29 ), the speed of pupil area change ( 30 ), and the equivalent duration of visual oscillation ( 31 ). These indicators offer valuable insights into evaluating the impact of visual load on drivers in tunnel environments. The intelligent recognition algorithms based on convolutional neural networks ( 32 ) have also been applied in the evaluation of traffic safety in tunnels ( 33 ).
Evaluation Indicators
Strategic deployment of visual guiding systems in freeway tunnels can enhance the driving environment ( 34 ). This, in turn, can improve drivers’ perception of traffic information and reduce the difficulty of controlling vehicles. However, current evaluation methods for visual guiding systems only analyze single aspects and are not therefore suitable for a comprehensive evaluation. This study proposes a method that affords a comprehensive evaluation of the visual guiding system in freeway tunnels to address this limitation, utilizing first-level indicators (L-1) for spatial right-of-way, driving human factors, and driving performance. These first-level indicators are further divided into second-level (L-2) and third-level indicators (L-3).
Spatial right-of-way is crucial, serving as the foundation for driving safety in tunnels. The clarity and definiteness of spatial right-of-way directly influence driving human factors–related perceptions that eventually manifest in driving performance. Figure 1 illustrates the comprehensive evaluation system for traffic safety in freeway tunnels concerning the visual guiding system.

Evaluation system.
Each evaluation indicator is classified into five levels based on the degree of compliance: A, B, C, D, and E, representing excellent, good, medium, pass, and poor, respectively. The corresponding score ranges are as follows: [0.9, 1] for A, [0.8, 0.9) for B, [0.7, 0.8) for C, [0.6, 0.7) for D, and [0, 0.6) for E.
Spatial Right-of-Way
Existing studies show that the driving environment has a great impact on driving behaviors and traffic safety ( 35 ). Right-of-way is the fundamental guarantee for traffic operation and safety ( 36 ). The spatial right-of-way for road tunnels proposed in this paper is primarily categorized into lateral-, longitudinal-, and vertical right-of-way ( 37 , 38 ). These correspond to the lateral width, longitudinal distance, and vertical height that vehicles can reasonably pass, as depicted in Figure 2.
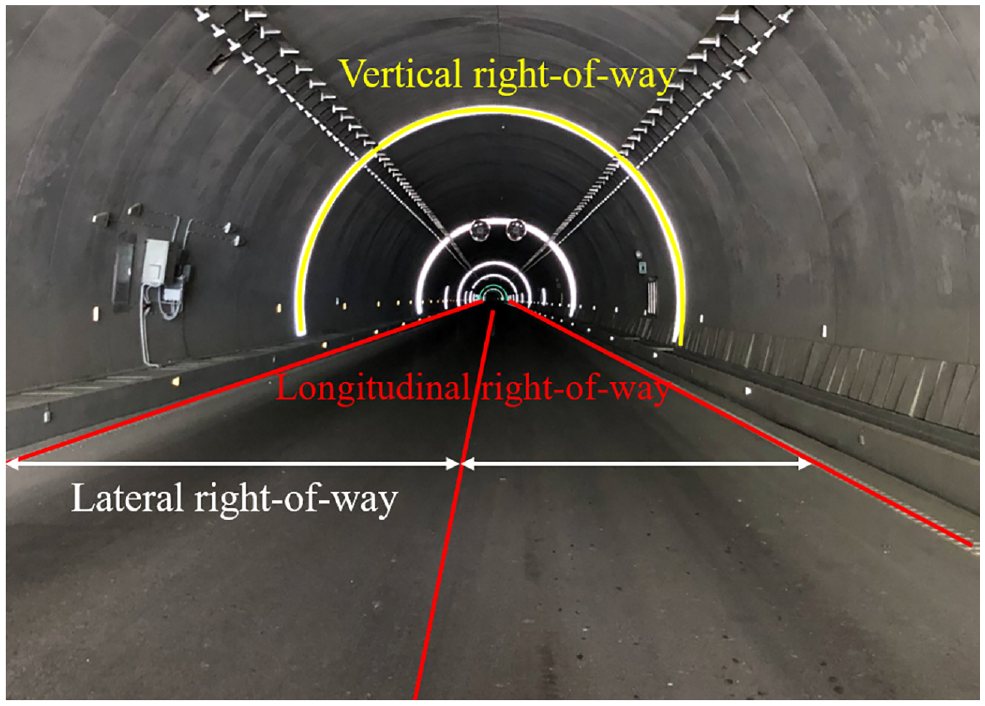
Classification of spatial right-of-way.
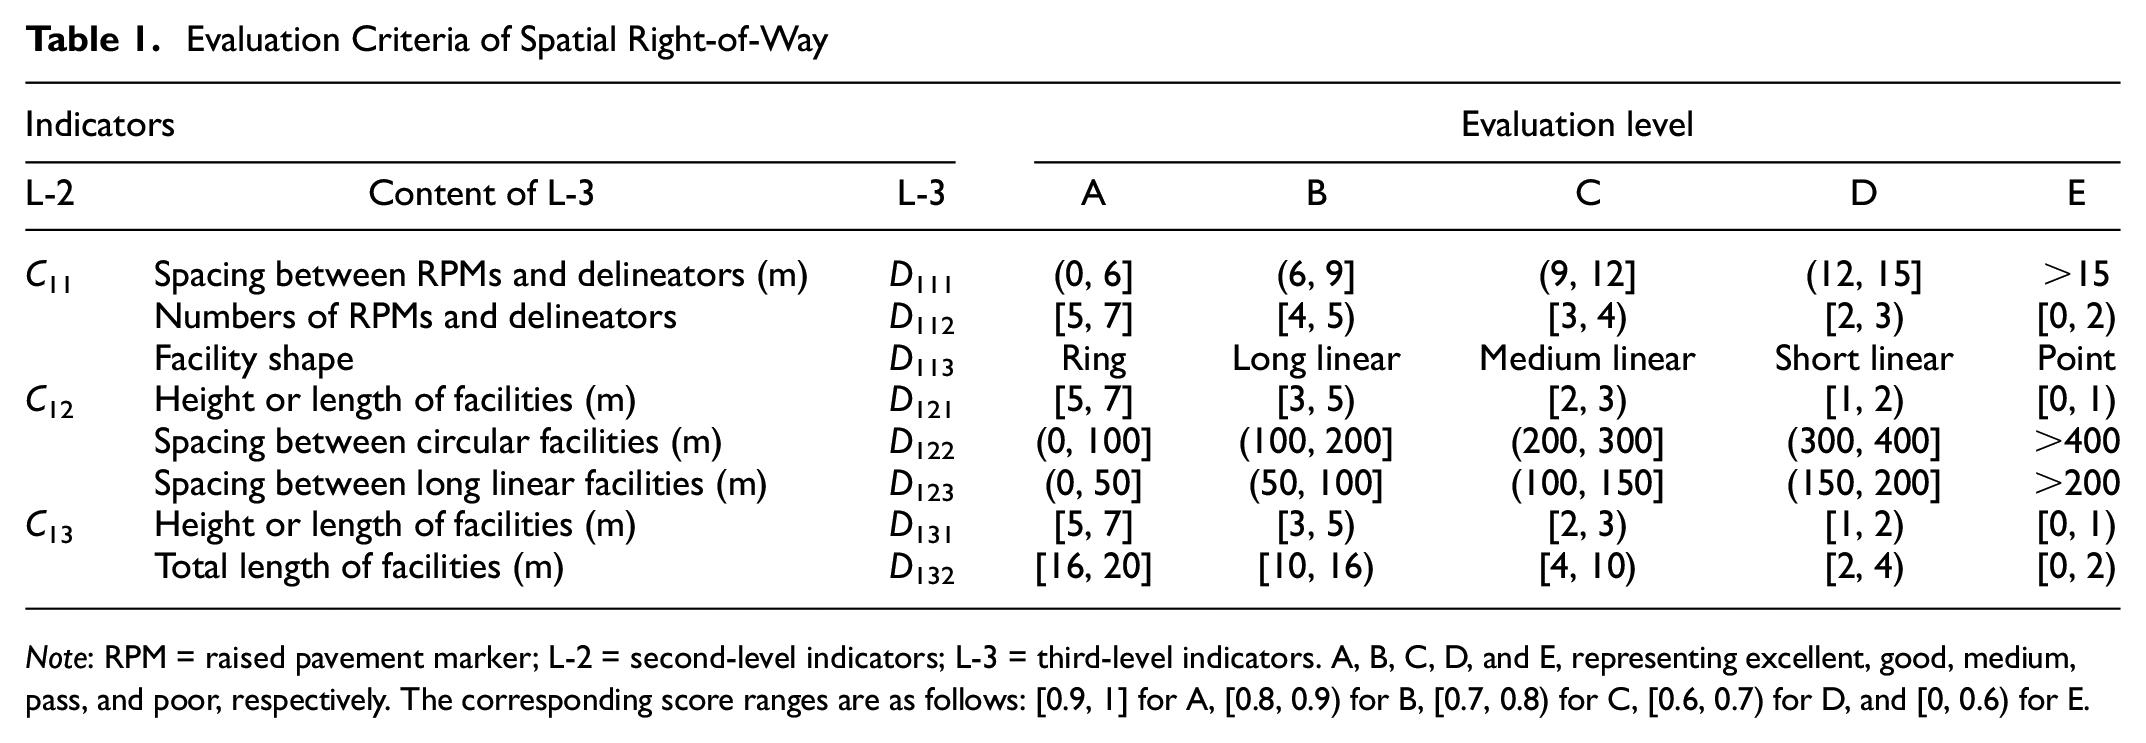
Alignments and tunnel structure cannot be changed, therefore, verifying the actual layout of traffic facilities was necessary. The evaluation level of spatial right-of-way primarily depends on the arrangement of traffic engineering facilities. The evaluation criteria for various indicators of spatial right-of-way, based on their actual application effect, are presented in Table 1.
Evaluation Criteria of Spatial Right-of-Way
Note: RPM = raised pavement marker; L-2 = second-level indicators; L-3 = third-level indicators. A, B, C, D, and E, representing excellent, good, medium, pass, and poor, respectively. The corresponding score ranges are as follows: [0.9, 1] for A, [0.8, 0.9) for B, [0.7, 0.8) for C, [0.6, 0.7) for D, and [0, 0.6) for E.
The L-3 indicators in the evaluation criteria for spatial right-of-way pertain to evaluating the setting methods of the visual guiding facilities. An investigation of these facilities can be conducted in the tunnel being evaluated, mainly involving information about the type, spacing, and length of the facilities.
“Facility shape” in Table 1 is represented as follows: ring refers to a retroreflective ring that presents a circular shape; long linear refers to facilities such as vetical retroreflective stripes and belt lines with longer lengths; medium linear refers to facilities such as vetical retroreflective stripes and tubular markers with medium lengths; short linear refers to facilities such as trapezoidal delineators with shorter lengths; and point refers to facilities such as RPMs and rectangular delineators with relatively small dimensions. There is a corresponding relationship between the types of visual guiding facilities and the evaluation scores of D121, D131, and D132. If a retroreflective ring is installed, the score for length is higher, whereas point-shaped facilities have the opposite trend.
Lateral Right-of-Way
In highway tunnels, the lateral right-of-way is mainly determined by local reference objects such as markings (road edge markings and lane markings), RPMs, delineators, curbs, and sidewalks. Because of insufficient maintenance and low tunnel lighting, drivers often struggle to see the markings and curbs. As a result, ensuring better lateral right-of-way in tunnels has become essential to enabling drivers to better maintain lane-keeping.
The evaluation criteria outlined in Table 1 are explained as follows:
(1) The facilities that reflect markings and sidewalk edges in traffic engineering facilities are RPMs and delineators. The visibility of markings and sidewalk edges is not only related to their characteristics, but also to the setting number and spacing of point and short linear facilities. The greater the number of RPMs and delineators set on cross sections, and the smaller the spacing between them, the better the drivers’ lateral right-of-way.
(2) According to Chinese specifications, RPMs and delineators should be set at 6 to 15 m spacing. A spacing of 15 m meets the minimum requirements exactly, and the remaining intervals are distributed equally. If the number of RPMs and delineators is 7, this indicates the presence of RPMs on both edge lines and the centerline in a one-way, two-lane tunnel, while delineators are set on the sidewalks and sidewalls.
(3) D113 is designed to reflect the lateral right-of-way of the clear distance. Larger-sized facilities with a larger visible retroreflective area are better at reflecting the lateral clearance of tunnels. Drivers can confirm the distance with roadside in a more timely manner, and the lateral right-of-way is better ( 39 ).
(4) Each indicator is weighted equally, accounting for 1/3 of the total weight. D113 considers the facility with the largest shape and takes its value as the middle value of the corresponding interval.
Longitudinal Right-of-Way
Sufficient longitudinal right-of-way in tunnels provides drivers with ample sight distance to make timely judgments and decisions. Larger-sized retroreflective facilities provide more substantial visibility, enabling drivers to observe the traffic environment in tunnels from a longer distance. Long linear- and circular facilities offer good perception of distance and direction ( 39 ). The spacing between these facilities also affects drivers’ perception of distance and direction.
The evaluation criteria in Table 1 are explained as follows:
(1) The height of visual guiding facilities refers to the height or length of a facility with the giant shape. Among these, 7 m represents the centerline height of the tunnel, which can be adjusted based on the actual situation; 5 m is the clearance height; 3 m is the height of the small retroreflective rings; 2 m is the minimum height of the vertical retroreflective stripes; and 1 m is the height of the tubular markers.
(2) The maximum spacing of circular and long linear facilities in practical applications is 400 and 200 m, respectively, which adequately meets visual needs. The spacing of other levels is distributed in equal proportion.
(3) Indicator D121 in C12 carries a weight of 50%, and the other 50% is evenly distributed.
Vertical Right-of-Way
The vertical right-of-way in tunnels is closely related to the tunnel’s contours. A better perception of the tunnel’s spatial contours allows for clarity of construction clearance to drivers. This, in turn, ensures sufficient perception of lateral distance and clearance height. More extensive, longer retroreflective facilities enable drivers to observe information related to lateral contour, longitudinal lanes, and sidewalks. The longer the length of the visual guiding facilities, the better drivers’ overall perception of direction.
The evaluation criteria in Table 1 are explained as follows:
(1) The total length of the visual guiding facilities represents the sum of the vertical lengths of the largest-shaped facility at a particular cross section. If both sides of the vertical retroreflective stripes are set, the calculation should consider the sum of the lengths of the two vertical retroreflective stripes. For example, the inner contour length of a two-lane tunnel with a design speed of 80 km/h is 20 m; the total length of a small retroreflective ring is 16 m; the total length of two vertical retroreflective stripes with a length of 5 m is 10 m; the total length of two vertical retroreflective stripes with a length of 2 m is 4 m; and the total length of two tubular markers with a length of 1 m is 2 m.
(2) Each of the two indicators carries a weight of 50%.
Driving Human Factors
Owing to the limited sight distance and sight zone in tunnels, drivers are susceptible to visual impairments and judgment errors ( 40 ). To address this issue effectively, it is essential to integrate various traffic safety facilities carefully. This integration should ensure a safe sight distance and a reasonable sight zone while controlling drivers’ pupil changes and load within an acceptable range. Furthermore, the abrupt environmental transitions in tunnels can pose challenges for drivers in detecting vehicles and roadside obstacles, increasing the likelihood of crashes. Therefore, a comprehensive evaluation of driving human factors based on sight distance, -zone, and visual load is imperative.
The sight distance and visual load indicators in driving performance can be accessed using an eye tracker.
Sight Distance
Ensuring drivers have adequate sight distance is crucial for facilitating the prompt perceiving of important information and preventing traffic crashes ( 41 ). This study established rigorous standards, with the highest requirement to meet the decision sight distance (i.e., the distance needed for a driver to detect an unexpected or otherwise difficult-to-perceive information source or condition in a roadway environment that may be visually cluttered, recognize the condition or its potential threat, select an appropriate speed and path, and initiate and complete complex maneuvers (42)) under the most complex conditions and the passing grade necessary to achieve the stopping sight distance. Sight distance data can be calculated using the coordinates of the gaze points and the gaze angle.
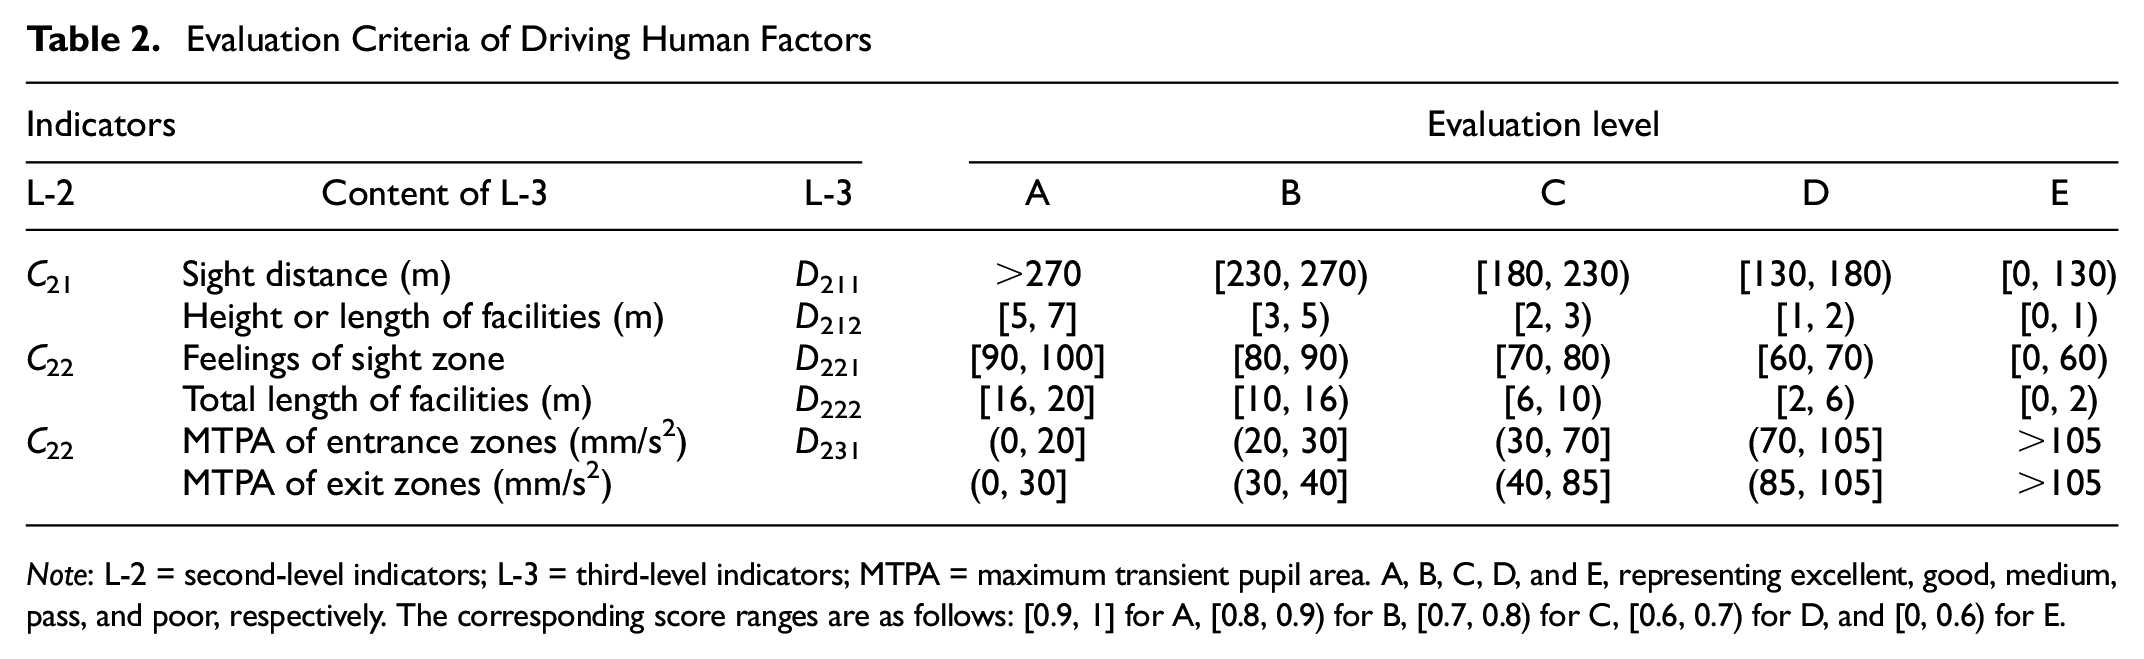
The evaluation criteria in Table 2 are explained as follows:
Evaluation Criteria of Driving Human Factors
Note: L-2 = second-level indicators; L-3 = third-level indicators; MTPA = maximum transient pupil area. A, B, C, D, and E, representing excellent, good, medium, pass, and poor, respectively. The corresponding score ranges are as follows: [0.9, 1] for A, [0.8, 0.9) for B, [0.7, 0.8) for C, [0.6, 0.7) for D, and [0, 0.6) for E.
(1) According to the regulations of A Policy on Geometric Design of Highways and Streets, the calculation of decision sight distance is divided into five situations, from A to E, corresponding to different maneuvering times ( 42 ). For Situation D at a design speed of 80 km/h, the decision sight distance value is 270 m, whereas for Situation C, it is 230 m. The stopping sight distance value at a design speed of 80 km/h is 130 m, representing the most basic requirement. An intermediate value of 180 m lies between 230 and 130 m.
(2) The more extensive a facility’s length, the larger its visible retroreflective area, enabling drivers to recognize the extended linear retroreflective facilities at greater distances. Therefore, the longer the length of the facilities, the farther the drivers’ sight distance.
(3) The two indicators each carries a weight of 50%.
Sight Zone
The sight zone refers to the breadth of the area in front of drivers that they can see while driving, which can be divided into horizontal and vertical sight zones. The operation of vehicles mostly depends on external environmental information. Reasonable sight distance and sight zones are essential prerequisites for drivers to obtain crucial visual guiding information, perceive obstacles ahead in a timely manner, and accurately judge driving direction and road alignment.
However, because of experimental equipment limitations and the process’s complexity, quantitatively measuring the sight zone under existing conditions takes much work. Therefore, the evaluation of the sight zone is based on drivers’ subjective perceptions and the overall length of the facilities, as presented in Table 2, with each indicator carrying a weight of 50%. Subjective evaluations of sight zones can be conducted by designing a questionnaire applicable to the tunnel under evaluation.
Visual Load
The visual load in freeway tunnels is primarily concentrated in the entrance and exit zones. To evaluate drivers’ visual load, the maximum transient velocity value of pupil area (MTPA) is utilized ( 43 ).
The calculation method of MTPA is shown in Equations 1 and 2,

where
V ω(t) is instantaneous frequency-weighted acceleration of pupil area (mm2/s);
τ is integration time for running averaging (s);
t is time (integration variable) (s); and
t 0 is time of observation (instantaneous time).
The MTPA value is used to evaluate the drivers’ visual load, as shown in Equation 2. When applied to vibrations that have a shorter duration than τ, the resulting error is small. The drivers’ visual vibration time in entrance and exit zones of tunnels is <0.5 s ( 43 ).

Referring to the evaluation of vibration comfort in Mechanical Vibration and Shock (ISO 2631-1-1997/AMD 1:2010),
Owing to the inconsistent form of lighting transition at the entrance and exit zones of freeway tunnels, the visual load level of drivers also differs. The evaluation criteria for visual load are presented in Table 2. Because changes in pupil area are concentrated in the entrance and exit zones, visual load evaluations only focused on these zones of the tunnel. The standards for entrance and exit zones should be carried out simultaneously, with a weight of 50% each.
Calculating the MTPA in visual load involves obtaining real-time driver pupil area data through an eye tracker.
Driving Performance
Driving performance is the final set of indicators for evaluating driving stability and safety, encompassing crucial control factors such as vehicle speed, headway distance, lateral deviation. Several studies have analyzed these indicators because of their ease of collection in driving simulations and field tests.
Drivers are required to effectively control vehicle speed, maintain an appropriate distance between vehicles, and make proactive decisions about driving paths. Specifically, drivers must maintain a state of control over their vehicles and manage their relationship with the surrounding vehicles and the environment. Considering that drivers in tunnels should not make frequent lane changes and actively choose paths, evaluating driving performance in freeway tunnels primarily focuses on driving tasks like speed, headway, and lane-keeping.
Driving speed performance can be collected using radar. Space headway and time headway can be estimated through videos. Lateral deviation can be obtained through devices such as Mobileye and binocular cameras, or by drawing small segmented lines on the road surface and then shooting a video to estimate the position of the vehicle.
Speed
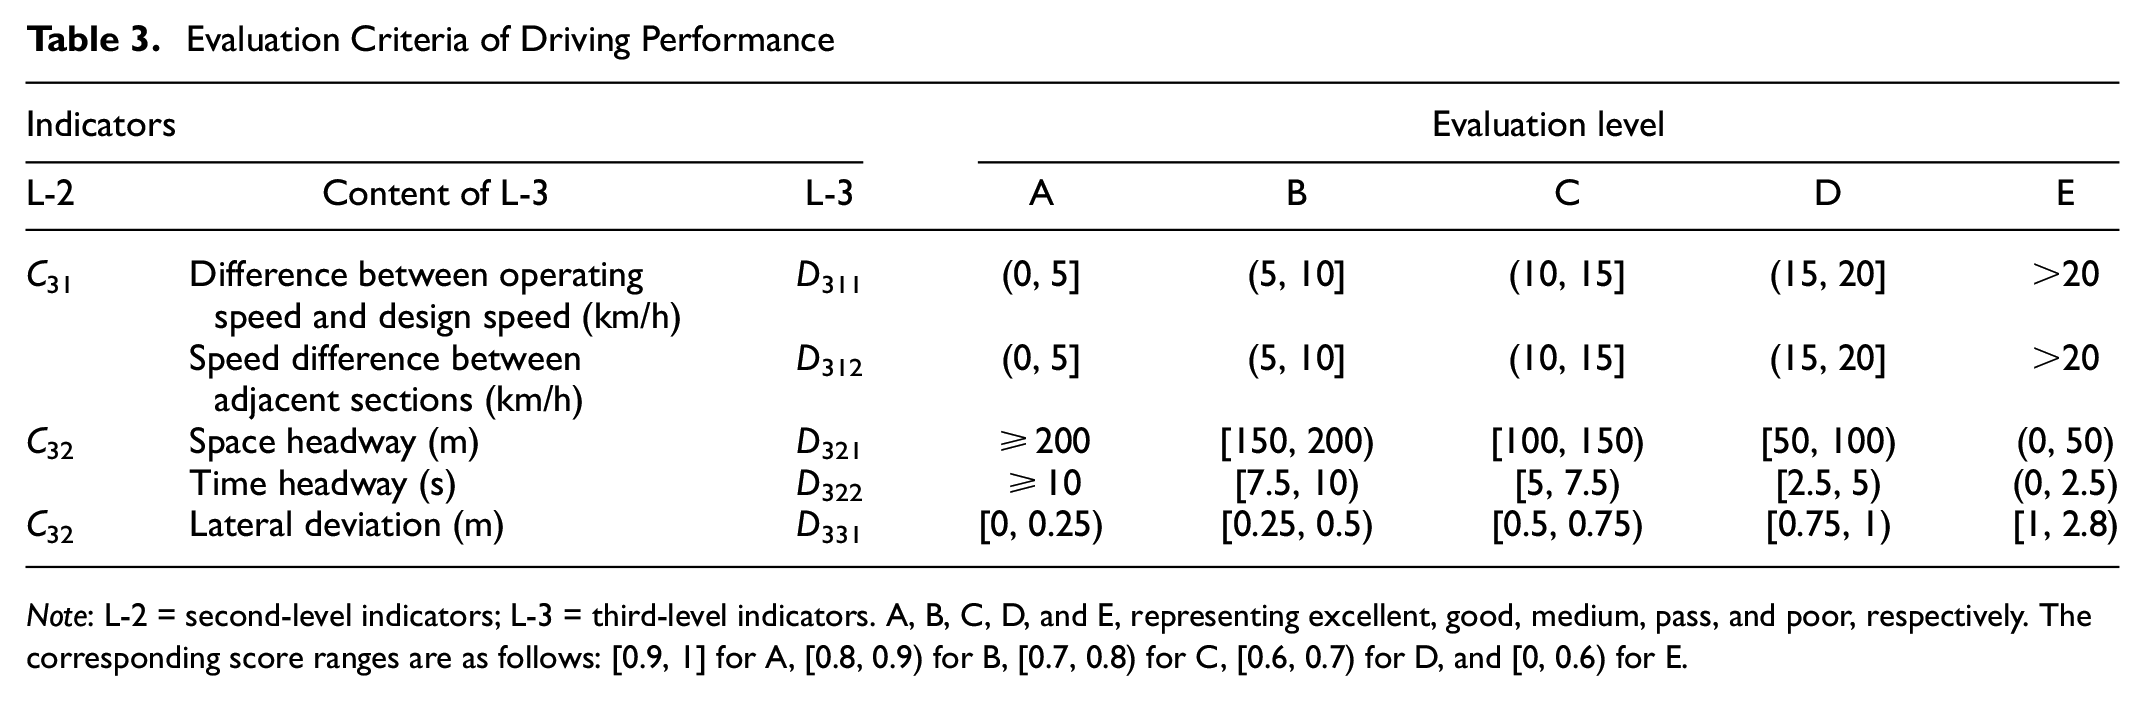
The more significant the difference between operating and average vehicle speeds, the higher the crash rate. Moreover, the greater the speed gradient, the higher the crash rate will be ( 44 ). The difference in speed limit between the inside and outside of tunnels is generally 20 km/h, which may result in a significant difference in the speed of vehicles before entering the tunnel. The monotonous environment inside the tunnel may also result in drivers unconsciously reducing or increasing their speed. Thus, a reasonable evaluation of speed difference or stability can indirectly reflect the level of traffic safety. This evaluation can be based on the difference between operating speed and design speed, as well as the difference in operating speed of adjacent tunnel sections. Traditionally, speed evaluation has been based on the Safety Evaluation Specification for Highway Projects (JTG B05-2015), using thresholds of 0 to 10 km/h, 10 to 20 km/h, and ≥20 km/h. However, this standard may not thoroughly and meticulously capture the changing characteristics of vehicle speed. As a result, this study proposes alternative evaluation criteria for maintaining vehicle speed, as presented in Table 3.
Evaluation Criteria of Driving Performance
Note: L-2 = second-level indicators; L-3 = third-level indicators. A, B, C, D, and E, representing excellent, good, medium, pass, and poor, respectively. The corresponding score ranges are as follows: [0.9, 1] for A, [0.8, 0.9) for B, [0.7, 0.8) for C, [0.6, 0.7) for D, and [0, 0.6) for E.
The evaluation criteria in Table 3 are explained as follows:
(1) A speed difference of 20 km/h is commonly used to indicate noncompliance with the standard; (2) The remaining grade intervals are divided equally at intervals of 5 km/h; and
(3) The weights of D311 and D312 each account for 50%.
Headway Distance
The distance between vehicles is closely related to driving habits and traffic flow, reflects the characteristic of maintaining a safe distance between the current and preceding vehicle, which in turn reflects the level of traffic safety.
Rear-end collisions are the most prevalent type of crash, therefore effectively maintaining a safe distance can significantly enhance driving safety. China has established specific regulations for space headway: for vehicles exceeding 100 km/h, a distance of more than 100 m should be maintained from the vehicle in front in the same lane. The minimum distance for vehicle speeds below 100 km/h is 50 m. Building on these regulations, this study proposed evaluation criteria for maintaining distance, as presented in Table 3.
The evaluation criteria in Table 3 are explained as follows:
(1) A space headway of 200 m meets the stopping sight distance under the design speed of 120 km/h; 50 m represents the minimum space headway. The level interval is divided into segments based on integer multiples of 50 m;
(2) A rough calculation of the time headway between vehicles corresponding to a speed of 80 km/h; and
(3) The weights of D321 and D322 each account for 50%.
Lateral Deviation
Lateral deviation refers to the distance at which the centerline of the vehicle deviates from the centerline of the lane during driving, which reflects the drivers’ attempts to remain within the lane. Utilizing lateral deviation data under a lane width of 3.75 m, this study proposed evaluation criteria for lane maintenance, presented in Table 3. The evaluation took the average value of all the lanes because freeways can consist of multiple lanes.
The evaluation criteria in Table 3 are explained as follows:
(1) 1 m represents the deviation value when a car with a width of 1.8 m slightly departs from the lane while driving on a lane of width of 3.75 m, whereas 2.8 m represents the deviation value when the car completely departs from the lane. The remaining level intervals are evenly divided.
(2) The lateral deviation values in Table 3 represents the absolute value of left- or right lateral deviations.
Results
Methodology
Scenarios
The tunnel selected for this study was the Shuangshan tunnel located in Guizhou Province. It is one of the first tunnels in China to install visual guiding systems. The tunnel was opened in September 2018. It has various types of facilities, making it representative of a certain type of tunnel. It is a divided one-way, two-lane road of length 1,240 m. The speed limit inside the tunnel is 80 km/h, whereas it is 100 km/h outside the tunnel. During the tests, the test vehicle maintained a free-flowing speed because of the low volume of vehicles on the road. The tests were conducted during both daytime and nighttime hours, all on fine days.
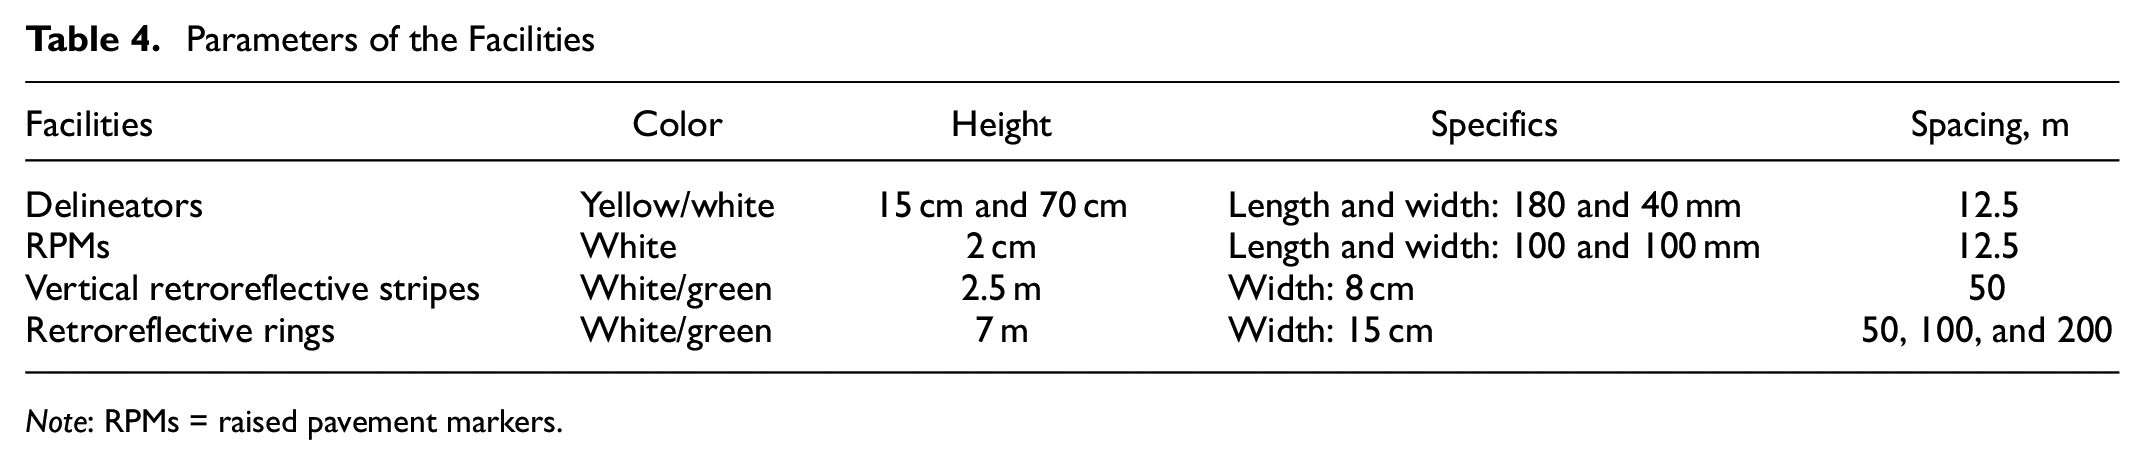
The test scenarios were divided into two different tunnel environments: conventional facilities installed (S-1) and additional linear visual guiding facilities installed (S-2), as detailed in Table 4. The tunnel environment before and after improvement is depicted in Figure 3.
Parameters of the Facilities
Note: RPMs = raised pavement markers.

Test tunnels: (a) before improvement and (b) after improvement.
The improved tunnel environment now includes added linear visual guiding facilities (vertical retroreflective stripes and retroreflective rings). A schematic representation of Scenario 2 is provided in Figure 4.
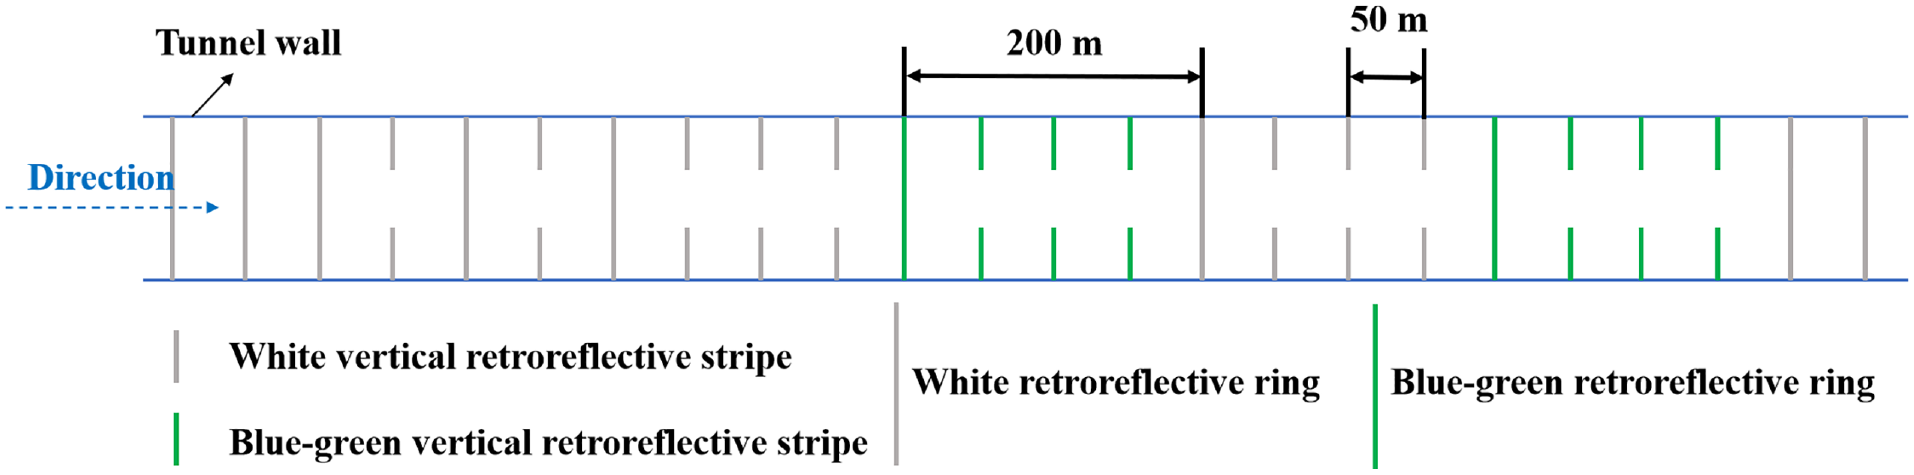
Layout of visual guiding facilities in Scenario 2.
Data Collection
The data collection process was divided into three parts: 1) investigation of facilities in the tunnel; 2) data collection of operational characteristics; and 3) data collection of drivers’ eye movement.
The investigation of facilities in the tunnel mainly collected information on the type, spacing, and height of the facilities.
A mobile radar speedometer was employed to collect running speed data in the tunnel at different zones, as depicted in Figure 5. The collection location for lateral deviation data coincided with the vehicle speed collection points, and the method of data collection is shown in Figure 6. Specifically, large 50-cm and small 10-cm intervals were marked on the pavement, and a camera was used to record videos. After the tests, the position of the rear wheel was noted, the position of the vehicle’s centerline was determined, and the lateral deviation was subsequently calculated. The carriageway width was approximately 3.75 m, and the vehicle width was about 1.8 m.
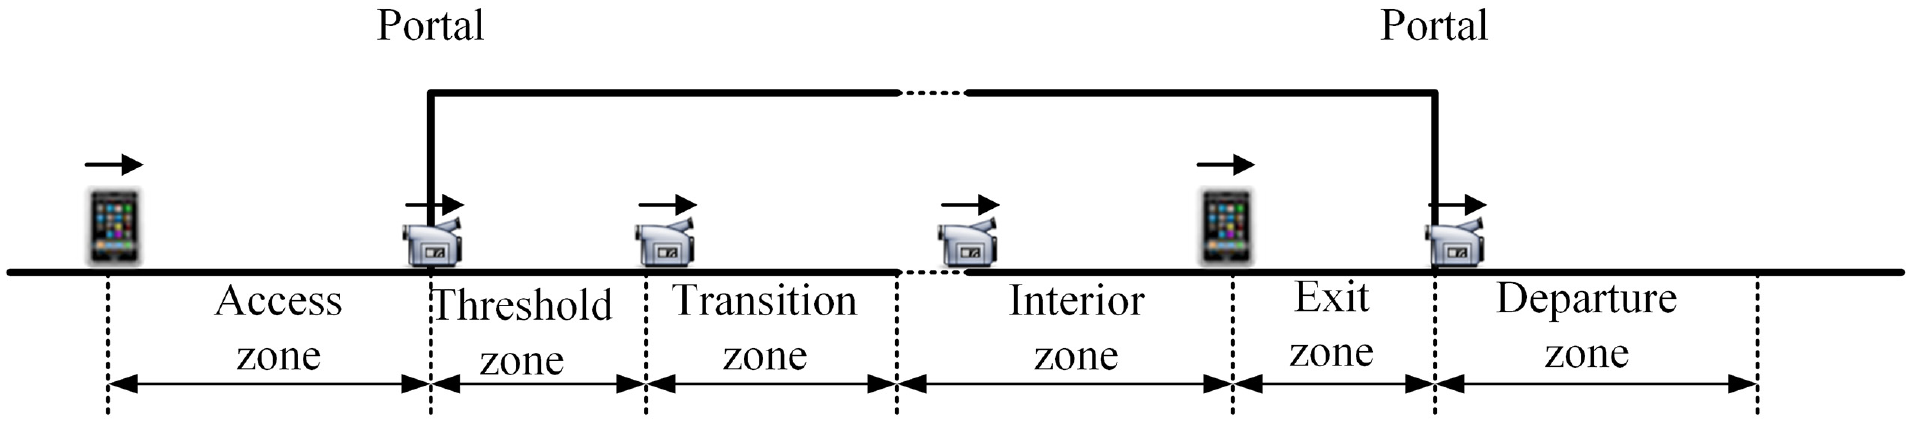
Collection locations for vehicle speed and lateral deviation.

Data collection of lateral deviation.
Collecting data on eye movement is essential. All participants in the tests met the requirements, resulting in a total of 31 participants. The gender ratio consisted of 10 females and 21 males, mirroring the distribution of Chinese drivers at the time. Age and driving experience varied, with participants ranging from 25 to 57 years old and possessing driving experience of 4 to 18 years. On average, participants had driven a total mileage of 20,6366 km. Before the tests, participants were instructed to ensure they were adequately rested. Their participation order was randomized, and each participant was required to conduct a minimum of two valid round-trip tests.
Figure 7 illustrates the test equipment used for data collection. The eye data collection and postprocessing were carried out using the equipped D-Lab software. The test vehicle utilized for the tests was an automatic Buick GL8.
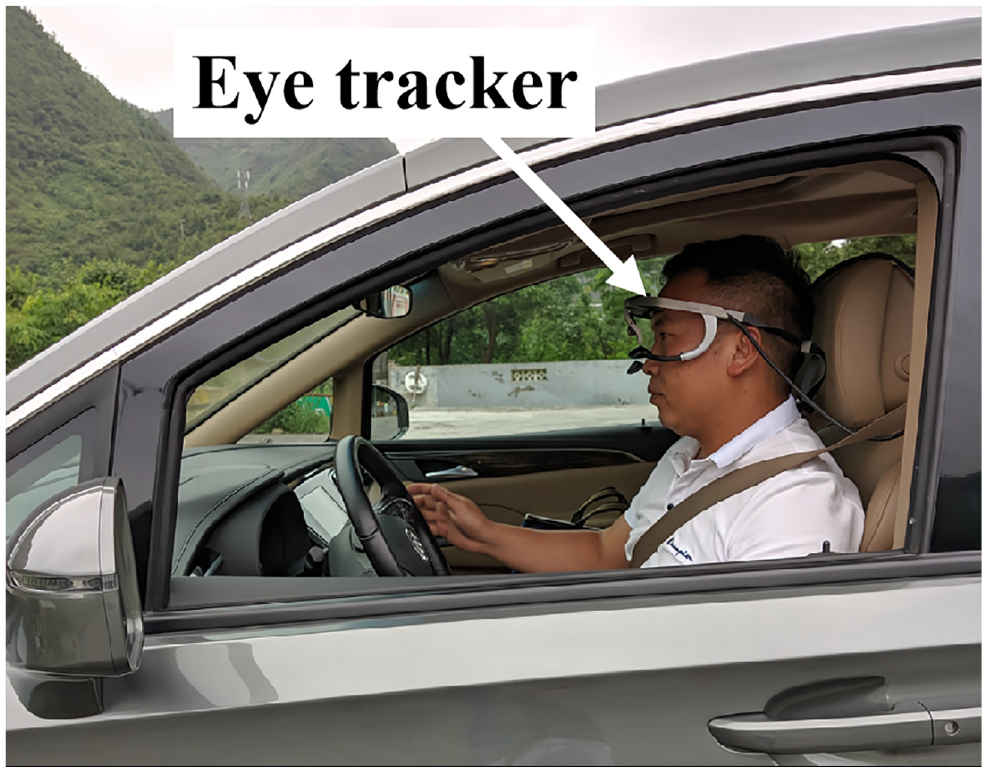
Eye tracker and vehicle.
Application of Evaluation System
Analysis of Evaluation Indicators
Based on the evaluation indicators and the field test data from the current state of the test tunnel, a comprehensive analysis of the evaluation indicators was conducted. The study considered different tunnel zones, with equal weights assigned to indicators for each zone. Because of varying demands from drivers in different tunnel zones, some tunnels even deactivating enhanced lighting (threshold, transition, and exit zones) during nighttime, the spacing of many tunnel facilities is designed based on lighting zones ( 4 , 45 , 46 ). Therefore, this study assigned the same calculation weights for nighttime as during the daytime.
1) Spatial Right-of-Way
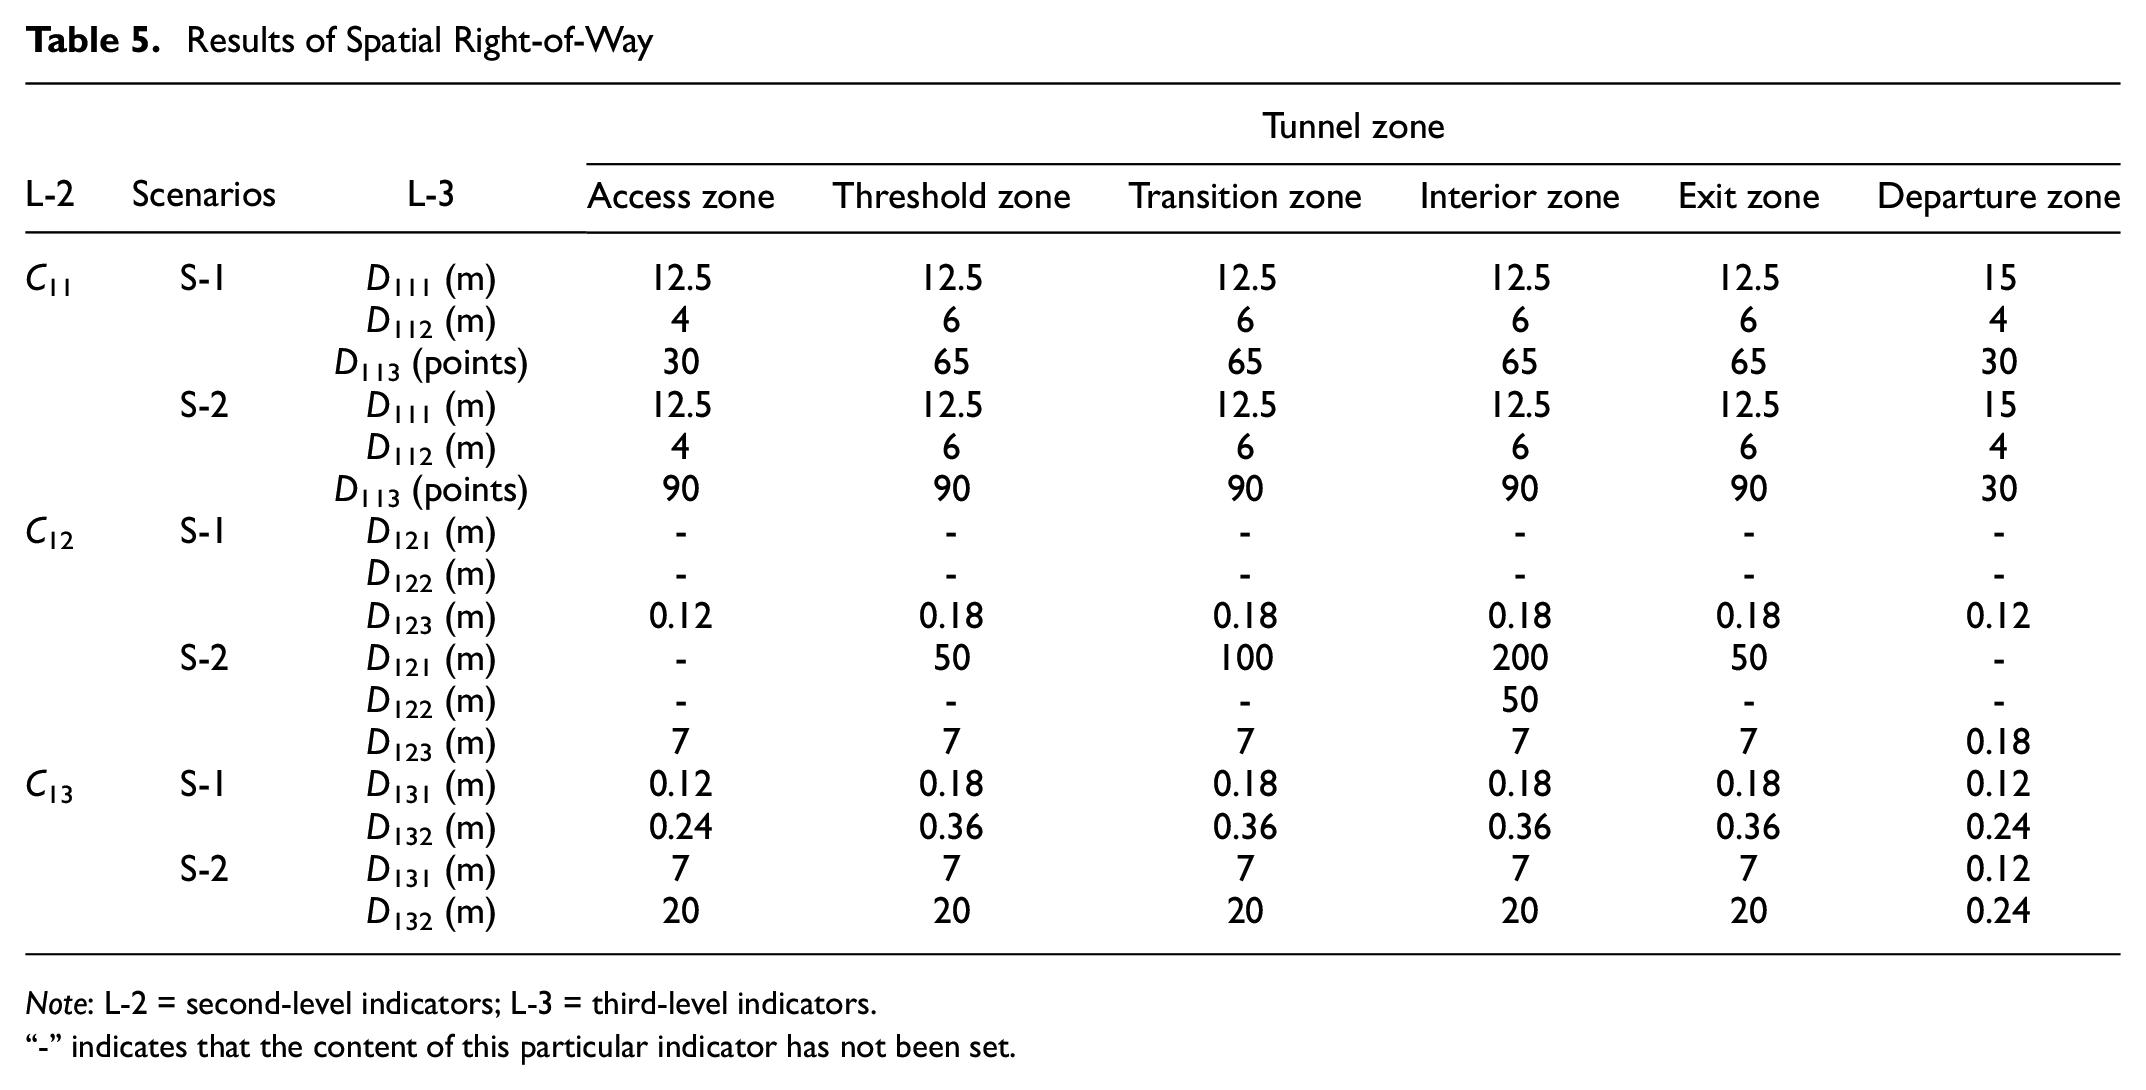
Spatial right-of-way, being an indicator of facility placement, did not differentiate between daytime and nighttime. The results of various spatial right-of-way indicators before and after the test tunnel’s improvement are presented in Table 5.
Results of Spatial Right-of-Way
Note: L-2 = second-level indicators; L-3 = third-level indicators.
“-” indicates that the content of this particular indicator has not been set.
2) Driving Human Factors
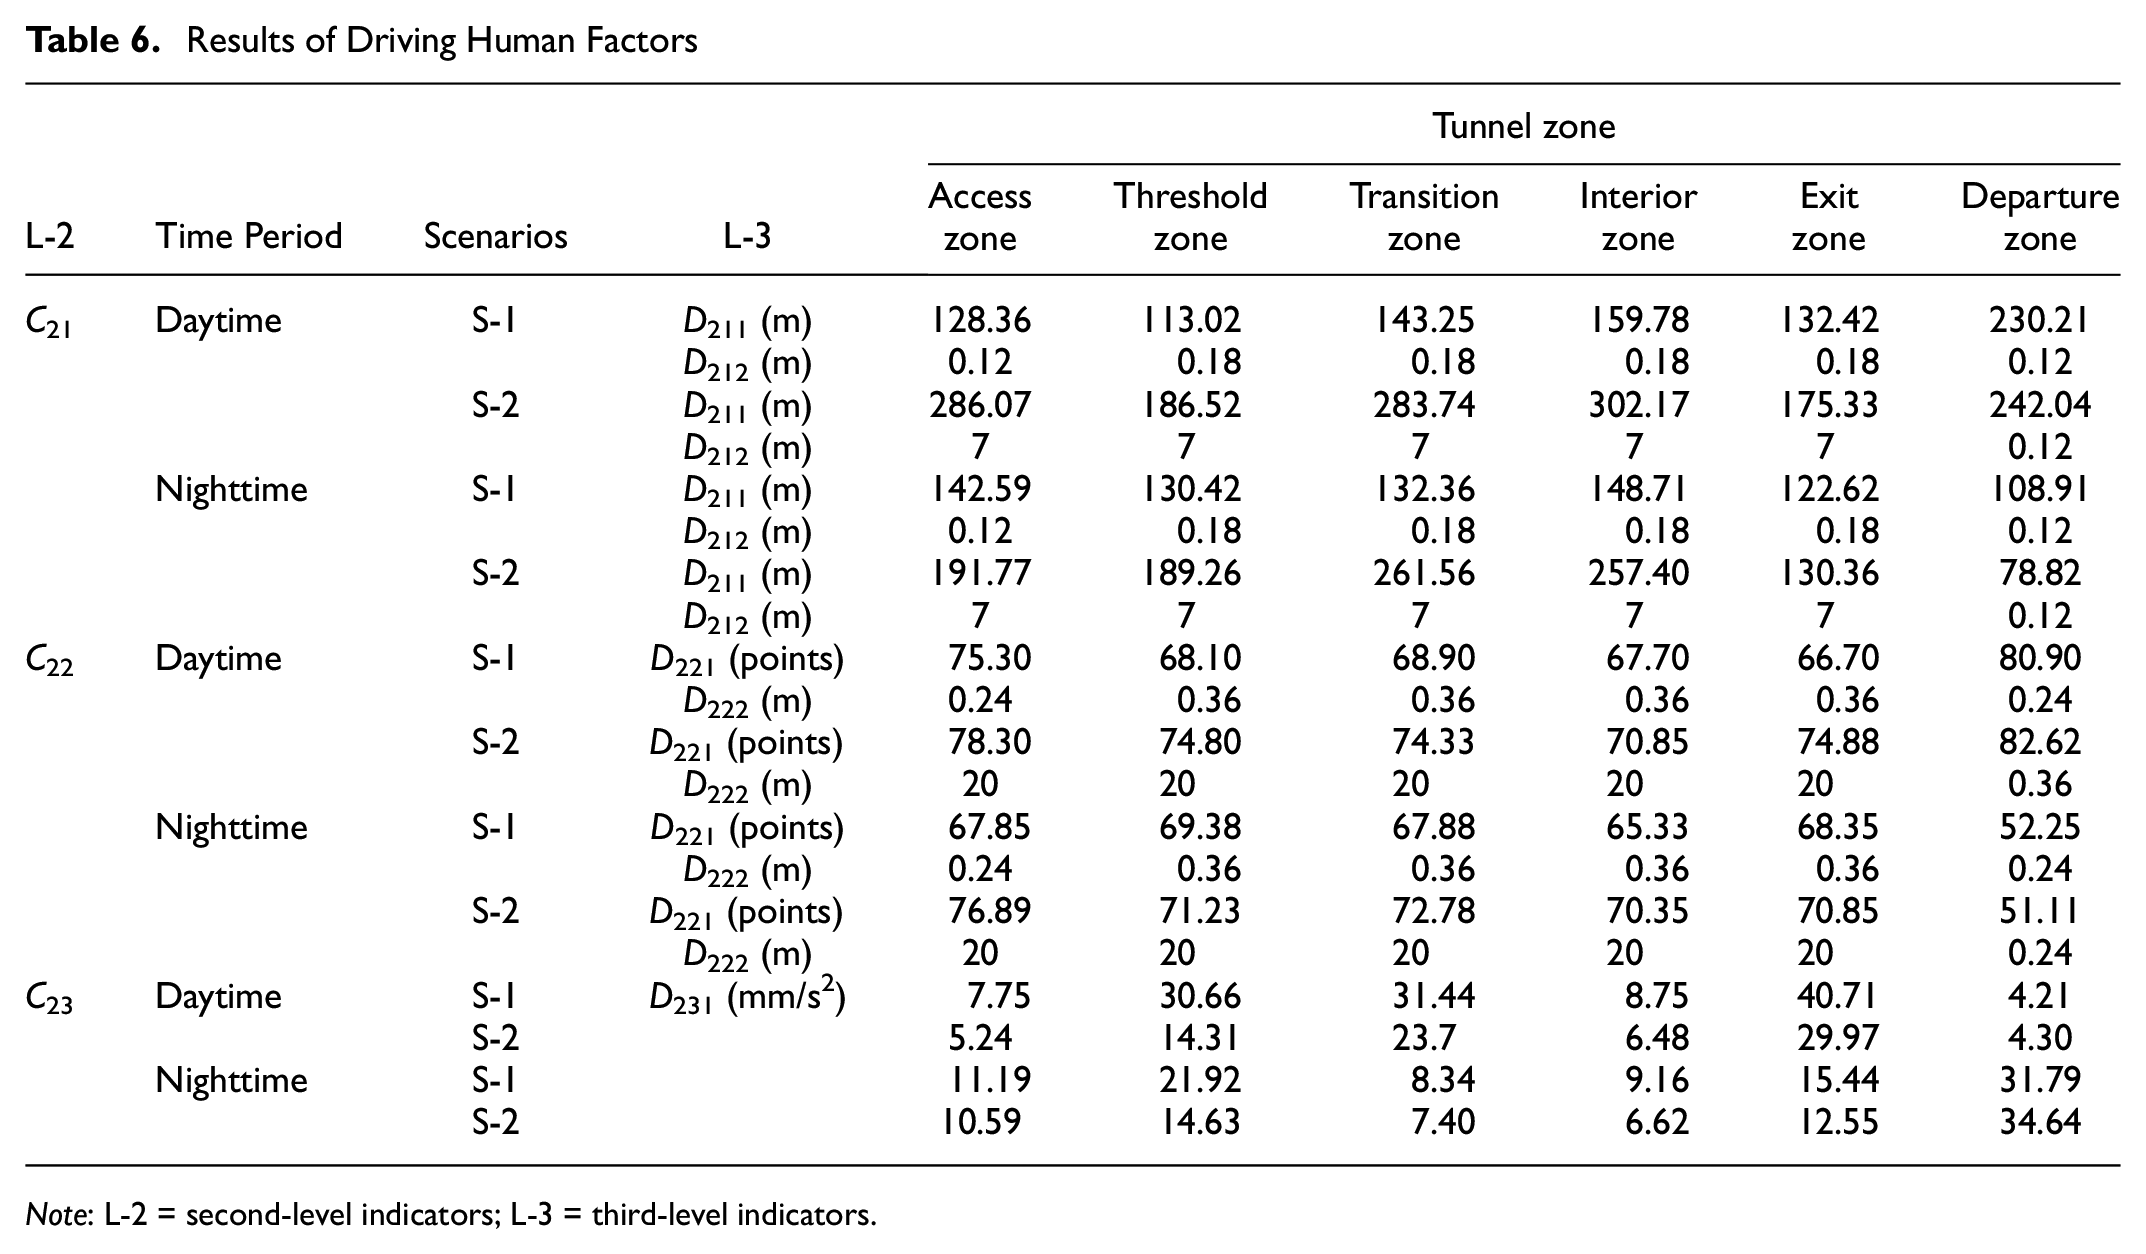
Owing to the substantial influence of environmental and physical conditions on drivers’ physiological and psychological states, they exhibited significant differences at different times. As a result, the evaluation of driving human factors considered the distinctions between daytime and nighttime conditions.
The results of various indicators in driving human factors before and after the improvement of the test tunnel are presented in Table 6.
Results of Driving Human Factors
Note: L-2 = second-level indicators; L-3 = third-level indicators.
3) Driving Performance
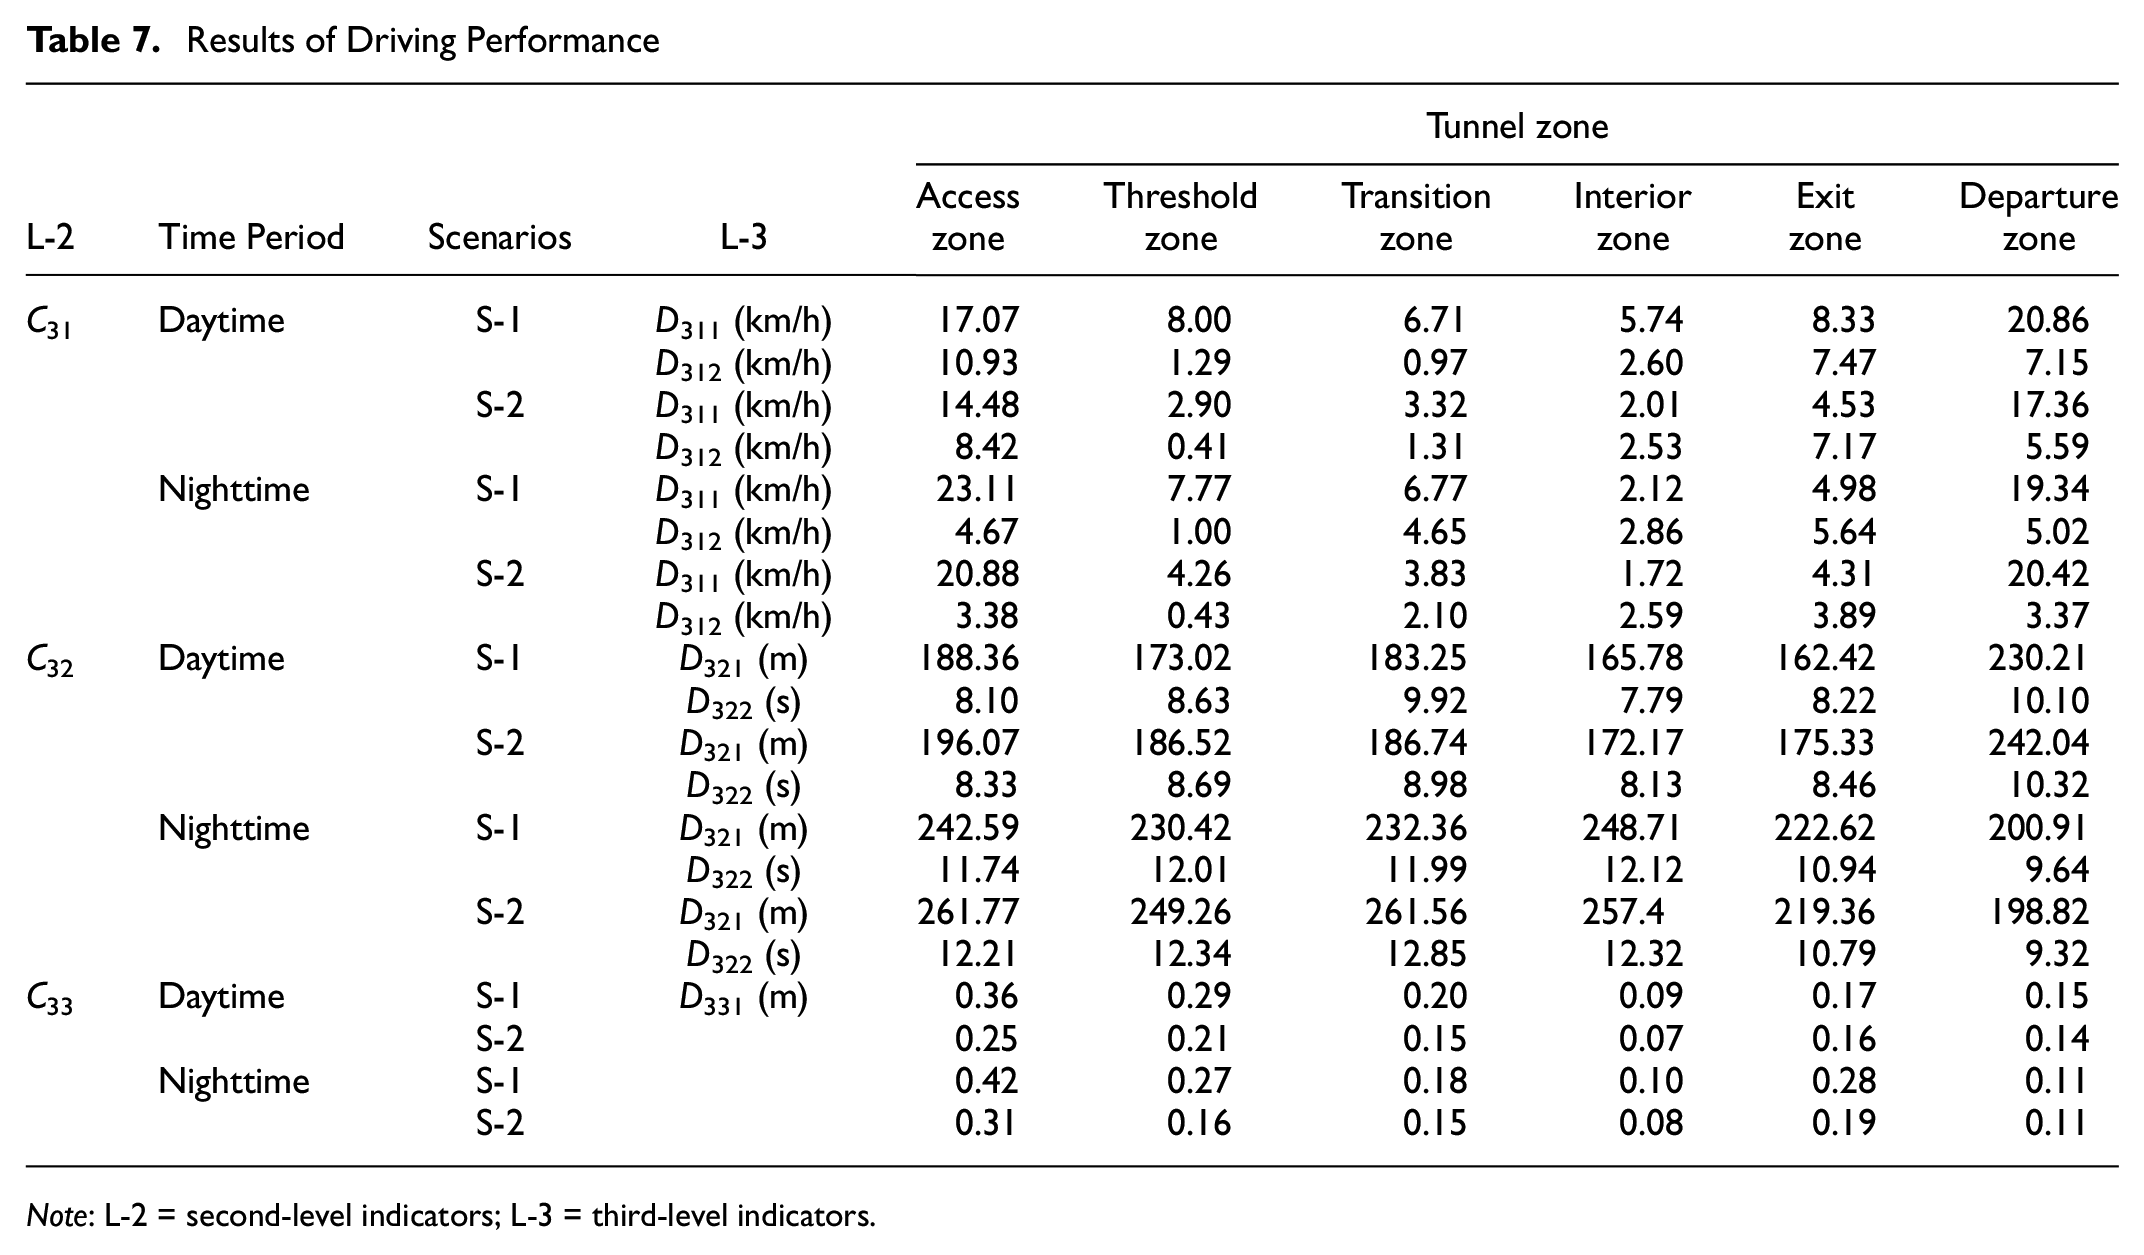
Physiological and psychological conditions and the driving environment significantly influence driving characteristics. Physiological fatigue levels and tunnel lighting can show significant differences at different times throughout the day, therefore, it is essential to distinguish between different environmental conditions during daytime and nighttime.
The results of various indicators in driving performance before and after the improvement of the test tunnel are presented in Table 7.
Results of Driving Performance
Note: L-2 = second-level indicators; L-3 = third-level indicators.
Normalization of Indicators
Because of the inconsistency of indicator values in the evaluation system, normalization of the indicators values to dimensionless values was necessary. To achieve this, separate calculations were required, given the presence of “+∞” in the evaluation level interval.
For normalization with larger values and lower evaluation levels, the process is as follows:
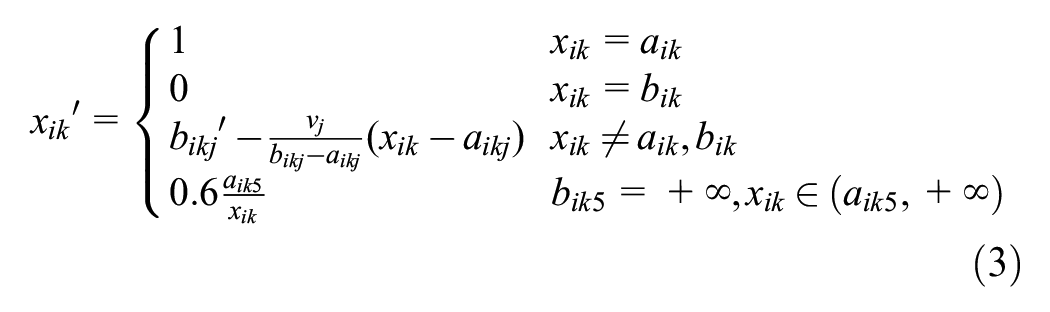
For normalization with larger values and higher evaluation levels, the process is as shown in Equation 4,
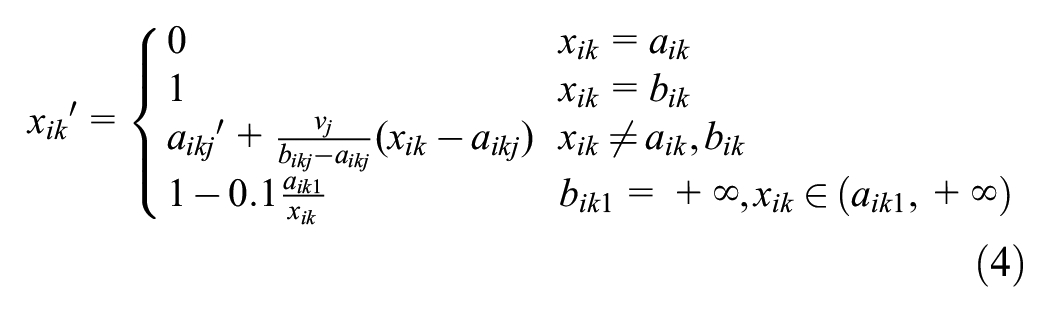
where xik′ is the normalized value of the k-th L-2 in the i-th L-1; and xik is the value before normalization. The range of values for evaluation level, j, before and after normalization, (aikj, bikj) and (aikj′, bikj′), respectively, were considered. In addition, (aik, bik) represent the entire range of evaluation levels from A to E before normalization, where aik and bik indicate the upper or lower limit value of the interval corresponding to evaluation levels A or E. The dimensionless range with an evaluation level of j, denoted by vj, had values of (v1∼v5 = 0.1, 0.1, 0.1, 0.1, and 0.6).
Weights of Indicators
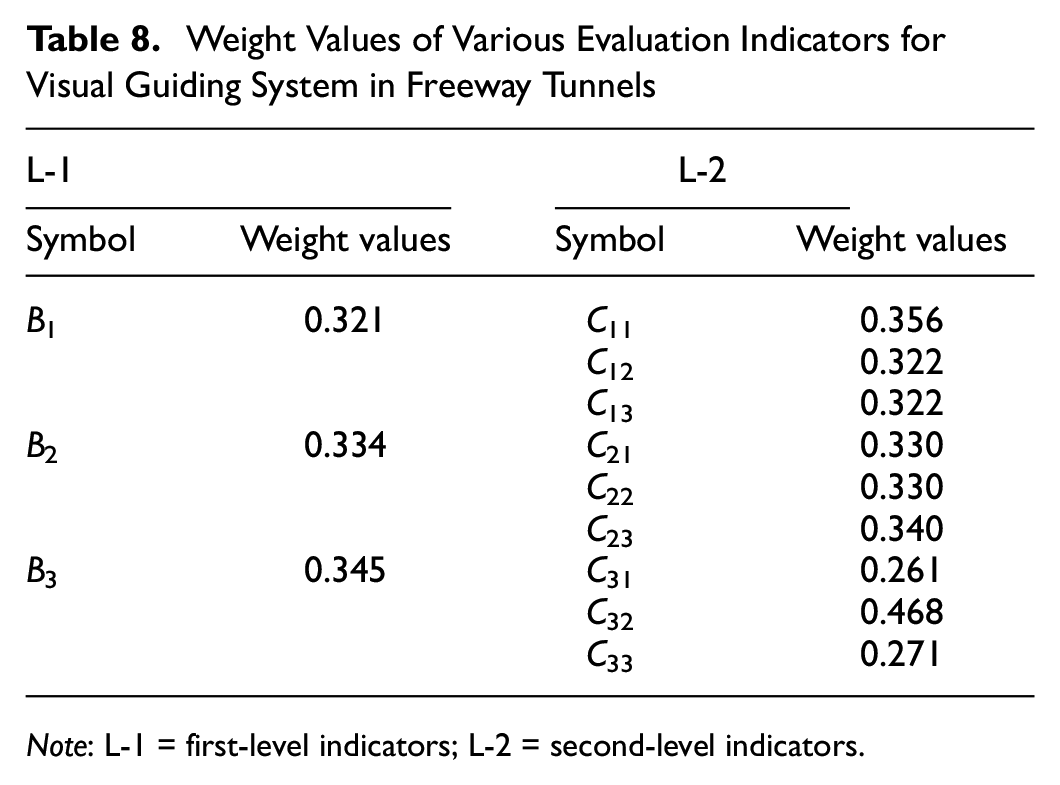
Given the inability to calculate the L-1 indicator weights from existing test data, to scientifically obtain the weight coefficients of the indicators, a two-step approach was adopted to mitigate the influence of single subjective and objective factors on the weights of the indicators. The L-1 indicator weight was determined through expert scoring, whereas the L-2 indicator weight was derived using variable weight theory.
In the expert scoring method, subjective scores relating to the importance of the L-1 indicators were collected from 30 evaluators representing different fields of experience. However, in practical application, sufficient numbers of experts should be ensured. This group included 10 engineering designers, 10 scientific researchers, and 10 professional drivers. The weight results from the three types of expert were comprehensively processed based on a weight ratio 3:3:3.
To account for the active participation of the evaluation subjects in this comprehensive evaluation, the state variable weight vector was determined using the measured data of the evaluation indicator ( 47 ).
The variable weight calculation is shown in Equation 5

where dik max = max { | xik′-0|, |1- xik′| }; and dik min = min{ | xik′-0|, |1- xik′| }. μ is a variable weight factor: when μ > 0, it generates an n-dimensional incentive state variable weight vector, which indicates that the requirement for the balance of factors is not very high; when μ < 0, it generates an n-dimensional penalized state variable weight vector, which indicates that there is a certain requirement for the balance of factors; when μ = 0, the model becomes a constant weight model. μ is penalized in the range [−1, 0], and the smaller μ is, the greater the consideration of equal balance of the indicators by the decision maker. When μ < −1, the decision maker has gone to the extreme, which should be avoided in general. To reflect the equal balance of the evaluation indicators, we adopted μ = −1 in this paper ( 48 ).
According to the values of the indicators, combined with the calculation methods of normalization and weighting, the weighting coefficients were derived as shown in Table 8.
Weight Values of Various Evaluation Indicators for Visual Guiding System in Freeway Tunnels
Note: L-1 = first-level indicators; L-2 = second-level indicators.
Based on the indicator values and the normalization and weighting calculations, the weighting coefficients are derived as follows:
1) The weight values of the L-1 indicators were 0.321, 0.334, and 0.345, respectively.
2) The weight values of the spatial right-of-way in the secondary indicators were 0.356, 0.322, and 0.322, respectively. The weight values of driving human factors were 0.330, 0.330, and 0.340, respectively. The weight values of driving performance were 0.261, 0.468, and 0.271, respectively.
Analysis of Evaluation Based on Improved Matter-Element
The matter-element evaluation method has been widely applied in the field of traffic safety ( 22 ). Considering the range and interval of the evaluation indicators enables the determination of correlation degrees and evaluation levels.
Given that the principle of maximum membership cannot reflect the ambiguity of an object’s own boundaries in certain situations when evaluating the level of an object, it is easy to lose information, which can lead to a deviation in the evaluation results. To obtain more accurate evaluation results, the maximum membership evaluation criterion of the model was improved. By analyzing the proximity criterion instead of the maximum membership criterion, an asymmetric proximity formula was proposed. The calculation of the nearness degree for the corresponding level, j, is shown in Equation 6. Additionally, based on the results of the nearness degree, the evaluation level can be determined using Equations 7 and 8 ( 48 ).

where Dj(xik′) = | xik′−(ajik′+bjik′)/2| − (bjik′−ajik′)/2; and mn is the number of evaluation indicators.

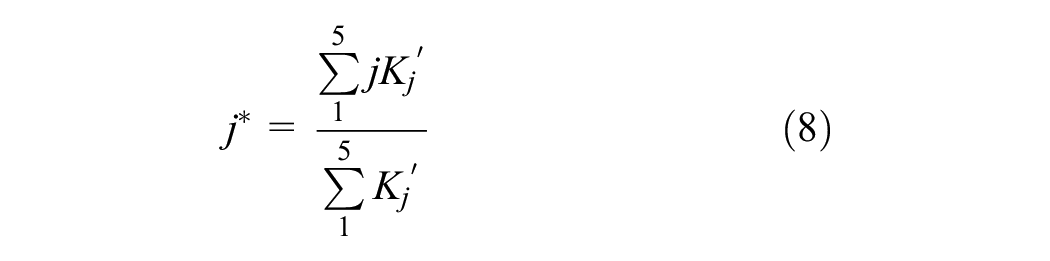
If Kj = max{ Kj }, it is determined to belong to Level j. In Equation 8, j* represents the eigenvalue of the level variable of the object to be evaluated. By using j*, it is possible to determine the degree to which the rating value of the subject is biased toward adjacent levels. The greater the nearness degree, the higher the degree of conformity with that level.
According to Equations 6 to 8, the function values of the nearness degree, the eigenvalues of the level variables, and the level ratings for each scenario before and after improvement can be calculated, as shown in Table 9.
Evaluation Results

Note: A, B, C, D, and E, representing excellent, good, medium, pass, and poor, respectively. The corresponding score ranges are as follows: [0.9, 1] for A, [0.8, 0.9) for B, [0.7, 0.8) for C, [0.6, 0.7) for D, and [0, 0.6) for E.
The results in Table 9 showed that (1) in the daytime environment, the evaluation level before improvement was C. However, its eigenvalue was 3.983 (close to 4.0), the same as the rating Level D and was just a passing level. (2) In the nighttime environment, the evaluation level before improvement was D, with an eigenvalue of 4.145. (3) After setting up the linear visual guiding facilities, the evaluation level in both daytime (2.214) and nighttime (2.204) was raised to Level B.
Conclusions
This study developed a comprehensive evaluation system for traffic safety based on visual guiding systems in freeway tunnels, and applied it to different environmental conditions in an actual tunnel.
1) A comprehensive evaluation system for traffic safety, focusing on the visual guiding system in freeway tunnels based on the spatial right-of-way, driving human factors, and driving performance was proposed to address the currently chaotic setting of visual guiding facilities.
2) Field tests were conducted during the daytime and nighttime before and after installing the visual guiding system in the tunnel. The evaluation system was utilized to evaluate the before and after improvement schemes, revealing a significant positive impact of the visual guiding system on traffic safety.
3) It is important to note that this paper solely focused on evaluating freeway tunnels and did not delve into research on other types of tunnels. Future studies considering various tunnel types with different design speeds are anticipated.
Footnotes
Author Contributions
The authors confirm contribution to the paper as follows: study conception and design: S. Wang, H. Zheng, Z. Du; data collection: S. Wang, H. Zheng, L. Han; analysis and interpretation of results: S. Wang, L. Han, S. He; draft manuscript preparation: S. Wang, F. Jiao. All authors reviewed the results and approved the final version of the manuscript.
Declaration of Conflicting Interests
The authors declared no potential conflicts of interest with respect to the research, authorship, and/or publication of this article.
Funding
The authors disclosed receipt of the following financial support for the research, authorship, and/or publication of this article: This study was supported by the National Natural Science Foundation of China (No. 52072291 and No. 52302437) and Open Project of Key Laboratory of Ministry of Public Security for Road Traffic Safety (2023ZDSYSKFKT11).
