



Abstract
The increase in cycling accidents can hinder the increased use of this transportation mode. To identify the sociodemographic factors explaining risky cyclists’ behaviors is therefore important. The relationships between some sociodemographic variables (gender, age, parenthood, use of a shared versus a personal bike) and some risky behaviors (helmet use, red-light running, crossing an intersection with a very short time before the next passing vehicle) remain inconsistent or under-investigated in the literature. These relationships were therefore investigated in a French population. Cyclists (N = 2,788) were observed at two traffic signal intersections in the city center of Lille, France. Two cameras per site were used to score each cyclist’s variables (with a minimum of intercoder reliability = 80%). Men (versus women) and young (versus older) cyclists are less likely to wear a helmet and more likely to run red lights. Cyclists with (versus without) a child seat were more likely to wear a helmet, suggesting that parenthood influences risk perception. Shared (versus personal) bike users were found to be significantly less likely to wear a helmet and more likely to run red lights. This highlights the importance of further investigating whether shared bike users are more likely to take different types of risk on the road. Various factors (psychosocial, enforcement, road design) are discussed to explain these findings and prevent risks. The importance of adapting road safety interventions to the sociodemographic characteristics of cyclists is also discussed.
Cycling as a mode of transport, especially in cities, is becoming increasingly promoted and popular. It is the most used mode of daily transport for 8% of people in Europe ( 1 ). Cycling is associated with several benefits, such as improving health and reducing air and noise pollution and congestion in urban areas, while being a relatively low-cost mode of transport ( 2 – 4 ). The increase in cycling in a given area may be associated with a reduction in the risk of cyclist injury per time and distance (i.e., the “safety in numbers” effect), but not necessarily in the total number of cyclists injured ( 5 ). In fact, cyclists are one of the most vulnerable types of road user with the highest risk of injury and death ( 6 ). In Europe, cycling is the only mode of transport where the number of fatalities has not fallen over the last decade, with 1,985 fatalities (or 6.7% of all road fatalities) in 2010 and 2,006 fatalities (or 8.6% of all road fatalities) in 2018 ( 7 ). In France, where the present study was conducted, there were 187 deaths and 4,506 injuries among cyclists in 2019 ( 8 ).
Although the benefits of cycling likely outweigh the societal and individual risks, these risks raise a substantial challenge for transport planning and road safety and may discourage the use and promotion of cycling ( 9 – 13 ). Although the development of bikesharing programs is one of the important levers to promote daily cycling in general, their use may be associated with increased injuries because of lower helmet use among bikeshare users ( 14 – 16 ). This lower helmet use may be explained by difficulties in accessing a helmet (including unplanned use of a shared bike), by difficulties in carrying a helmet, and by possible differences in risk perception between shared and personal bike users ( 15 , 17 ). These risks associated with shared bikes may also contribute to discouraging the development of daily cycling.
The incidence of accidents involving cyclists can be explained by various factors, such as the configuration and quality of the road infrastructure (e.g., no cycle lane separated from traffic, no advanced stop line) or the behavior of other road users (especially motorized vehicles) and their interaction with cyclists (e.g., speeding, failure to keep a safe distance). While these factors are very important in determining the incidence of cycling accidents, the risky behaviors of cyclists themselves cannot be ignored ( 18 , 19 ). Risky cycling behaviors can result from cycling maneuvers or failure to use certain safety equipment that must be carried or installed on the bicycle, leading to a collision or a fall, or an increase in their severity. Therefore, understanding the determinants of risky behaviors of both personal and bikeshare users is an important issue for guiding, structuring and targeting preventive and educational actions. Among the various risky behaviors of cyclists, it is proposed to focus on 1) not wearing a helmet, 2) running a red light, and 3) not keeping sufficient safe distance from vehicles crossing their path when entering the intersection.
Risky Cycling Behaviors
Wearing a bicycle helmet is an effective way to avoid or reduce the severity of facial injuries and prevent fatal accidents ( 20 – 22 ). For example, a meta-analysis of 55 studies found that bicycle helmets reduced facial injuries by 23%, head injuries by 48%, and severe head injuries by 60% ( 21 ). A recent systematic review of meta-analyses confirms the benefits of wearing a bicycle helmet, regardless of age, crash severity, or crash type ( 23 ). According to the 2018 E-Survey on Road Users’ Attitudes (ESRA2) survey, the percentage of cyclists who reported not wearing a helmet at least once in the past 30 days ranges from 51% in North America to 71% in Asia-Oceania ( 24 ). This rate also varies significantly between countries in the same region of the world, with 87% in the Netherlands, 74% in France, and 46% in Portugal ( 24 ). According to another survey conducted in France in 2022, only 30% of French people say they always wear a helmet when cycling alone, 23% say sometimes, and 47% say never ( 25 ). Encouraging French cyclists, among others, to wear a helmet is therefore an important issue. It should be noted that, since 2017, it has been compulsory in France for children under 12, including passengers, to wear a helmet.
Red-light running is a common violation among cyclists, with observed frequencies ranging from 6.9% in Melbourne to 87.5% in Dublin ( 26 , 27 ). Red-light running was found to be associated with a higher risk of traffic accident involvement. In Berlin, red-light running could explain nearly 6% of all accidents involving cyclists ( 28 ). In Florida, right-of-way violations, including red-light running, were found to cause approximately 15% of accidents involving cyclists ( 29 ).
When a cyclist enters an intersection, it is important for them to maintain a safe distance from vehicles crossing their path to avoid collisions. In Europe, 31% of cyclist fatalities occur at intersections, and right-of-way violations, that can occur at intersections, are a significant cause of cyclist accidents ( 29 , 30 ). Thus, it can be assumed that crossing an intersection with too little distance from an oncoming vehicle from the left or right would contribute to some of these accidents. This behavior could often result from an underestimation of the distance needed to safely cross the intersection. In fact, this specific behavior and its determinants do not seem to have been particularly studied among cyclists. Nevertheless, a similar behavior was defined and observed among pedestrians by Sueur et al. ( 31 ). The authors observed the time between the moment when the pedestrian starts to cross an intersection and the moment when the next car passes after the pedestrian has finished crossing. According to the authors, this variable, which they labeled Tsafe, would correspond to the time that a pedestrian estimates to be necessary to cross the road safely (as opposed to the variable Trisk, which refers to the time between the moment when the pedestrian stops at the intersection and the moment when the next car passes before the pedestrian starts crossing, which would correspond to the time that a pedestrian estimates to represent a risk).
Based on this previous work, it is proposed to observe the time between the moment when the cyclist runs the red light and the moment when the next vehicle (Tsafe-vehicle) or pedestrian (Tsafe-pedestrian) passes after the cyclist, and to explore the possible difference on this parameter according to the sociodemographic variables presented below. The shorter this time, the more dangerous it would be to run a traffic signal. Therefore, for shorter times, these parameters could be related to the concept of near misses, which refers to narrowly avoiding a collision while remaining unharmed ( 32 ). Because traffic accidents are rare events and difficult to observe, near misses are often considered as (and have been found to be) a good proxy in traffic safety research, including for cyclists ( 33 ).
Sociodemographic Variables Associated with Risky Cycling Behaviors
Several sociodemographic characteristics of cyclists, such as gender and age, are known to influence the occurrence of risky behaviors. Men and young cyclists are more likely to engage in different types of risky behavior, violate different traffic rules, and be involved in traffic accidents than women and older cyclists ( 19 , 34–36). However, findings on gender and age differences in helmet use are inconsistent, as already pointed out by some authors ( 37 , 38 ). For example, several observational and self-reported survey studies have reported higher rates of helmet use among women, while the opposite or no difference were also observed in other studies ( 17 , 37–45) . The lower rate of helmet use sometimes observed among women could be explained by comfort and aesthetics concerns that they attribute to it (including that it messes up their hair) or because they perceive themselves as more cautious cyclists and therefore less in need of protection ( 44 , 46 ). The absence of gender differences sometimes observed in helmet use could be explained by a possible reduction in gender differences in traffic risk-taking and the convergence between men and women in endorsing “masculine” traits across generations ( 47 , 48 ).
With regard to age differences, the results in the literature are also mixed. In a survey of French cyclists, helmet use was found to be highest in adolescents and young adults and decreased in older age groups ( 43 ). In a survey of German cyclists, helmet use increased until about age 50 and then decreased ( 49 ). However, observational studies of French and German cyclists did not find significant age differences ( 37 , 50 ). The lower rate of helmet use among older cyclists observed in previous studies could be explained by their lower exposure to road safety awareness campaigns or the lower importance of parenthood, compared with younger adults ( 49 ). With regard to red-light running, the literature from observational and self-reported survey studies consistently shows that this violation is committed more often by men than women and by younger cyclists, especially those under age 50, compared with older cyclists ( 51 – 54 ).
Among other sociodemographic characteristics, the potential impact of parenthood on risky behaviors among adult cyclists appears to have been understudied. Qualitative data from a survey suggest that parents change some of their behaviors when transporting their children by bicycle compared with when they travel alone ( 55 ). Most commonly, parents reported changing routes or travel times to avoid heavy traffic, but they did not report more frequent use of safety equipment or safer behaviors, such as stopping at red lights or maintaining greater safety distances. However, among the possible strategies to reduce the risks when transporting children by bicycle, parents reported adopting more cautious behaviors, such as paying more attention to hazards and riding more slowly. However, qualitative data are not always reliable enough to identify the determinants of individual behaviors. Parenthood in general, and not just the presence of a child while cycling, may also encourage cyclists to adopt more cautious behaviors. To explore this possibility, it is proposed to take into account the presence or absence of a child seat on bicycles and to study its possible correlation with risky behaviors.
Apart from helmet use, the evidence of possible differences in risky behaviors between personal and shared bike users is mixed. Fishman and Schepers carried out a series of two studies ( 56 ). The first was a secondary analysis of longitudinal hospital injury data from Graves et al., comparing five cities with a bikeshare program and five without ( 16 ). The results showed that the introduction of bikeshare programs was associated with a reduction in the risk of cycling injury. The second study analyzed data from bikeshare operators in two large cities and found that shared bike users had a lower risk of fatal or serious injury than other bike users. Hwang et al. found that cyclists injured in communities with bikeshare programs had a lower risk of maxillofacial injuries compared with cyclists injured in communities without bikeshare programs, although shared bike users were generally less likely to wear helmets ( 15 , 57 ). The authors proposed several explanations for the lower risk among shared bike users compared with personal bike users ( 56 , 57 ). The greater weight of shared bikes would imply a lower speed. Compared with cities without, cities with a bikeshare program might have safer infrastructure for cyclists. Motorists could be more cautious of shared bike users because they may be more visible or appear less experienced. Although this explanation does not seem to have been put forward, the observed results could also be explained by less risky behaviors among shared bike users than among personal bike users. However, this explanation seems to be contradicted by other findings.
In their observational study, Kim et al. found that shared bike users were more likely than personal bike users to commit different types of traffic violations at an intersection ( 42 ). Another observational study found that shared bike users were more likely to wear headphones or earbuds than personal bike users ( 58 ). Although these two studies have the advantage of focusing on individual data, no explanation for these differences was proposed. Concerning red-light running specifically, to the best of our knowledge, only one study conducted in Dublin has compared shared or personal bike use and found no difference in both observational and self-reported data ( 59 ). Given the many inconsistencies in the results mentioned so far, it is important to re-examine possible differences in red-light running between the two types of user, in a different country.
The Present Study
This study aims to investigate the possible effects of gender, age, parenthood, and the use of a shared or personal bike on risky behaviors among cyclists. These behaviors are: not wearing a helmet, running a red light, and crossing an intersection with a short time before a vehicle or a pedestrian passes. No hypotheses were proposed for gender and age differences on helmet use because of the inconsistency of previous findings. However, as consistently observed in previous studies, bikeshare users should be less likely to wear a helmet than personal bike users (Hypothesis 1). In line with consistent findings from the literature, men and young cyclists should commit more red-light violations than women (Hypothesis 2) and older cyclists (Hypothesis 3). Crossing an intersection with a short time before a vehicle or a pedestrian passes can be considered a relatively similar behavior to running a red light, as both occur at an intersection. Both behaviors could therefore be underpinned by the same individual determinants. Thus, men and young cyclists should cross intersections with a shorter Tsafe-vehicle and Tsafe-pedestrian than women (Hypothesis 4) and older cyclists (Hypothesis 5).
As shared bike users were found to be less likely to wear a helmet than personal bike users, and lower helmet use was found to be associated with more frequent red-light running, one would expect bikeshare users to be more likely to run red lights ( 15 , 53 ). However, no difference in red-light running was found between shared and personal bike users ( 59 ). Furthermore, as mentioned above, previous evidence on possible differences in risky behaviors between personal and shared bike users is mixed. Therefore, no specific hypothesis was proposed about a possible relationship between red-light running and type of bike user. Finally, a possible effect of the presence (versus the absence) of a child seat on bicycles on each risky cycling behavior will be explored.
It should be noted that the positive association found by Pai and Jou between no helmet use and red-light running contradicts the so-called “risk compensation effect” in the case of helmet use ( 53 ). According to this hypothesis, wearing a helmet could make cyclists feel safer, which could lead them to take more risks than if they did not wear a helmet. In fact, in a recent systematic review that included 23 studies, 18 studies found no support for the risk compensation hypothesis in the case of helmet use ( 60 ). Three studies found mixed results and two studies supported the hypothesis, while 10 studies found that helmet use was associated with safer cycling behaviors.
The present study is likely to make an interesting contribution to the above research questions as it provides an observation of actual behaviors. Indeed, many studies on these issues rely on self-reported behaviors, which may be subject to biases, such as social desirability ( 50 , 61 ). Confirming and investigating the sociodemographic determinants of risky behaviors among shared and personal bike users could contribute to improving their development and safety in general, and, more specifically, in the center of Lille, France, where the present research took place. The modal share of cycling in the city of Lille has increased from 1.5% in 1987 to 3.1% in 2016, while it has decreased from 3.1% to 1.5% in the European Metropolis of Lille (MEL) which includes Lille and several other surrounding towns ( 62 ). Nevertheless, the development of bicycle use and dedicated infrastructures in MEL is one of the main objectives of its mobility plan for 2020 to 2025 ( 63 ). As in Europe, the majority of cycling accidents in MEL occur at intersections ( 64 ).
Methods
Study Sites
We observed cyclist behaviors in the city center of Lille, France, from April to June, 2022. Observations were made at two different sites with traffic signals (Vauban Avenue and Nationale Road), approximately 200 m apart. The exact coordinates of the observation sites are, respectively, 50°37'55.1"N 3°02'46.0"E and 50°37'50.5"N 3°02'51.3"E. At Vauban Avenue, speed was limited to 50 km/h and cyclists had access to a bus lane (see Figure 1). At Nationale Road, speed was limited to 30 km/h and cyclists had access to a cycle lane and to a bus lane (see Figure 2). Traffic (number of cars during 10 min) was different between Vauban Avenue and Nationale Road (Mann–Whitney test: U = 15, p = 0.001, NVauban = 12, NNationale = 12, MVauban = 47.2 ± 10.6, MNationale = 30.7 ± 7.33). The observations were bidirectional, since the traffic was two-way at both sites (toward the city center and away from the city center). At Nationale Road, away from the city center, cyclists were allowed to turn right despite the red light, but they had to give way to pedestrians crossing the street on the right. At both sites, away from the city center, individuals had the opportunity to rent a bicycle through the pay-as-you-go bike access company Ilévia.
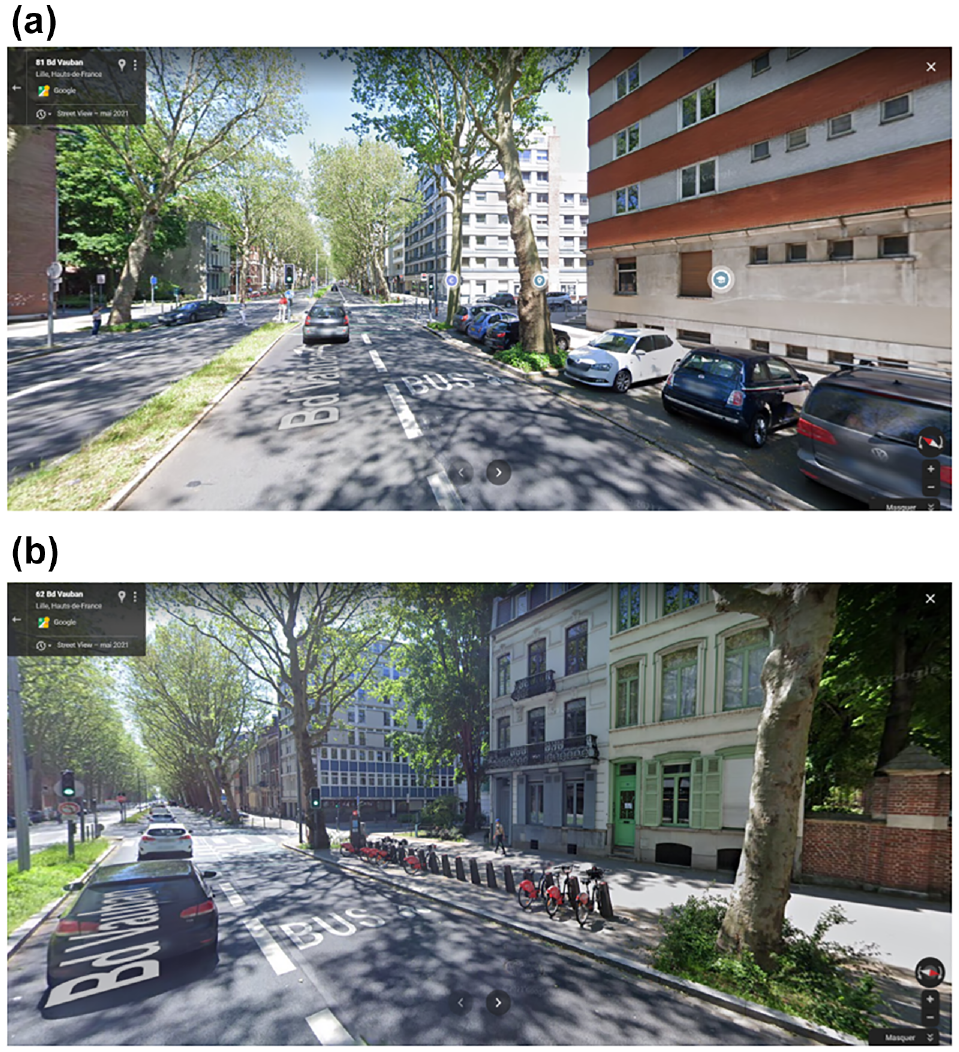
Photographs from Google Maps® of the site of observation Vauban Avenue for each direction: (a) toward city center and (b) away from city center).

Photographs from Google Maps® of the site of observation Nationale Road for each direction: (a) toward city center and (b) away from city center).
Data Scoring
Data were collected over a 49-day observation period for each site. Observations were made between 09:00 and 11:30 a.m. during working days when the frequency of cyclists was high. Two video cameras were placed in locations that ensured cyclist behaviors were visible at all times (see Figure 3). A first camera was placed in front of the traffic signal to record its color and the behavior of the cyclist when passing it. A second camera was placed in front of the cyclist to record individual and bike details. Observers and cameras were placed near the sidewalk to prevent any changes in the cyclist behavior but they still remained visible.

Schematic representation of the observation set-up.
For each cyclist passing the traffic signal, experimenters assessed gender (male or female), age estimated at 10-year intervals, that is, 0–9, 10–19 […] to 80–89 (age estimation previously used for pedestrian behaviors; see Sueur et al., Pelé et al., and Jay et al.), type of bicycle user (shared, personal, or professional bike user), presence of a child seat (which we used as a proxy for the cyclist’s parenthood status), use of a helmet, color of the signal when passing (green, yellow, red), behavior at red light (red-light running without stopping or slowing down, red-light running after stopping or slowing down, stopping for the entire duration of the red light and waiting for it to turn green before passing through), and the trajectory after passing the traffic signal (turning right, turning left, going straight, turning around) ( 31 , 65 , 66 ). Following the classification of Fraboni et al., running straight through the red light can be considered more dangerous than running a red light after an initial stop ( 51 ). Slowing was defined as the cyclist stopping pedaling (note that, in each direction, the observation points were not on slopes).
Based on previous work on pedestrians, we measured Tsafe (in seconds) as the time between the moment where the cyclist passes the red light and the moment where the next vehicle (Tsafe-vehicle) or pedestrian (Tsafe-pedestrian) passes after the cyclist ( 31 ). More precisely, Tsafe-vehicle value corresponds to the difference between the time when the cyclist crosses the line of the red light (that delimits the road by which it arrives and the intersection zone) and the time when the next vehicle starts to cross the line (that delimits the road by which it arrives and the intersection zone) (see Figure 4). Tsafe-pedestrian value corresponds to the difference between the time when the cyclist crosses the line of the red light (that delimits the road by which it arrives and the intersection zone) and the time when the next pedestrian starts to enter the pedestrian crossing (see Figure 4). All variables were scored from the video recordings by two teams of two or three coders, using BORIS software, and showed an intercoder reliability (proportion of concordance) of 80% minimum (depending on the easiness of observing or coding the variables) ( 31 , 65–67). When two coders disagreed on one variable, they asked for deliberation.

Schematic description of the tested variable Tsafe when cyclists pass the red light.
Research Ethics
The present methodology involved only anonymous observations and data scores. The protocol followed the ethical guidelines of the institution of the research team (Catholic Lille University) and was conducted in accordance with the 1964 Helsinki declaration and its later amendments, the ethical principles of the French Code of Ethics for Psychologists, and the 2016 APA Ethical Principles of Psychologists and Code of Conduct ( 68 – 70 ). Individuals were assigned sequential numerical identities. It was possible for the cyclists to be informed about the study by asking the two observers (this happened a dozen times) and to be provided with an email address to contact the institution at a later date if desired. It was also possible for cyclists to be removed from the data (however, no one asked).
Sample and Data Screening
Among the 3,067 cyclists observed, 279 were excluded from the database. Specifically, 15 cyclists were excluded from the database because we were unable to estimate their age. The 177 cyclists who used a bicycle in a professional context (e.g., delivery person) were excluded because they represent a specific population that was outside the objectives of this study ( 71 ). The 87 cyclists who crossed a yellow light were excluded because of the difficulty of interpreting this behavior as being or not being a violation or risk-taking. In fact, in France, passing through a yellow light is only allowed by law if the user cannot stop safely (e.g., risking a collision with the following vehicle in the case of sudden braking).
Finally, 2,788 cyclists were retained for all subsequent analyses (available in the following OSF repository: https://doi.org/10.17605/OSF.IO/7E5PB). More men (N = 1,710) were observed than women (N = 1,078) (binomial test, p < 0.001). A total of 39.6% of the cyclists were aged 20–29 years and 25.8% were aged 30–39 years. Cyclists in the age categories 60–69, 70–79, and 80–89 together represented 4.1% of the observations, so they were grouped into a 60+ category. The sample distribution by gender and age category is presented in Figure 5. Only 67 cyclists (2.4%) rode an electric bike. A total of 82 cyclists (2.9%) rode a bike equipped with a child seat. More personal bike users were observed (74.2%), than bikeshare users (25.8%). Considering the two sites, Nationale Road is more used by cyclists than Vauban Avenue (binomial test, p < 0.001).

Sample distribution according to gender and age categories.
Results
Use of a Helmet
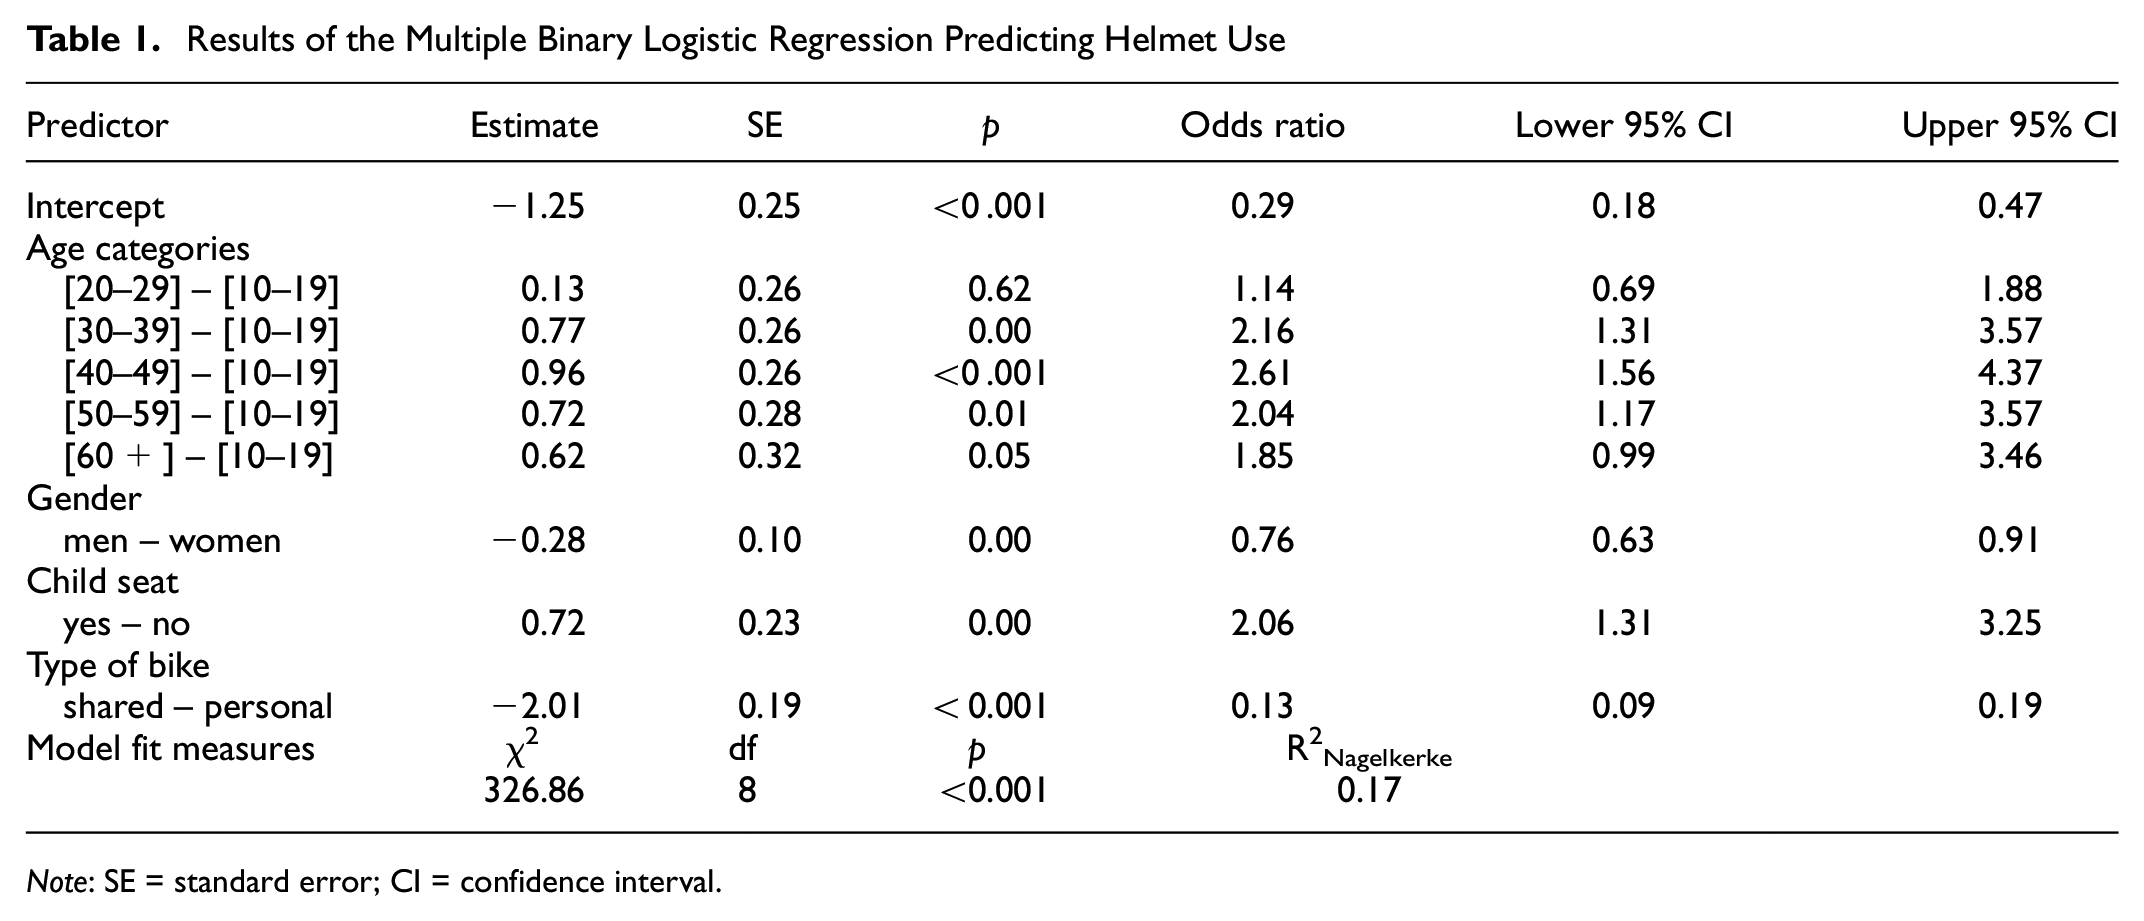
A total of 668 cyclists were observed wearing a fastened helmet and 2,114 cyclists were observed biking without wearing a helmet. Two special cases were also observed: cyclists wearing an unfastened helmet (N = 1) and cyclists having a helmet on their bike but not on their head (N = 5). Since these two cases represent only 0.3% of the population, it was decided to consider them as not wearing a helmet. Then, 76% of the cyclists we observed were not wearing a helmet. The results of a multiple binary logistic regression (see Table 1) show that helmet use is associated with gender, age, the type of bike, and the presence of a child seat. The rate of helmet use is lower for men (16.2%) than for women (20.4%), OR = 0.76, 95% CI [0.63, 0.91], p = 0.004. The likelihood of wearing a helmet appears to be lowest in the 10–19 and 20–29 age groups, between which there is no significant difference (p > 0.10). The likelihood of wearing a helmet is not significantly different between older categories (all ps > 0.10), but is significantly higher compared with the 10–19 and 20–29 age groups (all ps ≤ 0.03) (see Figure 6). As expected with Hypothesis 1, the rate of helmet use is lower among bikeshare users (7.6%), compared with personal bike users (37.9%), OR = 0.13, 95% CI [0.09, 0.19], p < 0.001. Cyclists with a child seat (24.3%) are about twice as likely to wear a helmet as those without a child seat (13.5%), OR = 2.06, 95% CI [1.31, 3.25], p = 0.002. No multicollinearity concerns were identified (tolerance value ranges from 0.98 to 1.00 and VIF value ranges from 1.00 to 1.02).
Results of the Multiple Binary Logistic Regression Predicting Helmet Use
Note: SE = standard error; CI = confidence interval.
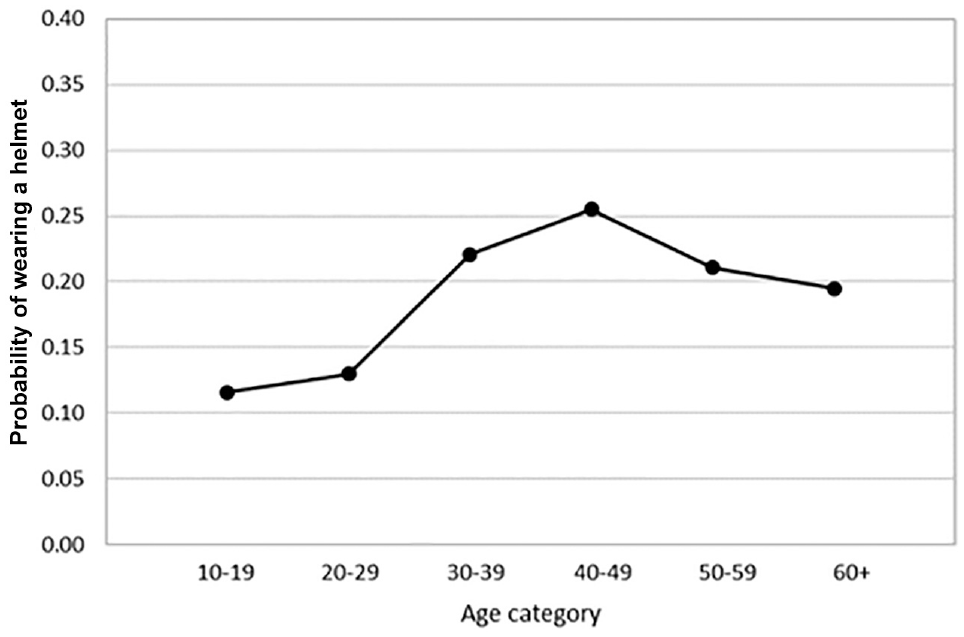
Probability of wearing a helmet among cyclists according to age category.
Red-Light Running
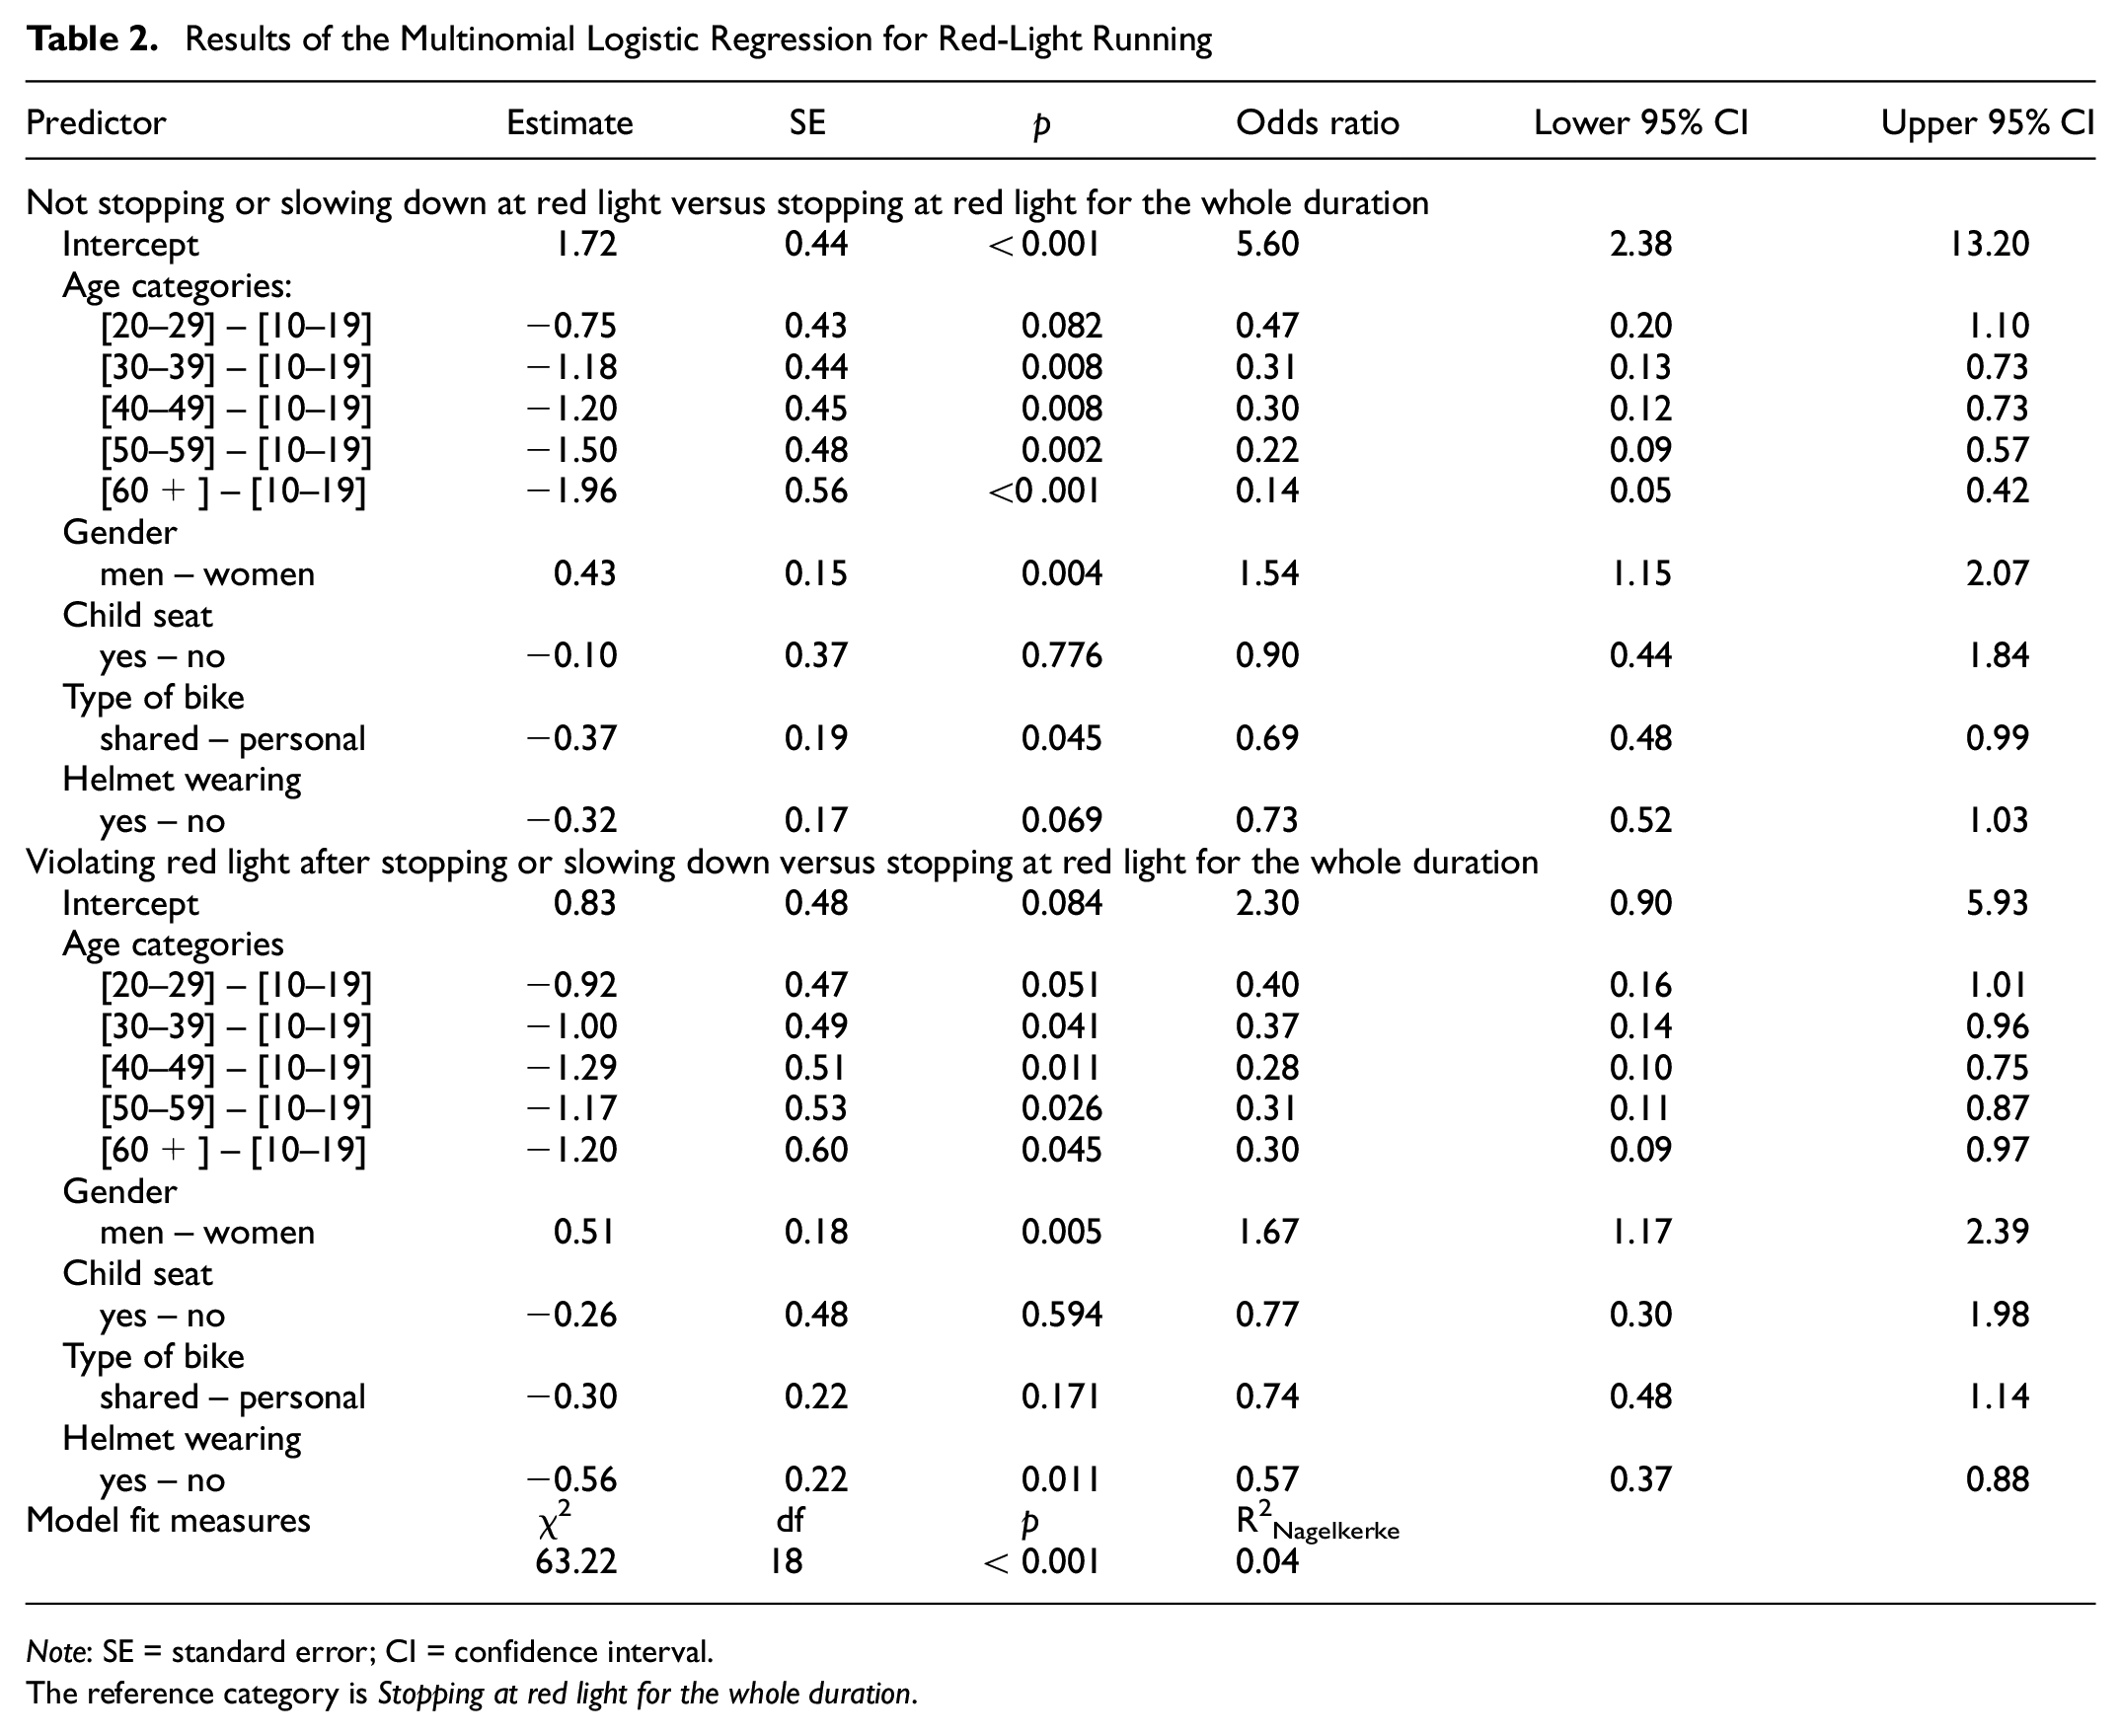
Among the 1,099 cyclists arriving at a red light, 552 (50.2%) passed it without stopping or slowing down and 242 (22.0%) stopped or slowed down before passing it (while the light was still red). A total of 305 (27.8%) cyclists stopped for the entire duration of the red light and waited for it to turn green before passing through. The results of a multinomial logistic regression (see Table 2) showed that running a red light without stopping or slowing down, as well as running a red light after stopping or slowing down (both compared with stopping at the red light for the whole duration), are influenced by gender and age. Running a red light without stopping or slowing down also correlates with the type of bike. In addition, running a red light after stopping or slowing down also correlates with wearing a helmet.
Results of the Multinomial Logistic Regression for Red-Light Running
Note: SE = standard error; CI = confidence interval.
The reference category is Stopping at red light for the whole duration.
Red-light running without stopping or slowing down, as well as red-light running after stopping or slowing down, are more common among men (50.0% and 22.4%, respectively) than women (44.7% and 18.4%, respectively), OR = 1.54, 95% CI [1.15, 2.07], p = 0.004, and OR = 1.67, 95% CI [1.17, 2.39], p = 0.005, thus corroborating Hypothesis 2. Consistent with Hypothesis 3, the likelihood of running a red light without stopping, as well as after stopping or slowing down, appears to be highest in the 10–19 and 20–29 age groups, between which there is no significant difference (p = 0.082 and p = 0.051, respectively). Compared with the 10–19 and 20–29 age groups, the likelihood of running a red light without stopping or slowing down is significantly lower for all older groups (all ps ≤ 0.034). This likelihood does not differ significantly between the 30–39, 40–49, 50–59, and 60+ age groups (all ps > 0.05) (see Figure 7). Compared with the 10–19 age group, the likelihood of running a red light after stopping or slowing down is significantly lower for all age groups older than 20–29 (all ps ≤ 0.045). This likelihood does not differ significantly between the 20–29, 30–39, 40–49, 50–59, and 60+ age groups (all ps > 0.178). Red-light running without stopping or slowing down is less common among personal bike users (44.4%) compared with bikeshare users (50.3%), OR = 0.69, 95% CI [0.48, 0.99], p = 0.045. Red-light running after stopping or slowing down is less common among helmet-wearing cyclists (17.4%) compared with non-helmet-wearing cyclists (23.3%), OR = 0.57, 95% CI [0.37, 0.88], p = 0.011. No multicollinearity concerns were identified (tolerance value ranges from 0.92 to 0.99 and VIF value ranges from 1.01 to 1.09).

Probability of running a red light among cyclists according to age category.
Time Before a Vehicle (Tsafe-vehicle) or a Pedestrian (Tsafe-pedestrian) Passes
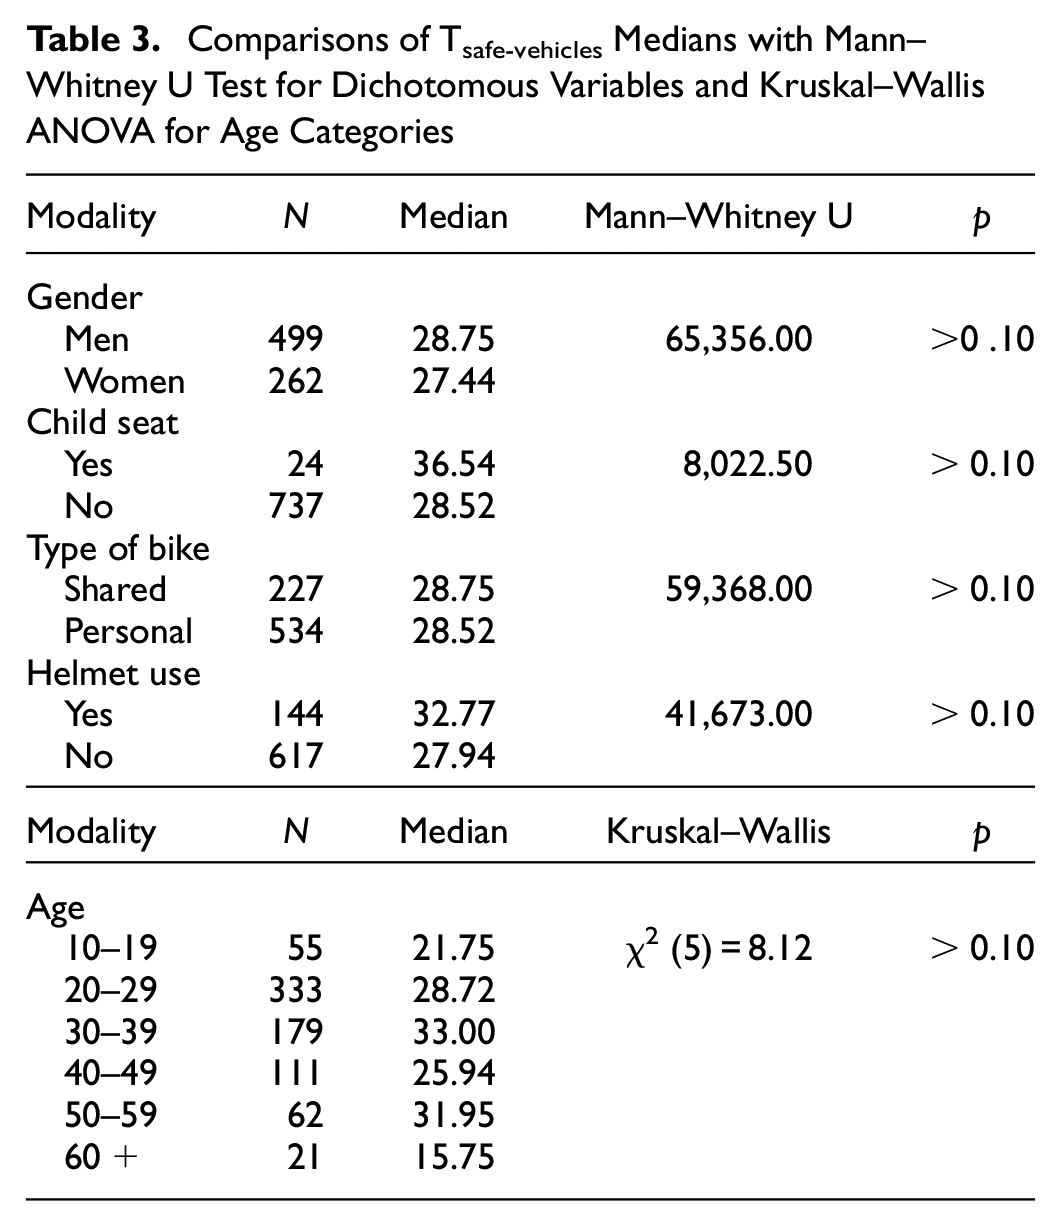
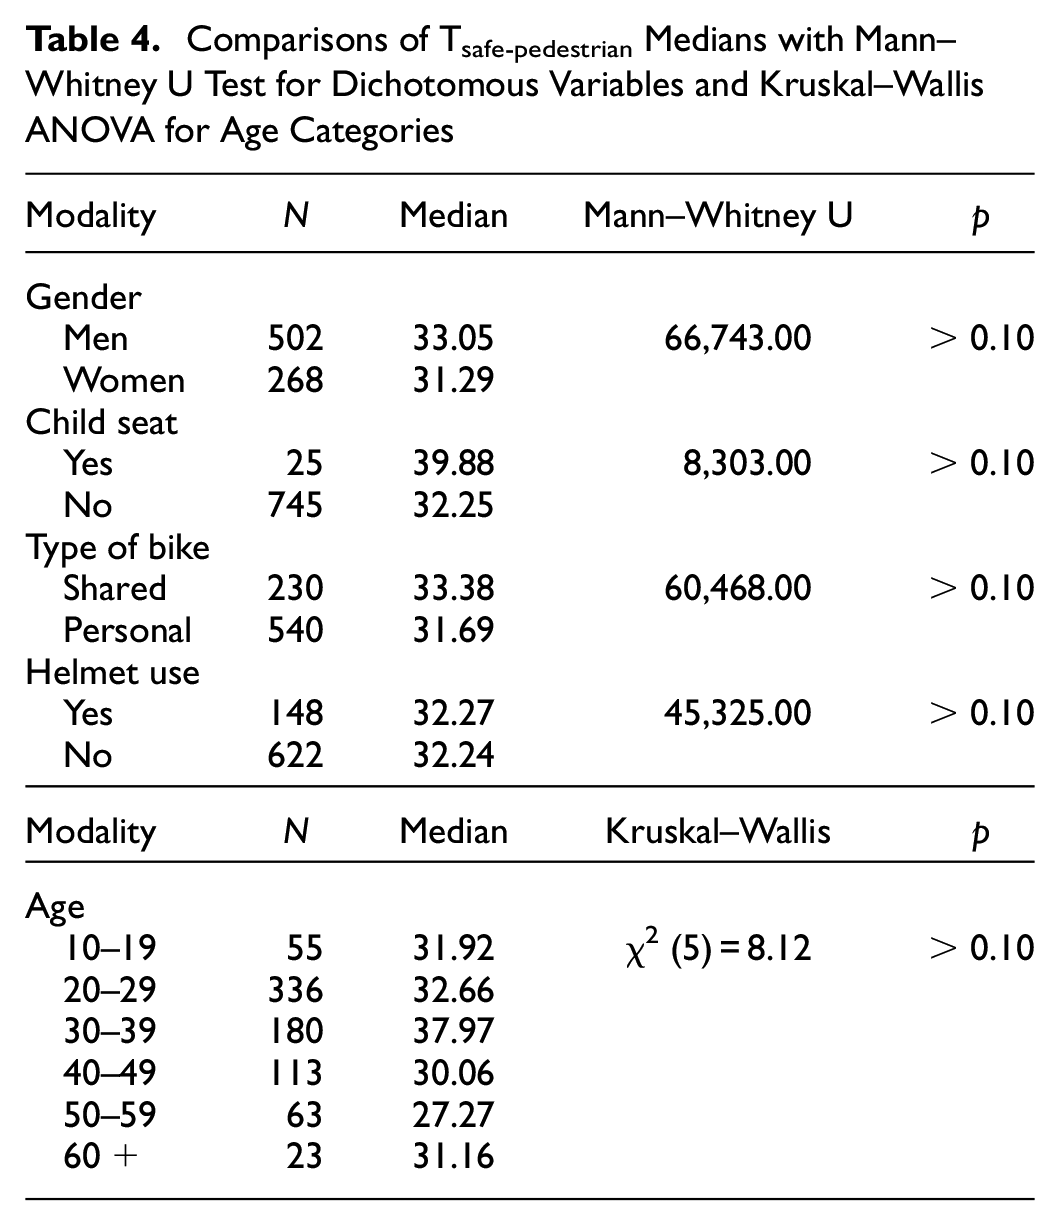
Possible differences on Tsafe according to dichotomous independent variables (i.e., gender, presence of a child seat, type of bike, helmet use) and age were explored respectively with Mann–Whitney U tests and Kruskal–Wallis ANOVA, because median comparison tests are more appropriate for nonparametric distribution of time duration variables than mean comparison tests. We were able to estimate Tsafe-vehicles for 761 cyclists and Tsafe-pedestrians for 770 cyclists. The results for Tsafe-vehicles and Tsafe-pedestrians are presented in Table 3 and Table 4, respectively. For both Tsafe-vehicles and Tsafe-pedestrians, the medians are lower for women (versus men), for the absence (versus presence) of a child seat and for not wearing (versus wearing) a helmet, but none of these differences are significant (all ps > 0.10). Hypothesis 4 and Hypothesis 5 were thus rejected. For both Tsafe-vehicles and Tsafe-pedestrians, the medians are lower for cyclists younger and older than the 30–39 age group, but differences between all age groups are not significant (Kruskal–Wallis χ2 (5) = 8.12, p > 0.10).
Comparisons of Tsafe-vehicles Medians with Mann–Whitney U Test for Dichotomous Variables and Kruskal–Wallis ANOVA for Age Categories
Comparisons of Tsafe-pedestrian Medians with Mann–Whitney U Test for Dichotomous Variables and Kruskal–Wallis ANOVA for Age Categories
Discussion
The aim of this study was to investigate the effect of some sociodemographic variables (i.e., gender, age, parenthood) and the use of a shared or a personal bike on cycling risky behaviors at intersections (i.e., not wearing a helmet, running red lights, crossing an intersection with a short time before a vehicle or a pedestrian passes). Although the advantages of cycling probably surpass the societal and individual risks, these risks remain important to address ( 9 , 10 ). Based on previous studies, we expected to replicate some consistently found associations between individual variables and risky behaviors. We also proposed to examine the potential effect of individual variables on risky behaviors that have previously been rarely or never studied. In this section, we first discuss helmet use and red light running according to 1) gender and age, 2) the presence of a child seat, and 3) the type of bike used (shared or personal). In a second step, we discuss the absence of significant differences observed on Tsafe-vehicles or Tsafe-pedestrians according to the previous variables. Finally, we discuss the main limitations of the study and perspectives before concluding with the main findings and contributions.
We observed that men and young cyclists aged 10–29 were less likely to wear a helmet and more likely to run red lights than women and older cyclists. This is consistent with findings that men and young people (adolescents and young adults) tend to take more risks than women and older people in different types of cycling behaviors and, more generally, in different travel modes but also in non-transport domains ( 34 , 36 , 72–75). This greater risk-proneness among men and young people is classically explained by a combination of evolutionary and biological but also psychosocial factors, such as sensation seeking, anger, or conformity to gender stereotypes and social norms ( 36 , 47 , 72 , 76–78). Cycling-specific road safety campaigns should, therefore, take into account gender and age differences in cycling behaviors and, where possible, tailor their content according to the sociodemographic characteristics of the targeted cyclists. As gender differences in helmet use are inconsistent across studies, a meta-analysis examining the possible influences of the studies’ methodology (observational versus self-reported measures), cultural factors, and helmet laws on observed results would be welcome.
Compared with cyclists without a child seat, cyclists with a child seat were more likely to wear a helmet, while no differences were observed for red-light running and Tsafe-vehicles or Tsafe-pedestrians. Thus, parents may be more aware of some risks when cycling, especially head injuries, and not only when a child is present. This may be explained by the mandatory helmet law for children under 12, including passengers, introduced in France in 2017. Future research should investigate whether parenthood can influence other cycling behaviors and disentangle the effects that are related to parenthood in general from those that are related to the presence of a child seat in particular.
As consistently observed in previous studies, bikeshare users were less likely to wear a helmet ( 15 ). Indeed, only 7.6% of bikeshare users wore a helmet, compared with 37.9% of personal bike users. This lower rate may be because of the low accessibility of helmets and that they are not provided with the bike ( 15 , 17 ). Providing helmets for cyclists to pick up and leave with the bike for subsequent users seems to be an interesting solution. However, it would be desirable for such a system to address the challenge of providing helmets of different sizes, or which can be adjusted, while at the same time meeting health and hygiene requirements (especially in the context of a pandemic). The low use of helmets could also be explained by their bulkiness and unattractive appearance ( 79 ). In fact, several innovative models of bicycle helmet have been developed by the industry in an attempt to reduce problems related to space, transportation, comfort, and aesthetics. However, to the best of our knowledge, no evidence-based intervention to increase helmet use among bikeshare users has been reported ( 15 ). It is, therefore, important to develop and test the effectiveness of such interventions. For example, interventions targeting bikeshare users could be based on raising awareness of the risks of head injury, promoting the benefits of some innovative helmets, and facilitating their physical and financial accessibility.
No significant difference was found between bikeshare and personal bike users for red-light running after stopping or slowing down, but more frequent red-light running without stopping or slowing down were observed among bikeshare users, compared with personal bike users. This result is consistent with the two observational studies that have found more risky behaviors among shared than personal bike users ( 42 , 58 ). However, in their observational study, Richardson and Caulfield found no significant difference in the rate of red-light running without waiting, as well as after waiting, among bikeshare users, compared with personal bike users ( 59 ). In addition, the lower occurrence of bicycle injury among bikeshare users, compared with personal bike users, found by Fishman and Schepers, and Hwang et al. suggest that bikeshare users may be more cautious, although non-behavioral factors may also explain this finding ( 56 , 57 ). Further studies based on individual data and on different risk behaviors, and taking into account possible confounding variables, are needed to conclude whether there are differences in risk behaviors between shared and personal bike users. If one of the two populations of cyclists is more likely to take risks, it would be necessary to determine to what extent this is a result of individual differences such as sociodemographic or psychosocial variables, or to differences external to cyclists such as the type of trip made or the characteristics of the road infrastructure used. This could be used to identify which profile of cyclist should be prioritized for awareness campaigns, or to tailor the content of campaigns according to the profile of cyclist.
Regardless of cyclist characteristics, only 27.8% of cyclists in the present study stopped for the entire duration of the red light and waited for it to turn green before passing through. Red-light running is a relatively common behavior among cyclists and is rarely punished in most cultures, making it acceptable and normative ( 59 ). Encouraging the perception of significant disapproval of this behavior (i.e., a negative injunctive norm) through communication and education may be an effective strategy ( 51 ). Deterrence of red-light running could be another effective strategy, for example through random on-the-spot fines for cyclist offenders at busy and popular intersections ( 51 ). Countermeasures can also be based on innovations in planning and traffic management. One example is the “green wave” for cyclists, which is a traffic signal control scheme that synchronizes the phase between two or more traffic signals (at consecutive intersections) ( 80 ). If road users pass through the green wave at the appropriate speed, they will continue to receive a green light, facilitating the continuous flow of traffic in one main direction and helping to maintain a safe distance between cyclists and motorized vehicles.
With regard to the relationship between risky behaviors, cyclists who wore a helmet were less likely to run a red light, after stopping or slowing down, than those who did not wear a helmet. No differences were found in Tsafe according to helmet use. In line with most previous studies, these results do not support the risk compensation hypothesis in which helmeted cyclists would tend to take greater risks than unhelmeted cyclists ( 60 ). However, a risk compensation effect from motorists could occur when cyclists wear a helmet. Some studies found that motorists are more likely or more willing to dangerously overtake cyclists wearing a helmet than a cyclist not wearing a helmet, but this finding was not supported in a re-analysis of the data or in another study ( 81 – 85 ). Although the existence and extent of this effect has not yet been sufficiently documented, it is important to be aware of the possible negative effects that wearing a helmet can have.
No significant differences were found in Tsafe-vehicles and Tsafe-pedestrians according to sociodemographic variables and risky behaviors. Crossing an intersection on a bike with a very short distance to the next vehicle or pedestrian coming from the side may be perceived as very dangerous by all cyclists, regardless of the individual variables considered in the present study. Otherwise, very low values for Tsafe-vehicles and Tsafe-pedestrians, which may correspond to near misses, were not well represented in the study data, as these events are rare. These data limitations could also explain the absence of significant differences according to sociodemographic variables and risky behaviors. Therefore, future studies with larger samples would be welcome to further investigate the relevance of considering such a variable in observational studies.
Some other limitations of the present study must be acknowledged. The data may be affected by classic methodological limitations associated with observational studies. First, the presence of the cameras may have affected the behavior of some individuals (e.g., stopping at the red light, or slowing down). However, this kind of bias can be mitigated by the significant size of the sample. Visibility at junctions (which is not zero) could explain the relatively high rate of red-light running without stopping or slowing down. The speed of cyclists who did not stop or slow down at traffic lights was not measured. These last two characteristics (i.e., visibility and speed) are important for understanding the extent to which a traffic offense involves risky behavior. Other limitations were partially mitigated by coding cyclists’ behaviors from video, rather than in real time, by two teams of two or three coders with a minimum intercoder reliability of 80%. The age of the cyclists was estimated in 10-year categories to limit errors. However, this coding method does not allow age to be treated as a continuous variable and, therefore, reduces the statistical power of the analyses performed. As a helmet is likely to hide a part of the face, it is possible that errors in estimating gender and age are more significant for cyclists wearing a helmet than for cyclists not wearing a helmet. Also, the observations do not allow distinguishing between helmets in good condition and those that have lost their protective properties as a result of previous impact, deterioration, or age. A study on 672 cyclists in New Zealand found that, while 89.9% of cyclists agreed or strongly agreed that a helmet should be replaced after a fall, 36.8% said that they had continued to wear a helmet after an accident ( 86 ). Another limitation is that the presence of a child seat on the bike is a proxy for parenthood that can be approximate. Parents with young children may prefer not to transport them by bike, or may not need to, and therefore may not fit a child seat on their bike. Future observational studies would benefit from asking cyclists directly about their parental status.
Differences in cycling experience (e.g., frequency of use, type of environment traveled, purpose of trip, traffic accidents, or near-miss experiences) were not accounted for in the present study and may partially explain gender and age differences in risk taking ( 87 , 88 ). For example, greater cycling experience, which may be a characteristic of older cyclists, may lead to overconfidence in one’s own cycling skills and, subsequently, greater risk taking ( 33 ). Errors in the estimation of individual characteristics and possible confounding effects of cycling experience could be avoided in future studies by mobilizing an observer to stop cyclists after the observation site to propose them a short questionnaire. Only 82 cyclists (2.4%) were equipped with a child seat, resulting in low statistical power to be able to detect differences in the occurrence of risky behaviors. Cyclists’ behaviors at traffic signals could be more finely coded in future studies. Indeed, running a yellow light could be coded as a risky or non-risky behavior depending on the distance from surrounding vehicles and pedestrians.
The generalizability of the conclusions drawn from this study should be considered with caution as it was based solely on a single city center in France, on limited schedules, and on urban cyclists who may not be representative of cyclists in rural or in other cultural settings. The implementation of certain measures to promote cyclist safety can also have different effects depending on the culture, such as the requirement to wear a helmet ( 21 ). Finally, it is important to remember that the risks for cyclists depend not only on their individual characteristics, but also on the behavior of other road users (especially motorized vehicles) and their interaction with cyclists (e.g., speeding, failure to keep a safe distance), and on the configuration and quality of the road infrastructure (e.g., no cycle lane separated from traffic, no advanced stop line), which should be taken into account in future research and concrete measures to improve safety. For example, the promotion of helmet use should be complemented by actions targeting elements other than cyclists, as the effectiveness of helmets depends on the type of accident ( 23 ).
Conclusion
In conclusion, this observational study corroborates that young and men cyclists take more risks, by wearing a helmet less often and running red lights more often than older and women cyclists. The results also suggest that being a parent, and not just cycling with a child passenger, is associated with more frequent helmet use. Compared with personal bike users, bikeshare users are less likely to wear a helmet and more likely to run a red light, without stopping or slowing down. Finally, no difference was found between cyclists in relation to crossing an intersection with a short time before a vehicle or a pedestrian passes.
Several results of this study call for further research to understand why certain individual variables have an inconsistent effect on risky behaviors, from one study to another, and to what extent this may be explained by methodological and cultural considerations. Identifying the mechanisms that explain the effects of these variables on risk taking, such as biological and psychosocial factors, seems important for the development of road safety interventions. Furthermore, these results encourage the development of interventions tailored to the sociodemographic and psychological characteristics of cyclists. Importantly, such measures should not conflict with support for other measures targeting road users likely to be a source of danger for cyclists, or aimed at improving road infrastructure.
Footnotes
Author Contributions
The authors confirm contribution to the paper as follows: study conception and design: F. Varet, V. Lenglin, A. Deplancke, M. Pelé; data collection: L. Barbet, F. Delvaux, L. De Wever, C. Maravat, J. Paulet., E. Privat; analysis and interpretation of results: F. Varet, M. Pelé; draft manuscript preparation: F. Varet, V. Lenglin, A. Deplancke, M. Pelé. All authors reviewed the results and approved the final version of the manuscript.
Declaration of Conflicting Interests
The author(s) declared no potential conflicts of interest with respect to the research, authorship, and/or publication of this article.
Funding
The author(s) disclosed receipt of the following financial support for the research, authorship, and/or publication of this article: This work was supported by the “Fondation MAIF pour la recherche” and by the “Région Hauts-de-France,” via the UCL-HDF protocol.
