This paper presents a comparison between the two-dimensional finite element and experimental results of shaking table tests on six one-third-scale polymeric strap or polymeric geostrip reinforced walls performed under seismic excitation at given peak ground accelerations . The effects of initial tangent stiffness or the stiffness of polymeric strap material and the slope angle of the cohesionless backfill material on the maximum relative displacement, , of the reinforced earth wall, the values of the horizontal incremental dynamic earth pressure with distributions, acceleration responses, horizontal dynamic active earth pressure coefficient and maximum dynamic tensile forces were assessed in this study. Moreover, the vertical dynamic active earth pressure coefficients and the angles of the resulting dynamic active force with horizontal were predicted from the numerical analysis. Closely matched responses between the experimental and numerical studies were attained. Data obtained from experimental and numerical studies illustrated that increasing the slope angle of the cohesionless backfill material resulted in an increase in the values of horizontal displacement in the walls, and in dynamic earth pressure and root mean square acceleration . Increasing the stiffness of the reinforcement material caused a decrease in horizontal reinforced earth wall displacement and increases in dynamic earth pressure. In addition, the conventional pseudostatic limit equilibrium methods overestimated values, whereas they underestimated values, and the recommended values by current design codes were not found to be compatible with the numerical and experimental results.
Reinforced earth- or mechanically stabilized earth (MSE) walls have been widely used around the world as an alternative to conventional retaining walls (e.g., basement-, gravity retaining-, cantilever retaining-, counterfort walls) because of several benefits such as being ecologically friendly, their low cost, aesthetic appearance, drainage face, simpler and faster construction processes, flexible and ductile behavior, and their higher static and seismic performance. Reinforced earth walls consist of a facing element (e.g., a segmental or full height panel, modular block, metallic facing, gabion, soil bag, geosynthetic wrap face), inextensible (e.g., steel grid or -strip) or extensible reinforcement (e.g., geotextile, geogrid, polymeric strap), and backfill soil.
Many reinforced earth walls have withstood higher seismic loads than originally designed to withstand and exhibited excellent seismic performance after strong earthquakes have taken place (1–4), when conventional retaining walls have collapsed, suffered structural damage, or both. Thus, nowadays reinforced earth walls are preferred in earthquake-active areas. The seismic performance of reinforced earth walls has been studied for approximately three decades using both physical models of shaking table tests (5–29) and numerical analyses (30–48).
The traditional pseudostatic limit equilibrium method has been utilized to assess the internal and external stability of reinforced earth walls under dynamic loads. Various design codes (49–51) use the Mononobe–Okabe approach to evaluate dynamic earth pressure with distribution and resultant dynamic active forces acting against the reinforced earth walls, although the seismic performance of reinforced earth walls is very complex (52, 53). In addition, the design codes recommend use of the empirical horizontal seismic coefficient based on the research by Segrestin and Bastick (54). The experimental and numerical studies in the literature report that dynamic earth pressure and the resultant horizontal dynamic active force values determined by current seismic design codes (49–51) can lead to overestimations. Moreover, the horizontal seismic coefficient values recommended by the design codes result in either under- or overestimated values because is affected by factors such as the stiffness and length of the reinforcement, the horizontal and vertical distance of the reinforcement, reinforcement connection type, facing type, and the relative density of backfill material. Thus, research interest in predicting actual dynamic earth pressure, horizontal displacement, and horizontal seismic coefficient values to save time and money was inevitable, given the increasing demand for reinforced earth walls.
Numerical investigations to determine the seismic behavior of reinforced earth walls are more economical, practical, and time-saving than physical, shaking table test models. Numerical analyses additionally provide much more realistic results than traditional pseudostatic limit equilibrium solutions because they contain sophisticated constitutive models that simulate the stress–strain behavior of materials and deliver comprehensive information on displacement, stress, strain, and force for any location. However, numerical analyses require verification of the finite element (FE) models from the results of physical reinforced earth wall models in shaking table tests.
The strength of steel strips or grids lessens over time because of corrosion, which leads to tensile failure, pullout failure, or excessive wall displacement. Several researchers investigating reinforcement type on the construction cost of reinforced earth walls (55, 56) have reported that polymeric strap reinforcement is the most economical type among the extensible and inextensible reinforcement options. Polymeric straps are composed of polyester tendons that are made of polyester fibers covered by a polyethylene sheath. They are the preferred reinforcement material because of the durability of the polyethylene sheaths, their cost efficiency, high tensile and pullout capacity, low creep characteristics, and owing to their high resistance to mechanical damage, chemicals, microorganism attacks, hydrolysis, and ultraviolet radiation (5, 16). Few studies (5, 15–17) have examined the seismic response behavior of MSE walls reinforced with polymeric straps, although several studies have reported on the seismic behavior of other geosynthetic- or steel-reinforced walls.
No assessments comparing physical models of shaking table tests with numerical studies of the dynamic behavior of polymeric strap reinforced earth walls were found in the literature. In present study, a validated FE model or numerical analysis procedure was used to simulate the seismic performance of the polymeric strap reinforced wall. The numerical analyses procedure was based on the physical model tests conducted by Yünkül and Gürbüz (5). The influence of material stiffness , the slope angle of the cohesionless backfill material , and peak ground acceleration on the horizontal displacement of the reinforced earth wall, in addition to the acceleration response, horizontal dynamic earth pressure, and maximum dynamic tensile force on the reinforcements were predicted in the numerical simulation and compared with the physical model of the shaking table. Moreover, in the numerical analyses, the angles formed by the resultant dynamic active force acting behind the MSE wall in a horizontal direction were also calculated. The results obtained from the numerical analysis were subsequently compared with MSE wall design codes (49–51) and recommendations in the literature.
Description of Reduced-Scale Shaking Table Test
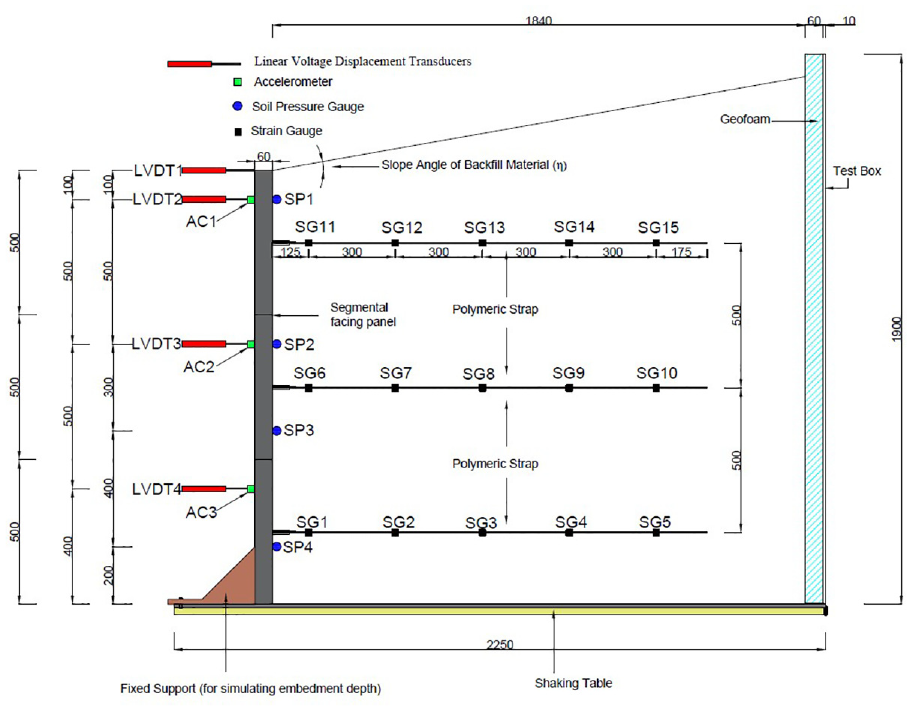
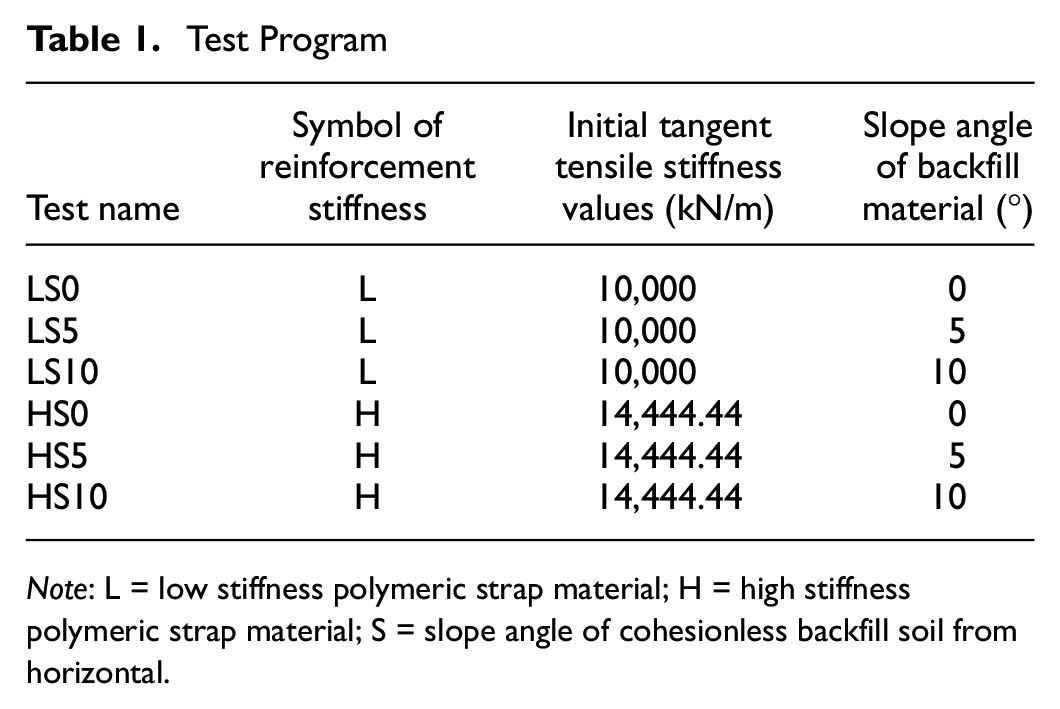
Reduced-scale shaking table tests on a 1.5-m high polymeric strap reinforced wall with a segmental facing panel, performed by Yünkül and Gürbüz, were selected for validation of the numerical analyses (5). An embedment depth of 200 mm was simulated by the fixed support in accordance with FHWA recommendations (49). Four linear voltage displacement transducers (LVDTs), three accelerometers (ACs), four miniature soil pressure gauges (SPs) and 15 strain gauges (SGs) were used to collect the test results; the schematic geometry of the experimental study is presented in Figure 1. Two types of polymeric strap with an initial tangent tensile stiffness of 10,000 or 14,444.44 kN/m, a constant length of 1.5 m, and three slope angles of = 0°, 5°, and 10° were chosen to investigate the effects of stiffness reinforcement and slope angle of the sandy backfill soil on the seismic behavior of the reinforced earth wall. The shaking table test program is presented in Table 1, and a detailed description of the physical reinforced earth wall model can be found in the article by Yünkül and Gürbüz (5).
Note: L = low stiffness polymeric strap material; H = high stiffness polymeric strap material; S = slope angle of cohesionless backfill soil from horizontal.
Finite Element Model
In the present study, a commercial FE program (PLAXIS 2D) for the plane–strain element case with a 15-node triangular element was used to simulate the results of the shaking table tests. PLAXIS 2D is the preferred software of several researchers (30, 31, 44, 45, 57–64) for the analyses of reinforced earth wall problems owing to its numerous soil models, structures, ability to perform sensitivity analyses, and good agreement with laboratory and field test results.
In general, reinforced earth walls are modeled via either discrete or composite FE methods. The discrete FE method models the reinforcement material and backfill soil individually, whereas the composite FE method models the reinforced soil mass as a homogenous composite material. It is reported that the discrete FE method better simulates the soil–reinforcement interface behavior and stress concentration than the composite FE method (30, 65). Thus, the polymeric strap reinforced wall models were developed in this study with PLAXIS 2D software using the discrete method.
Backfill Soil, Support, and Shaking Table Base Properties
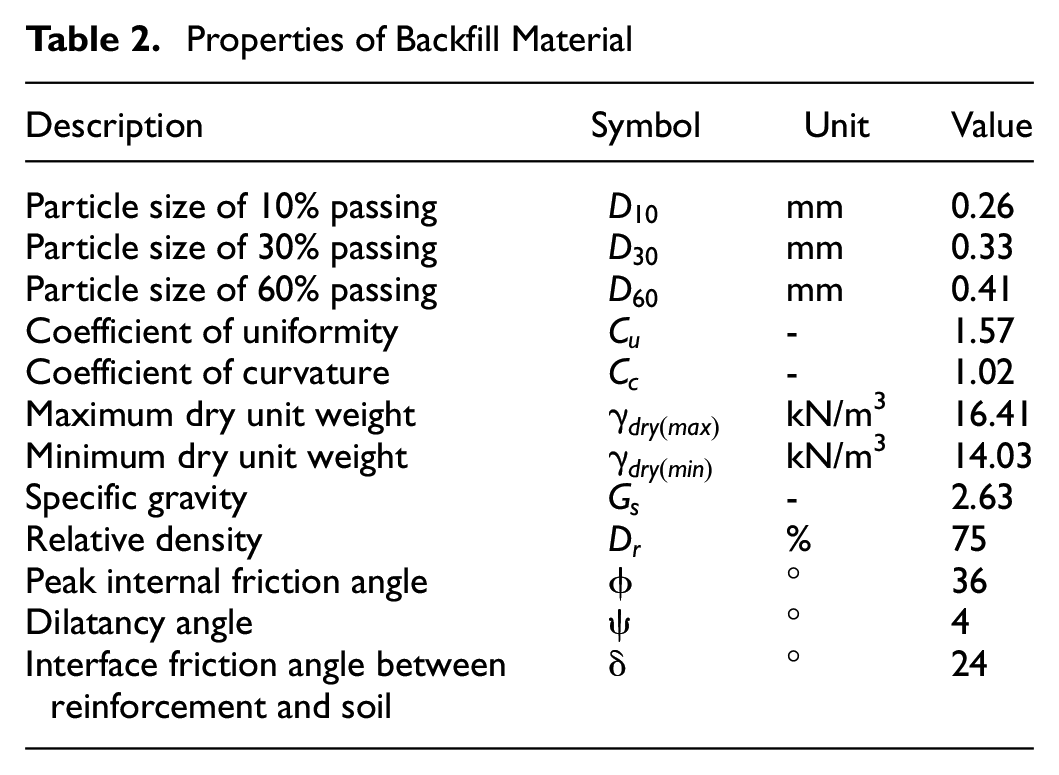
The backfill soil used for the shaking table tests was classified as poorly graded sand according to the Unified Soil Classification System (66). A series of direct shear tests (DSTs) under 50, 100, and 200 kPa at a relative density of 75% were performed, yielding a peak internal friction angle of 36° and a dilatancy angle of 4°. The properties of the dry silica SP are summarized in Table 2.
Properties of Backfill Material
Description
Symbol
Unit
Value
Particle size of 10% passing
mm
0.26
Particle size of 30% passing
mm
0.33
Particle size of 60% passing
mm
0.41
Coefficient of uniformity
-
1.57
Coefficient of curvature
-
1.02
Maximum dry unit weight
kN/m3
16.41
Minimum dry unit weight
kN/m3
14.03
Specific gravity
-
2.63
Relative density
%
75
Peak internal friction angle
°
36
Dilatancy angle
°
4
Interface friction angle between reinforcement and soil
°
24
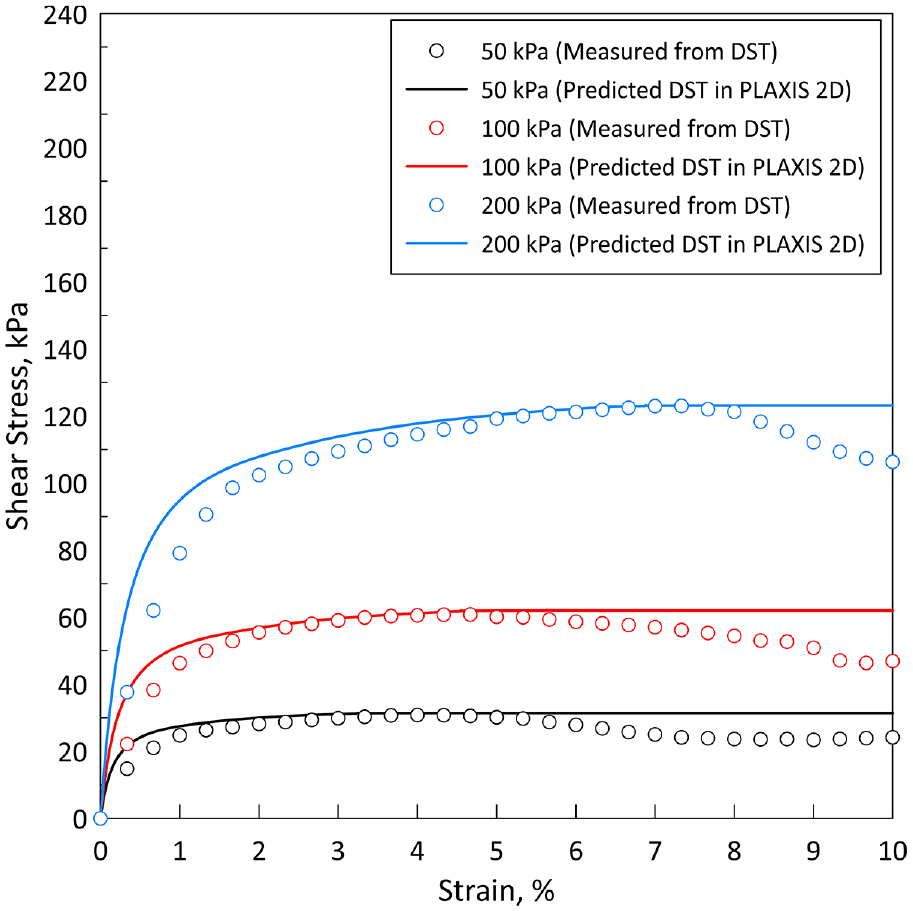
Backfill soil in the numerical analyses was modeled as hardening soil (HS). The HS model is a stress-dependent elastoplastic second-order hyperbolic model that simulates the nonlinear behavior of cohesionless soil perfectly in contrast to elastic perfectly-plastic soil models (67). Furthermore, the HS model with small-strain stiffness (HSS) displays a significant issue with overshooting, which refers to the uncontrolled reset of the loading memory following small unloading–reloading cycles (30). Thus, several researchers (30, 45, 57, 60, 61) have recommended using the HS model to simulate the behavior of reinforced earth walls. In this study, low cohesion at a value of 1 kPa was selected in the HS model to prevent early soil yield in low confining pressure areas. The HS model parameters were calibrated with the DST results (Figure 2). Figure 2 shows that the HS model simulated the stress–strain behavior of the soil up to peak shear strength, although this model did not simulate the post-peak softening behavior of soil. In this numerical study, the shaking table base platform was modeled using linear elastic traditional steel parameters. In addition, fixed support was modeled as very rigid linear elastic material to simulate shaking table conditions. The properties of the backfill soil, shaking table platform, and fixed support are presented in Table 3.
Shear stress–strain curve of backfill soil obtained from numerical analysis and experimental studies under confining pressures of 50, 100, and 200 kPa
Parameters Used in Numerical Analyses
Parameter
Symbol
Unit
Value (DST)
Backfill material/hardening soil
Unit weight
kN/m3
15.74
Cohesion
kN/ m2
1
Reference secant modulus
kN/m2
30,000
Reference tangent modulus for primary oedometer loading
kN/m2
30,000
Reference modulus for unloading and loading
kN/m2
90,000
Exponential power
-
0.5
Peak internal friction angle
°
36
Dilatancy angle
°
4
Failure ratio
-
0.9
Poisson’s ratio for unloading–reloading conditions
-
0.2
Shaking table base platform/linear elastic
Unit weight
kN/m3
77
Modulus of elasticity
kN/m2
200 × 106
Poisson’s ratio
-
0.3
Fixed support/linear elastic
Unit weight
kN/m3
15
Modulus of elasticity
kN/m2
11 × 106
Poisson’s ratio
-
0.3
Note: DST = direct shear test.
Polymeric Strap Material Properties
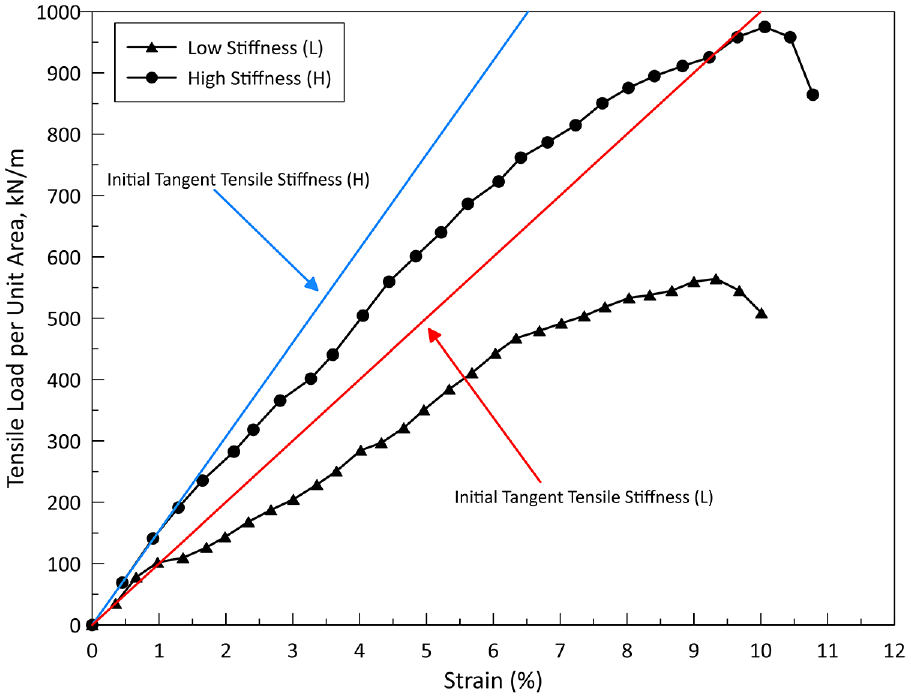
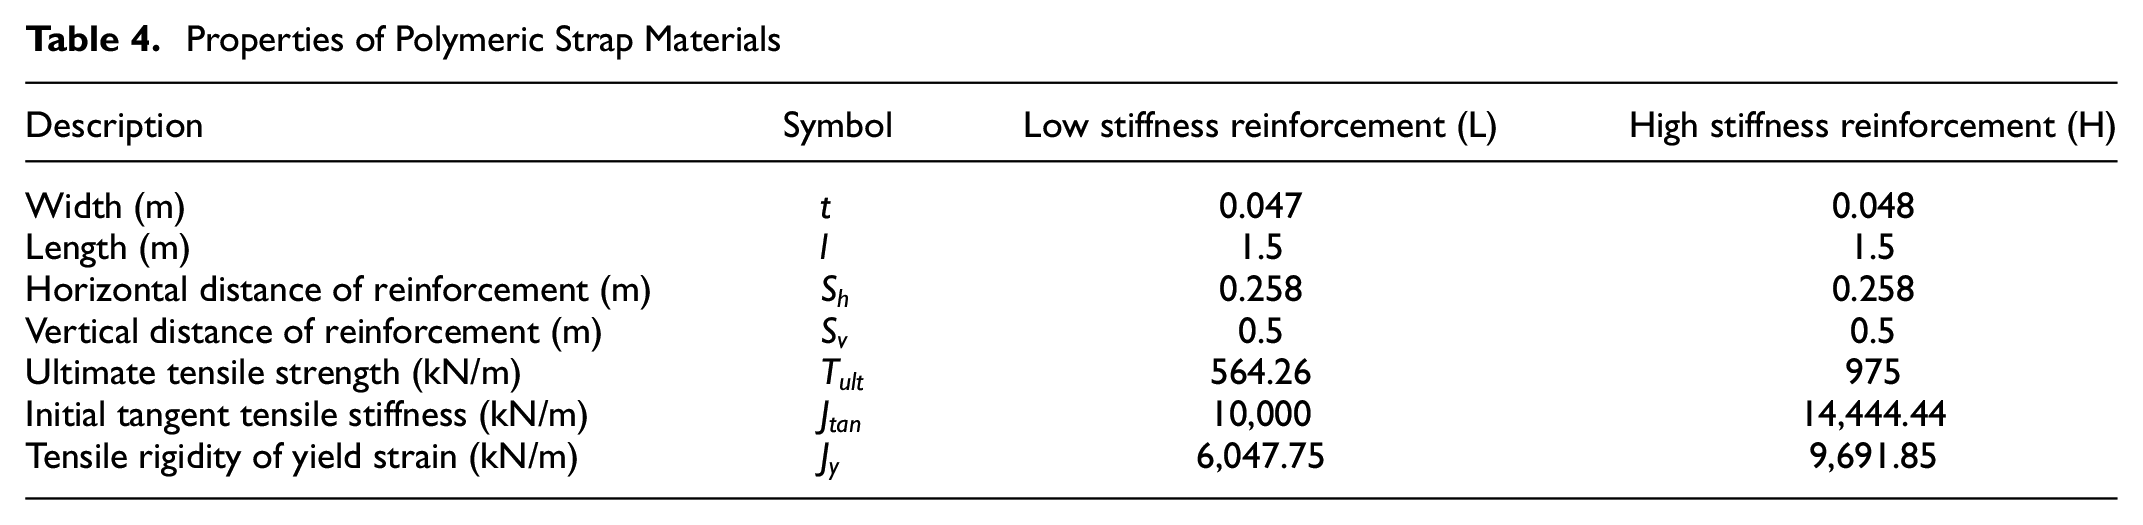
Two types of polymeric strap or geostrip material with different initial tangent tensile stiffness values (i.e., 10,000 kN/m or 14,444.44 kN/m), which is the slope of the initial straight-line portion of the tensile load per unit area-strain curve, were used for the physical model of the reinforced earth wall tests. A series of uniaxial tensile tests were conducted to assess the strength properties of the polymeric strap material according to ISO 10319 (68), the results of which are presented in Figure 3. Yünkül and Gürbüz observed that measured maximum tensile strain values on the reinforcement material surface under dynamic loading were less than 0.3% (5), although the design strain limit of traditional geosynthetic materials (e.g., geogrid, geotextile) is approximately 3% (69). Note, the time-dependent effects of creep on the tensile stiffness and strength of the reinforcement material were not taken into account, as the main objective of this study was to investigate the seismic behavior of the polymeric strap reinforced earth walls. Thus, the initial tangent tensile stiffness values were preferred for the numerical analyses in this study, according to secant tensile stiffness values. Furthermore, several researchers have used a single tensile stiffness value instead of varying it according to strain levels to simulate the reinforcement materials of an MSE wall in numerical analyses (30–32, 34, 35, 38, 41–45, 57–64). The reinforcement material properties are summarized in Table 4.
Results of the uniaxial tensile tests of polymeric strap reinforcements used in this study.
Properties of Polymeric Strap Materials
Description
Symbol
Low stiffness reinforcement (L)
High stiffness reinforcement (H)
Width (m)
0.047
0.048
Length (m)
1.5
1.5
Horizontal distance of reinforcement (m)
0.258
0.258
Vertical distance of reinforcement (m)
0.5
0.5
Ultimate tensile strength (kN/m)
564.26
975
Initial tangent tensile stiffness (kN/m)
10,000
14,444.44
Tensile rigidity of yield strain (kN/m)
6,047.75
9,691.85
In several cases, researchers have opted for geosynthetic reinforcement materials as the geogrid structural element (30, 31, 44, 45, 57–61, 63, 64). Thus, the polymeric strap materials in this study using PLAXIS 2D were modeled as a geogrid structural element, which is a linear elastic material with axial stiffness but without bending stiffness. One-dimensional strip elements in a two-dimensional (2D) representation were converted into an equivalent continuous element. The equivalent linear elastic axial stiffness of the polymeric strap materials were calculated via Equation 1 (62).
The values of low- and high stiffness polymeric strap material in this study were obtained as 1,821 and 2,687 kN/m, respectively. The interface elements were also defined between the polymeric strap and backfill soil material. The roughness of the interaction between the polymeric strap material and backfill soil was modeled for its strength reduction factor (Equation 2), which was taken as 0.61 in this numerical study.
Segmental Facing Panel Properties
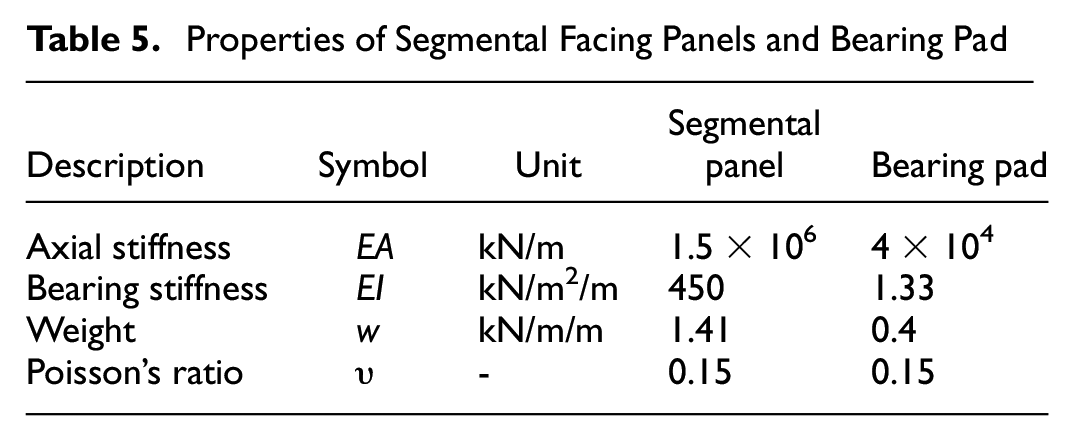
Three segmental facing panels with a dimension of 500 × 60 mm (height × thickness) were used with 10-mm thick internal and external threads (bearing pads) in the shaking table test. In the analyses, the segmental facing panels and bearing pads were modeled as linear elastic beam elements. The properties of the segmental facing panels and bearing pads in the FE model are presented in Table 5.
Properties of Segmental Facing Panels and Bearing Pad
Description
Symbol
Unit
Segmental panel
Bearing pad
Axial stiffness
kN/m
1.5 × 10⁶
4 × 10⁴
Bearing stiffness
kN/m2/m
450
1.33
Weight
kN/m/m
1.41
0.4
Poisson’s ratio
-
0.15
0.15
Damping Parameters
The amount of energy that can be dissipated during seismic excitation is referred to as hysteretic damping. Considering damping parameters in analyses for simulating real soil behavior in FE modeling is therefore recommended. Damping is identified using Rayleigh damping parameters that contain natural circular frequencies and damping ratios (Equation 3),
where
is Rayleigh damping matrix,
is mass matrix,
is stiffness matrix, and
and are the Rayleigh coefficients.
The Rayleigh coefficients and are obtained by Equations 4 and 5, respectively.
where is damping ratio, and are first and second modes of natural circular frequencies, respectively.
A damping ratio of 5%, selected in this study, is recommended for reinforced earth walls with a wall height of less than 10 m (70). Several researchers (31, 34–41, 43–45, 47, 71–73) have used damping ratios between 3% and 5% for numerical analyses of retaining walls. The first and second modes of natural circular frequencies were determined according to Hashash and Park’s study: the and coefficients were determined to be 0.588 and 0.00011 respectively (74).
Geometry, Boundary Condition, and Meshing
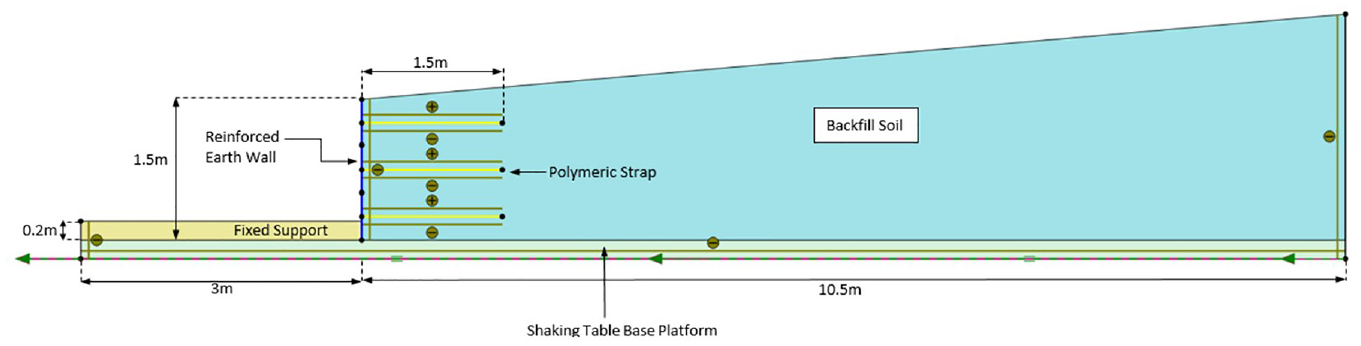
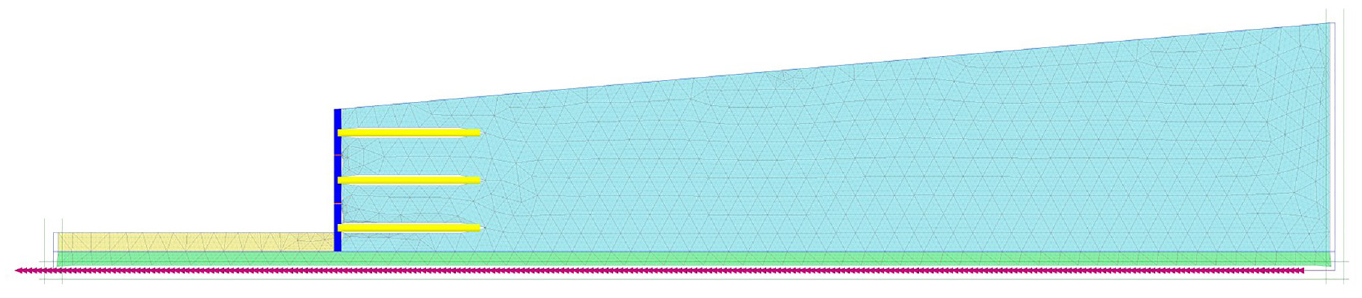
The numerical model consisted of a 1.5-m high reinforced earth wall with a combination of 0.5-m high segmental facing panels, 0.01-m high bearing pads, 1.5-m long polymeric strap material, 0.2-m high fixed support, a shaking table base platform, and backfill soil. Boundary extensions have been proposed by several researchers (30, 31, 41, 44, 45, 71–73) for the validation of test results or seismic analyses of reinforced earth walls in PLAXIS 2D. Therefore, a large domain extending 3m (2H) to the left and 10.5m (7H) to the right, where H refers to the height of the MSE wall, was used in this study to minimize boundary effects in the FE analyses. The cross section of the FE model is presented in Figure 4.
Finite element model of polymeric strap reinforced earth wall.
The standard absorbent limit boundary condition proposed in the PLAXIS 2D Reference Manual (75) for dynamic analyses was applied to the FE model in this study. The free-field boundary condition was used for the vertical sides of the FE model to absorb the waves from the input seismic excitation and to prevent the reflection of waves inside the soil bodies. The compliant base boundary condition was applied at the base of the FE model to absorb downward compression and shear waves.
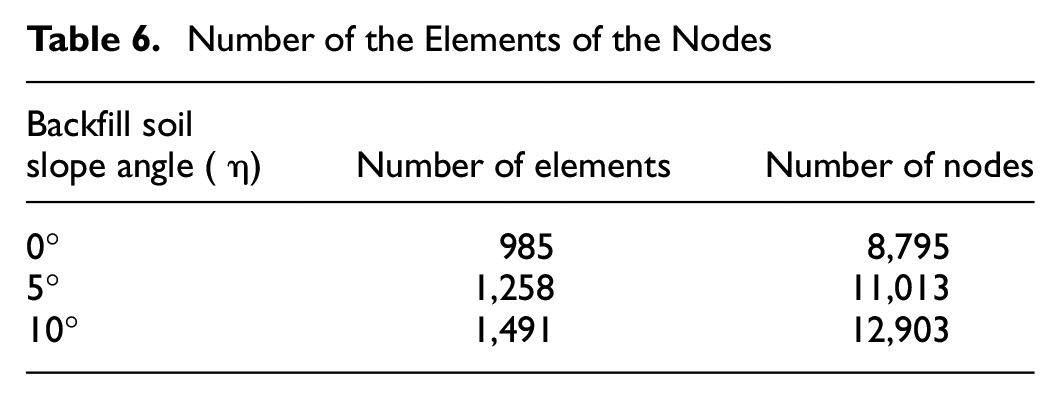
Clusters in PLAXIS 2D were divided into a triangular mesh, as this was mesh chosen for automatic generation. The element stiffness matrix is assessed integration of 12 stress or Gauss points. Stresses are calculated at Gauss points, whereas displacement and acceleration responses are calculated at nodes. The discretization of mesh element size for dynamic analyses in FE models is important to accurately simulate wave propagation. A maximum mesh element size for dynamic analyses is recommended by Kuhlemeyer and Lysmer (see Equation 6) (76). The objective of the mesh generation in this study was to obtain the best agreement with the measured results and satisfy Equation 6 after a trial–error set was applied to assess appropriate mesh size. In the FE analyses, an average element size of 0.21 m was used. The number of elements and nodes in the numerical model for the various slope angles ( = 0°, 5°, and 10°) are summarized in Table 6 and an example of FE mesh is displayed in Figure 5.
where
= maximum element size,
= wave length,
= wave velocity, and
= maximum frequency of the input motion.
Number of the Elements of the Nodes
Backfill soil slope angle ( )
Number of elements
Number of nodes
0°
985
8,795
5°
1,258
11,013
10°
1,491
12,903
Finite element mesh for numerical analyses.
Input Seismic Excitation
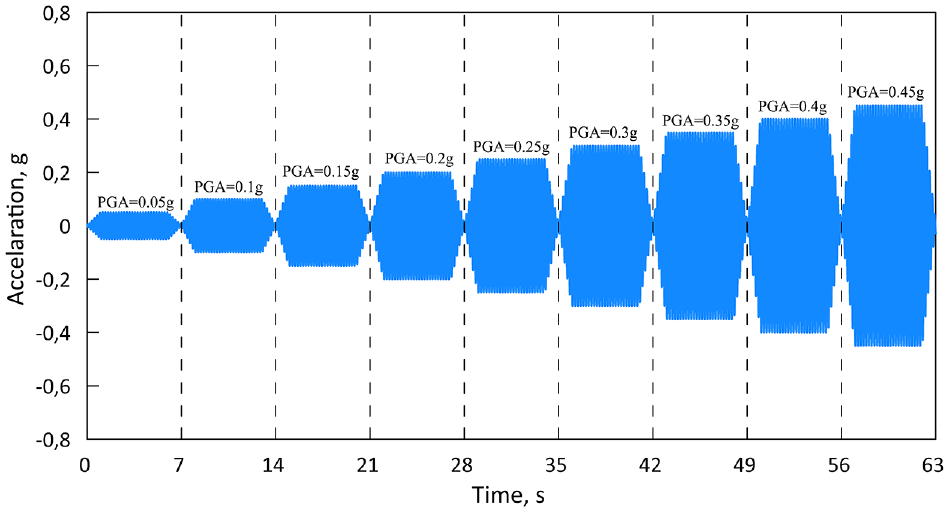
The input seismic motion was applied at the base of the FE model at equal time intervals of 0.01 s. The harmonic sinusoidal value was initially set at 0.05 g and then increased by 0.05 g every 7 s until a value of 0.45g was attained with a 5 Hz predominant frequency and input motion was completed in 63 s. Each seismic excitation consisted of 35 cycles (i.e., 25 steady cycles, 5 ramp-up cycles, and 5 ramp-down cycles) to simulate the behavior of a real earthquake. The input base acceleration–time history utilized in this numerical analyses is shown in Figure 6.
Input motion acceleration–time history.
Results and Discussion
The results of the FE analyses were compared against the measured performance of the shaking table test reported by Yünkül and Gürbüz (5). The following responses of the polymeric strap reinforced walls were chosen for comparison: 1. horizontal displacement of reinforced earth wall facing, 2. horizontal dynamic earth pressure, 3. responding acceleration, and 4. maximum dynamic tensile force. Our observations are discussed in turn in the following sections. Furthermore, consistent with the results obtained from the FE analyses, vertical dynamic active earth pressure coefficient values and the angle of the resultant dynamic active force acting behind the MSE wall with the horizontal were examined in this study.
Horizontal Displacement of the Polymeric Strap Reinforced Wall
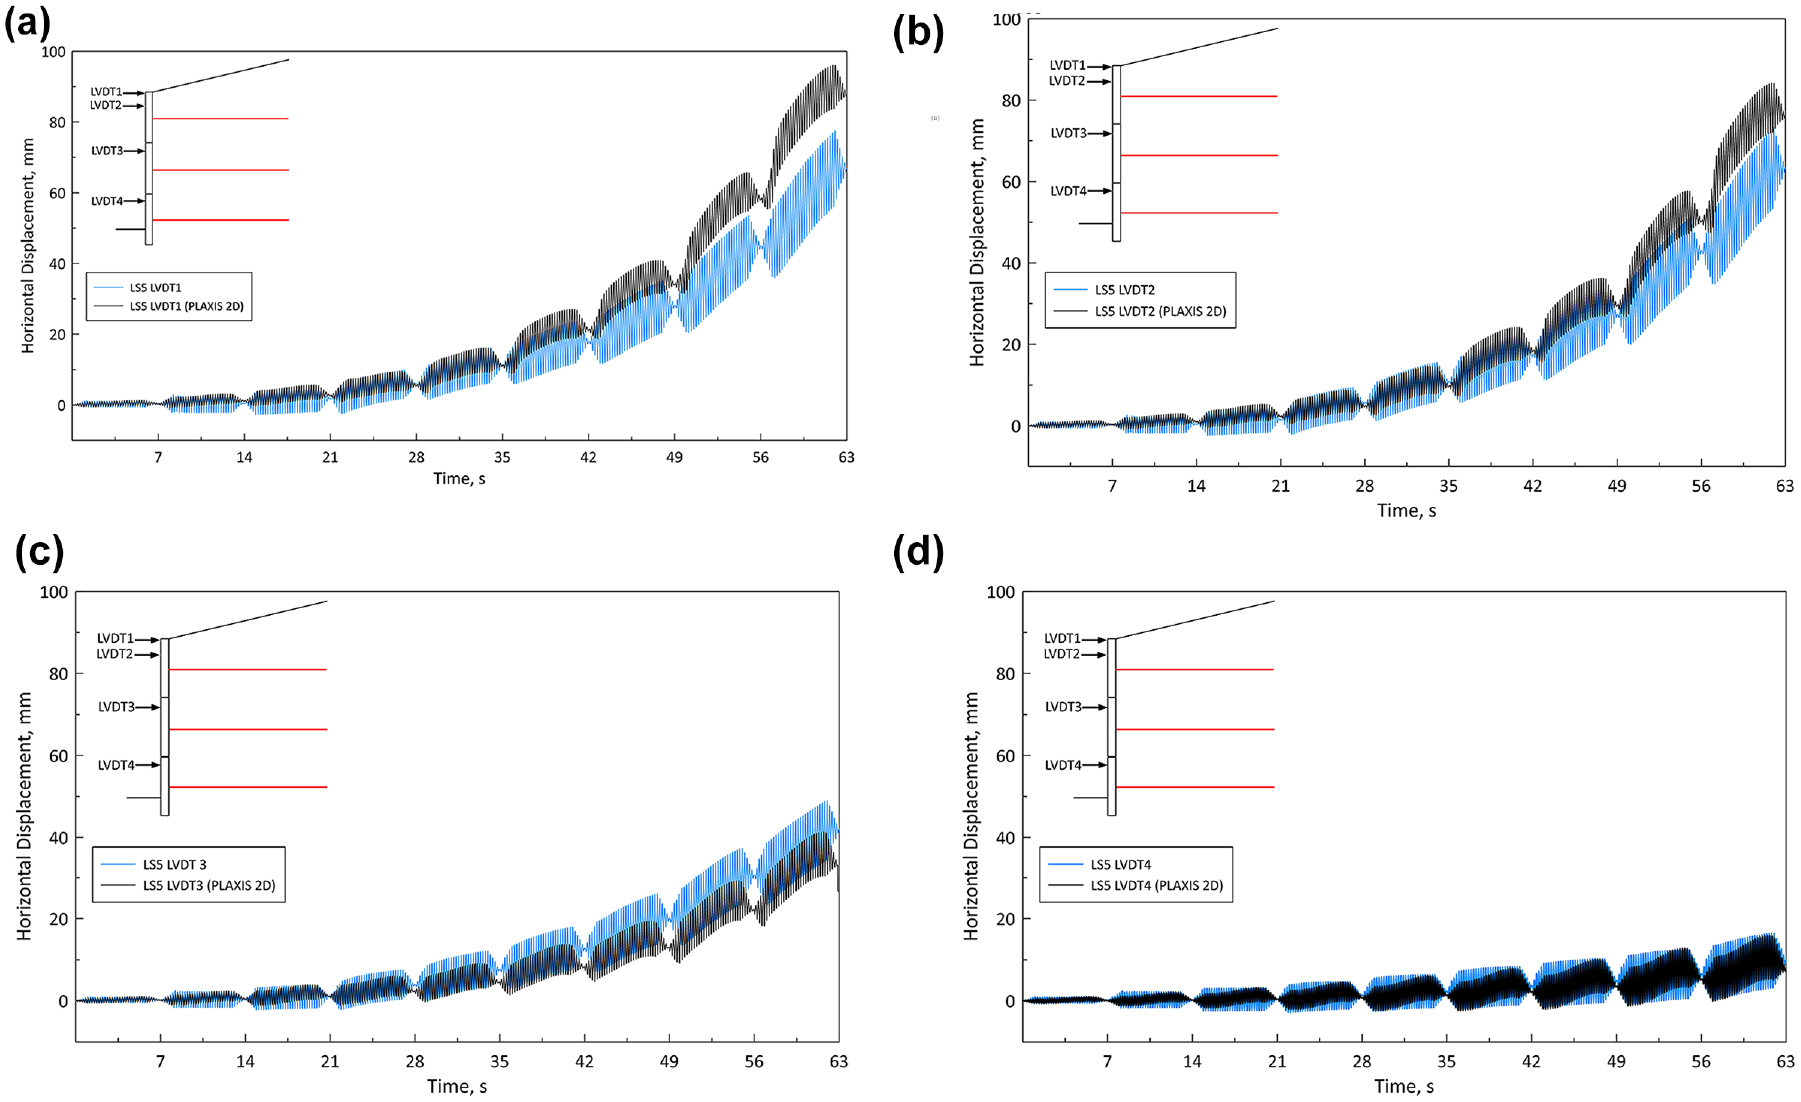
Four LVDTs were installed at 400, 900, 1,400, and 1,500 mm from the bottom of the reinforced earth wall (LVDT4, LVDT3, LVDT2, LVDT1) to assess the effects of the polymeric strap material stiffness, slope angle of the sandy soil, and on the horizontal displacement of the wall surface (Figure 1). A typical total horizontal displacement–time history of experimental and numerical studies is presented in Figure 7.
Total horizontal displacement–time history of experimental and numerical studies for Test LS5: (a) LVDT1, (b) LVDT2, (c) LVDT3, and (d) LVDT4.
Horizontal displacement of the reinforced earth wall increased from the bottom to the top of the wall, and no bulging on the wall surface was observed in the experimental studies or numerical analyses. Sliding of the reinforced earth wall was prevented by fixed support during seismic excitation. Horizontal displacement increased with an increase in the slope angle of the cohesionless backfill soil and value because of the increment of dynamic earth pressure behind the reinforced earth wall and the MSE wall inertial force. The MSE wall reinforced with a high stiffness polymeric strap showed less horizontal displacement than the MSE wall reinforced with a low stiffness polymeric strap. However, the influence of polymeric strap material stiffness and SP slope angle were found to be negligible when values were less than 0.15 g. A possible reason for this could be the quasi-elastic deformation behavior of reinforced earth walls at values lower than 0.15 g (5).
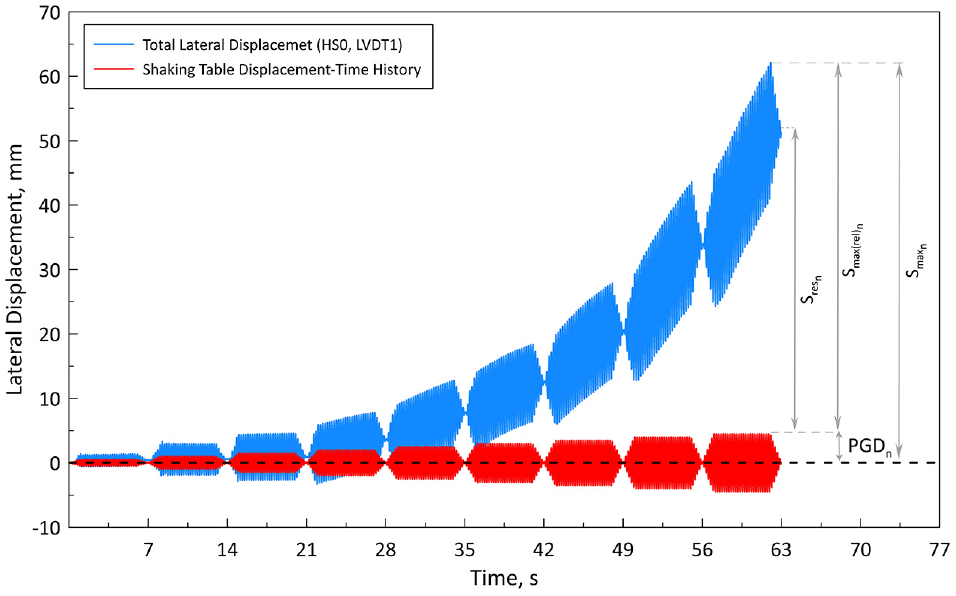
Relative displacement is obtained by subtracting the input ground displacement values from the total horizontal displacement measured by the LVDTs or FE results. Similarly, maximum relative displacement, , as presented in Figure 8, is defined as the difference between the values of total peak horizontal displacement and input peak ground displacement (Equation 7). Comparisons of the experimental and numerical maximum relative displacements from six tests are presented in Figure 9. The values trend of the experimental study along the height of reinforced earth wall was similar to that of the numerical studies. The experimental and numerical results for the values were compatible for the slope angle of 0° (LS0 and HS0), however, there were differences with an increase in the slope angle of the sandy backfill soil. This may be because backfill soil is considered to be a rigid body with plastic deformation in PLAXIS 2D, although soil actually consists of particles and does not exhibit rigidity. The HS model did not simulate some of the more complex aspects of soil behavior (e.g., hysteresis variation in the shear modulus, damping, soil softening). Moreover, the 10-mm thick internal and external threads in the segmental facing panel may have restricted horizontal displacement of the reinforced earth wall at higher PGA values in the experimental study; it did not seem to model this situation realistically in the 2D FE analysis. Similarly, several researchers (30–34, 37–39, 46, 47, 71) reported that numerical analyses predicted higher horizontal displacement than the shaking table test.
where is the excitation number (n = 9 in this study).
Presentation of , , and values obtained from LVDT1 at Test HS0 in PLAXIS 2D.
Comparison of experimental and numerical maximum relative displacements at different locations: (a) LS0, (b) HS0, (c) LS5, (d) HS5, (e) HS10, and (f) LS10.
Dynamic Earth Pressure of the Polymeric Strap Reinforced Wall
The distributions and values of horizontal dynamic earth pressure play crucial roles in the stability of reinforced earth walls. Thus, four miniature SPs (SP1, SP2, SP3, and SP4) were installed on the back of the reinforced earth wall (Figure 1) to investigate the effects of the slope angle of the sandy backfill soil, polymeric strap material stiffness, and input on the horizontal dynamic earth pressures values and distributions.
The horizontal dynamic earth pressure values in FE analyses were obtained at the Gauss points nearest the positions of the miniature earth pressures (SP1 to SP4) behind the reinforced earth wall. A typical dynamic earth pressure-time history (presented in Figure 10) consists of the component of total horizontal dynamic earth pressure, , horizontal residual dynamic earth pressure, , and horizontal incremental dynamic earth pressure, . The difference between total horizontal- and horizontal residual dynamic earth pressure is referred to as horizontal incremental dynamic earth pressure (Equation 8). Horizontal residual dynamic earth pressure appears because of both irreversible displacement of the reinforced earth wall and densification or loosening of the cohesionless granular backfill soil. Thus, several researchers (8, 20, 22, 24, 71, 77–79) have proposed using horizontal incremental dynamic earth pressure as the value behind the wall when input ground accelerations of gradually increasing amplitude are implemented. A typical total horizontal dynamic earth pressure-time history of experimental and numerical studies is shown in Figure 11. Satisfactory agreement was found between the measured and computed dynamic earth pressure behavior.
where is the number of each seismic excitation (n = 9 in the present study).
Plot of total horizontal dynamic earth pressure, horizontal residual dynamic earth pressure, and horizontal incremental dynamic earth pressure-time history from SP3 miniature pressure gauge at Test HS5 in PLAXIS 2D.
Total horizontal dynamic earth pressure-time history of experimental and numerical studies for Test LS0: (a) SP1, (b) SP2, (c) SP3, and (d) SP4.
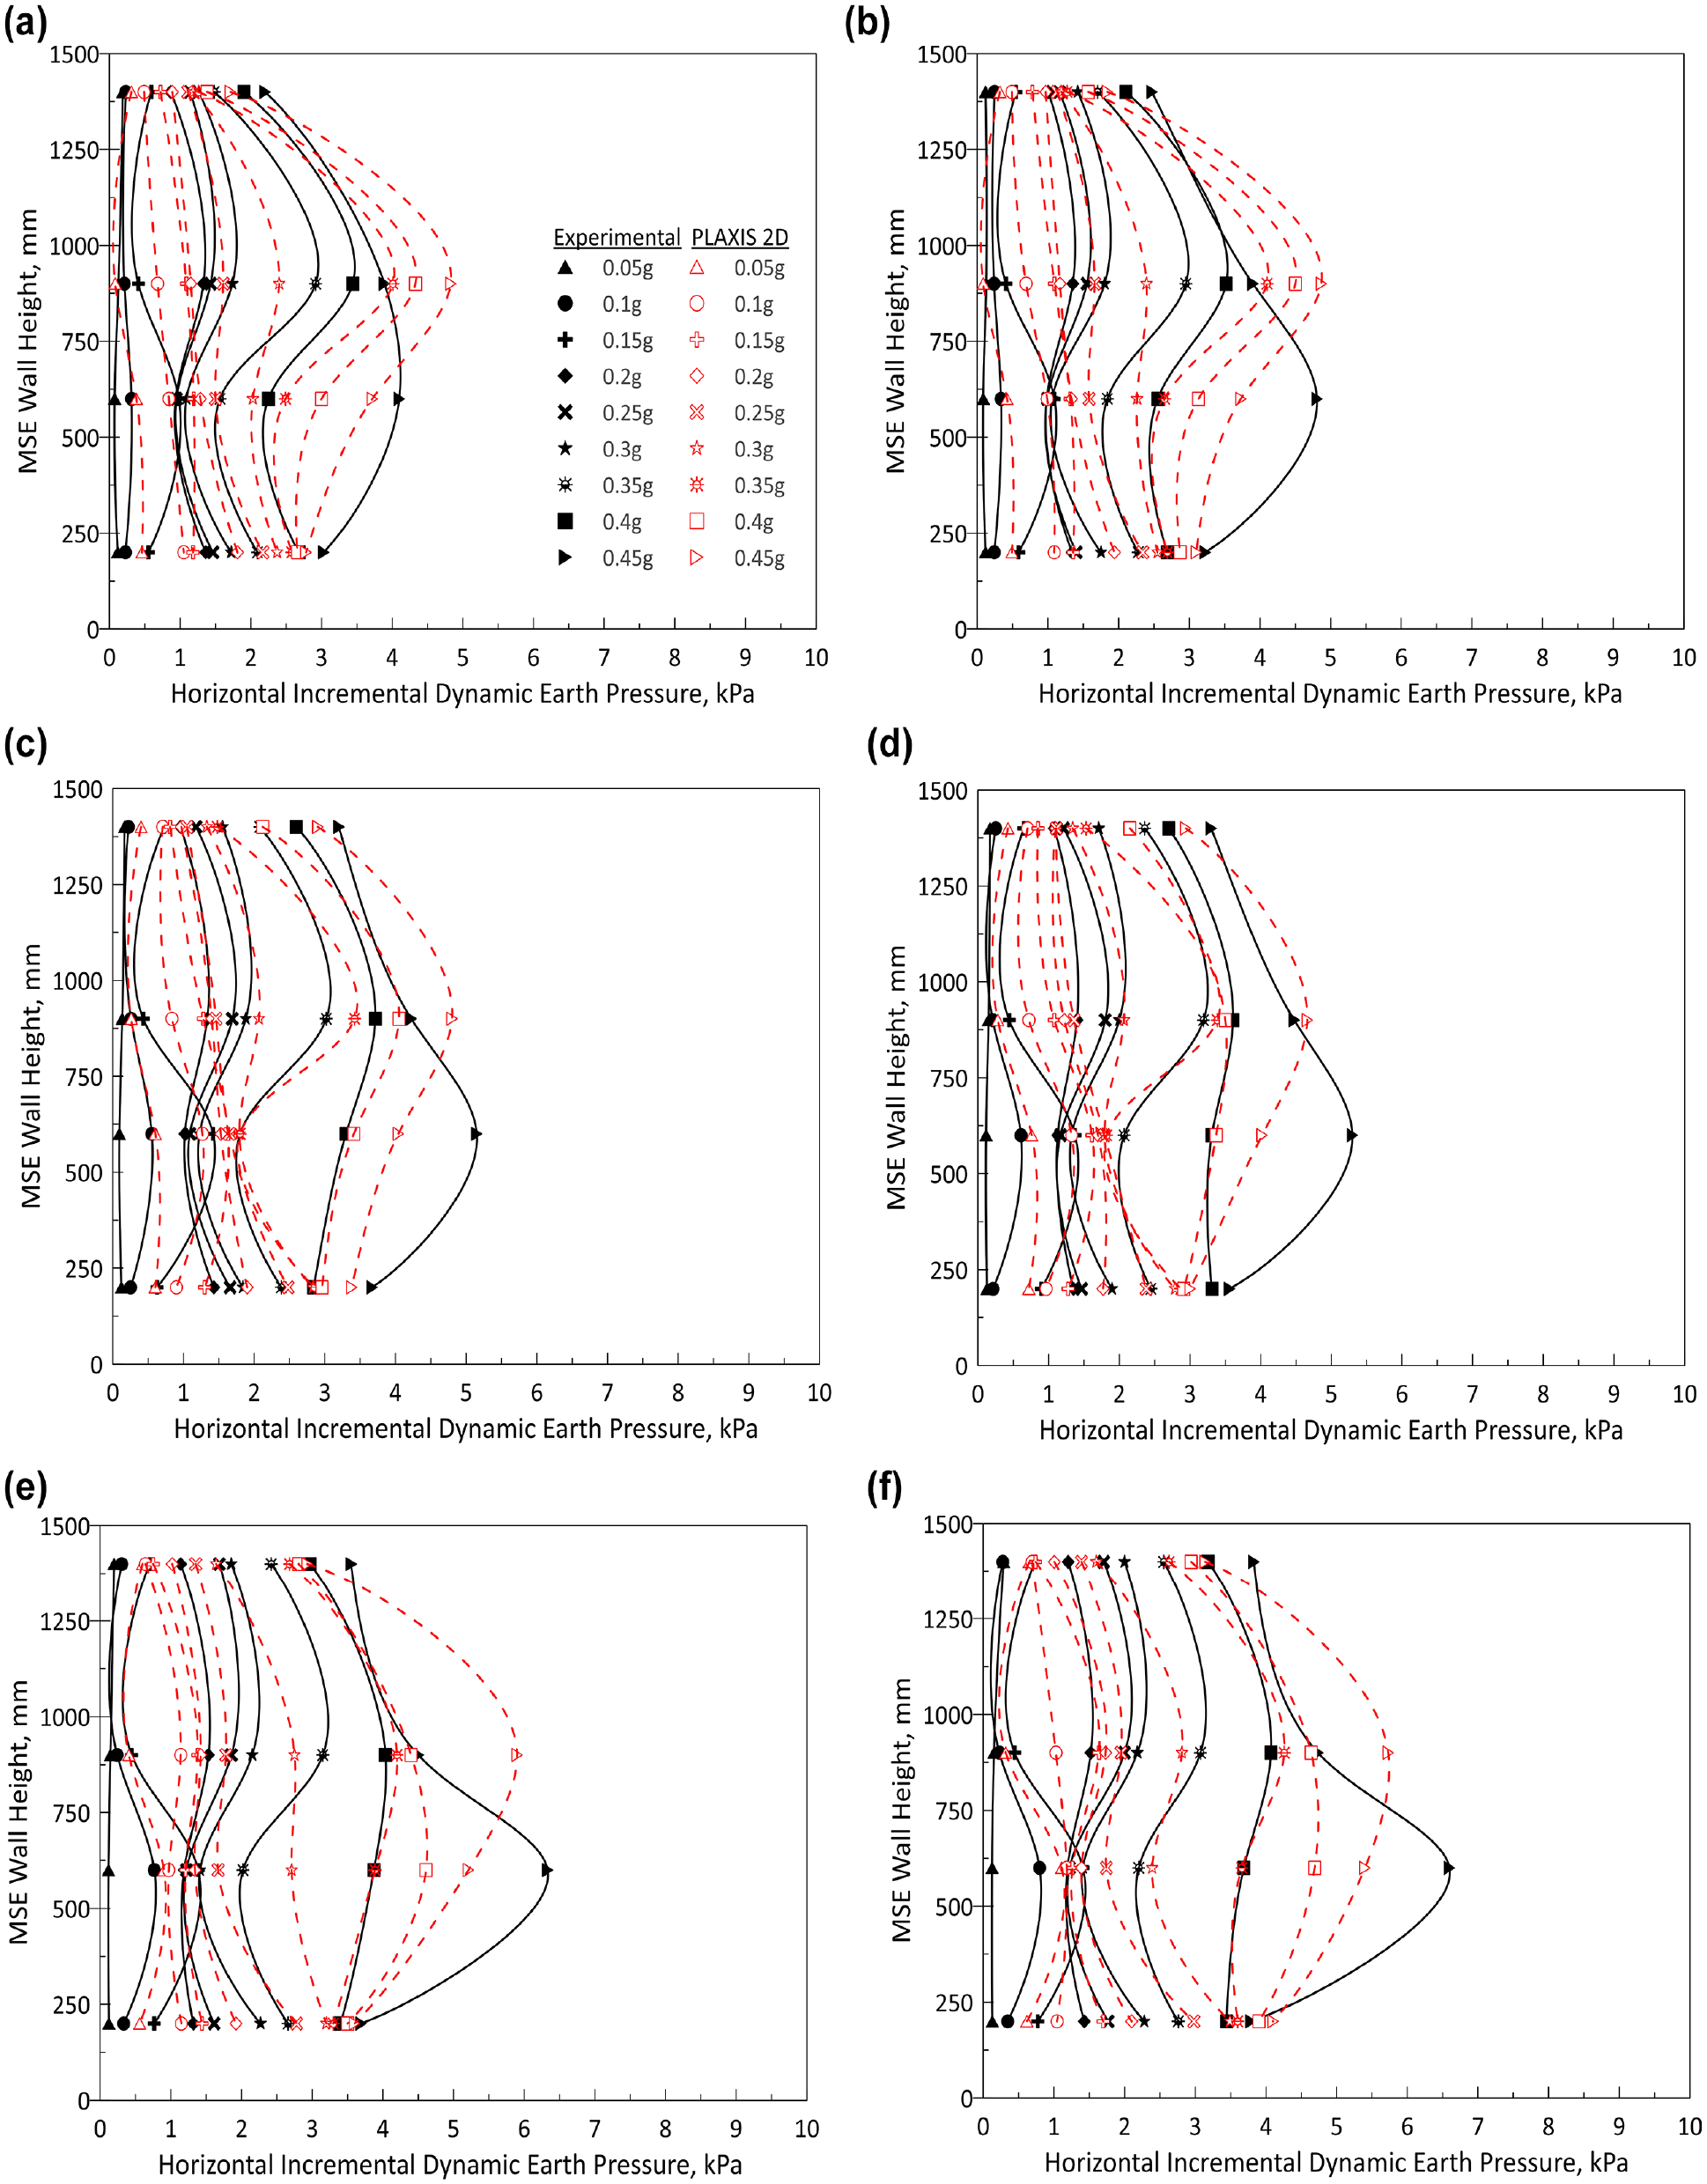
The magnitude and distribution of values behind the MSE wall for experimental and numerical studies are presented in Figure 12. It was determined that values increased with increasing , reinforcement material stiffness, and slope angle of the backfill soil in both experimental and numerical studies. The is because increasing stiffness of the polymeric strap material results in a reduction in the flexibility of the reinforced earth wall and this situation yields to increases in the horizontal incremental dynamic earth pressures behind the reinforced wall (80). Furthermore, an increase in the slope angle of the backfill soil increases soil weight inside the failure surface, which yields to higher dynamic forces on the reinforced earth wall (5). The experimental and numerical studies showed that the dynamic earth pressure distribution along the height of the wall did not have a regular distribution geometry, although several researchers (81, 82) and design codes (49–51) suggest using triangular, rectangular, and trapezoidal dynamic earth pressure distributions under seismic excitation. In general, the measured distribution of the six tests and calculated distribution were quite compatible. The slight quantitative mismatch between the numerical and experimental results could be attributed to the HS model used in this study and to certain complex properties of simulated cohesionless soil behavior in relation to interactions between reinforced earth walls and soil, soil particles movement, densification or loosening of sandy backfill soil, hysteresis variation of the shear modulus, damping, and so on. Moreover, the connections of the polymeric straps to the segmental panels under laboratory conditions were not perfectly simulated because it was not possible to model the steel loop embedded in the middle of the segmental facing panel, or the wrapping of the polymeric strap around the steel loop in the 2D FE analysis. This may have affected both the values and distributions of the horizontal incremental dynamic earth pressure behind the reinforced earth wall.
Comparison of experimental and numerical horizontal incremental dynamic earth pressure behind of the reinforced earth wall: (a) LS0, (b) HS0, (c) LS5, (d) HS5, (e) LS10, and (f) HS10.
In design codes, conventional pseudostatic limit equilibrium approaches are proposed for assessing the dynamic forces acting behind reinforced earth walls (49–51). These approaches propose a constant horizontal dynamic active earth pressure coefficient along the retaining wall height for calculation of the horizontal dynamic active force . values were therefore obtained from the area of the horizontal incremental dynamic earth pressures , which were measured using the miniature SPs (SP1, SP2, SP3, SP4) in the experimental studies, and calculated at the stress or Gauss points closest to position of the miniature earth pressures behind the MSE wall in the numerical analysis. The values of in this study were determined via Equation 9 using back-calculations of the measured and calculated horizontal dynamic active force . In this study, the results of two popular pseudostatic limit equilibrium approaches—Mononobe–Okabe (52, 53) and Mylonakis et al. (83)—were compared with the results of the experimental and numerical data in Figure 13 in relation to . Traditional approaches can result in an overestimation of values, whereas the calculated values of from the numerical analyses were higher than the results of measured from experimental studies. The ratio of the calculated values of from the FE analysis to the measured values of from the shaking table test at lower values of (0.05 to 0.15 g) were observed to vary from 1.82 to 3.85. Meanwhile, the ratio of the values of calculated to measured yielded 0.9 to 1.3 as values higher than 0.15 g. In other words, at high values, the experimental and numerical values of were quite compatible. Similarly, several researchers (35, 38, 43, 46, 71, 73) have reported that FE models predict higher dynamic earth pressure than experimental results. This could be a result of the soil model used in the PLAXIS 2D software: as stated, backfill soil is considered to be rigid in the soil constitutive models. Although soil particles do not behave rigidly. The interaction between soil particles cannot be simulated in FE models. Furthermore, the properties of backfill soil material (e.g., relative density, friction angle, soil modulus) could vary under seismic action during the shaking table test.
where is unit weight of the soil, and is height of the reinforced earth wall.
Comparison of the experimental, numerical, and theoretical values at different values: (a) , (b) , and (c) .
Vertical dynamic active forces () obtained from the vertical incremental dynamic earth pressure () values (nearest location of SP1, SP2, SP3, and SP4) acting behind the MSE wall were calculated within the scope of this study using PLAXIS 2D. Similar to the prediction of horizontal incremental dynamic earth pressure, vertical incremental dynamic earth pressure was determined by subtracting total vertical dynamic earth pressure from the vertical residual dynamic earth pressure. In the numerical analysis, the vertical dynamic active earth pressure coefficients () were calculated with Equation 10 through the back-calculation of predicted values. In general, the vertical dynamic active force is lower than the horizontal dynamic active force for traditional retaining walls such as gravity, cantilever, and nonyielding walls. However, a larger mass of soil resulting in the exertion of downward forces on the reinforcement and reinforced earth wall connections, referred to as down-drag forces, causes an additional vertical force during seismic excitation (19). Furthermore, increasing the slope angle of the backfill material affects the vertical effective stresses, which lead to a higher vertical dynamic active force behind the MSE wall. El-Emam and Bathurst reported that the stiffness of the reinforcement material affects the vertical dynamic active force behind the MSE wall (19). Thus, based on the results obtained from the numerical analyses, it was observed that the vertical dynamic active forces and vertical dynamic active earth pressure coefficients were 1.07 to 1.79 times higher than the horizontal dynamic active forces or horizontal dynamic active earth pressure coefficients , depending on the slope angle of the backfill material and stiffness of the polymeric strap material. Similar results have been reported by El-Emam and Bathurst (19) and Xu et al. (48). Figure 14 illustrates the values of the vertical dynamic active earth pressure coefficient acting on the back of the MSE wall from the numerical analysis compared with those obtained using the traditional Mononobe–Okabe method (52, 53), which is frequently preferred by current design codes (49–51) in the seismic design of MSE walls, and the Mylonakis et al. (83) method. It was determined that the values increased with increases in values, slope angle of the backfill material (), and stiffness of polymeric strap . The recommendations of Mononobe–Okabe (52, 53) and Mylonakis et al. (83) were found to underestimate values as compared to the numerical study results, because conventional limit equilibrium methods do not take into account the down-drag force behind the MSE wall.
Comparison of numerical and theoretical values at different values: (a) , (b) , and (c):
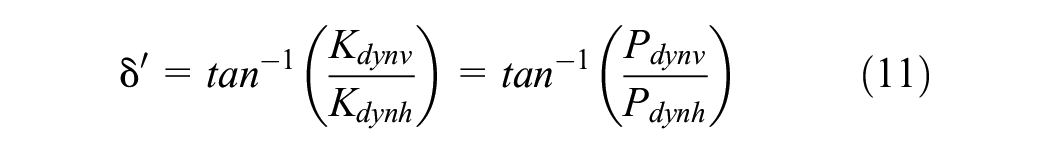
The angle of the resultant dynamic active force acting behind the MSE wall with the horizontal was determined using Equation 11, and the obtained angle values from the FE analysis results are presented in Figure 15. As seen in Figure 15, the stiffness effect of the polymeric strap material and values on the values were negligible, whereas values increased with the increase in the slope angle of the backfill material owing to the increased vertical effective stresses. The calculated average values from FE analysis for the polymeric strap reinforced earth wall with slope angles of 0°, 5°, and 10, were 50.3°, 53.6°, and 55.33°, respectively. These angle values exceeded the recommendations of current MSE wall design codes (49–51), which may be why the reinforced earth wall showed impressive performance even under values higher than those they were initially designed for.
where is the angle of the resultant dynamic active force with horizontal, and is the arctangent.
The angles of the dynamic active force with horizontal obtained from numerical studies at different values.
The location of the dynamic force () is an important parameter for the external and internal stability of reinforced soil walls. The normalized location of the horizontal dynamic active force determined from experimental and numerical studies is presented in Figure 16. It was observed that the numerical and experimental values were compatible with each other. Moreover, the values of , reinforcement stiffness, and slope angle of the cohesionless backfill material had no significant effect on the values of . The calculated and measured values were close to 0.5 as proposed by FHWA (49) and the National Concrete Masonry Association (NCMA) (50). However, the measured and calculated values were quite far off the 0.33 recommended by Monobe–Okabe (52, 53) and the 0.6 recommended by Seed and Whitman (81).
Comparison of experimental, numerical and theoretical location at different values.
Acceleration Response of the Polymeric Strap Reinforced Wall
Determination of the acceleration response values with distributions under seismic excitation have important effects on the dynamic design and performance of reinforced earth walls. The comparison of horizontal acceleration response-time history of both the experimental and numerical studies are presented in Figure17. Although agreement could be seen between the experimental and numerical studies, the acceleration amplification of the experimental studies was approximately between 0.94 and 1.33 times higher than that of the numerical studies. Several researchers have observed similar results (30, 35, 37–39, 46, 47). This difference between the numerical and experimental studies could be attributed to the assumptions made in the HS modeling.
Acceleration response-time history of experimental and numerical studies for Test HS0: (a) AC1, (b) AC2, and (c) AC3.
Acceleration amplification factors are favored to visualize and determine the distribution and magnitudes of acceleration responses at various wall or soil heights. Several researchers (5, 7, 9, 16, 17, 21, 22, 25–28, 30, 84) have used the root mean square acceleration amplification factor (Equation 12), recommended by Kramer, for determination of the acceleration responses because the input acceleration responses contain some noise (85). Thus, the factor in this numerical study was selected. The calculated and measured values of the factors at different elevations of the MSE wall are presented in Figure 18 in relation to reinforcement stiffness, slope angle of the backfill sandy soil and . The distribution of from both the numerical analyses and experimental tests took a nonlinear form and increased from the bottom to the top of the reinforced earth wall. Similar results have been reported by numerous researchers (5, 7, 10–13, 16–22, 24–30, 33, 35, 37–39, 44, 46, 47, 84) in experimental or numerical studies of reinforced earth walls. In general, the values increased with the increasing slope angle of the sandy backfill material and the decreasing stiffness of the strap reinforcement.
where
= acceleration response-time history,
= input ground acceleration–time history,
= duration of each seismic excitation (in present study is 7 s), and
= time interval.
Comparison of experimental and numerical values along the height of the reinforced earth wall at given inputs of : (a) 0.05 g, (b) 0.1 g, (c) 0.15 g, (d) 0.2 g, (e) 0.25 g, (f) 0.3 g, (g) 0.35 g, (h) 0.4 g, and (i) 0.45 g.
Conventional pseudostatic limit equilibrium methods presume constant average values in the design of reinforced earth walls. Bonaparte proposed Equation 13 based on a two-part wedge theorem to assess (86). Segrestin and Bastick (54) and current MSE wall design codes (49, 50) recommend use of Equation 14 for the design of inextensible material reinforced soil walls. El-Emam (87) found the upper (Equation 15) and lower limits (Equation 16) of average amplification factors for geogrid reinforced full height walls. A comparison of the values of the average from the experimental and numerical studies and from recommended Equations 13 to 16 is presented in Figure 19. It was observed that the factor values of the experimental and numerical studies were between the upper and lower limits recommended by El-Emam (87). The equation recommended by FHWA (49) and NCMA (50) resulted in an underestimation of values for polymeric strap reinforced earth walls.
Comparison of the measured, calculated, and theoretic values.
Maximum Dynamic Tensile Force on the Polymeric Straps
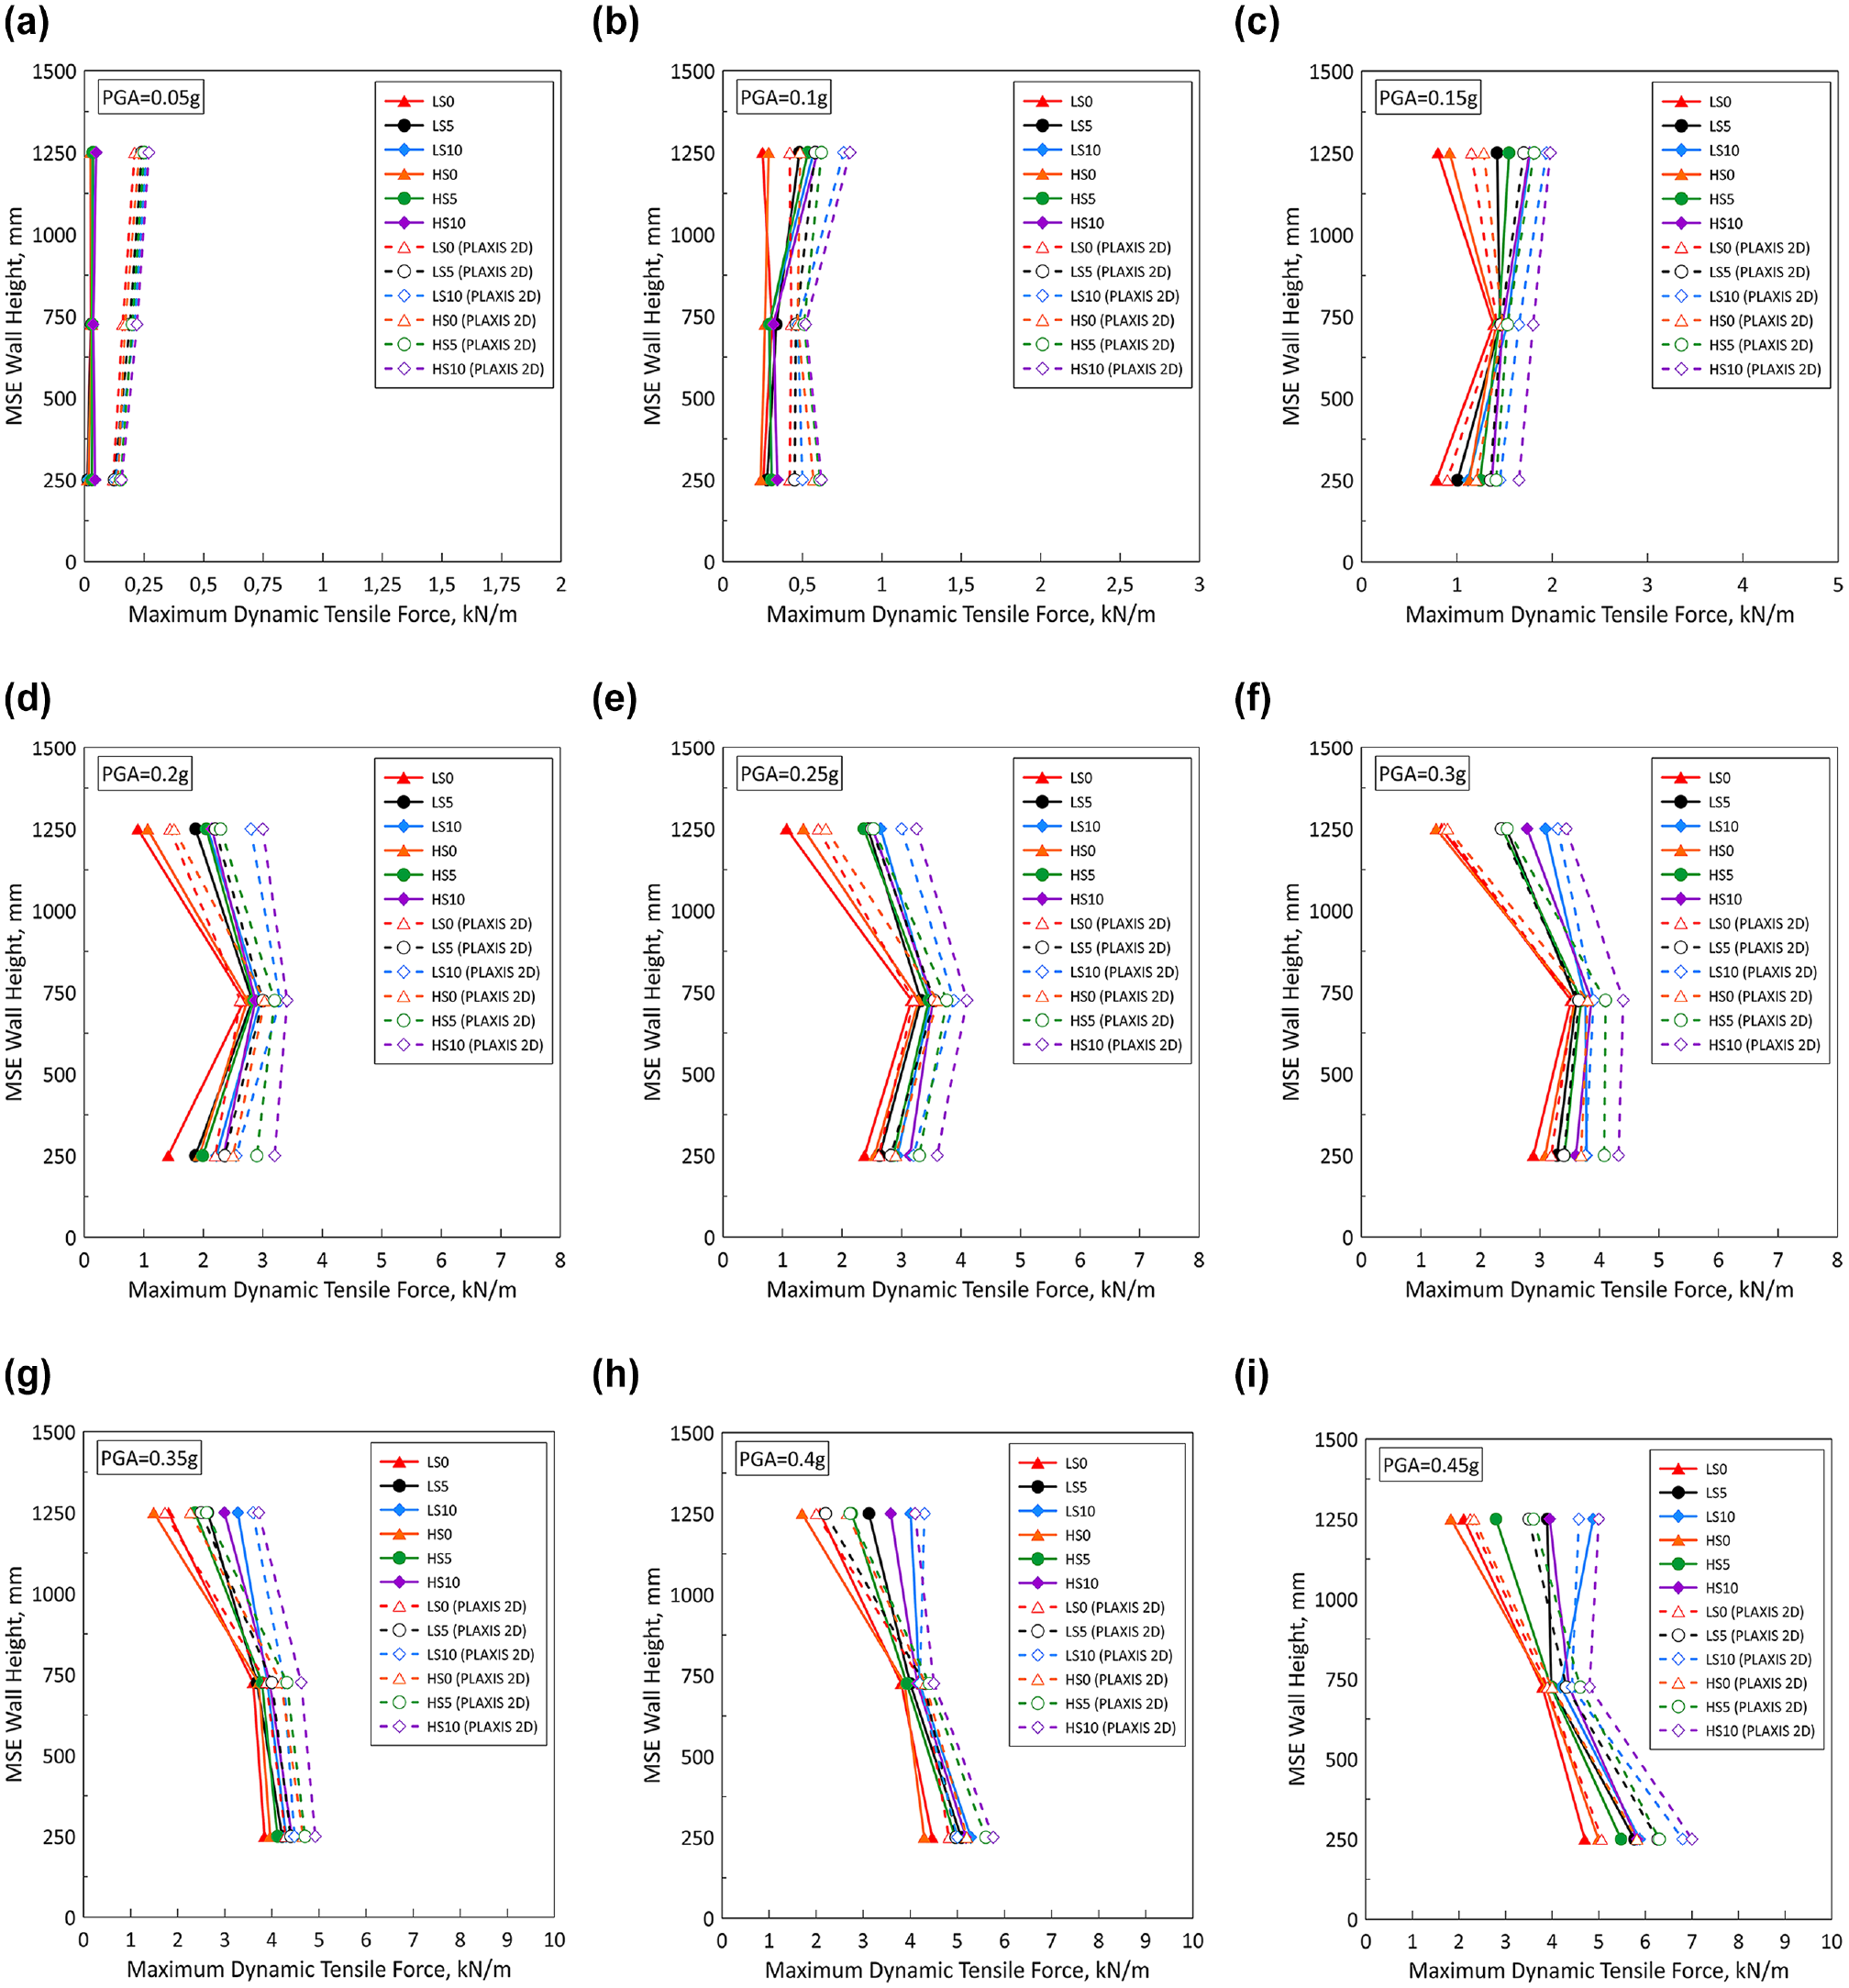
The maximum dynamic tensile force on the polymeric strap reinforcements is a very important parameter when the internal stability analysis of an MSE wall (including pullout, and tensile failure) is performed. Therefore, 15 SGs (SG1 to SG15) were placed on the surface of the reinforcement layers at the following five points: 125, 425, 725, 1,025, and 1,325 mm away from the back surface of the reinforced earth wall at the following three levels: 250, 750, and 1,250 mm, measured from the bottom of the MSE wall (Figure 1) in the experimental study. A comparison of the measured and calculated maximum dynamic tensile forces on the reinforcements are presented in Figure 20. The calculated values were in good agreement when compared with the measured values; nevertheless, the FE analyses indicated a slightly higher than the measurements did. Owing to the relatively small magnitude of the maximum dynamic tensile forces, the approximate variation amounted to less than 0.1% of the polymeric strap ultimate tensile strength. Similar discrepancies in the calculated and measured dynamic tensile force values on the reinforcements were observed by other researchers (31, 34, 36, 37, 39, 43, 46, 47). The dynamic tensile force values were indirectly converted from SG measurements in the experimental studies, and these measurements were influenced by the calibration and installation of the SGs on the reinforcements. Moreover, it is thought that during seismic excitation, undesirable folding and lateral movement of the reinforcements could have affected the dynamic tensile forces. Thus, the difference in values between the shaking table test and the FE analysis should be disregarded.
Comparison of the experimental and numerical maximum dynamic tensile force values on the reinforcements along the height of the reinforced earth wall at given inputs of : (a) 0.05 g, (b) 0.1 g, (c) 0.15 g, (d) 0.2 g, (e) 0.25 g, (f) 0.3 g, (g) 0.35 g, (h) 0.4 g, and (i) 0.45 g.
The distribution of values along the reinforcement earth wall was of a nonlinear form and it was observed that the values increased with increases in PGA, slope angle of the backfill material, and stiffness of the polymeric strap material in both the experimental and numerical studies owing to the effect of the total horizontal dynamic earth pressure. In general, the highest values were observed in the middle and bottom reinforcement layers. However, when PGA ≤ 0.15 g, maximum values were seen in the upper reinforcement layer resulting from quasi-elastic deformation behavior of reinforced earth walls (5). Similar trends for distribution of geosynthetic reinforcements have been reported (10–13, 18, 19, 24, 28, 31, 33, 34, 36, 37, 39–41, 44–47)
Conclusion
In this study, the accuracy of numerical models for the behavior of polymeric strap reinforced earth walls under different levels of seismic excitation was investigated and the procedures of FE models presented. For this purpose, six one-third-scale (1.5 m in height) reinforced earth walls loaded by a shaking table were simulated using the FE software PLAXIS 2D with the HS model for the effect of the PGA inputs, slope angle of backfill material ( = 0°, 5°, and 10°), and stiffness of the polymeric strap reinforcement . The measured and calculated horizontal wall displacement, horizontal dynamic earth pressure, acceleration response, and maximum dynamic tensile force on the reinforcements were compared. Based on this numerical simulation, the following conclusions can be drawn:
In general, the experimental and numerical simulation values were in good agreement with each other. However, some differences were observed owing to the backfill material being considered as a rigid body, the inability to simulate some of the more complex behaviors of soil particles, the modeling of the connection between the polymeric straps and the reinforced earth wall not being completely realistic, as well as an imperfect simulation of the three-dimensional (3D) geometry of the threads of the segmental facing panels in the 2D FE analysis. Furthermore, disparities between the experimental findings and the numerical analyses could be attributed to the undesirable folding and lateral displacement of the reinforcements.
In both the numerical and experimental studies, maximum relative displacements were observed at the top of the reinforced earth walls, and bugling deformations did not appear. Maximum relative displacement increased with a decrease in the stiffness of strap material, an increase in the slope angle of cohesionless backfill soil, and in values.
Horizontal incremental dynamic earth pressures geometry for the numerical and experimental studies did not comply with the recommended geometry of current reinforced earth wall design codes (49–51); it was observed that the geometry of for the numerical and experimental simulations were very similar to each other. The horizontal dynamic active earth pressure coefficient increased with an increase in the slope angle of backfill soil, stiffness of the polymeric strap, and . Conventional pseudostatic limit equilibrium methods (52, 53, 83) were found to overestimate values compared with those of the numerical and experimental simulations. The numerical model did not accurately simulate values at lower (<0.15 g). However, with an increase in values the experimental and numerical values of were compatible. It was observed that vertical dynamic active earth pressure coefficient values were higher than values; these differences were attributed to the effect of down-drag forces on the connections of the MSE wall. Traditional limit equilibrium methods (52, 53, 83) were deemed insufficient for forecasting values for polymeric strap reinforced earth walls. Furthermore, the angle of the resultant dynamic active force with horizontal increased with an increase in the slope angle of the sandy soil and it was noted that the effect of and stiffness of the reinforcement on the were negligible. The location of the dynamic force from the bottom of the reinforced earth wall (z) was approximately constant and located at an elevation of 0.5H, where H refers to the height of the MSE wall, in both the FE analyses and shaking table test. The calculated and measured horizontal dynamic active force locations complied with FHWA (49) and NCMA (50). Dynamic force location was independent of the , stiffness of the strap reinforcement, and slope angle of the backfill soil.
Investigation of values at different heights in the numerical and experimental studies showed that the values increased from the bottom to the top of the reinforced earth walls and exhibited nonlinear geometry. values increased with an increase in the slope of the backfill. Although there were differences in the measured and predicted values at small values (<0.15 g), the difference decreased with an increase in the values. In addition, the recommended average value methods in the literature or MSE wall design codes (49, 50, 54, 86, 87) were not sufficient to determine values of polymeric strap reinforced earth walls.
The maximum dynamic tensile forces exhibited an upward trend with increasing values of PGA, the slope angle of the backfill material, and the stiffness of the reinforcement. A slight difference was observed between the measured and calculated values.
Within the scope of this study, the precision of numerical models developed to examine the performance of polymeric strap reinforced earth walls under seismic loading conditions was investigated by comparing them with laboratory shaking table test data. Thus, the number of parameters in this study was limited. In the future, various backfill soil conditions (e.g., different internal friction angles, dilatancy angles, soil moduli), facing elements (e.g., full height panel, modular block, segmental panel), reinforcement configurations (e.g., different reinforcement lengths, horizontal and vertical distances between reinforcements), reinforcement stiffness values, water table positions, and seismic excitation scenarios (e.g., different predominant frequencies, earthquake records, duration times) should be investigated to verify the accuracy of the 2D and 3D numerical models or to develop comprehensive soil constitutive models for polymeric strap reinforced earth walls.
Footnotes
Acknowledgements
The authors thank Sarper Demirdöğen, Cem Akgüner, Hüseyin Kalkan, Nail Ünsal, Karimullah Karimi, Bilal Korkmaz, Hakan Özçelik, Tahsin Ömür Budak, and the reviewers for their contributions to the work presented in this paper. Thanks also go to Okay Memiş, Hamza Taşdelen, Orhan Tatar, Bekir Murat Tekin, Murat Nurlu, Nalan Ceydilek, Cenk Erkmen, and Mehmet Çoşkun of AFAD for their valuable support.
Author Contributions
The authors confirm contribution to the paper as follows: study conception and design: K. Yünkül, A. Gürbüz; data collection: xxxx; analysis and interpretation of results: K. Yünkül; draft manuscript preparation: K. Yünkül, A. Gürbüz. All authors reviewed the results and approved the final version of the manuscript.
Declaration of Conflicting Interests
The authors declared no potential conflicts of interest with respect to the research, authorship, and/or publication of this article.
Funding
The authors disclosed receipt of the following financial support for the research, authorship, and/or publication of this article: This study was carried out as part of the project UDAP-C-19-08, “Determination of the Dynamic Loads Acting on the Retaining (Traditional and MSE) Walls” supported by the Disaster and Emergency Management Presidency of Turkey (AFAD).
ORCID iDs
Kaan Yünkül
References
1.
WartmanJ.Rondinel-OviedoE. A.Rodriguez-MarekA.Performance and Analyses of Mechanically Stabilized Earth Walls in the Tecoman. Mexico Earthquake. Journal of Performance of Constructed Facilities, Vol. 20, No. 3, 2006, pp. 287–299.
2.
KoernerR. M.KoernerG. R.An Extended Data Base and Recommendations Regarding 320 Failed Geosynthetic Reinforced Mechanically Stabilized Earth (MSE) Walls. Geotextiles and Geomembranes, Vol. 46, No. 6, 2018, pp. 904–912.
3.
KuwanoJ.MiyataY.KosekiJ.Performance of Reinforced Soil Walls During the 2011 Tohoku Earthquake. Geosynthetics International, Vol. 21, No. 3, 2014, pp. 179–196.
4.
VerdugoR.SitarN.FrostJ. D.BrayJ. D.CandiaG.EldridgeT.HashashY.OlsonS. M.UrzuaA.Seismic Performance of Earth Structures During The February 2010 Maule, Chile, Earthquake: Dams, Levees, Tailings Dams, and Retaining Walls. Earthquake Spectra, Vol. 28, 2012, pp. 75–96.
5.
YünkülK.GürbüzA.Shaking Table Study on Seismic Behavior of MSE Wall with Inclined Backfill Soils Reinforced by Polymeric Geostrips. Geotextiles and Geomembranes, Vol. 50, No. 1, 2022, pp. 116–136.
6.
SameeA. A.YazdandoustM.GhalandarzadehA.Performance of Back-To-Back MSE Walls Reinforced with Steel Strips Under Seismic Conditions. Transportation Geotechnics, Vol. 30, 2021, p. 100540.
7.
YazdandoustM.Investigation on the Seismic Performance of Steel-Strip Reinforced-Soil Retaining Walls Using Shaking Table Test. Soil Dynamics and Earthquake Engineering, Vol. 97, 2017, pp. 216–232.
8.
YazdandoustM.Laboratory Evaluation of Dynamic Behavior of Steel-Strip Mechanically Stabilized Earth Walls. Soils and Foundations, Vol. 58, No. 2, 2018, pp. 264–276.
9.
YazdandoustM.SameeA. A.GhalandarzadehA.Assessment of Seismic Behavior of Back-To-Back Mechanically Stabilized Earth Walls Using 1g Shaking Table Tests. Soil Dynamics and Earthquake Engineering, Vol. 155, 2022, p. 106078.
10.
BaşbuğE.CengizC.GülerE.1-g Shaking Table Tests to Determine the Behavior of Geosynthetic Reinforced Soil Walls Under Seismic Loads. Transportation Geotechnics, Vol. 30, 2021, p. 100597.
11.
GülerE.EnunluA. K.Investigation of Dynamic Behavior of Geosynthetic Reinforced Soil Retaining Structures Under Earthquake Loads. Bulletin of Earthquake Engineering, Vol. 7, No. 3, 2009, pp. 737–777.
12.
GülerE.SelekO.Reduced-Scale Shaking Table Tests on Geosynthetic-Reinforced Soil Walls with Modular Facing. Journal of Geotechnical and Geoenvironmental Engineering, Vol. 140, No. 6, 2014, p. 04014015.
13.
KılıçI.CengizC.EdinçlilerA.GülerE.Seismic Behavior of Geosynthetic-Reinforced Retaining Walls Backfilled with Cohesive Soil. Geotextiles and Geomembranes, Vol. 49, No. 5, 2021, pp. 1256–1269.
14.
LiS.CaiX.JingL.XuH.HuangX.ZhuC.Lateral Displacement Control of Modular-Block Reinforced Soil Retaining Walls Under Horizontal Seismic Loading. Soil Dynamics and Earthquake Engineering, Vol. 141, 2021, p. 106485.
15.
EftekhariZ.PanahA. K.1-g Shaking Table Investigation on Seismic Performance of Polymeric-Strip Reinforced-Soil Retaining Walls Built on Rock Slopes with Limited Reinforced Zone. Soil Dynamics and Earthquake Engineering, Vol. 147, 2021, p. 106758.
16.
PanahA. K.EftekhariZ.Shaking Table Tests on Polymeric-Strip Reinforced-Soil Walls Adjacent to a Rock Slope. Geotextiles and Geomembranes, Vol. 49, No. 3, 2021, pp. 737–756.
17.
PanahA. K.YazdiM.GhalandarzadehA.Shaking Table Tests on Soil Retaining Walls Reinforced by Polymeric Strips. Geotextiles and Geomembranes, Vol. 43, No. 2, 2015, pp. 148–161.
18.
El-EmamM. M.BathurstR. J.Facing Contribution to Seismic Response of Reduced-Scale Reinforced Soil Walls. Geosynthetics International, Vol. 12, No. 5, 2005, pp. 215–238.
19.
El-EmamM. M.BathurstR. J.Influence of Reinforcement Parameters on the Seismic Response of Reduced-Scale Reinforced Soil Retaining Walls. Geotextiles and Geomembranes, Vol. 25, No. 1, 2007, pp. 33–49.
20.
XuP.HatamiK.JiangG.Study on Seismic Stability and Performance of Reinforced Soil Walls Using Shaking Table Tests. Geotextiles and Geomembranes, Vol. 48, No. 1, 2020. pp. 82–97.
21.
KrishnaA. M.LathaG. M.Seismic Response of Wrap-Faced Reinforced Soil-Retaining Wall Models Using Shaking Table Tests. Geosynthetics International, Vol. 14, No. 6, 2007, pp. 355–364.
22.
LathaG. M.KrishnaA. M.Seismic Response of Reinforced Soil Retaining Wall Models: Influence of Backfill Relative Density. Geotextiles and Geomembranes, Vol. 26, No. 4, 2008, pp. 335–349.
23.
RenF.HuangQ.WangG.Shaking Table Tests on Reinforced Soil Retaining Walls Subjected to the Combined Effects of Rainfall and Earthquakes. Engineering Geology, Vol. 267, 2020, p. 105475.
24.
XuP.HatamiK.JiangG.Shaking Table Performance of Reinforced Soil Retaining Walls with Different Facing Configurations. Geotextiles and Geomembranes, Vol. 49, No. 3, 2021, pp. 516–527.
25.
Cai, X., S. Li, H. Xu, L. Jing, X. Huang, and C. Zhu. Shaking Table Study on the Seismic Performance of Geogrid Reinforced Soil Retaining Walls. Advances in Civil Engineering, 2021, p. 6668713.
26.
SabermahaniM.GhalandarzadehA.FakherA.Experimental Study on Seismic Deformation Modes of Reinforced-Soil Walls. Geotextiles and Geomembranes, Vol. 27, No. 2, 2009, pp. 121–136.
27.
LathaG. M.SanthanakumarP.Seismic Response of Reduced-Scale Modular Block and Rigid Faced Reinforced Walls Through Shaking Table Tests. Geotextiles and Geomembranes, Vol. 43, No. 4, 2015, pp. 307–316.
28.
XuH.CaiX.WangH.LiS.HuangX.ZhangS.Analysis of the Working Response Mechanism of Wrapped Face Reinforced Soil Retaining Wall under Strong Vibration. Sustainability, Vol. 14, No. 15, 2022, p. 9741.
29.
CaoL. C.FuX.WangZ. J.ZhouY. Y.LiuF. C.ZhangJ. J.Seismic Responses of The Steel-Strip Reinforced Soil Retaining Wall with Full-Height Rigid Facing from Shaking Table Test. Journal of Mountain Science, Vol. 15, No. 5, 2018, pp. 1137–1152.
30.
SafaeeA. M.Performance of the Multi-Tiered GMSE Walls Under Seismic Conditions: Comparison of Physical and Numerical Simulations. Soil Dynamics and Earthquake Engineering, Vol. 159, 2022, p. 107316.
31.
GülerE.ÇicekE.DemirkanM. M.HamderiM.Numerical Analysis of Reinforced Soil Walls with Granular and Cohesive Backfills Under Cyclic Loads. Bulletin of Earthquake Engineering, Vol. 10, No. 3, 2012, pp. 793–811.
32.
KamalzadehA.PenderM. J.Dynamic Response of Mechanically Stabilised Earth (MSE) Structures: A Numerical Study. Geotextiles and Geomembranes, Vol. 5, No. 1, 2023, pp. 73–87.
33.
LeeK.ChangN.Predictive Modeling on Seismic Performances of Geosynthetic-Reinforced Soil Walls. Geotextiles and Geomembranes, Vol. 35, 2012, pp. 25–40.
34.
AskariM.RazeghiH. R.MamaghanianJ.Numerical Study of Geosynthetic Reinforced Soil Bridge Abutment Performance Under Static and Seismic Loading Considering Effects of Bridge Deck. Geotextiles and Geomembranes, Vol. 49, No. 5, 2021, pp. 1339–1354.
35.
KrishnaA. MBhattacharjeeA.Behavior of Rigid-Faced Reinforced Soil-Retaining Walls Subjected to Different Earthquake Ground Motions. International Journal of Geomechanics, Vol. 17, No. 1, 2017, p. 06016007.
36.
LiuH.WangX.SongE.Reinforcement Load and Deformation Mode of Geosynthetic-Reinforced Soil Walls Subject to Seismic Loading During Service Life. Geotextiles and Geomembranes, Vol. 29, No. 1, 2011, pp. 1–16.
37.
LiuH.YangG.LingH. I.Seismic Response of Multi-Tiered Reinforced Soil Retaining Walls. Soil Dynamics and Earthquake Engineering, Vol. 61, 2014. pp. 1–12.
38.
BhattacharjeeA.KrishnaA. M.Strain Behavior of Backfill Soil in Rigid Faced Reinforced Soil Walls Subjected to Seismic Excitation. International Journal of Geosynthetics and Ground Engineering, Vol. 1, No. 2, 2015, pp. 1–14.
39.
FanC.LiuH.CaoJ.LingH. I.Responses of Reinforced Soil Retaining Walls Subjected to Horizontal and Vertical Seismic Loadings. Soil Dynamics and Earthquake Engineering, Vol. 129, 2020, p. 105969.
40.
LiuH.HungC.J. Cao, J.Relationship Between Arias Intensity and the Responses of Reinforced Soil Retaining Walls Subjected to Near-Field Ground Motions. Soil Dynamics and Earthquake Engineering, Vol. 111, 2018, pp. 160–168.
41.
CapilleriP.FerraioloF.MottaE.ScottoM.TodaroM.Static and Dynamic Analysis of Two Mechanically Stabilized Earth Walls. Geosynthetics International, Vol. 26, No. 1, 2019, pp. 26–41.
42.
SrivastavaA.ChauhanV. B.Numerical Studies on Two-Tiered MSE Walls Under Seismic Loading. SN Applied Sciences, Vol. 2, No. 10, 2020, pp. 1–7.
43.
RenF.ZhangF.XuC.WangG.Seismic Evaluation of Reinforced-Soil Segmental Retaining Walls. Geotextiles and Geomembranes, Vol. 44, No. 4, 2016, pp. 604–614.
44.
DramA.BalunainiU.BenmebarekS.SravanamS. M.MadhavM. R.Earthquake Response of Connected and Unconnected Back-To-Back Geosynthetic-Reinforced Soil Walls. International Journal of Geomechanics, Vol. 21, No. 11, 2021, p. 04021223.
45.
TürkelB.Yıldırımİ. Z.GülerE.The Effect of Natural Frequency on the Seismic Behavior of an 8 m High MSE Wall. Presented at Geo-Congress 2020: Engineering, Monitoring, and Management of Geotechnical Infrastructure 2020. American Society of Civil Engineers Reston, VA, 2020.
46.
LeeK.ChangN.KoH.Numerical Simulation of Geosynthetic-Reinforced Soil Walls Under Seismic Shaking. Geotextiles and Geomembranes, Vol. 28, No. 4. 2010, pp. 317–334.
47.
LingH. I.YangS.LeshchinskyD.LiuH.BurkeC.Finite-Element Simulations of Full-Scale Modular-Block Reinforced Soil Retaining Walls Under Earthquake Loading. Journal of Engineering Mechanics, Vol. 136, No. 5, 2010, pp. 653–661.
48.
XuP.HatamiK.JiangG.Shaking Table Study on the Influence of Ground Motion Frequency on the Performance of MSE Walls. Soil Dynamics and Earthquake Engineering, Vol. 142, 2021, p. 106585.
49.
FHWA. Design and Construction of Mechanically Stabilized Earth Walls and Reinforced Soil Slopes–Volume I. Federal Highway Administration, Washington, DC, USA, 2009.
50.
NCMA. Design Manual for Segmental Retaining Walls. National Concrete Masonry Association Herndon, VA, USA, 2012.
51.
AASHTO. LRFD Bridge Design Specifications. American Association of State Highway and Transportation Officials, Washington, DC, USA, 2020.
52.
OkabeS.General Theory on Earth Pressure and Seismic Stability of Retaining Wall and Dam. Presented at Civil Engineering Society, Japan, 1924.
53.
MononobeN.MatsuoH.On Determination of Earth pressure During Earthquake. Presented at World Engineering Congress, Tokyo, Japan, 1929.
54.
SegrestinP.BastickM.Seismic Design of Reinforced Earth Retaining Walls the Contribution of Finite Elements Analysis. Presented at International Geotechnical Symposium on Theory and Practice of Earth Reinforcement, Fukuoka, Japan, 1988.
55.
DurukanZ.TezcanS. S.Cost Analysis of Reinforced Soil Walls. Geotextiles and Geomembranes, Vol. 11, No. 1, 1992, pp. 29–43.
56.
KoernerR. M.Designing with Geosynthetics, 5th ed, Pearson Prentice Hall, New Jersey, USA, 2012.
57.
MirmoradiS.EhrlichM.MagalhãesL.Numerical Evaluation of the Effect of Foundation on the Behaviour of Reinforced Soil Walls. Geotextiles and Geomembranes, Vol. 49, No. 3, 2021, pp. 619–628.
58.
BenmebarekS.DjabriM.FEM to Investigate the Effect of Overlapping-Reinforcement on the Performance of Back-To-Back Embankment Bridge Approaches Under Self-Weight. Transportation Geotechnics, Vol. 11, 2017, pp. 17–26.
59.
YuY.DamiansI. P.BathurstR. J.Influence of Choice of FLAC and PLAXIS Interface Models on Reinforced Soil–Structure Interactions. Computers and Geotechnics, Vol. 65, 2015, pp. 164–174.
60.
KahyaoğluM. RŞahinM.Model Studies on Polymer Strip Reinforced Soil Retaining Walls. Geomechanics and Engineering, Vol. 25, No. 5, 2021, pp. 357–371.
61.
MohamedS. B.YangK. H.HungW. Y.Finite Element Analyses of Two-Tier Geosynthetic-Reinforced Soil Walls: Comparison Involving Centrifuge Tests and Limit Equilibrium Results. Computers and Geotechnics, Vol. 61, 2014. pp. 67–84.
62.
BrouthenA.HouhouM. N.DamiansI. P.Numerical Study of the Influence of the Interaction Distance, the Polymeric Strips Pre-Tensioning, and the Soil–Polymeric Interaction on the Performance of Back-to-Back Reinforced Soil Walls. Infrastructures, Vol. 7, No. 2, 2022, p. 22.
63.
WangH.YangG.WangZ.LiuW.Static Structural Behavior of Geogrid Reinforced Soil Retaining Walls With A Deformation Buffer Zone. Geotextiles and Geomembranes, Vol. 48, No. 3, 2020, pp. 374–379.
64.
Abu-FarsakhM.ArdahA.VoyiadjisG.3D Finite Element Analysis of the Geosynthetic Reinforced Soil-Integrated Bridge System (GRS-IBS) Under Different Loading Conditions. Transportation Geotechnics, Vol. 15, 2018, pp. 70–83.
65.
DesaiC. S.El-HoseinyK. E.Prediction of Field Behavior Oof Reinforced Soil Wall Using Advanced Constitutive Model. Journal of Geotechnical and Geoenvironmental Engineering, Vol. 131, No. 6, 2005, pp. 729–739.
66.
ASTM D2487-17. Standard Practice for Classification of Soils for Engineering Purposes (Unified Soil Classification System). ASTM International West Conshohocken, PA, 2017.
67.
ObrzudR. F.On the Use of the Hardening Soil Small Strain Model in Geotechnical Practice. Numerics in Geotechnics and Structures, Vol. 16, 2010, pp. 1–17.
68.
ISO 10319. Geosynthetics–Wide-Width Tensile Test. International Organization for Standardization Vernier, Geneva, Switzerland, 2015.
69.
BathurstR. J.MiyataY.NernheimA.AllenA. M.Refinement of K-Rigidity Method for Geosynthetic-Reinforced Soil Walls. Geosynthetics International, Vol. 15, No. 4, 2008, pp. 269–295.
70.
BathurstR. J.HatamiK.Seismic Response Analysis of a Geosynthetic-Reinforced Soil Retaining Wall. Geosynthetics International, Vol. 5, No. 1–2, 1998, pp. 127–166.
71.
BakrJ.AhmadS. M.A Finite Element Performance-Based Approach to Correlate Movement of a Rigid Retaining Wall with Seismic Earth Pressure. Soil Dynamics and Earthquake Engineering, Vol. 114, 2018, pp. 460–479.
72.
SalemA. N.EzzeldineO. Y.AmerM. I.Seismic Loading on Cantilever Retaining Walls: Full-Scale Dynamic Analysis. Soil Dynamics and Earthquake Engineering, Vol. 130, 2020, pp. 105962.
73.
Athanasopoulos-ZekkosA.VlachakisV.AthanasopoulosG.Phasing Issues in the Seismic Response of Yielding, Gravity-Type Earth Retaining Walls–Overview and Results From a FEM Study. Soil Dynamics and Earthquake Engineering, Vol. 55, 2013. pp. 59–70.
74.
HashashY. M.ParkD.Viscous Damping Formulation and High Frequency Motion Propagation in Non-Linear Site Response Analysis. Soil Dynamics and Earthquake Engineering, Vol. 22, No. 7, 2002, pp. 611–624.
KuhlemeyerR. L.LysmerJ.Finite Element Method Accuracy for Wave Propagation Problems. Journal of the Soil Mechanics and Foundations Division, Vol. 99, No. 5, 1973, pp. 421–427.
77.
LiuS. H.JiaF.ChenX. L.LiL. J.Experimental Study on Seismic Response of Soilbags-Built Retaining Wall. Geotextiles and Geomembranes, Vol. 48, No. 5, 2020, pp. 603–613.
78.
ErtuğrulÖ. LTrandafirA. C.Lateral Earth Pressures on Flexible Cantilever Retaining Walls with Deformable Geofoam Inclusions. Engineering Geology, Vol. 158, 2013, pp. 23–33.
79.
ErtuğrulÖ. L.TrandafirA. C.Seismic Earth Pressures on Flexible Cantilever Retaining Walls With Deformable Inclusions. Journal of Rock Mechanics and Geotechnical Engineering, Vol. 6, No. 5, 2014, pp. 417–427.
80.
Al AtikL.SitarN.Seismic Earth Pressures on Cantilever Retaining Structures. Journal of Geotechnical and Geoenvironmental Engineering, Vol. 136, No. 10, 2010, pp. 1324–1333.
81.
SeedH.WhitmanR. V.Design of Earth Retaining Structures for Dynamic Loads. Presented at American Society of Civil Engineers Specialty Conference on Lateral Stresses in the Ground and Design of Earth-Retaining Structures, Cornell University, New York, USA, 1970.
82.
CaiZ.BathurstR. J.Deterministic Sliding Block Methods for Estimating Seismic Displacements of Earth Structures. Soil Dynamics and Earthquake Engineering, Vol. 15, No. 4, 1996, pp. 255–268.
83.
MylonakisG.KloukinasP.PapantonopoulosC.An Alternative to The Mononobe–Okabe Equations for Seismic Earth Pressures. Soil Dynamics and Earthquake Engineering, Vol. 27, No. 10, 2007, pp. 957–969.
84.
SafaeeA. M.MahboubiA.NoorzadA.Experimental Investigation on the Performance of Multi-Tiered Geogrid Mechanically Stabilized Earth (MSE) Walls with Wrap-Around Facing Subjected to Earthquake Loading. Geotextiles and Geomembranes, Vol. 49, No. 1, 2021, pp. 130–145.
85.
KramerS. L.Geotechnical Earthquake Engineering. Pearson Education, India, 1996.
86.
BonaparteR.Seismic Design of Slopes Reinforced with Geogrids and Geotextiles. Presented at 3rd International Conferance on Geotextiles. Vienna, Austria, 1986.
87.
El-EmamM. M.Experimental Verification of Current Seismic Analysis Methods of Reinforced Soil Walls. Soil Dynamics and Earthquake Engineering, Vol. 113, 2018, pp. 241–255.