



Abstract
This paper presents the analyses of 12 prestressed concrete instrumented test piles (TPs) that were driven in different bridge construction projects of Louisiana as part of a load testing program. The 12 TPs were driven mainly in cohesive soils. Detailed soil characterizations including both laboratory and in situ tests were conducted to determine the different soil properties. The TPs were instrumented with vibrating wire strain gauges to be able to calculate the distribution of skin friction and end-bearing capacities separately. Static load tests and dynamic load tests were conducted on each TP after end of driving to calculate the ultimate load capacity. Fifty six soil layers exhibiting clayey soil behavior and sandy soil behavior dominated the remaining 15 soil layers. The total stress parameter (α) and the effective stress parameter (β) were back-calculated for each soil layer. The α values ranged from 0.22 to 1.80, and the β values ranged from 0.11 to 0.83. Regression analyses were performed on 42 soil layers (75% data) to develop an empirical model to predict α as a function of undrained shear strength. The remaining 25% of the data were used to verify the developed model, and good agreement was observed between the measured and predicted values.
Keywords
Total stress and effective stress approaches are basic methods for calculating the shaft capacity of driven piles in clay. These methods have been developed by researchers using the results of laboratory and field tests. A review of advances in the development of these approaches showed that total stress methods give better results than effective stress methods for concrete piles. The value of the total stress parameter (α) is the main factor in estimating pile skin friction in clayey soil. The Tomlinson ( 1 ), American Petroleum Institute (API) ( 2 ), and NGI ( 3 ) methods have presented relationships for α based on undrained shear strength (Su), overconsolidation ratio (OCR), plasticity index, and friction fatigue (related to the degree of softening of the clay and pile compressibility). These methods are largely based on correlations obtained from field tests on different piles.
Total Stress Parameter
The unit skin friction of piles in clayey soils is primarily a function of soil Su. This approach can be represented in the following equation:

where fs = unit skin friction. Su can be determined by the unconfined compression test, the in situ vane shear test, or the triaxial test. α is used to adjust Su for estimating fs. The values of
An evaluation of α was carried out using a series of equations that were mainly a function of Su. Tomlinson observed that the relationship between fs and Su was nonlinear, as proposed in the above relationship (Equation 1) ( 1 ). Following Tomlinson, significant research has been performed on a large body of empirical data derived from pile load tests that support the equation developed by Tomlinson ( 1 ).
Attempts to reveal correlations between Su and α by others researchers have similarly been undertaken ( 4 – 9 ). It is generally observed that the value of α is not constant but decreases with an increasing Su value. The trends are plotted in Figure 1.

Available models to estimate total stress parameter factor (α) from undrained shear strength (Su).
It can be observed from Figure 1 that α is assumed to be 1 for low values of Su, whereas from the various equations proposed in the literature α can be taken as ranging from 0.75 for low Su values to 0.2 for high Su values. Peck studied the results of 36 pile load cases and found the friction computed was approximately equal to Su ( 4 ). Skempton found that α values for piles in London clay varied from 0.3 to 0.6 with a mean value of 0.45 ( 10 ). The upper bound value of Su considered was 96 kPa in his study. According to Broms, a reasonable value of α must be commonly assumed as 0.45 for piles driven in stiff clayey soils ( 11 ). McClelland suggested that fs was approximately equal to Su in normally consolidated clay ( 12 ). However, in these analyses, the effects of pile movement and the distribution of skin friction with depth were not considered to estimate Su. A more exact analyses could conceivably introduce different values. For instance, Seed and Reese ( 13 ) and Coyle and Reese ( 14 ) reported skin friction values for very soft clayey soil that were approximately equal to 1.5 of Su. These observations were based on instrumented pile data in which the distribution of skin friction with pile depth was computed. Several researchers ( 7 , 15 , 16 ) have also proposed certain analytical equations to estimate α directly from Su as follows:

Vijayvergiya and Focht observed that α increases as the stress level increases provided that all other conditions are equal ( 7 ). Subsequent researchers ( 17 , 18 ) tried to develop a relationship between α and the ratio of σ′vo/Su. Some available relationships include the following

Kolk and Van der Velde ( 19 ) suggested the following formulation based on API practice ( 2 ):

where D (diameter) and L (length) measure the slenderness of the pile, which is assumed to influence the α value. In addition to these methods, researchers have used finite element modeling to find correlations between the fs of the pile and the Su of clay.
Effective Stress Parameter (β)
The behavior of soil is primarily influenced by effective stresses and intricate stress–strain pathways during the installation of displacement piles. In addition, the positioning of the failure surface, where shaft friction emerges under pile loading, is contingent on factors such as interface roughness. This factor is particularly significant in the case of steel piles. Understanding the interface friction angle, which governs the shaft friction along the soil–pile interface, is crucial in assessing these considerations. In an attempt to overcome the drawbacks of the α method, Burland developed an effective stress design approach, known as Beta (β) method ( 20 ). β method is considered to be more rational than α method, however, the development of a reliable effective stress at this time is hindered by the dearth of piles test data that include reliable pore water pressure and radial stress measurements.
Burland’s method links the effective stress (σ′) and the interface friction angle (δ) to the shaft friction (τf) as ( 20 ),

where τf represents the shaft friction, and σ′rf denotes the effective normal stress on the pile–soil interface.
Burland’s method was originally developed for bored piles (
20
) and the value of

where
Kf is coefficient relating to the pile–soil interaction,
βNC is coefficient related to NC clays,
Ko is coefficient of lateral earth pressure at rest, and
ϕcv′ is effective stress friction angle at the critical state for NC clay.
The method has been extensively used for the design of driven piles. Mayerhof proposed β values for over consolidated (OC) clays as ( 21 ),

Flaate and Selnes noted a tendency for

Burland suggested that OCR is related to Su/σ′vo with β equal to 0.2 for NC to lightly OC clay (Su/σ′vo < 0.4) to 0.5 for heavily OC soils (Su/σ′vo ≥ 1.0) ( 20 ).
Objective and Scope
An extensive load testing program was conducted on instrumented test piles (TPs) in Louisiana. Laboratory soil investigation and in situ testing were performed to evaluate the soil properties. The TPs were instrumented to estimate the skin friction of individual soil layers. The specific objectives of this study were to (a) calculate the pile design parameters (α and β) for individual soil layers, (b) correlate α with the Su of individual soil layers, and (c) develop a model that can estimate α from Su.
Project Description and Soil Condition
Test Sites
An extensive load testing program was conducted by Abu-Farsakh et al. on five different sites in Louisiana during the construction of bridges as part of a pile setup study ( 23 ). The Louisiana Department of Transportation and Development was in charge of the load testing program of these construction sites. These sites were LA-1, Bayou Lacassine, Bayou Zourie, Caminada Bay, and KCS Railroad Bridge site. The load testing program in the LA-1 project was performed during the construction of an elevated highway between Golden Meadow and Port Fourchon to replace the previously existing LA-1 highway. The load testing program in the Bayou Lacassine project was conducted during replacement of the old Bayou Lacassine bridge located on U.S. Hwy 14 in Jefferson Davis Parish. The Bayou Zourie project consisted of constructing a two-lane highway bridge on the northbound lane of US-171 over Bayou Zourie in Vernon Parish. Caminada Bay Bridge was constructed to connect Grand Isle, a barrier island on the coast of the Gulf of Mexico, and Louisiana’s mainland. KCS Railroad Overpass Bridge was constructed at Alexandria, along US-71.
Test Piles
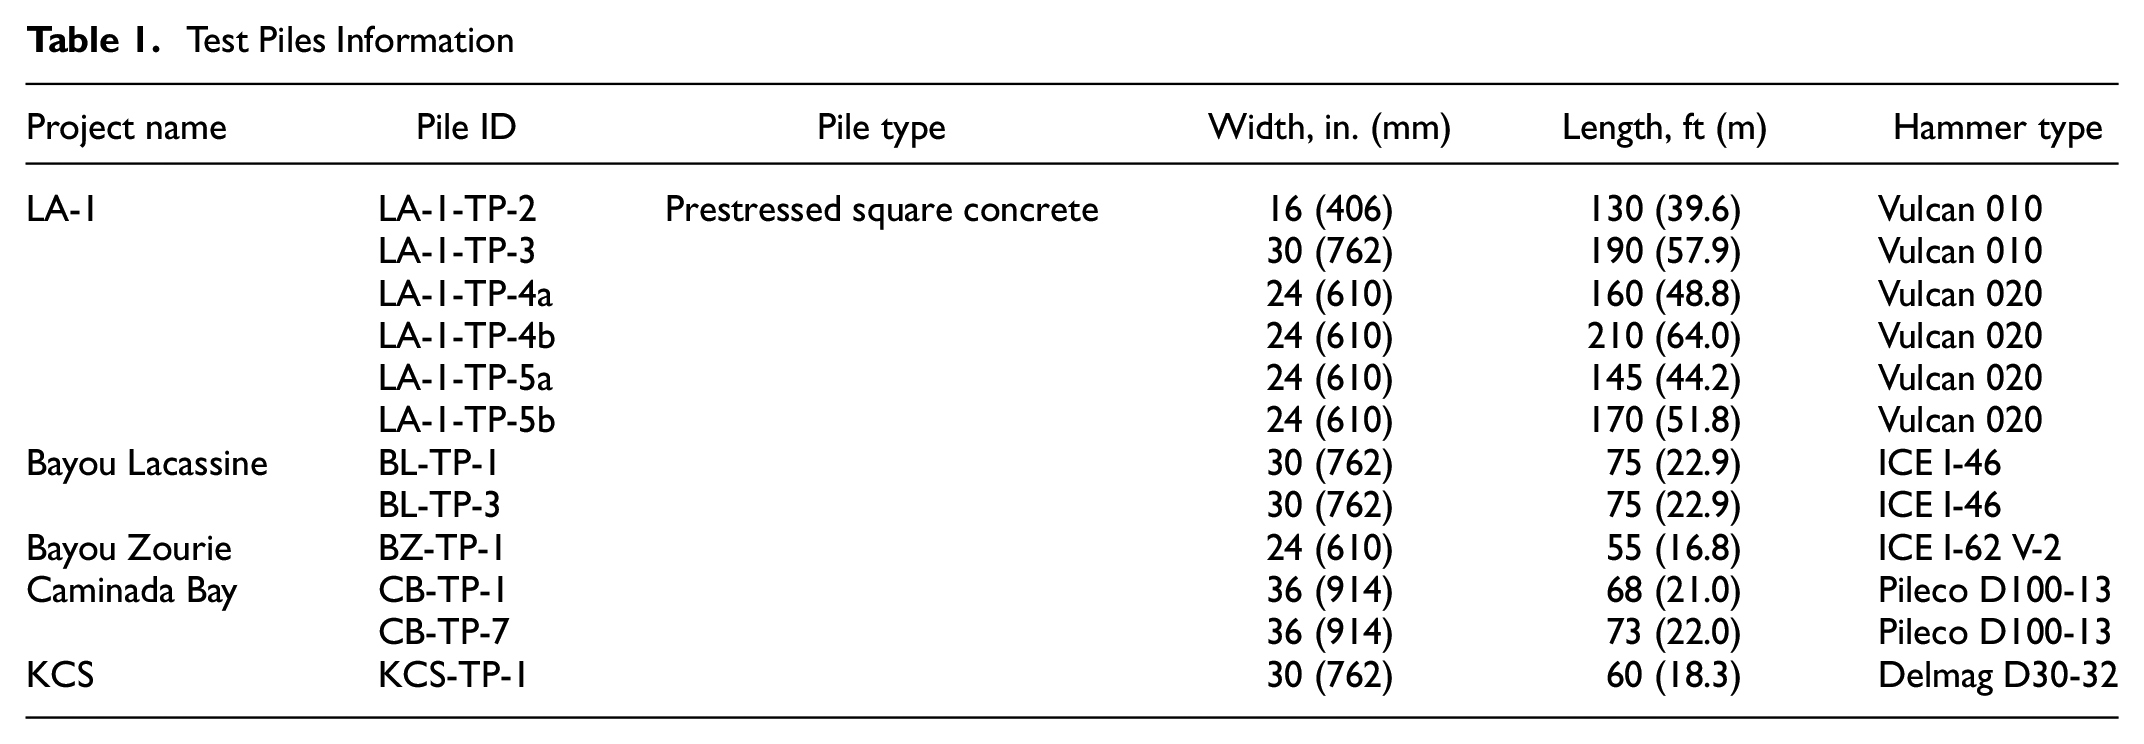
The load testing program was performed on prestressed square concrete (PSC) piles. Twelve instrumented TPs installed at five different projects were considered for this study. Six TPs were installed at four different locations at the LA-1 project. At TP-4 and TP-5 locations of LA-1, two TPs were installed at a distance of 10 ft (3.05 m) apart and are designated as TP-4a, TP-4b, and TP-5a, TP-5b for further reference in this paper. Two TPs were installed in two different locations in the Bayou Lacassine site and the Caminada Bay site, and one TP was installed at the KCS Railroad Overpass Bridge site and Bayou Zourie project each. Pile IDs, their widths, lengths, and hammer type for installation are presented in Table 1. The piles’ cross sectional width ranged from 16 in. (406 mm) to 36 in. (914 mm), and the piles’ length ranged from 55 ft (16.8 m) to 210 ft (64.0 m).
Test Piles Information
Subsurface Geotechnical Condition
The load testing program designed in this study focused on measuring the fs of individual soil layers and correlating α with Su. For this purpose, both laboratory and in situ tests were conducted at each TP location to evaluate the strength parameters. Three-inch Shelby tube samples were retrieved from boreholes drilled at different depths at each TP location to perform the unconsolidated undrained (UU) test. The layer number along with their depths and corresponding strength parameters for all the TPs are tabulated in Table 2. Also presented are the calculated total and effective stress parameters (α and β, respectively) for the individual soil layers along the pile lengths. A detailed description of soil classifications and properties for all the sites can be found in Abu-Farsakh et al. ( 23 ). The subsurface soil stratigraphy as revealed from boring for Bayou Lacassine and Bayou Zourie locations showed that the soils were mainly cohesive with the presence of narrow interlayers of sand. Interlayers of sand were also present at the LA-1 project. The soil profile at Caminada Bay showed deposits mainly consisting of sandy soil. In situ tests were performed in addition to laboratory testing. The in situ testing program included both piezocone penetration tests, piezocone dissipation tests, and standard penetration tests (SPTs). The SPT has been used widely to evaluate the strength properties of subsurface soils in sandy soil.
Soil Properties, Layer Information, and Measured Stress Parameters for All the Projects

Note: psf = pound per square foot; NA = not available.
Instrumentation
As mentioned earlier, the goal of this study was to develop a model that could estimate α from Su. To meet this criterion, at each project site, all the TPs were instrumented with vibrating wire strain gauges (VWSGs) to calculate the skin friction of individual soil layers. The instrumentation plan and procedure of all sites can be found in Abu-Farsakh et al. ( 23 ). Figure 2 presents photographs of the VWSGs, and examples of the instrumentation plan and the data acquisition system. The locations of the VWSGs (Geokon model 4911) targeted specific soil layers along the length of the TPs to measure the increase in skin friction with time for the pile setup study ( 24 , 25 ). The VWSGs were installed in pairs on opposite sides of the pile’s width at each depth (Figure 2, c to e ) and their average readings were adopted for analysis to eliminate the possibility of bending stress. A pair of VWSGs was each installed at the top of the piles near the ground surface to calibrate the elastic modulus of the pile, which was used in the analyses of the load test. Another set of VWSGs were installed at the bottom of the piles to calculate the end-bearing capacity (Rtip).

Photographs of the instruments and examples of the instrumentation plan: (a) installation of VWSGs, (b) example of data collection system, (c) CB-TP-1, (d) LA-1-TP-2, (e) LA-1-TP-3a, and (f) KCS-TP-1.
Load Testing Program
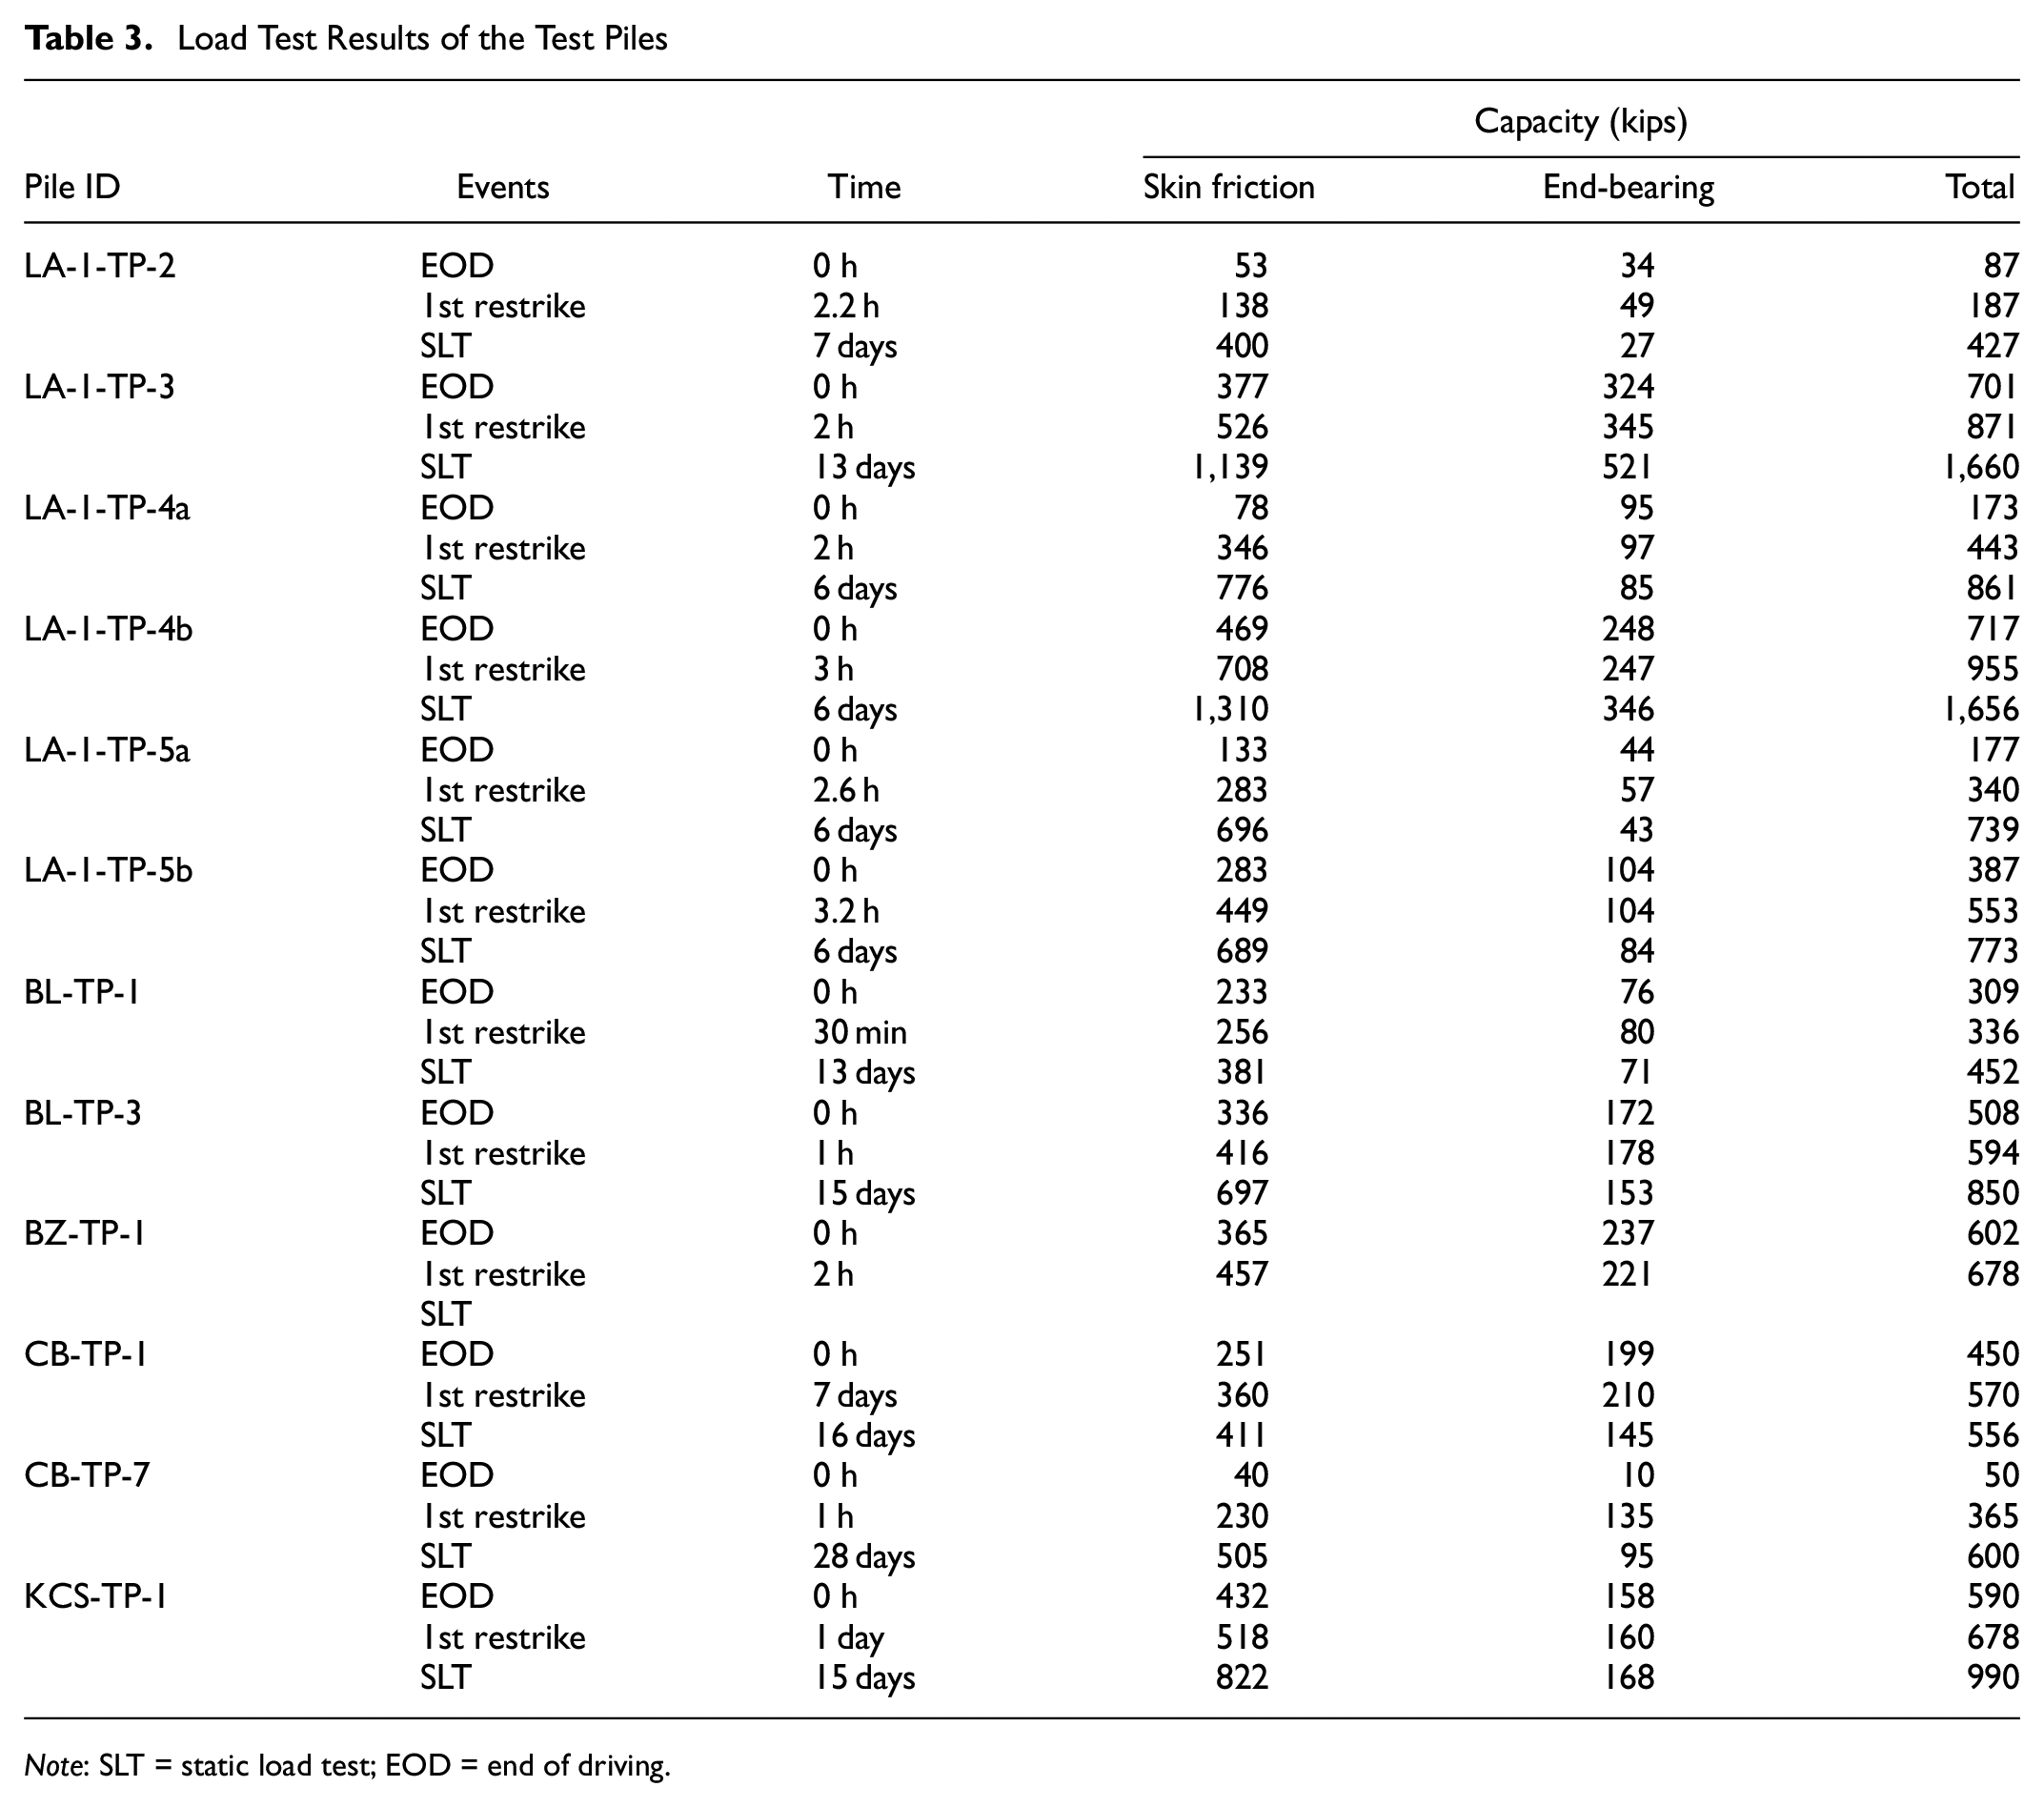
The purpose of the pile load tests was to confirm pile capacity, study load transfer behavior, and assess drivability. Usually, one dynamic load test (DLT) was performed immediately after driving and one SLT was performed 14 days after end of driving (EOD). The test schedule for conducting SLTs and DLTs is presented in Table 3. The skin friction (Rs), Rtip, and total capacity (Rt) during each event are also presented in Table 3.
Load Test Results of the Test Piles
Note: SLT = static load test; EOD = end of driving.
Dynamic Load Test
The TPs were dynamically monitored using Pile Driving Analyzer (PDA®) during driving and followed by restrikes. The DLTs were performed in accordance with ASTM D 4945-89. The Rt of the pile at EOD is normally measured or calculated through the DLT with the aid of a PDA. The Case Pile Wave Analysis Program (CAPWAP®) separated Rt into Rtip and skin friction Rs.
Static Load Test
SLTs were performed in all the TPs that were used to estimate the distribution of skin friction along the piles’ length with the aid of the embedded VWSGs. The compression SLTs were performed in accordance with the ASTM D-1143 quick test loading option. Sixteen steel pipe piles of 24-in. (610-mm) diameter were installed at each TP location as part of the reaction frames that were driven in a square pattern with the TP located in the center. The load reaction frame was designed to support a maximum load of approximately three times the design load of each TP. All the TPs in this study failed before reaching the maximum design capacity of the reaction frame. The pile head displacement under the applied loads was measured by two dial gauges mounted diagonally on opposite sides of the TP, and were supported against two independently horizontal reference beams. Example load settlement plots for all the TPs at the LA-1 site are presented in Figure 3. The load settlement plots for the other TPs can be found in Abu-Farsakh et al. ( 23 ).

Example load settlement plots from the static load tests: (a) LA-1-TP-2, (b) LA-1-TP-3, (c) LA-1-TP-4a, (d) LA-1-TP-4b, (e) LA-1-TP-5a, and (f) LA-1-TP-5b.
Converting Strain to Load
The main objective of instrumenting the TPs with VWSGs was to have the ability to calculate the skin friction and Rtip separately for the SLTs, and to determine the load distributions along the length of the piles. A pair of VWSGs installed near the ground surface, just above the zone of soil resistance, was used to calculate the section modulus of the pile. The load (P) was then calculated to that corresponding strain using the following equations:

and

where
Et = tangent elastic modulus,
ε = measured strain,
dσ = change of stress from one load increment to the next,
dε = change of strain from one load increment to the next, and
A = cross sectional area of the pile.
A detailed procedure for calculating the load from the tangential modulus and varying strain was presented by Fellenius et al. ( 26 ). Figure 4 presents the applied load versus depth for the TPs of the LA-1 site. (The load distribution plots of the other TPs can be found at Abu-Farsakh et al. [ 23 ].) The strains recorded at the gauge level near the pile tip comprised both the end-bearing and skin friction capacities of the bottom pile segments.

Example load distribution plots from the static load test: (a) LA-1-TP-2, (b) LA-1-TP-3, (c) LA-1-TP-4a, (d) LA-1-TP-4b, (e) LA-1-TP-5a, and (f) LA-1-TP-5b.
Unit Skin Friction (fs) Distribution
Most of the available models to estimate α are based on correlating with Su. Several researchers ( 4 , 11 , 7 , 17 ) have proposed correlations between α and Su after analyzing the load test results from instrumented TPs. The authors of this study used the results from their own load testing program of 12 instrumented TPs to develop a model between α and Su. To do this, the fs (i.e., skin friction/contact area) of individual soil layers was calculated and correlated with the Su in a similar way to Equation 1. Example fs along the length of TPs from the LA-1 site are presented in Figure 5.

Example unit skin friction plots from the static load test: (a) LA-1-TP-2, (b) LA-1-TP-3, (c) LA-1-TP-4a, (d) LA-1-TP-4b, (e) LA-1-TP-5a, and (f) LA-1-TP-5b.
Correlation and Model
Correlation of Total Stress Parameter (α) and Undrained Shear Strength (Su)
The back-calculated α values for all soil layers along the TPs for all sites are tabulated in Table 2. In this study, a total of 71 soil layers were considered for the 12 TPs. Clayey soil behavior was dominant in 56 soil layers; whereas 15 soil layers were considered to be sandy. The maximum and minimum values of α were 1.80 and 0.22, which were exhibited by Layer 2 of LA-1-TP-2 and Layer 2 of LA-1-TP-5b, respectively (Table 2). The average value of α for the clayey soil layer was 0.96. The average value of β for the sandy soil layer was 0.28. The maximum and minimum values of β were 0.83 and 0.11, which were exhibited by Layer 6 of CB-TP-7 and Layer 2 of LA-1-TP-2, respectively (Table 2). It is interesting to note here that the estimated α and β values in this study were within the range reported in the available published literature ( 1 – 4 ).
As stated earlier, one objective of this study was to develop a model that can estimate α from Su. Su evaluated by the UU test was used in this study to develop the correlation. It was observed from Table 2 that there was a relationship trend between Su and α that was similar to that in the literature ( 1 , 6–9), such that α decreases with an increasing Su value. The maximum value of α was exhibited by soil Layer 2-1 of LA-1-TP-2, which had a very low Su of 200 psf (pound per square foot). On the contrary, the lowest value of α was exhibited by Layer 5b-2 of LA-1-TP-5b, which had an Su of 1,420 psf. An attempt to correlate Su with α for the individual clayey soil layers was undertaken and the results are depicted in Figure 6. Close inspection of these results indicated that there was an inverse exponential relationship between α and Su. Stiff clayey soil layers with a high Su exhibited a smaller value of α. On the other hand, soft clayey soil layers with low Su values exhibited higher values for α.

Correlation between undrained shear strength (Su) and total stress parameter (α).
Developed Model to Estimate Total Stress Parameter (α)
Comprehensive statistical analyses were carried out on the collected field measurements to develop a simple regression model between α and Su as measured by the UU triaxial test. Forty two clayey soil layers (75%) out of the 56 clayey soil layers were randomly selected to develop the model, and the remaining 14 clayey soil layers (25%) were used for verification of the proposed model. Regression analyses were performed with the aid of the SAS® program on 42 clayey soil layers of the 12 TPs that were used to develop the α–Su model. Once a preliminary model was selected, detailed statistical analyses such as the significance of the model as a whole (F-test) and the significance of the simple regression coefficient (t-test) were carried out. The selection criteria of the model was chosen to be <0.05. The significance of the model for both tests was <0.0001, which provided sufficient confidence to implement this model. Based on the statistical analyses, the following regression model was proposed to estimate α for individual clayey soil layers:

where Su is in psf. The coefficient of determination (R 2 ) of this correlation was 0.52. The statistical analyses to develop the model are presented in Figure 7. Figure 7a shows the measured versus predicted data that were used to develop the model. The mean of the measured versus predicted data was 1.05 and the coefficient of variation (COV) was 0.29. The measured mean square error (MSE) of this data set was 0.08.

Statistical analyses for proposed model and verification: (a) measured versus predicted total stress parameter (α) for 75% data and (b) measured versus predicted total stress parameter (α) for verification data.
Verification of the Model
The remainder of the 25% fs data were used to verify the α–Su model. The comparison between measured versus predicted α values is depicted in Figure 7b. The figure clearly demonstrates that the developed model can estimate α with good accuracy, with the mean of the measured versus predicted total stress parameter close to unity (i.e., 1.09) and low COV.
Comparison with Other Available Models
The developed α–Su model was compared with other existing models in literature ( 1 , 2 , 4 , 8 ) and is presented in Figure 8. The values from the proposed α–Su model of this study were within the range of those reported by existing models. However, the upper portion (i.e., values over 1) of the proposed model was discarded owing to design safety. The calculated values of α which were greater than 1 were as a result of the very soft condition of the soil where the load testing program was conducted. Furthermore, for displacement piles in very soft soils, the installation process increases the total stresses. Once the excessive pore water pressure had dissipated, the soil gained strength, which resulted in α becoming higher than 1. Moreover, during pile installation the lateral force from the expansion of the cavity caused the principle stress to rotate. It is possible that the rotation of the principal stress resulted in K > 1, thus, increasing the normal stress on the pile surface. Normal force is given by,

where σvo is effective overburden pressure, and Kp is the coefficient of lateral earth pressure. Pile driving also remolds soil. At the tip of pile, the soil is squeezed and pushed up the pile. This action can cause soil particles to change orientation and, therefore, change the preferential shear planes. This action is repeated for each hammer blow, which could result in a higher α. Secondary compression also causes soft soils to have higher apparent shear strength and higher α. The repetition of this action, corresponding to each hammer blow, has the potential to escalate overall α. As the hammer strikes repeatedly, it induces additional stress on the material, leading to an incremental increase in α. Furthermore, the secondary compression of soft soil exacerbates this effect, as it contributes to the elevation of apparent shear strength within the soil. Consequently, this secondary compression results in an augmentation of the overall α. The combined impact of both the repetitive hammer blows and the secondary compression of soft soil synergistically leads to an escalation in the material’s stress parameter: α.

Comparison of the proposed model with available literature.
Model Limitation
The empirical α–Su correlation was developed from solid PSC pile load tests with pile dimensions ranging from 16 to 36 in. Reasonable agreement was observed between the measured and estimated α values. However, extending the model to other types or sizes of piles might result in unacceptable deviations. Furthermore, the soil conditions for these 12 TPs were mostly from clayey soil layers with the presence of sandy and silty interlayers with Su ranging from 160 to 4,000 psf. Although good agreement was observed when the model was applied to the verified pile data, there might still be some risk in applying the model to soils from other geological origins and soils with substantially different properties.
Summary and Conclusions
A load testing program was conducted on 12 instrumented TPs from five different construction projects in Louisiana. Laboratory and in situ soil testing were conducted at the test pile locations to characterize the subsurface soil profile and evaluate the soil properties. Both SLTs and DLTs were conducted on the TPs. The results of the load testing program were used to determine the ultimate load capacity, the distribution of skin friction and to measure the skin friction and Rtip separately for the TPs. Based on the load test field measurements on the PSC-driven piles and statistical regression analyses, the following conclusions can be drawn:
The load distribution plots from the SLTs were used to calculate fs for individual soil layers along the piles. α and β were back-calculated from the measured fs and Su data.
α calculated from the SLTs for clayey soil layers ranged from 0.22 to 1.80 with an average value of 0.96. β calculated for sandy soil layers ranged from 0.11 to 0.83, with an average value of 0.28. The values of the design parameters (α and β) were comparable to the results from previous studies in literature.
Analyses of the tested data showed that α decreased with increasing values of Su. Some 75% of the load test data were used to develop an empirical model between α and Su. The developed model can be used to estimate α for the clayey soil layers from Su. The COV of the measured over the estimated data was 0.29 and MSE was 0.18.
Good agreement was observed between the measured and predicted α. Statistical analyses also showed that the developed models can be implemented with confidence as the mean of the measured over the predicted α was close to unity (i.e., 1.09).
Footnotes
Acknowledgements
The authors gratefully acknowledge the comments and suggestions from Zhongjie Zhang, Pavement and Geotechnical Administrator.
Author Contributions
The authors confirm contribution to the paper as follows: study conception and design: Md. N. Haque, M. Abu-Farsakh; data collection: Md. N. Haque, M. Abu-Farsakh; analysis and interpretation of results: Md. N. Haque, M. Abu-Farsakh; draft manuscript preparation: Md. N. Haque, M. Abu-Farsakh. All authors reviewed the results and approved the final version of the manuscript.
Declaration of Conflicting Interests
The authors declared no potential conflicts of interest with respect to the research, authorship, and/or publication of this article.
Funding
The authors disclosed receipt of the following financial support for the research, authorship, and/or publication of this article: This research was funded by the Louisiana Transportation Research Center (LTRC Project No. 17-1GT) and Louisiana Department of Transportation and Development.
