



Abstract
The flashing yellow arrow (FYA) indication has become commonly used for communicating permissive left-turn operations to road users. A conventional signal phasing communicated to left-turning drivers consists of a leading protected phase followed by a permissive phase using a FYA indication, often referred to as protected-permissive. To transition from the protected to the permissive phase, change (steady yellow arrow) and clearance (steady red arrow, all-red) intervals, or only a change interval, may be used. There is no specific guidance on the use of clearance intervals for left turns with protected-permissive phase and FYA indication. In this study, field data were collected from different geographical regions in the United States to evaluate change and clearance intervals with the objective of developing guidance. Video data were recorded at 37 intersections during peak hours, for approximately 142 h, across eight states. Overall, 4,001 observations of vehicles turning left during the change or clearance interval were analyzed. Field observations were evaluated at the approach level to assess left-turn violation rate and violations per cycle as a function of change and clearance interval configuration. At the individual vehicle level, logistic regression was implemented to evaluate the effect of change interval and clearance interval duration, delayed onset of FYA, and regional variation. The results of the analysis at the approach and individual vehicle level were consistent and indicate that: (i) a clearance interval should be included, (ii) delaying the onset of FYA indication with an extension beyond the all-red clearance interval would reduce left-turn signal violations, and (iii) duration of change intervals has a marginal impact on left-turn signal violations.
Permissive left-turn traffic operations have historically been communicated to drivers using several signal indication patterns, colors, and shapes. Patterns include both steady and flashing indications. Indication colors used are typically green, yellow, and red. For shapes, circular signs or arrows have been displayed. Of the various signals implemented, the flashing yellow arrow (FYA) indication has proved to be an effective signal to communicate the permissive phase for left-turn movements at signalized intersections ( 1 – 20 ).
Protected-permissive left-turn signal phasing communicated to left-turning drivers consists of a leading protected phase with a steady green arrow (SGA) indication in which left-turning vehicles can proceed through the left-turning movement unobstructed since opposing traffic is stopped (communicated by a steady circular red signal). The left-turn SGA indication is followed by a steady yellow arrow (SYA) indication, referred to as the change interval, to indicate that the left-turn protected phase is being terminated. The SYA indication may be followed by a steady red arrow (SRA) indication, referred to as the clearance interval, to indicate that no vehicle shall enter the intersection to make the left-turning movement indicated by the arrow. The change and clearance intervals, or only the change interval, are methods used to indicate the transition from a leading SGA indication protected phase to a FYA indication permissive phase for left-turn movements. The FYA indication requires left-turning road users at intersections to yield to oncoming traffic before proceeding with the left-turn movement.
Since the inclusion of the FYA permissive left-turn indication in the 2009 edition of the US Manual of Uniform Traffic Control Devices (MUTCD) ( 21 ), agencies have embraced its implementation nationwide. Despite its widespread implementation, the use of a clearance interval in the transition from protected to permissive phasing is not well defined. Specifically, for protected-permissive left-turn signal phasing, there is no clear national guidance on the use of a clearance interval before initiating the FYA indication, or when used, the duration of the clearance interval. As part of this research, field data were collected from different geographical regions in the United States to evaluate the effect of change and clearance intervals on left-turn signal compliance with traffic signal systems using the FYA indication. The primary objective was to assess the need for transition (i.e., clearance) intervals and develop the appropriate guidance for its use.
Literature Review
The literature review provides an overview of existing guidance and the most relevant research pertaining to change and clearance intervals used before a permissive left-turn FYA indication.
Existing Guidance
MUTCD Section 4F.17 provides that: “A steady yellow signal indication shall be displayed following every CIRCULAR GREEN or GREEN ARROW signal indication and following every flashing YELLOW ARROW or flashing RED ARROW signal indication displayed as a part of a steady mode operation” ( 21 ). A steady left-turn yellow arrow is also recommended after a FYA when a steady left-turn red arrow will subsequently be displayed. MUTCD does not prescribe a standard method for determining the duration of the yellow change interval, nor does it require an SRA indication displayed before the FYA indication. MUTCD Section 4F.17 provides that the duration of yellow and red clearance intervals should be determined based on engineering practices. Its guidance for yellow change interval is that: “A yellow change interval should have a minimum duration of 3 seconds, and a maximum duration of 6 seconds. The longer intervals should be reserved for use on approaches with higher speeds.” ( 21 ). The Institute of Transportation Engineers (ITE) ( 22 ) has also issued updated guidance on change and clearance intervals based on an extended kinematic equation that includes the calculation of critical distances and speed profiles for free-flowing and left-turning vehicles. For the calculation of the minimum yellow change interval, variables used in the kinematic equation include the 85th percentile approach speed, 85th percentile intersection entry speed (or 20 mph), maximum safe and comfortable deceleration, and perception–reaction time. In left-turning movements, allowance of up to a maximum of 7 s clearance interval has been considered.
The concept of the red clearance interval was first introduced by ITE in the 1950 Institute of Traffic Engineering Handbook ( 23 ). Quantitative guidance for the red clearance interval has evolved from an interval of 1–2 s if the calculated yellow change interval exceeds 5 s, to a choice of three durations based on empirical equations, to the current extended kinematic equation used to calculate the red clearance interval. Current models consider the width of the intersection, length of vehicle, and vehicular movement start up delay. Additionally, the new kinematic equation considers that turning vehicles travel at slower speeds through the intersection ( 22 ). The MUTCD guidance for red clearance interval is: “Except when clearing a one-lane, two-way facility (see Section 4O.02) or when clearing an exceptionally wide intersection, a red clearance interval should have a duration not exceeding 6 seconds” ( 21 ).
Studies on Transition Intervals
Research conducted on yellow change and red clearance intervals has mainly focused on dilemma zones where drivers may decide either to proceed or to stop at the onset of a steady yellow signal. From field observations, Gates et al. ( 24 ) evaluated 898 vehicles that were the first to stop or last to go during the yellow change interval. The geometric and operational variables evaluated included duration of the yellow interval and signal cycle length; however, neither variable was found to significantly affect stop and go events. The factors with the most influence on driver decision-making were shorter travel time to intersection at the onset of yellow, with higher probability of stopping associated with shorter clearance interval, longer cycle lengths, passenger vehicle, presence of opposing roadway users, and absence of vehicles in adjacent through-lanes ( 24 ).
Using an instrumented vehicle and a test track intersection, Rakha et al. ( 25 ) evaluated 60 test drivers at the onset of the steady circular yellow indication to study driving behavior, in particular, perception–reaction time and stop/go decisions. The results of this controlled experiment demonstrated that perception and reaction time is affected by the time headway to the intersection at the onset of yellow. The probability of stopping varied from 100% to 9% when a vehicle’s time to intersection at the onset of a yellow was 5.5 s and 1.6 s, respectively. Male drivers had a lower probability of stopping compared with female drivers. In relation to age, drivers 65 years of age and older were significantly less likely to clear the intersection at a short yellow change interval when compared with other age groups ( 25 ).
Mohammed et al. ( 26 ) conducted a driving simulator study to understand behavioral factors that influence a driver’s decision to stop or go at the onset of steady circular yellow indication. Data consisted of 53 participants, who had 644 instances of stopping at the stop line and 628 instances of going through the intersection at the onset of yellow change interval. It was found that a driver’s stop and go decision in response to a steady circular yellow indication was associated with the time to the stop line, tailway time to the following vehicle, subject vehicle speed, and driver’s age. Hurwitz et al. ( 4 ) documented decision-making boundaries for the dilemma zone which resulted in more vehicles proceeding through the intersection on the yellow indication than the time to the stop line definition. Liu et al. ( 27 ) found that the length and location of the dilemma zone varied with the speed of the vehicle, reaction time, and the operational tendencies of different driving populations. Significant differences between the observed size and location of the dilemma zone and theoretical estimates were observed.
Methodology
Field data were collected and evaluated at the approach level to assess the impact of change and clearance intervals on compliance with left-turn traffic signal operations using a FYA permissive left-turn signal indication. Logistic regression was implemented to evaluate the odds ratios of predictor variables and assess the effect of change interval, clearance interval, SRA extension (for delayed onset of FYA), and regional variation.
Field Data Collection
State and local agencies across the country were contacted for potential data collection locations. Selection criteria for identifying data collection locations included: protected-permissive left-turn operations using a FYA signal indication, the duration of change and clearance intervals implemented, and geographic distribution. The research team visited and collected data at 37 intersections across eight states covering different geographical regions in the United States, as illustrated in Figure 1.
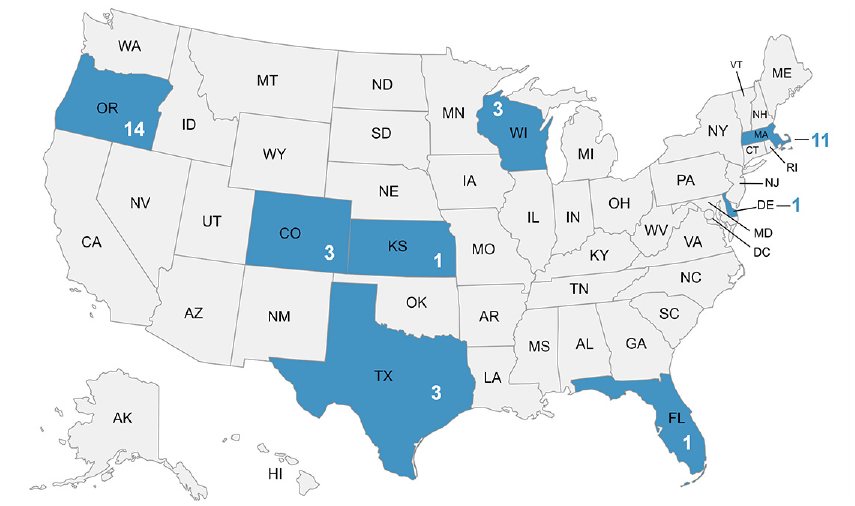
States and numbers of intersections where data were collected.
Video data collection consisted of recording left-turning vehicles, left-turn signal indication, intersection stop bar pavement marking, and opposing traffic. Figure 2 provides a screenshot of the video from one of the camera views at the intersection located on Route 20 at Little River Road in Westfield, MA. Figure 2 shows the view from a camera located on the side of the road before the left-turn stop bar to capture the signal indication as left-turn vehicles arrived at the intersection approach. Using a second camera, the opposing approach view was simultaneously captured. Video data were collected during morning and evening peak hours.
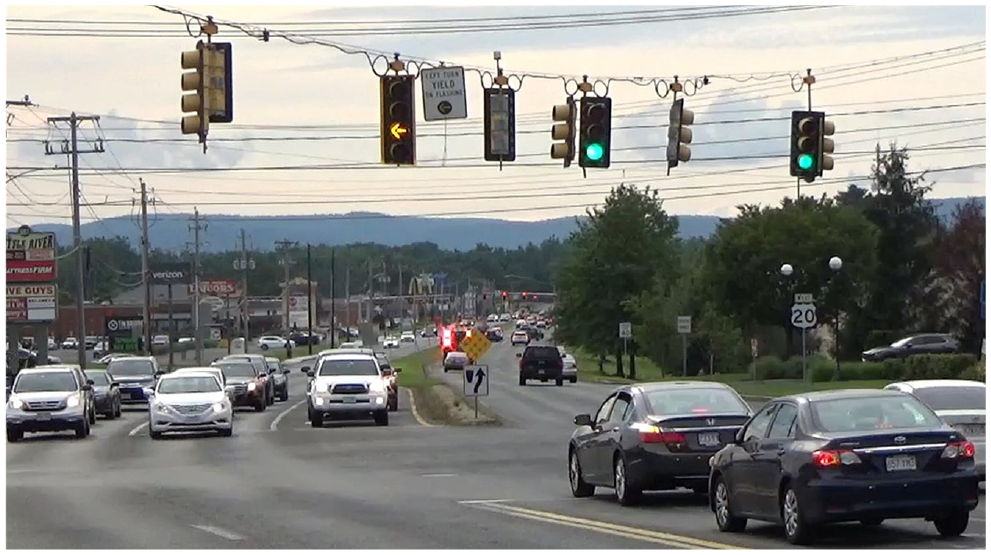
Screenshot of video on Route 20 at Little River Road in Westfield, MA.
At the different locations, change intervals ranged between 3.0 s and 5.0 s while clearance intervals ranged between 0.0 s and 6.0 s. The majority of left-turn signal displays were vertically arranged (33 locations), some were horizontally arranged (3 locations), and one had T-arrangement signal heads. There were four locations using a SRA extension (RX). The SRA extension consists of an extended SRA indication duration for left-turning vehicles, beyond the all-red clearance interval, to provide a delayed onset of the FYA. Overall, approximately 142 h of video data were collected.
Video Data Processing
Video recordings were processed to extract data for left-turning vehicles during the change and clearance intervals and during the FYA signal indication. The videos were reproduced in high precision frame rate software to visualize and record time in milliseconds. Observed vehicle movements categorized as left-turning maneuvers were those that arrived at the intersection left-turn stop bar when the traffic signal indication was a SYA, SRA, or FYA. The following data elements were collected for each observation:
State
Intersection identity (ID)
Intersection approach
Steady yellow arrow (SYA) change interval duration (seconds)
Steady red arrow (SRA) clearance interval duration (all approaches red clearance), (seconds)
Steady red arrow extension (RX) duration (beyond all-red clearance), (seconds)
Left-turn vehicle ID
Length of queue (number of vehicles in front of the observed left-turn vehicle)
Presence of opposing through-vehicles (yes, no)
End of steady green arrow (SGA) time stamp (t0) (hour, minute, and second: hh:mm:ss)
Left-turn vehicle arrival time stamp (t1), (hh:mm:ss) (at or in reference to the stop bar)
Left-turn vehicle crossing over opposing traffic lanes time stamp (t2) (hh:mm:ss)
Signal indication at t1 (SYA, SRA, FYA)
Signal indication at t2 (SYA, SRA, FYA, SGA)
Left-turn vehicle decision (STOP, GO)
End of steady green arrow (SGA) time stamp minus left-turn vehicle arrival time stamp (t0–t1) in seconds
End of steady yellow arrow (SYA) time stamp minus left-turn vehicle arrival time stamp (t0+SYA–t1) in seconds
Figure 3 provides an illustration of the sequence of events to record time stamps for a left-turning vehicle stopping during the clearance interval and proceeding during the permissive phase with a FYA signal indication. Time stamp t0 is the time when the protected phase (SGA signal indication) ends, so the time stamp was recorded immediately when the steady yellow arrow (SYA signal indication) appeared. Time stamp t1 represents the time when the left-turning vehicle arrives at the intersection. The arrival time stamp depends on the type of maneuver and the decision of the left-turning driver. For instance, for stopping vehicles, drivers may have started braking before the stop bar and approached the stop bar slowly. Thus, when the rear brake lights of the vehicle were illuminated and visible, and the vehicle started decelerating, the arrival t1 time stamp was recorded. Conversely, if vehicles stopped beyond the stop bar, the time stamp (t1) of arrival was recorded at the stop bar. Time stamp t2 was recorded when the left-turning vehicle crossed the opposing traffic lanes. If the left-turning vehicle proceeded (GO) to cross over opposing traffic lanes during the change/clearance interval, the signal indication may have been SYA, SRA, or FYA; however, if the left-turning vehicle did not proceed (STOP) to cross over opposing traffic lanes, the left-turn vehicle would have waited and proceeded during the permissive phase with a FYA or waited until the next protected phase to proceed with a SGA signal indication. Thus, the time difference between t2 and t1 reflected the time it took the left-turning vehicle to cross opposing traffic lanes since the arrival at the intersection. Time stamps were also used to calculate the time difference in seconds between the time of arrival with reference to the end of SGA or SYA.

Sequence of events for timestamps.
Since video data captured two approaches at each intersection, analysis was conducted at the intersection approach and individual vehicle level. Left-turn observations were limited during the clearance interval for some approaches; therefore, data were reduced to 22 intersection approaches for analysis. Overall, 4,001 observations were obtained and used in the analysis.
Data Analysis
Signal violation can be used as a performance measure to assess the effectiveness of traffic signal indication and phasing. For left-turn movements with protected-permissive phasing using a FYA indication, drivers may develop specific behaviors from familiarity with intersections’ traffic operations, delay, gap acceptance, signal configuration, and geometry. Transition intervals such as change and clearance intervals play an important role in protected-permissive left-turn signal compliance. Left-turn signal violations are of concern because drivers are exposed to right-angle crashes, which tend to be relatively severe. Therefore, analyses were conducted at the approach and individual vehicle level. At the approach level, two performance measures were used: (i) violation rate and (ii) average violations per cycle. A signal violation was defined in this research as follows:
Failure to stop: A left-turning driver proceeds (GO) through the intersection during the clearance interval (SRA), or
Failure to yield: A left-turning driver proceeds (GO) through the intersection during the FYA signal indication without yielding to the opposing traffic.
The violation rate was computed as the percentage of violators (GO on SRA or FYA) compared with vehicles that stopped (STOP on SYA, SRA, or FYA). Since proceeding through an intersection when a steady yellow signal indication is displayed is not a signal violation, observations with left-turning vehicles that proceeded with SYA were not considered for the signal violation measures calculation. The figure for average violations per cycle was computed as the ratio between the number of violators (GO on SRA or FYA) divided by the number of signal cycles observed.
Logistic Regression Modeling
Logistic regression models the probability of an event occurring based on a given dataset of independent variables. In this research, the event modeled is the probability of a violation given left-turn operations and clearance interval characteristics. The logistic function is defined as:

where the relationship between the outcome variable and independent variables is of a linear form,

with the probability of an event occurring estimated by assuming

Odds is defined as the probability of an event occurring divided by the probability of the event not occurring. The general form of the odds is provided as follows:
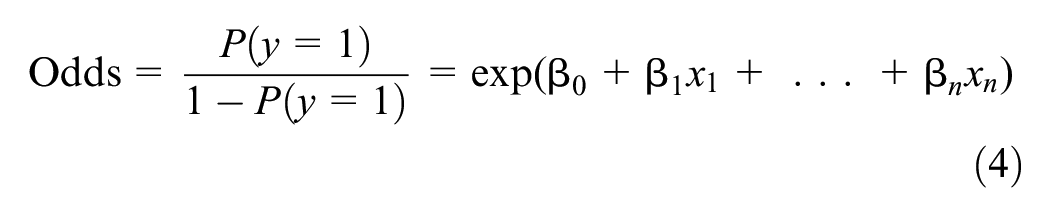
The odds ratio is defined as the measure of association between independent variables and the likelihood of an event occurring, so the odds ratio is usually estimated for a one unit increase of an independent variable:

The odds ratio can also be estimated for multiple combinations and scenarios of independent variables.
Available data from left-turn observations were used for modeling driver’s decisions (GO/STOP) as a function of predictor variables. Predictor variables evaluated included the following:
Change interval (SYA) duration (seconds)
Clearance interval (SRA) duration (seconds)
SRA extension (RX) duration for delayed onset of FYA (seconds)
Position in queue (QU) (number of vehicles in front of subject vehicle)
Arrival of vehicle in reference to the end of the protected left-turn phase (AG)
Arrival of vehicle in reference to the end of change interval (AY)
Results
Approach Level Analysis
Results are summarized by intersection approach in Table 1. Although video data were collected from different intersections in different regions, several locations did not yield sufficient data and were not included in the analysis (e.g., Delaware). Intersection approaches had change intervals (SYA) between 3.0 s and 5.0 s and clearance intervals (SRA) between 0.0 s and 5.0 s. There were two intersection approaches with SRA extension (RX). The highest violation rates were greater than 50% and occurred at five intersection approaches, all without a clearance interval or with a very short clearance interval (0.5 s, one flash). Four of the five approaches were from Massachusetts, and one from Oregon. Figures 4 and 5 illustrate the violation rate and average violations per cycle for every intersection approach as a function of SYA and SRA intervals, respectively. Based on the distribution of violation rates and average violations per cycle, there is not a particular trend with the variation of the duration of the change interval between 3.0 s and 5.0 s. In contrast, violation rates and average violations per cycle exhibited a decreasing trend from 0.0 s to 5.0 s of clearance interval. Locations in Massachusetts showed the highest violation rates compared with locations in other states.
Data and Analysis by Intersection Approach

Note: EB = eastbound, WB = westbound, NB = northbound, SB = southbound; SYA = steady yellow arrow; SRA = steady red arrow; RX = steady red arrow extension for the delay onset of flashing yellow arrow (FYA).
Vehicles that went when the signal was steady yellow arrow (SYA).
Vehicles that went when the signal was steady red arrow (SRA) or flashing yellow arrow (FYA).
Vehicles that stopped when the signal was steady yellow arrow (SYA), solid red arrow (SRA), or flashing yellow arrow (FYA).
All GO and STOP observations.
Violation rate computed as the percentage of violators (GO on SRA or FYA) compared with vehicles that stopped (STOP on SYA, SRA, or FYA).
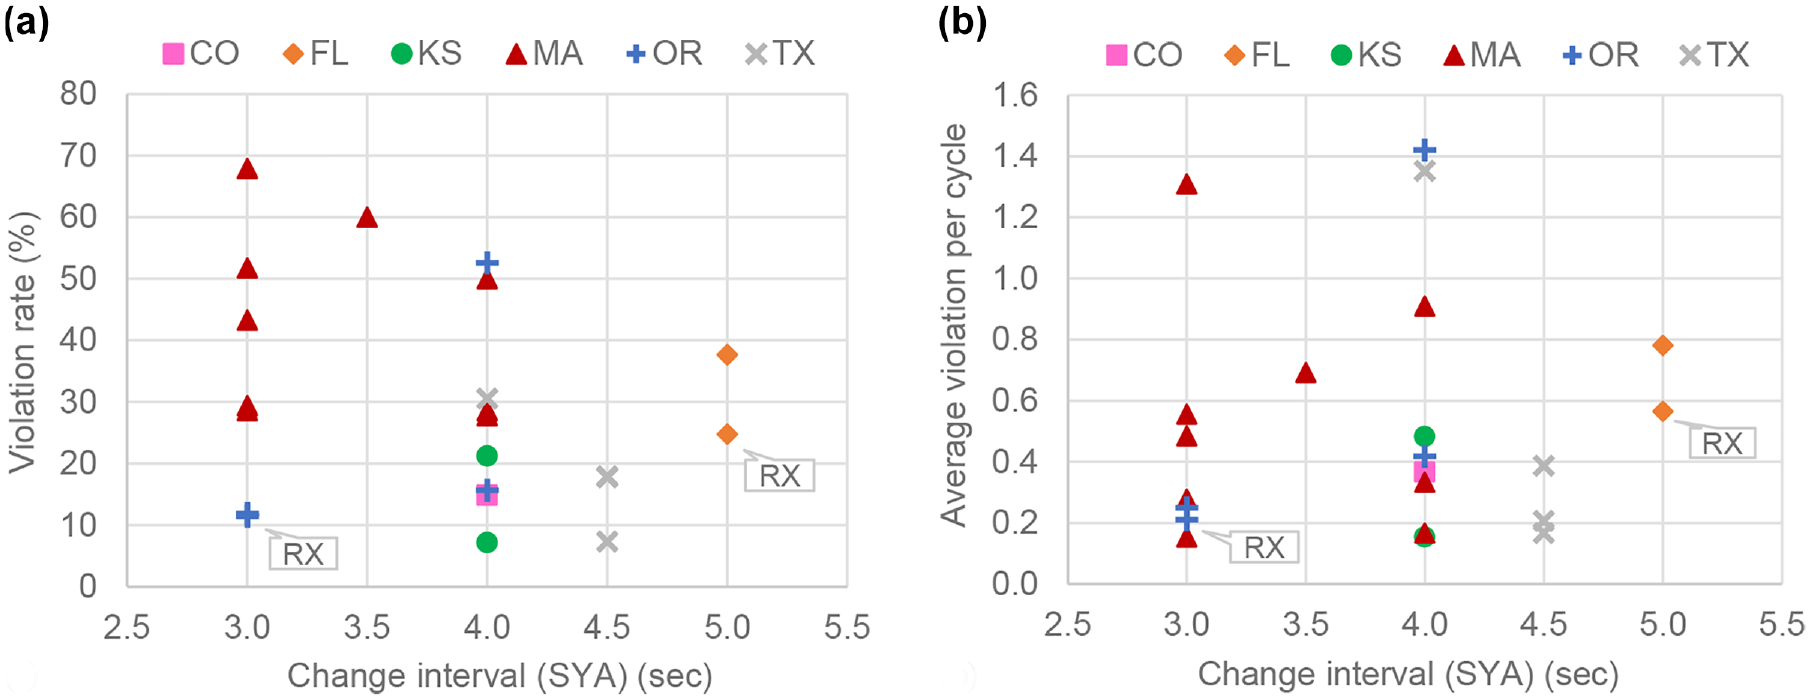
Signal violation measures as a function of change interval (SYA): (a) violation rate, (b) average violations per cycle.
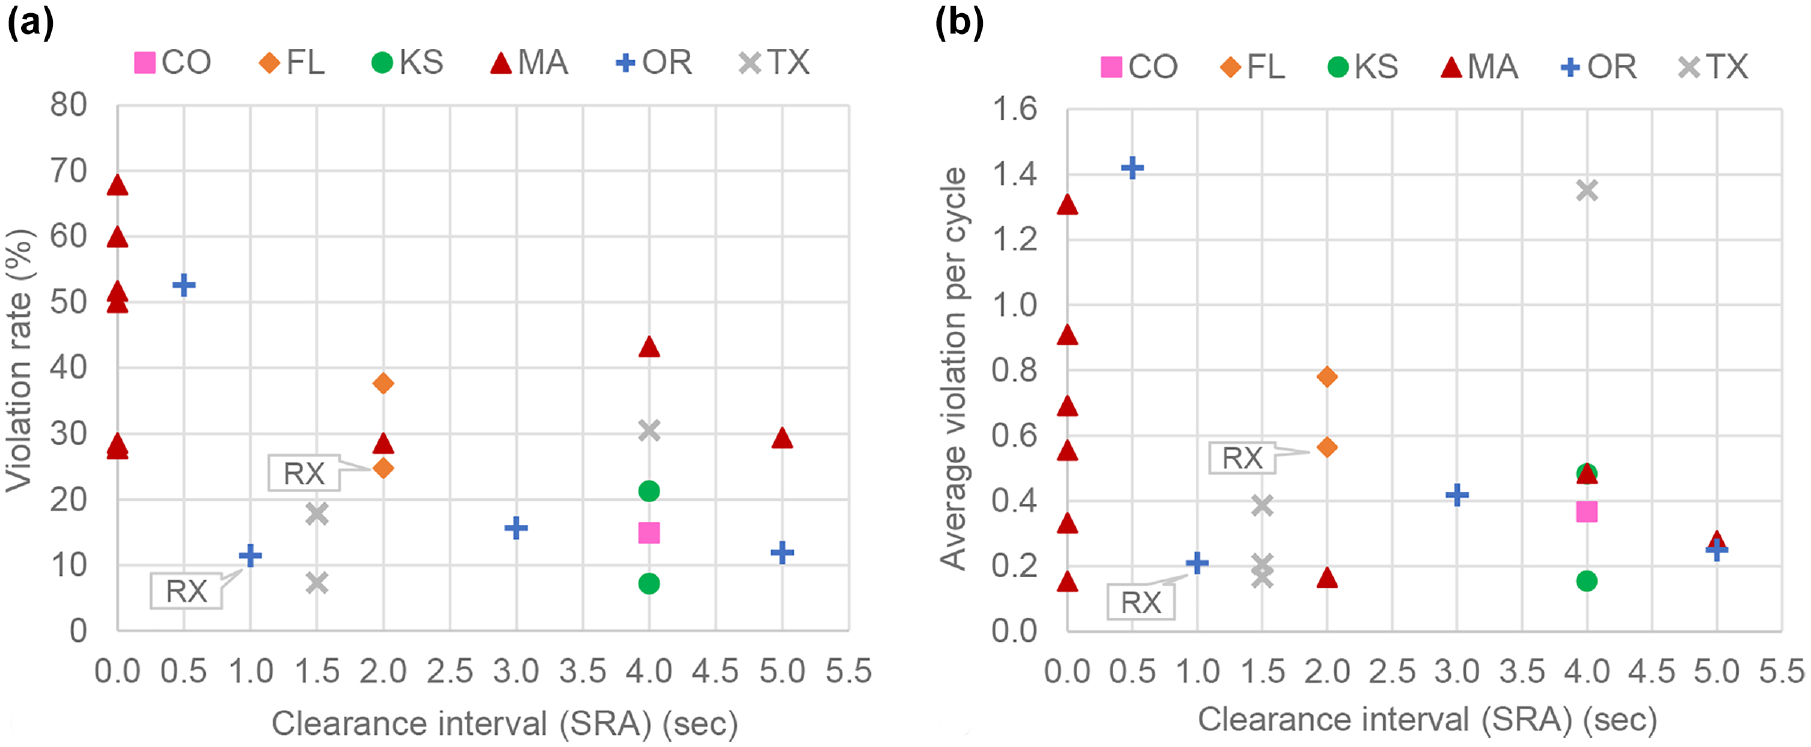
Signal violation measures as a function of clearance interval (SRA): (a) violation rate, (b) average violations per cycle.
After comparing the regions, it was found that the nine intersection approaches in Massachusetts had significantly higher violation rates (average violation rate of 43%) than the locations in other regions. Intersection approaches with SRA extension (RX), location No. 3 (SYA = 5.0 s, SRA = 2.0 s, and RX = 5.0 s) and location No. 15 (SYA = 5.0 s, SRA = 2.0 s, RX = 10.0 s), had violation rates of 25% and 11%, respectively, which were lower than the overall average of 30%. The highest average violation per cycle (>0.9 violation per cycle) were for four intersection approaches with no clearance interval (SRA) or a very short clearance interval. Based on the data available and the distribution of change interval (SYA), clearance interval (SRA), and steady red arrow extension (RX), intersection approaches were categorized into bins as shown in Table 2. Signal violation rates were calculated with and without intersection approaches with SRA extension (RX) and are also depicted in Figures 6 and 7.
Left-Turn Signal Violation Rates by Bin

Note: RX = steady read arrow extension after the clearance interval (SRA) before the onset of flashing yellow arrow (FYA); SYA = steady yellow arrow; SRA = steady red arrow; GO = vehicles that went when the signal was steady red arrow (SRA) or flashing yellow arrow (FYA); STOP = vehicles that stopped when the signal was steady yellow arrow (SYA), solid red arrow (SRA), or flashing yellow arrow (FYA); NA = not available.
Violation rate computed as the percentage of violators (GO on SRA or FYA) compared with vehicles that stopped (STOP on SYA, SRA, or FYA).
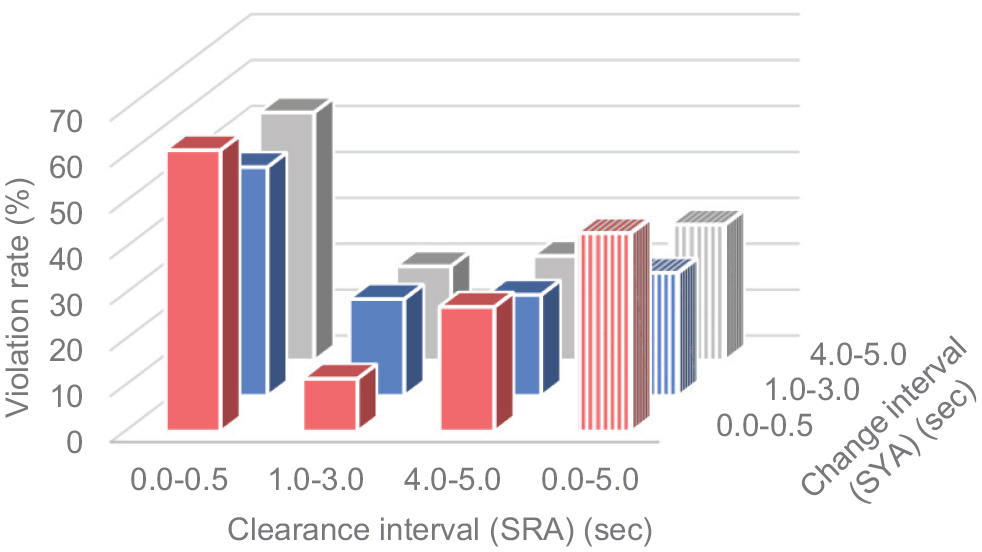
Left-turn signal violation rate as a function of change and clearance intervals (two locations with RX).
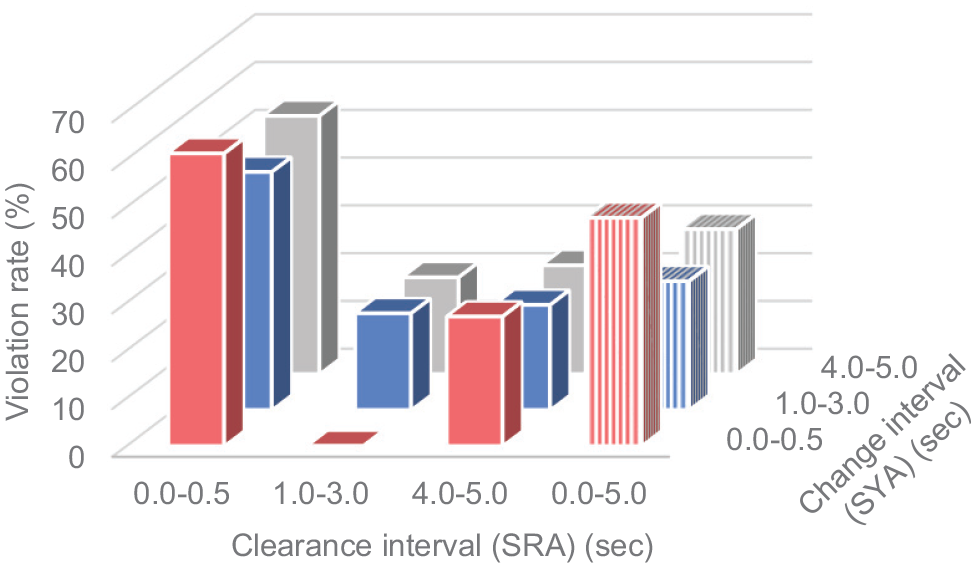
Left-turn signal violation rate as a function of change and clearance intervals (locations without RX extension).
The results showed that very short duration clearance interval or no clearance interval resulted in the highest violation rates. The lowest violation rates were observed with clearance intervals of 1.0 to 3.0 s; however, the violation rate increased with 4.0 to 5.0 s clearance intervals.
Field observations suggest that at the approach level, intersection approaches without a clearance interval or a very short clearance interval (0.5 s, one flash) have a significantly larger left-turn signal violation rate than intersection approaches with 1.0 to 5.0 s of clearance interval. This trend can be observed both in Massachusetts and Oregon locations which have very different driving behaviors (as observed from videos) and are from opposite coasts of the United States. Additionally, the duration of change interval (SYA) has a marginal impact on violation rates.
Vehicle Level Analysis
The approach level analysis considered the durations of change and clearance intervals and the impact on violations. However, the impact of position in the queue and the arrival time of vehicles with respect to the end of change interval (SYA) was not considered. Therefore, individual level analysis was required to incorporate these two crucial variables to estimate the odds of a driver choosing to commit a violation. Figure 8 provides histograms with the distribution of observations based on left-turning vehicle arrival time in reference to the end of the clearance interval (AY).
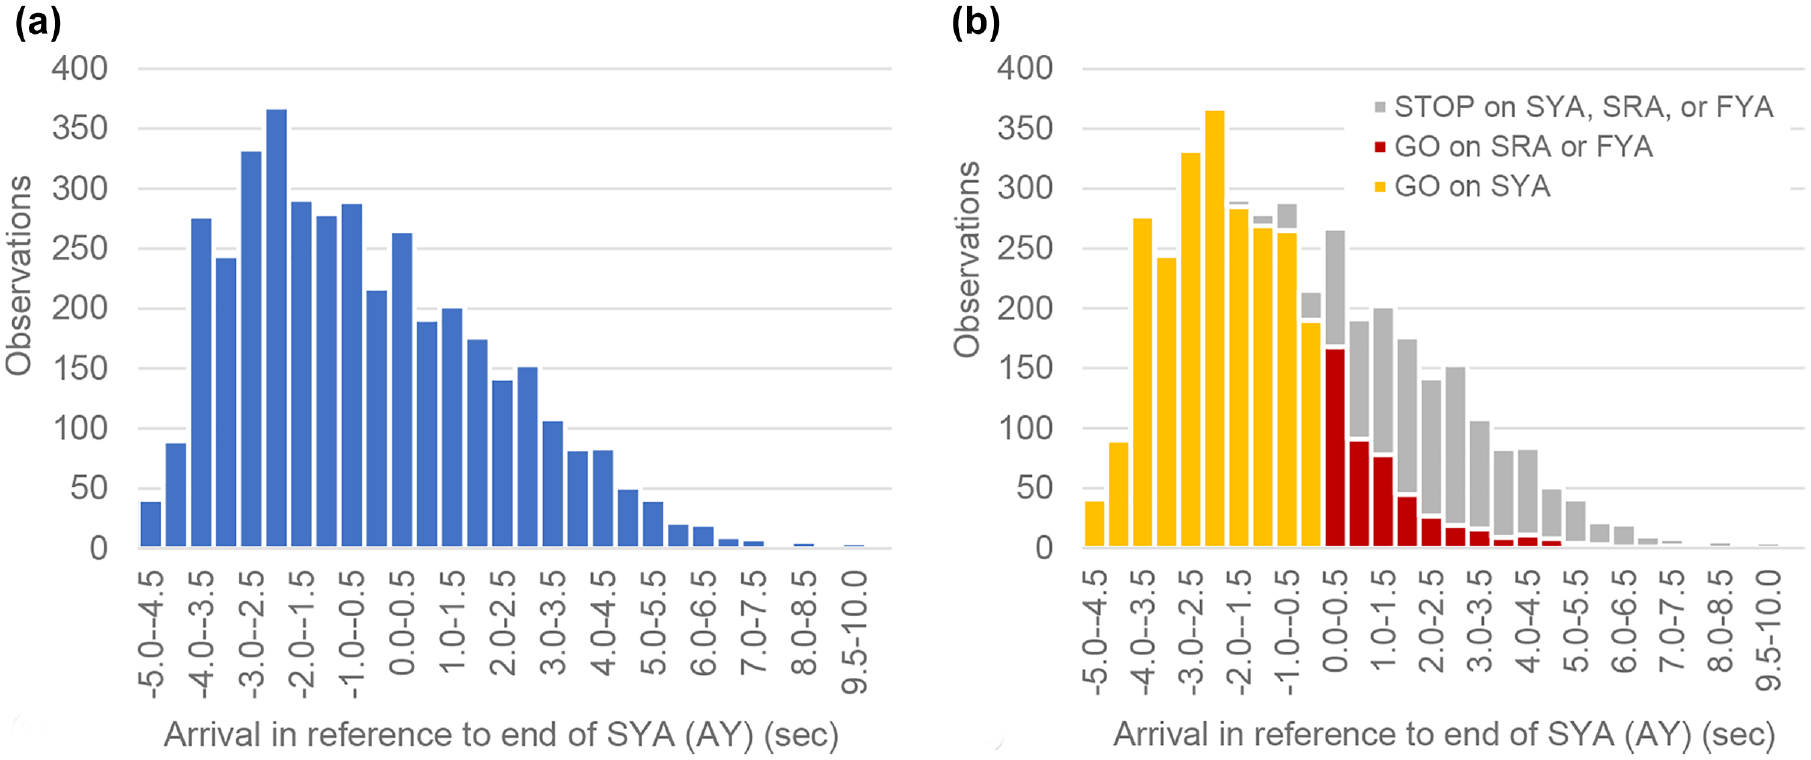
Distribution of left-turning vehicle arrival time observations: (a) distribution of left-turning vehicle arrival time observations in reference to the end of the change interval (AY), (b) stacked distribution of left-turning vehicles’ arrival time in reference to the end of change interval (AY) by decision (GO, STOP) and signal indication.
Figure 8a provides the distribution of left-turning vehicle arrival time observations in reference to the end of the change interval (AY). Figure 8b provides a stacked distribution of left-turning vehicles’ arrival time in reference to the end of change interval (AY) by decision (GO, STOP) and signal indication.
Logistic Regression Modeling Results
From all available 4,001 left-turn observations, the data used for modeling consisted of 1,501 observations which included 1,046 observations with STOP on SYA, SRA, or FYA (non-violators, y = 0), and 455 observations with GO on SRA or FYA (violators, y = 1). Left-turn observations with GO on SYA were not considered for modeling. Using logistic regression, predictor variables were coded and introduced in the model to evaluate coefficients (sign, magnitude, and statistical significance) and odds ratios were used to answer the research questions of this study. Modeling focused on evaluating if there was an effect of the change and clearance intervals, whether the clearance interval was required, effect of delayed onset of FYA signal indication, and regional variation. Through exploratory data analysis and modeling, the variance inflation factors (VIF) for the variables considered in the study were close to 1.00 which indicated that variables were not correlated, and multicollinearity was not of concern in the models.
Change Interval (SYA)
As presented in the literature review, MUTCD guidance recommends yellow change intervals between 3.0 s and 5.0 s, and for approaches with high speeds, the longer interval should be considered. The effect of the change interval was evaluated by modeling the arrival time in reference to the end of the protected left-turn phase with SGA (AG), change interval (SYA) duration, clearance interval (SRA) duration, and position in queue (QU). Observations with SRA extension (RX) were not included. Table 3 provides the results of the logistic regression coefficients of the model evaluating the change interval. The model coefficient for the change interval was not statistically significant as denoted by the very large p-value of 0.676. Therefore, with all factors considered, the change interval SYA did not have a significant impact on left-turn signal violations. This result is consistent with the findings from the approach level analysis.
Logistic Regression Modeling Results for Change Interval

Note: AG = arrival time in reference to the end of the protected left-turn phase (onset of solid yellow arrow); SYA = steady yellow arrow (change interval); SRA = steady red arrow (clearance interval); QU = queuing, number of vehicles ahead of the subject vehicle; CI = confidence interval; NA = not available; SE = standard error.
Table 3 also provides a summary of the odds ratios for effects of predictor variables. If a predictor variable in a logistic regression model has an odds ratio less than 1.0, it means that a one unit increase in that variable is associated with a decrease in the odds of the response variable occurring. Thus, the odds ratios in Table 3 can be interpreted as follows:
A 1.0 s increase in change interval (SYA) was associated with a negligible and not statistically significant effect of 1.07 (6.6%) in the odds of signal violation.
A 1.0 s increase in the clearance interval (SRA) was associated with a decrease of 0.14 (85.6%) in the odds of signal violation.
A one-vehicle increase in the queue (QU) was associated with an increase of 1.08 (7.9%) in the odds of signal violation.
Clearance Interval (SRA)
A logistic regression model was developed to determine whether the clearance interval affects left-turn signal violations. Predictor variables include arrival time in reference to end of the change interval with SYA (AY), presence of clearance interval (SRA), and position in queue (QU). Since the change interval (SYA) was found to have no statistical significance, arrival time in reference to the end of steady yellow arrow (AY) was used. The variable SRA was coded as zero for the absence of clearance interval or a very short (0.5 s) clearance interval, and SRA was coded as one for clearance interval greater than 0.5 s. Observations with SRA extension (RX) were not included. Table 4 provides the results of the regression model and corresponding odds ratios for predictor variables.
Logistic Regression Modeling Results for Clearance Interval

Note: AY = arrival time in reference to the end of the change interval (end of steady yellow arrow, SYA); SRA = steady red arrow (clearance interval, 0 = not included, 1 = included); QU = queuing, number of vehicles ahead of the subject vehicle; CI = confidence interval; NA = not available; SE = standard error.
All predictor variables are highly significant as indicated by p-values < 0.001. Predictor variables AY and SRA have negative coefficients which indicate a decrease in the probability of violation with each unit increase. The predictor variable QU has a positive coefficient which indicates an increase in the probability of signal violation per unit increase. Thus, the odds ratios in Table 4 can be interpreted as follows:
The later a vehicle arrives after the end of the change interval, the less likely it will be to violate the signal. A 1.0 s increase in arrival time of vehicles in reference to the end of the change interval (AY) was associated with a decrease of 0.55 (44.7%) in the odds of signal violation.
The presence of a clearance interval decreases the likelihood of a driver violating the signal. The presence of clearance interval (SRA) was associated with a decrease of 0.12 (88.1%) in the odds of signal violation.
The longer a vehicle is in the queue, the more aggressive a driver can be. Therefore, a one-vehicle increase in the queue position (QU) was associated with an increase of 1.08 (7.6%) in the odds of signal violation.
Steady Red Arrow Extension (RX)
Delayed onset of the FYA consists of additional SRA extension time beyond the all-red clearance interval when opposing through-traffic is presented with a steady circular green signal. The delayed onset of FYA signal indication provides additional time for opposing traffic to start moving before left-turning vehicles receive the permissive FYA signal indication. Models were developed for locations in Oregon and Florida which were the only two states with intersections with SRA extension.
Oregon Data
A regression model was developed to evaluate the effect of delayed onset of FYA signal indication which included predictor variables such as arrival in reference to the end of SYA (AY), clearance interval (SRA), steady red arrow extension (RX), and number of vehicles in front of the subject vehicle (QU). The four approaches evaluated had SRA clearance intervals of 0.5 s, 1.0 s, 3.0 s, and 5.0 s. The approach with SRA extension (RX) had a 1.0 s all-red interval. Table 5 provides the results of regression modeling and corresponding odds ratios for predictor variables. All predictor variables have negative coefficients which indicate a decrease in the probability of signal violation with each unit increase. SRA extension (RX) was statistically significant and associated with a decrease of 0.18 (81.8%) in the odds of signal violation. The odds ratios in Table 5 indicate that the inclusion of red clearance interval (SRA) was associated with a decrease of 0.46 (54.4%) in the odds of signal violation. A one-vehicle increase in the queue (QU) was associated with a negligible and not statistically significant effect of 0.95 (4.7%) in the odds of signal violation.
Logistic Regression Modeling Results for Delayed Onset of Flashing Yellow Arrow

Note: AY = arrival time in reference to the end of the change interval (end of steady yellow arrow SYA); SRA = steady red arrow (clearance interval); RX = delayed onset of FYA (SRA extension); QU = queuing, number of vehicles ahead of the subject vehicle; CI = confidence interval; NA = not available; SE = standard error.
Florida Data
Another regression model was developed to evaluate the effect of delayed onset of FYA signal indication. Two approaches to the intersection had all-red clearance interval of 2.0 s and one of the approaches had a 5.0 s red extension. Both approaches had similar geometry, traffic volume, and number of observations evaluated. Predictor variables AY, RX, and QU were included in the model and the results are provided in Table 5. Since the SRA clearance interval was the same for the two approaches, it was not necessary to include the SRA variable in the model to quantify its effect. The approach level analysis in Table 1 indicated that the rate of violation was 37.7% for the approach without delayed onset of FYA signal indication compared with 24.8% for the approach with delayed onset of FYA signal indication. Predictor variables AY and RX have negative coefficients, which indicates a decrease in the probability of signal violation with each unit increase. The predictor variable QU has a positive coefficient which indicates an increase in the probability of signal violation per unit increase. Although the variable RX indicates a decrease in the probability of signal violation (odds of 31.5% reduction), the variable has a p-value of 0.287.
Regional Variation
Field data were collected from different geographical regions and the differences among them were evaluated. Data from Oregon and Massachusetts had the greatest number of approaches and included a wide range of change and clearance interval durations (including locations with no clearance interval or very short clearance intervals). Other states had only a few intersection approaches, limiting the variability in change and clearance intervals. Also, other states did not have any approaches with no clearance interval or very short clearance intervals. Thus, the regional analysis was composed of developing separate statistical models for Oregon, Massachusetts, and the rest of the states. Table 6 shows the results of the model coefficients with predictor variables arrival time in reference to end of the change interval (AY), presence of clearance interval (SRA), and position in queue (QU). The variable SRA included clearance intervals of 0.0 to 5.0 s.
Logistic Regression Modeling Results for Regional Variation
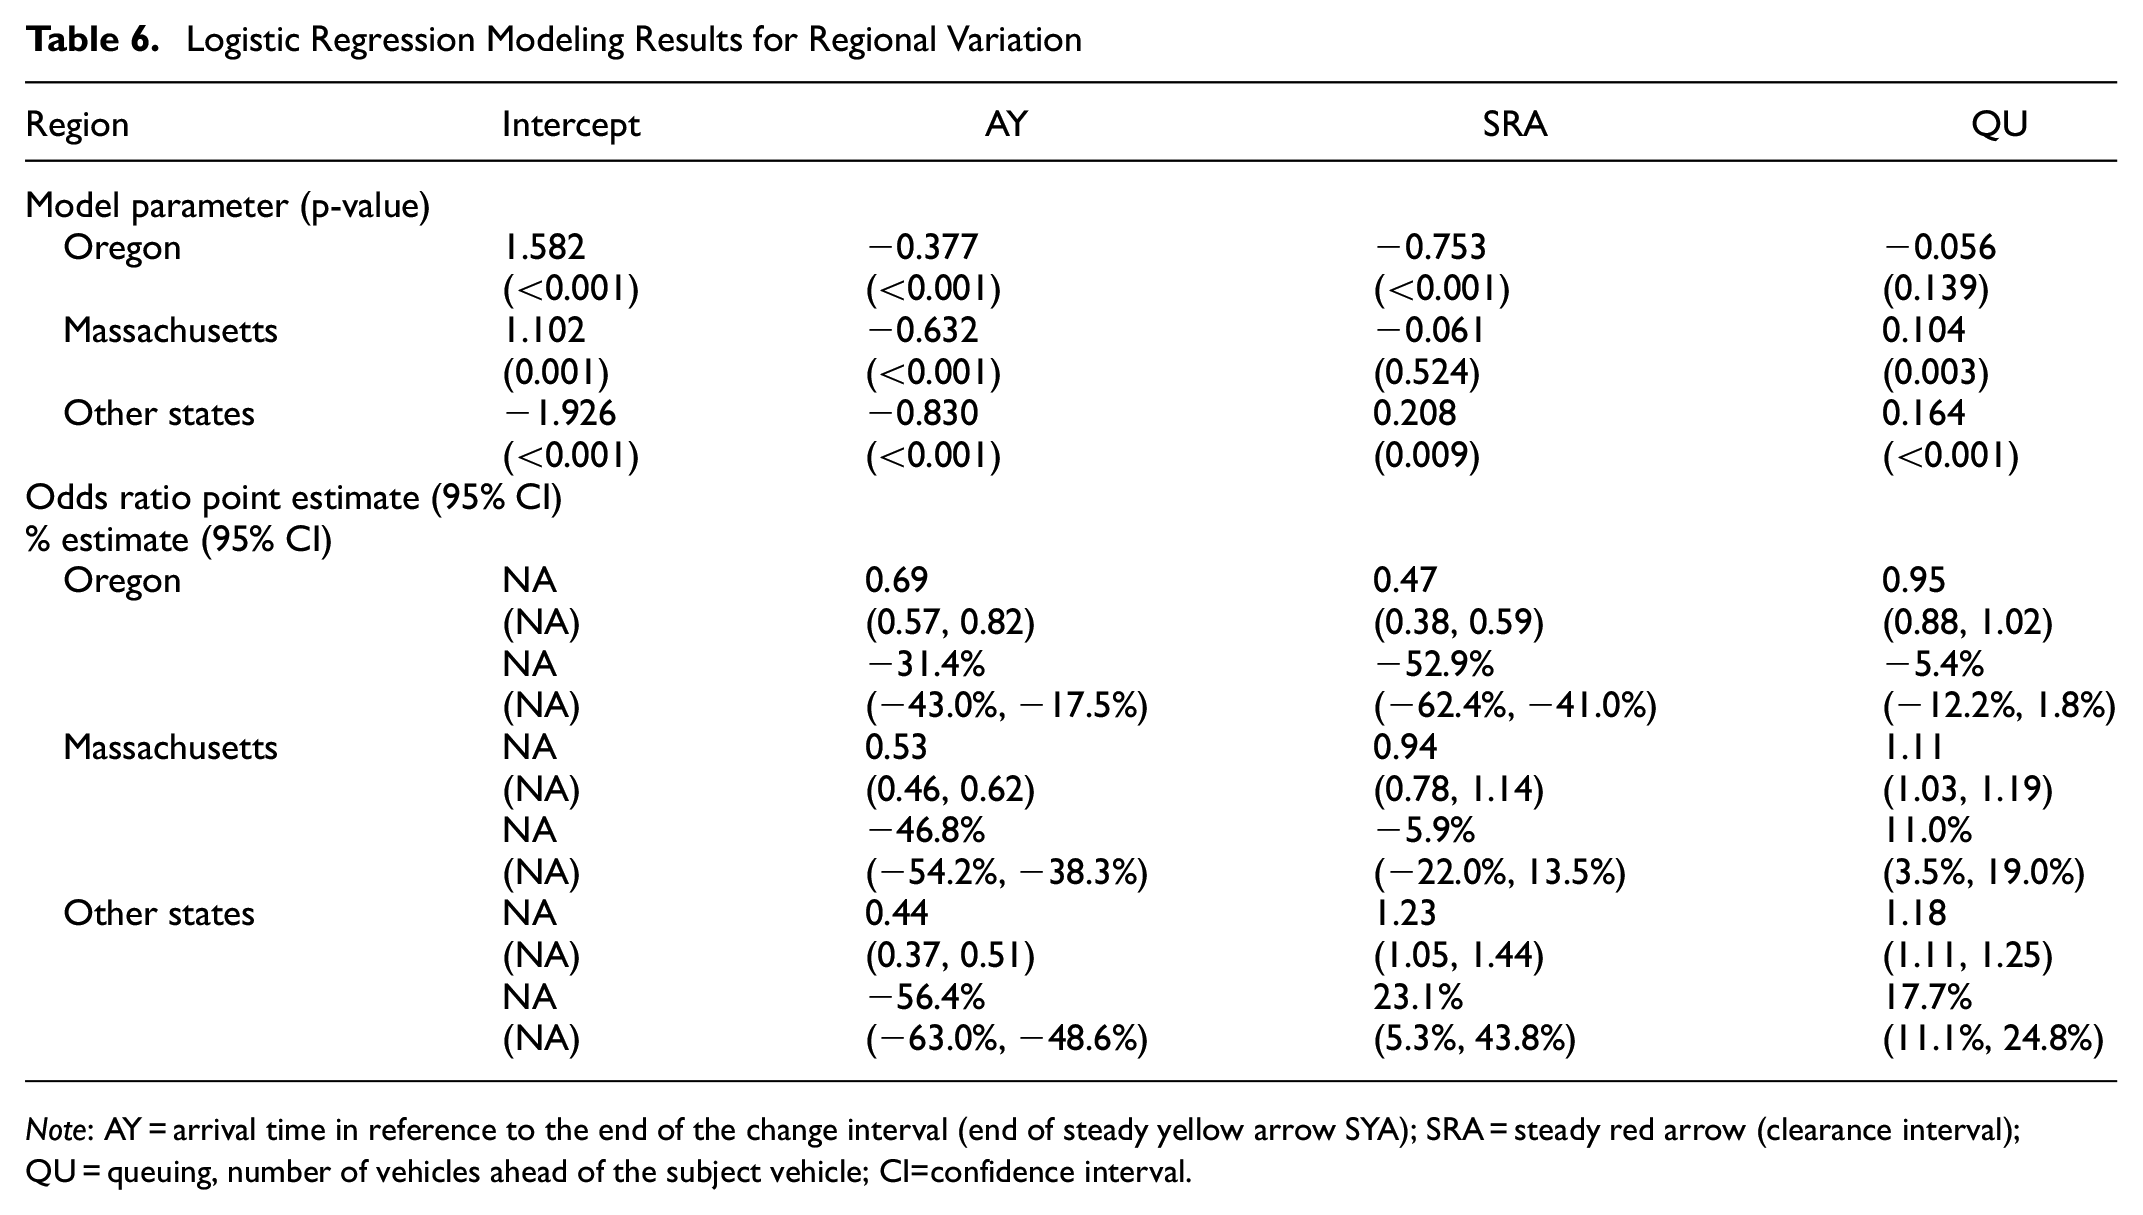
Note: AY = arrival time in reference to the end of the change interval (end of steady yellow arrow SYA); SRA = steady red arrow (clearance interval); QU = queuing, number of vehicles ahead of the subject vehicle; CI=confidence interval.
The odds ratios in Table 6 indicate that the inclusion of a clearance interval (SRA) in locations evaluated in Oregon was associated with a decrease of 0.47 (52.9%) in the odds of signal violation compared with an increase of 1.23 (23.1%) in the odds of signal violation at locations in other states. For Massachusetts locations, the inclusion of clearance interval (SRA) had a negligible and not statistically significant decrease of 0.94 (5.9%) in the odds of signal violation. A one-vehicle increase in the queue (QU) was associated with an increase in the odds of signal violation of 1.11 (11.0%) for Massachusetts and 1.18 (17.7%) for all other states. At Oregon locations, a one-vehicle increase in the queue (QU) had a negligible and not statistically significant effect of 0.95 (5.4%) in the odds of signal violation. Results of the regional variation analysis indicate that there was a significant difference in signal violation with the FYA indication. While the inclusion of a clearance interval may significantly reduce signal violation in Oregon, it may have a negligible effect in Massachusetts.
Discussion and Conclusions
Despite the widespread implementation of the FYA indication for left-turn protected-permissive signal operations, change and clearance intervals used to transition from protected SGA to permissive FYA signal indication are not well defined and vary across the United States. As part of this research study, field data were collected from different geographical regions in the United States to evaluate the effect of transition intervals on left-turn signal compliance with a FYA signal indication to assess adequate duration of change and clearance intervals, and if clearance intervals are even needed. Video data were recorded at 37 intersections during peak hours, for approximately 142 h, across eight states covering different geographical regions in the United States. In some cases, left-turn observations were limited during the change and clearance intervals; therefore, data were reduced to 22 intersection approaches for analysis. Overall, 4,001 observations were obtained and analyzed at the approach level as well as the individual level.
In summary, the results from the approach and individual level analyses were consistent and indicate that: (i) a clearance interval should be included (odds of signal violation decrease by 88.1%); however, there were conflicting findings from different regions about optimal duration, (ii) fewer left-turn signal violations were expected by delaying the onset of FYA signal indication with a solid red arrow extension (RX) beyond the all-red clearance interval with the odds of signal violation decreased by 81.8% in one location in Oregon and 31.5% (not statistically significant) in a location in Florida, and (iii) the duration of change interval (SYA) had a marginal impact in left-turn signal violations.
Research on FYA signal indication for left turns at signalized intersections is very extensive, reaching behavioral, operational, and geometric considerations. Based on the methodological approach of this study, the scope of the research concentrated on field observations of vehicles interacting with change and clearance intervals with protected-permissive phasing and FYA signal indication. The research team did not have access to drivers’ personal information or behavioral responses to the intersection environment. Although additional data were collected, including the presence of pedestrians or opposing traffic lane configuration, the research team did not capture the effect of those variables in modeling (no statistical significance) because of the limited number of observations with those conditions.
The results of this study provide guidance for the inclusion of a clearance interval for protected-permissive phasing with FYA signal indication. There is evidence that delaying the onset of FYA signal indication with a solid red arrow extension (RX) beyond the all-red clearance interval would reduce the signal violation rate. This study was not able to capture the effect of the variation of the duration of change and clearance intervals because of the available number of intersections and corresponding signal phase variations. Although this study had data from different geographical regions, there were few intersections studied in some regions, so a larger sample of intersections and distribution of regions would contribute to more confident assessment of more disaggregated driving behavior variation according to geographic location.
Additional research is required to fill in the gaps of information on human factors, traffic volume, delay, and safety. Through driving simulator or naturalistic studies, driving behavior and attitude toward different durations of change and clearance intervals should be studied under varied traffic volumes, delay conditions, leading pedestrian signal indication, intersection geometry, and demographics. Variations in traffic volumes should include conditions with no opposing traffic, random arrival of opposing traffic, and platooning. Delay conditions should be varied so the driver experiences scenarios waiting in a queue and is presented with the change or clearance interval at the arrival of the stop bar after a predetermined number of vehicles in the queue. Intersection geometry is also an important factor since the number of opposing lanes and posted speed limit influences gap acceptance in the permissive condition ( 28 ). Optimal duration of the clearance interval and the extension of the solid red arrow should be studied under different operational conditions. The influence of the type of vehicle and driver on the left-turn lane and opposing traffic in relation to signal violation rate should also be assessed. Evaluation of the safety effect of change and clearance intervals is understandably limited because of crash data limitations, so alternative safety surrogates or microsimulation may be explored to evaluate the safety effectiveness of the duration of change and clearance intervals ( 29 ).
Footnotes
Acknowledgements
The authors are grateful for the assistance provided by graduate students and research staff from the University of Wisconsin - Madison, University of Massachusetts Amherst, and Oregon State University, who contributed with field data collection across the nation.
Author Contributions
The authors confirm contribution to the paper as follows: study conception and design: B. Claros, M. Chitturi, A. Bill, D. A. Noyce, M. Knodler Jr, D. S. Hurwitz; data collection: B. Claros; M. Chitturi, A. Bill, F. Tainter, M. Knodler Jr, D. S. Hurwitz; analysis and interpretation of results: B. Claros, M. Chitturi; draft manuscript preparation: B. Claros, M. Chitturi, A. Bill, D. A. Noyce. All authors reviewed the results and approved the final version of the manuscript.
Declaration of Conflicting Interests
The author(s) declared no potential conflicts of interest with respect to the research, authorship, and/or publication of this article.
Funding
The author(s) disclosed receipt of the following financial support for the research, authorship, and/or publication of this article: This research is part of the National Cooperative Highway Research Program (NCHRP) project 03-125: Evaluation of Change and Clearance Intervals Prior to the Flashing Yellow Arrow Permissive Left-Turn Indication. David A. Noyce was the principal investigator. NCHRP is administered by the Transportation Research Board (TRB) and funded by participating member states of the American Association of State Highway and Transportation Officials (AASHTO). NCHRP also receives critical technical support from the Federal Highway Administration (FHWA), United States Department of Transportation.
ORCID iDs

The work presented and opinions expressed in this paper are those of the authors and not those of National Cooperative Highway Research Program.