



Abstract
Crash modification factors (CMFs) were calculated for the conversion of a single left-turn lane to a dual or double left-turn lane (DLTL). Despite their proliferation throughout urban and suburban traffic networks, the safety performance of intersection approaches with DLTLs has not been thoroughly investigated and documented within the library of transportation safety research. To date, no published research has been completed that recommends a CMF for DLTL installations. This research effort lays a foundation for the understanding of the before-after safety effect of this countermeasure. A sample of 36 signalized intersections in North Carolina were investigated that received DLTLs between 2004 and 2021. Of these intersections 18 received their DLTLs with no other accompanying geometric changes and were operating with protected left-turn phasing along the treated approaches before and after their DLTL installations. A before-after evaluation of these 18 sites using an empirical bayes methodology yielded the following CMFs: 0.974 (total crashes), 0.844 (fatal-and-injury crashes), 1.010 (property damage only crashes), 0.831 (frontal impact crashes), 0.951 (rear end crashes), and 1.241 (sideswipe crashes). This research recommends that the CMFs for fatal-and-injury crashes and property damage only crashes be used in future cost–benefit calculations when planning DLTL installations.
Keywords
Despite their proliferation throughout urban and suburban traffic networks, the safety performance of intersection approaches with dual or double left-turn lanes (DLTLs) has not been thoroughly investigated and documented within the library of transportation safety research. The conversion of a signalized intersection’s approach from having a single left-turn lane to a DLTL is a fairly common countermeasure to improve the approach’s operational performance. However, there is currently a knowledge gap for the before-after safety effect of implementing this countermeasure.
It has been well documented that the addition of DLTLs can improve the operational performance of an intersection given the appropriate scenarios. The resulting mobility improvement from a DLTL installation is accomplished by increasing the left-turning capacity of a treated approach and allowing more left-turning vehicles to be processed through the intersection within a unit of time. This improved mobility typically results in a reduction of delay and queue lengths within the treated approach’s left-turn lanes. Additionally, the conversion of a single left-turn lane to a DLTL may have added benefits to through movements along the treated approach, as shorter left-turn lanes may no longer be at or over capacity and have their queues spill back into the upstream through lanes.
When implementing DLTLs, transportation officials have largely assumed that, at worst, their installation will have a negligible impact on the total crash frequency of an intersection. However, it is also thought that the improved operational performance of the approach with a new DLTL should result in a reduction in congestion-related crashes like rear-end collisions.
The primary objective of this research is to document recommended crash modification factors (CMFs) for the implementation of DLTLs, which will allow transportation officials to make more informed decisions on the intersection-level safety implications of future DLTL projects.
Literature Review
The majority of previous studies which examine DLTL installations have focused on their operational performance. There have been a couple of studies that examined the safety performance of intersections with DLTLs, but they are hampered by limited sample size and a narrow evaluation focus.
Operational Studies of Dual Left-Turn Lanes
The operational benefits of DLTLs have been well documented. Most of the recent DLTL studies have focused on how various geometric differences can affect capacity measurements or how the implementation of DLTLs can increase the operational performance of an intersection or network of intersections.
Kikuchi et al. noted in 2004 that the lane length is the most important design factor for DLTL installations. This research developed a methodology for determining the appropriate length of a DLTL based on the treated approach’s left turning and through volumes. Their study noted that the operational performance of a DLTL can be affected if the left-turn lane’s queue spills back and blocks through movements upstream of the intersection ( 1 ).
Fitzpatrick et al. ( 2 ) examined how various geometric characteristics affected the performance of DLTL installations in 2014. Their research found that the capacity of a DLTL, when compared with a single left-turn lane, is higher than previously thought. They concluded that a DLTL has 196% of the capacity of a single left-turn lane, whereas the industry standard typically called for a figure of 180% for use in mobility models and calculations. Fitzpatrick et al. ( 2 ) also found that the width of the receiving leg and the frequency of U-turning vehicles from the inside left-turn lane have significant impacts on the overall DLTL capacity.
Hu et al. ( 3 ) found in 2022 that frequent applications of DLTLs in high-density urban areas will improve the traffic network’s overall performance by allowing vehicles to have a more balanced distribution between all of the lanes. In 2023, Rahmani et al. ( 4 ) studied how the number of turn lanes affects the total delay at symmetrical signalized intersections. Their research confirmed that increasing the number of left-turn lanes at an intersection will significantly reduce the delay if volumes are held constant. They also noted that, even when the intersection is operating at undersaturated volumes, there is a significant operational improvement in going from single to DLTLs ( 4 ).
Safety Studies of Dual Left-Turn Lanes
The CMF Clearinghouse is a web-based repository of CMFs that transportation officials can reference when developing projects to ascertain what the expected safety impact of their planned countermeasures could be. It is also frequently updated with the latest research findings and scores the CMFs within its listing based on their quality to ensure users are considering the most appropriate CMF for their decision-making process. The CMF Clearinghouse contains a plethora of CMFs for the installation of a single left-turn lane which cover a variety of different installation scenarios (signalized versus stop-controlled, urban versus rural, one versus two approaches, positive offsets, etc.). However, there are no CMFs for the conversion of a single left-turn lane into a DLTL ( 5 ).
Despite there not being a recommended CMF for DLTL installations, there have been previous studies evaluating a DLTL’s safety performance based on a specific crash type or signal phasing. Ackeret et al. examined the safety performance of DLTL and triple left-turn lane intersections in Las Vegas, Nevada. This research found that sideswipe crashes accounted for a small portion of the total crash frequency within their studied intersections. On top of this, sideswipe crashes occurring between two vehicles that were both turning left from a DLTL approach accounted for a very small portion of the intersection’s entire sideswipe crash total. This research also concluded that potential bottlenecks within the receiving lanes for the DLTLs (bus stops, on-street parking, etc.) appear to be important factors in the sideswipe crash frequencies and should be considered when planning to implement DLTLs ( 6 ).
Tarrall and Dixon ( 7 ) conducted a conflict analysis at four intersections in Atlanta, Georgia that had an approach with a DLTL. All four of their studied intersections operated with protected-permitted phasing, except for one of the locations which was converted from protected-permitted phasing to protected-only phasing along the DLTL approach. This research found significant reductions in conflicts for the whole intersection when a DLTL approach was operating with protected-only phasing compared with its time operating with protected-permitted phasing ( 7 ).
Overall Literature Review Findings
The implementation of DLTLs has been shown to improve the operational efficiency of an intersection, particularly if the intersection is within an urban area and is signalized. However, there does appear to be a gap in the knowledge for the safety impact of this countermeasure. This study aimed to fill this gap and provide a foundation for the understanding of the before-after safety impact of converting a signalized left-turn lane into a DLTL.
Study Locations
This study examined 36 intersections within North Carolina that had had DLTLs installed along one or more of their approaches. There are many more intersections within North Carolina that operate with DLTLs. However, intersections had to meet certain criteria for inclusion within the treatment group:
The intersection must have had its DLTL(s) installed between 2004 and 2021. This would allow for a large enough sample size of before and after period crash data to be collected.
The intersection must not have had any other major changes to its geometric configuration in the years immediately before, during, or after the DLTL construction. This allows for the before-after effect of the DLTL installation to be isolated and not overshadowed or drowned out by other countermeasures.
The intersection could not involve a looping crossroad or be part of a grade-separated interchange. This would allow for the crash data to be compiled from North Carolina’s crash database.
Of the 36 intersections included within this study’s treatment group, 34 are located in urban areas with significant representation from the Charlotte and Raleigh-Durham municipalities. The two study intersections from rural areas have multilane cross-sections along the major approaches. All of the intersections in this study’s treatment site grouping had one, two, or three of their approaches converted from a single left-turn lane to a DLTL. There were 12 treatment sites that also had an additional lane constructed along their receiving leg to accommodate their new second left-turn lanes. This study’s treatment locations are mostly four-leg signalized intersections with just two of the 36 being a three-leg configuration. The intersection-wide volumes from all 36 locations ranged from 21,000 to 69,000 total vehicles entering per day and had an overall average of 43,000. Just one of treatment locations involved a non-exclusive left-turn lane, meaning that the rightmost left-turn lane was a through-left lane instead of a dedicated left-turn lane. Finally, two of the treatment intersections had offset DLTLs implemented, meaning that a raised median or marked separation was added between the DLTLs and the through lanes along the treated approaches.
Figure 1 shows aerial images of two of the study locations shortly after their DLTL construction was completed.

Aerial images from DLTL treatment intersections (treatment sites 27 and 34).
There were 11 intersections included within the overall treatment site grouping that received their DLTLs at the same time as other, minor geometric changes occurred within the intersection. Some of the additional changes include alterations to turn lane configurations on other non-treated legs, road widening for additional through lanes, and adjacent commercial/residential development which resulted in substantial volume increases. This meant that there were 25 locations in the final grouping that received clean DLTL installations. For the remainder of this report, a clean DLTL installation refers to a treatment intersection where the DLTL implementation was completed with no other additional geometric changes that might influence a before-after crash analysis.
For each of the treatment sites, the signal phasing plans were also reviewed for the times before and after their DLTLs were constructed. This was done to record the type of left-turn phasing used along the treated approaches during their respective before and after periods. Of the 25 clean DLTL installations, 18 used protected left-turn phasing during both of their before and after periods. Six of the 25 clean DLTL installations were accompanied by a phasing change that increased the protection of left turns from the treated approach. These six sites include four that went from protected-permitted to protected-only phasing along their treated approach(es) and two that went from permitted to protected-permitted phasing along their treated approach(es). There was one final site of the 25 clean DLTL installations that had protected-permitted phasing during the before and after period along the treated approach.
Figure 2 details the site selection process and shows the number of DLTL intersections that remained in the treatment site grouping during the process. The two criteria which required an intersection to have received its DLTL between 2004 and 2021 and which required no other major changes at the intersection severely limited the number of locations that could be included within this study.
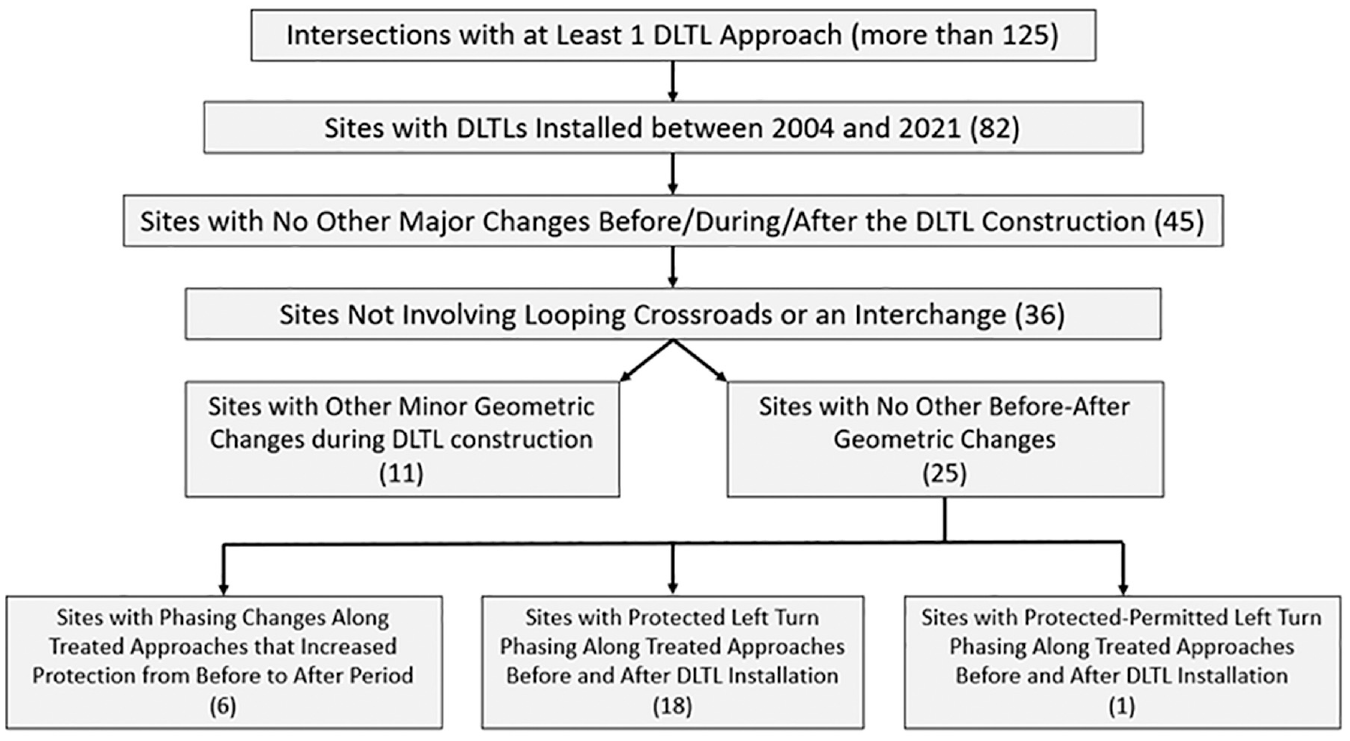
Treatment site selection process.
Google Earth satellite images were used to narrow down the installation years of the DLTLs at the potential treatment sites. This method for determining the construction periods relies on the availability of past satellite views within Google Earth, which can be limited for certain areas. Therefore, it is likely that this study has some construction periods that are longer than the actual length of time it took to construct the DLTL(s).
Table 1 provides an overview of the final 36 intersections that were included within this study’s overall grouping of evaluated treatment sites. Within this table, average total intersection volumes are provided for each of the treatment sites’ before and after periods. Additionally, information is provided on the signal phasing along the treated approaches during their respective before and after periods. In the column containing the phasing information, “Prot.” is short for protected phasing, “Perm.” is short for permitted phasing, and “P/P” is short for protected-permitted phasing.
DLTL Treatment Locations
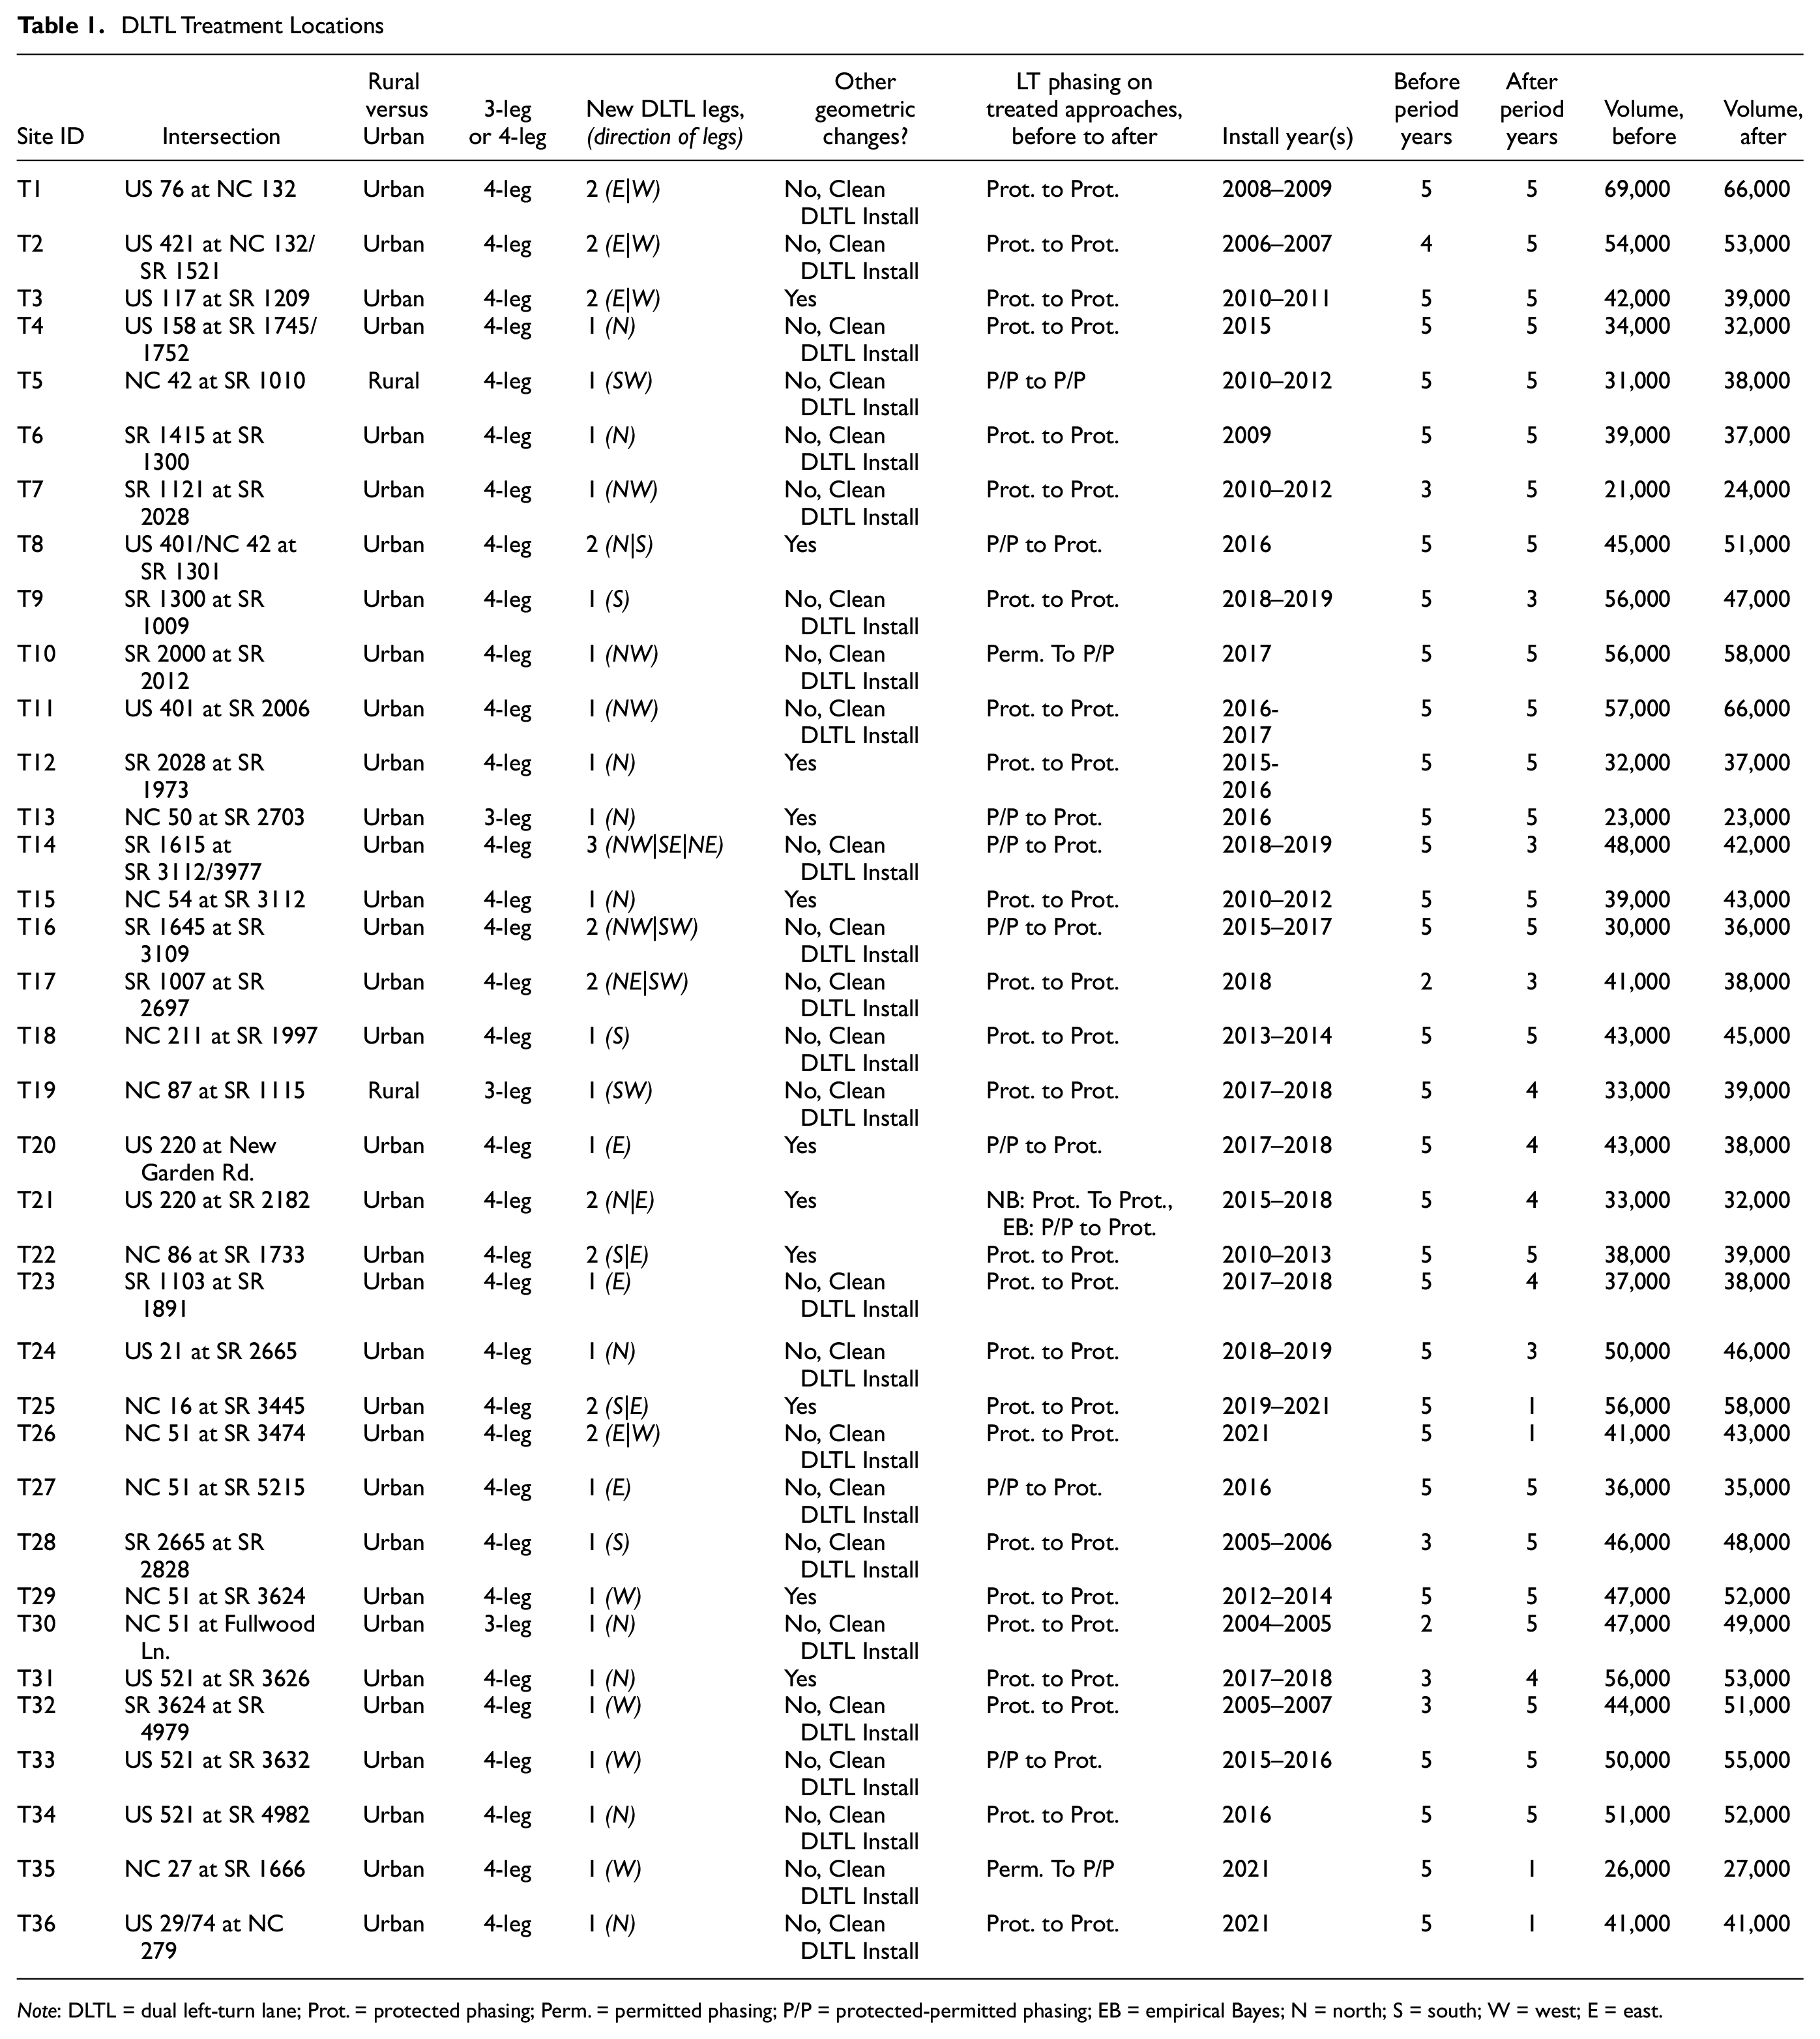
Note: DLTL = dual left-turn lane; Prot. = protected phasing; Perm. = permitted phasing; P/P = protected-permitted phasing; EB = empirical Bayes; N = north; S = south; W = west; E = east.
Study Methodology
Crash Data Compilation
Crash data were queried from the North Carolina Traffic Records Database, which contains information on all reported crashes within the state from 1990 onwards. This research also aimed to evaluate the impact of a DLTL installation on various crash types and severities. Therefore, in addition to locational and time information, crash type and severity data were also queried from this database. All crashes within 150 ft of an intersection were considered to be within an intersection’s study area. Crash data were also queried and analyzed using a 250-ft intersection study area, but there were not found to be discernable differences in the crash trends between the standard 150-ft and 250-ft study limits.
The aim of this study was to use five years of crash data before and after the DLTL installation at each of the intersections within the treatment site grouping. However, some sites did not have five calendar years of crash data available after their DLTL installation and some had unrelated geometric changes which necessitated their before or after period being cut short of the five-year target. As an example, treatment site 7 received its DLTL during 2010 to 2012, but also had unrelated geometric changes occur at the intersection in 2006. To account for this, treatment site 7 only used a three-year before period from 2007 to 2009.
Individual crash reports were manually reviewed for all frontal impact crashes to confirm their specific type of frontal impact crash. Between the treatment sites and their corresponding reference sites, 11,824 crash reports were manually reviewed. In North Carolina, the crash type is determined at the outset by the reporting officer’s first harmful event code, which is found in box 10 of the North Carolina DMV-349 crash report form. During the manual review of the frontal impact crash reports, the crash type was corrected if there was a discrepancy between the first harmful event code and the information seen in the crash report’s diagram and narrative, with favorability going toward what is seen in the crash diagram and narrative over that of the reported first harmful event code. For this study, frontal impacts consisted of the following crash types:
Left-Turn, Same Roadway
Left-Turn, Different Roadway
Right-Turn, Same Roadway
Right-Turn, Different Roadway
Head-On
Angle
Before-After Evaluation Methodologies
This study used naïve and empirical Bayes (EB) methodologies for the before-after safety evaluation of DLTL installations. CMFs were calculated using these methods based on intersection-wide crash trends. The naïve method was completed using a linear volume adjustment to help account for any changes in typical traffic volumes from the before to the after period. The results from the naïve method are primarily presented in this research to provide context on the observed crash trends at the study intersection.
The main benefit of the EB method is its ability to account for potential selection bias and regression to the mean of the crash trends at the treatment sites. In this study, the results produced via the EB method are considered more statistically rigorous and will be the basis for the resulting CMF recommendations.
The EB method in this study uses safety performance functions (SPFs) that were sourced from the Highway Safety Manual (HSM) for urban signalized intersections and for rural, four-leg signalized intersections ( 8 ). SPFs for rural, three-leg signalized intersections were sourced from National Cooperative Highway Research Program (NCHRP) Web-Only Document 297 ( 9 ). These two sources provide values for the parameters a, B1, and B2, and are used to calculate the SPF estimation for the predicted crash frequency under base conditions (NSPF). They also provide the values for the overdispersion parameter, k, which is used when weighing the predicted to the observed crash frequencies in the before period. The SPF parameters used in this evaluation’s analysis can be seen in Table 2. The base SPF formula can be seen in Equation 1.

Parameters Used in SPF Calculations
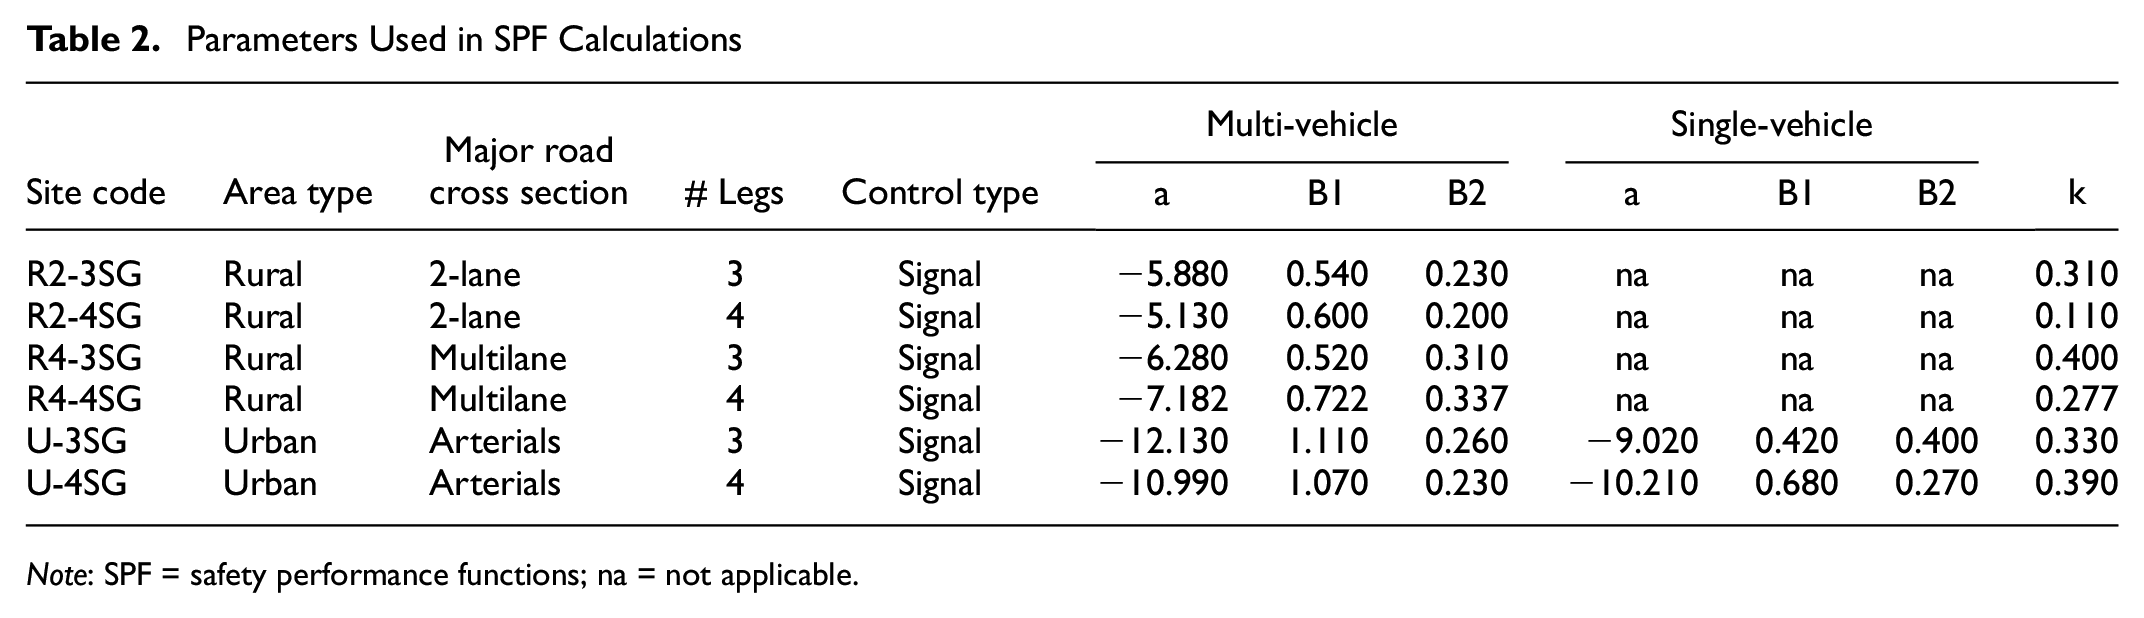
Note: SPF = safety performance functions; na = not applicable.
Crash data from untreated reference sites are used to find a calibration factor (C), which is a multiplicative factor that calibrates the SPFs to the crash trends of the treatment sites. Typically, this is seen as a locational calibration factor in that it calibrates the SPFs found in national guidance sources to that of a particular state or geographic region. Each treatment site had anywhere from two to five reference sites chosen for this calibration, resulting in 93 total reference sites for this study. All of the reference sites were signalized intersections and were chosen based on their proximity to the treatment sites and their similar approach volumes. The included reference sites had at least one approach with a dedicated left-turn lane and they generally shared similar geometric characteristics to those of their corresponding treatment sites. The reference sites’ total intersection volumes ranged from 11,000 to 86,000 and had an overall average of 37,000. Calibration factors were found for every calendar year within this study’s consideration, 2002 to 2022.
To calculate the predicted crash frequency of a treatment intersection, CMFs are used to adjust NSPF based on the site-specific characteristics of the intersection. The methods for calculating the site-specific CMFs are also sourced from the HSM ( 8 ). The next addition of the HSM will call these variables adjustment factors instead of CMFs, in an attempt to prevent possible confusion with the type of CMFs found via before-after analyses (which is what this research will produce). However, the term CMF is used in this research for these site-specific adjustments to maintain consistency with the phrasing from the current version of its source material. For this research, site-specific CMFs were found for the number of approaches with left-turn lanes (CMF1i), right-turn lanes (CMF2i), and no right-turn-on-red restrictions (CMF3i), as well as a site-specific CMF for the presence of lighting (CMF4i). Equation 2 details the calculation for determining the predicted crash frequency, Npredicted.

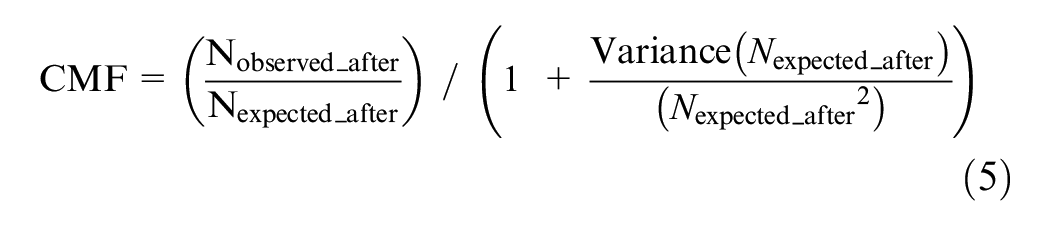
As seen in Equation 3, the EB methodology uses a weighting factor, w, between the observed and predicted crash frequencies in the before period to estimate an expected crash frequency in the before period. This weighting factor is what helps the EB method account for selection bias and regression to the mean. The calculation for the weighting factor was sourced from Gross et al.’s ( 10 ) “A Guide to Developing Quality Crash Modification Factors.” Using Equation 4, the expected crash frequency in the before period is then used to find the expected crash frequency in the after period had there been no DLTL treatment. The CMF is then calculated using Equation 5 by comparing the observed to the expected crash frequency in the after period. Equations 4 and 5 were derived from Hauer’s “Observational Before-After Studies in Road Safety” ( 11 ).


Results
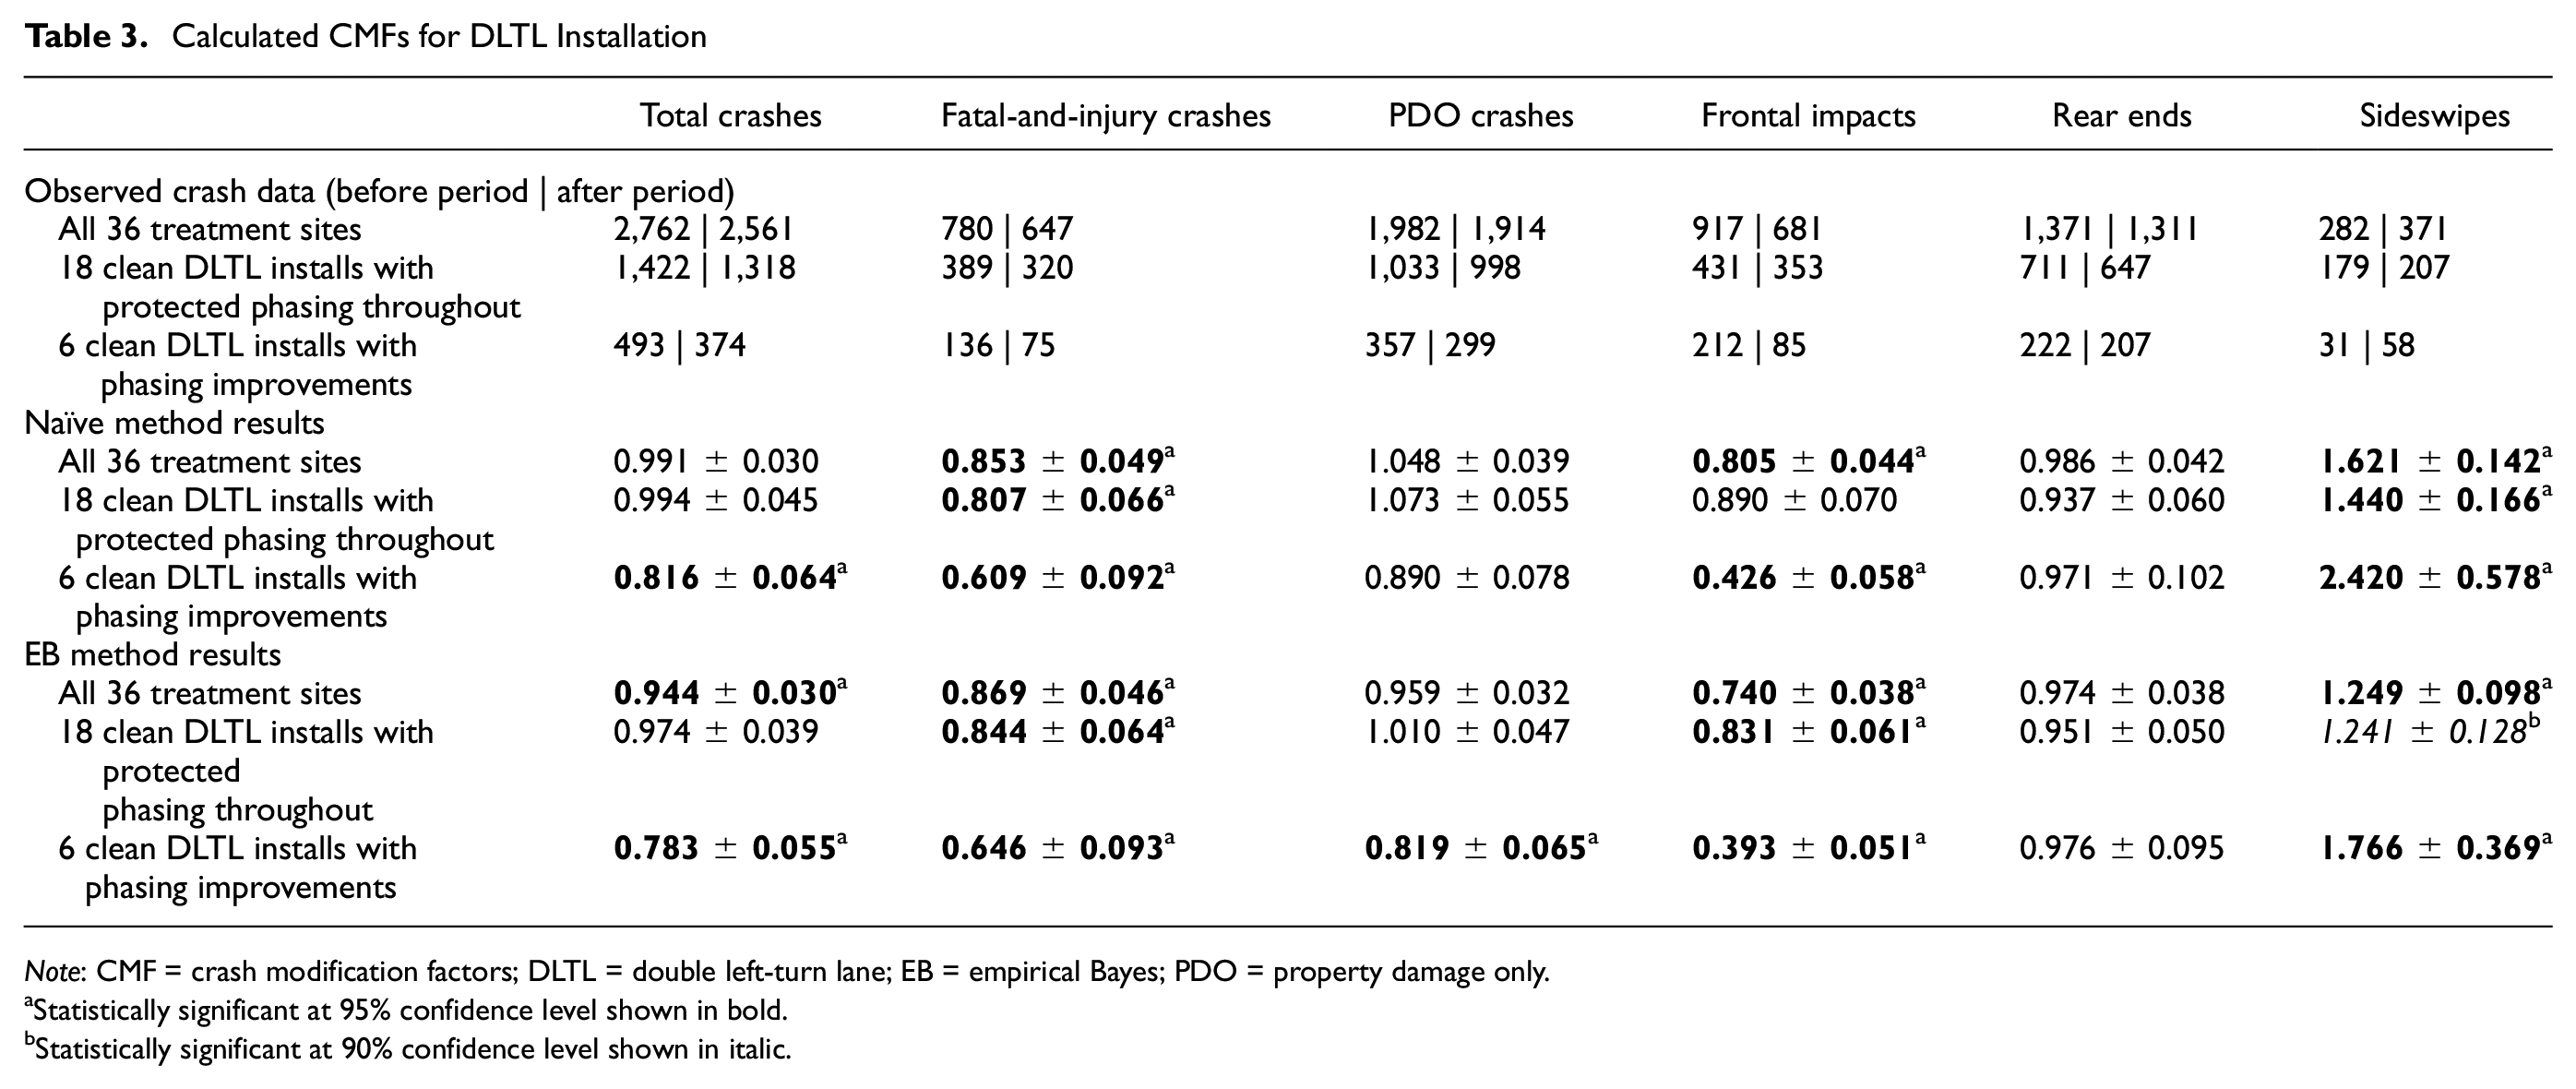
An overview of this study’s calculated CMFs is provided in Table 3. Within the CMF results tables that are presented in this report, statistically significant results are shown in either bold or italicized font (95% confidence level shown in bold, 90% confidence level shown in italics) and non-statistically significant results are shown in normal font. CMFs were found for total, fatal-and-injury, property damage only (PDO), frontal impact, rear-end, and sideswipe crashes. Additionally, CMFs were found for a breakdown of three different groupings of the studied treatment sites:
Calculated CMFs for DLTL Installation
Note: CMF = crash modification factors; DLTL = double left-turn lane; EB = empirical Bayes; PDO = property damage only.
Statistically significant at 95% confidence level shown in bold.
Statistically significant at 90% confidence level shown in italic.
All 36 treatment sites that received a DLTL installation.
The 18 treatment sites that had a clean DLTL installation and also had protected left-turn phasing along the treated approach(es) throughout the before and after period.
The six treatment sites that had a clean DLTL installation and also had an accompanying phasing change that increased the protection for left-turning vehicles along the treated approach(es).
Among the overall grouping of 36 treatment sites, this research analyzed crash data for 165 before period years and 151 after period years. Fatal-and-injury crashes made up 28% of the total crashes in the before periods compared with 25% of the total crashes in the after periods. When combined, frontal impact, rear-end, and sideswipe crashes made up a large majority of the total crashes throughout the analysis periods. In the 165 before period years, frontal impact, rear-end, and sideswipe crashes made up 33%, 50% and 10% of the total crashes, respectively. In the 151 after period years, frontal impact, rear-end, and sideswipe crashes made up 27%, 51% and 14% of the total crashes, respectively.
Generally speaking, it was found that a DLTL installation results in a minor decrease in total crashes, but this was shown to be not statistically significant. There were more noticeable and significant changes when considering specific crash types. Among all 36 of the included treatment sites, this study’s before-after analysis generally found a reduction in fatal-and-injury crashes, a reduction in frontal impact crashes, and an increase in sideswipe crashes. No statistically significant changes were found for PDO or rear-end crashes, except when there was an accompanying safety improvement with the treated approaches’ left-turn signal phasing. For the second grouping within Table 3 that consists of the 18 sites which received a clean DLTL treatment and had protected phasing throughout their analysis period, a 16% reduction in fatal and injury crashes, a 17% reduction in frontal impact crashes, and a 24% increase in sideswipe crashes was found to have occurred; all of which were found to be statistically significant. Given that this second grouping contains the sites that experienced no other geometric or signal phasing changes, these results are the most noteworthy, as the DLTL impact is isolated from other potential influences on the before-after crash trends.
There were similar before-after results between all 36 treatment sites and the disaggregated second grouping of 18 sites. However, it was found that there was a noticeably stronger reduction in frontal impact crashes when considering all 36 DLTL treatment sites. The overall grouping of 36 sites likely could have been used as a basis for a DLTL CMF recommendation, but the more appropriate CMFs to consider when planning future DLTLs will come from the second grouping of 18 sites that isolated the DLTL treatment.
There was also a very noticeable difference in the resulting CMFs between the disaggregated groupings of clean DLTL treatment sites with and without phasing changes. These differences support the decision to separate these groupings to isolate the effect of the DLTL treatment. The six clean DLTL installation sites that also received left-turn phasing improvements showed significantly higher reductions in most crash types. This is especially so for frontal impacts, where a 61% reduction was found in comparison to the previously noted 17% for clean DLTL installations with protected phasing throughout the analysis periods. The further reductions in frontal impacts at these six sites can be linked to the increased protection of left-turn vehicles via their phasing changes.
CMF Breakdowns by Frontal Impact Crash Types
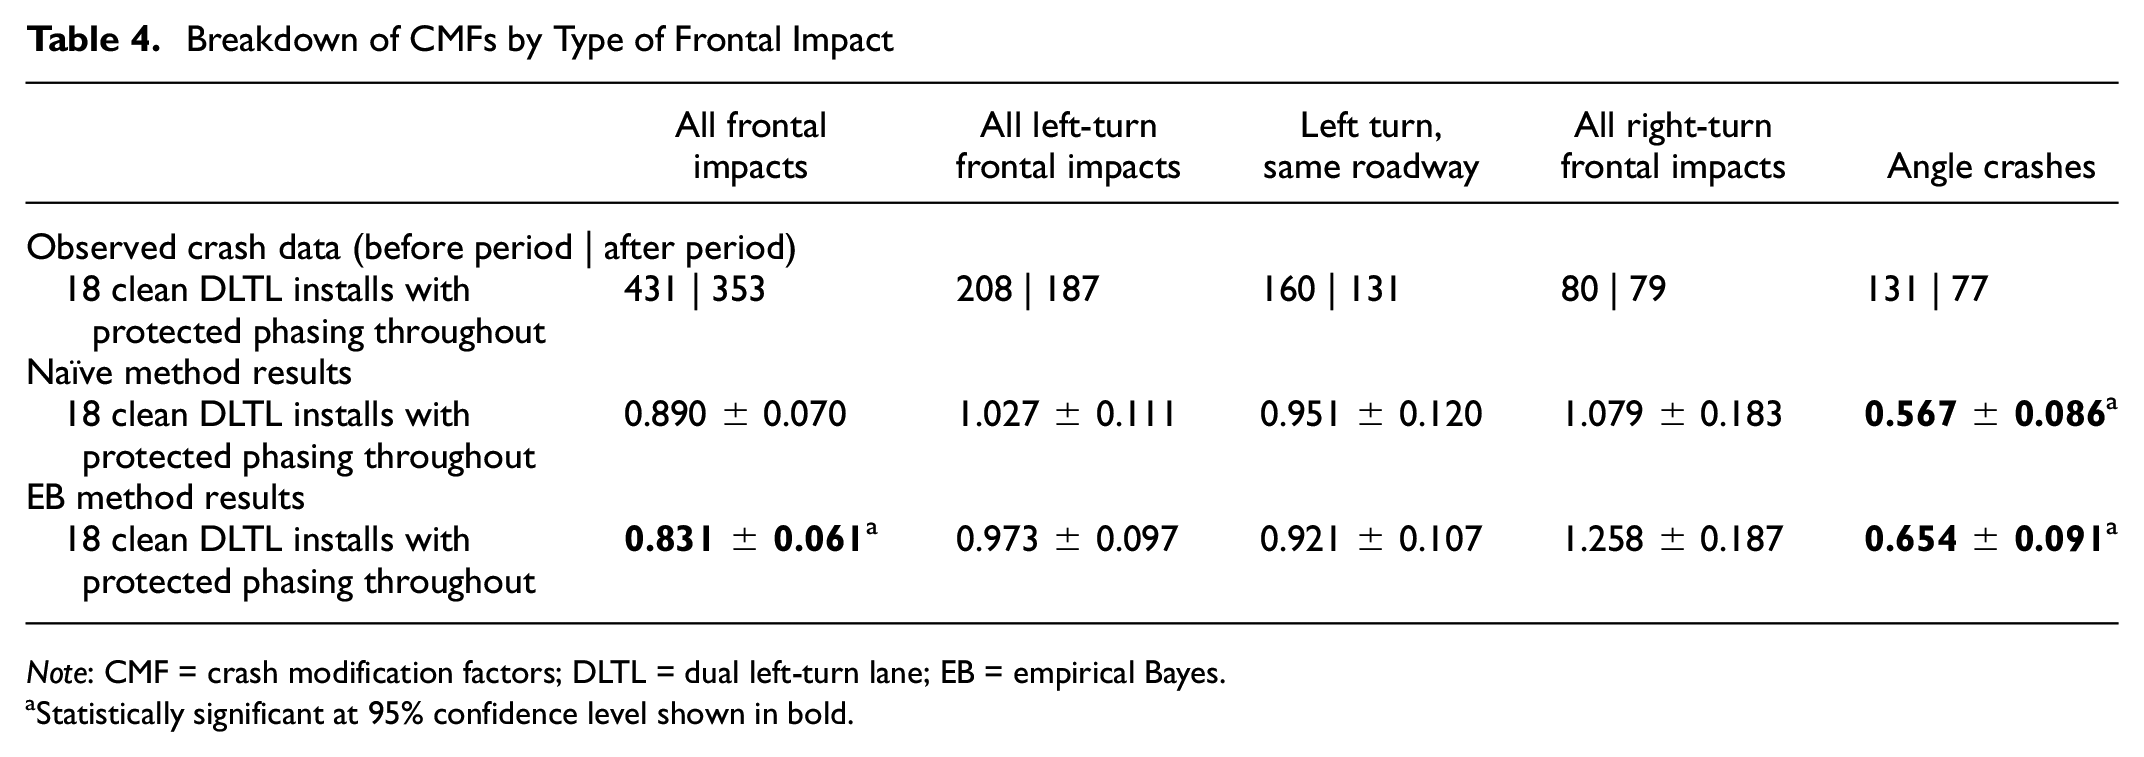
There was also a desire to examine how a DLTL installation affects the different types of frontal impact crashes (left-turn, right-turn, angle, etc.). Table 4 provides a frontal impact breakdown for the grouping of 18 treatment sites which received a clean DLTL installation and had protected phasing throughout their analysis periods.
Breakdown of CMFs by Type of Frontal Impact
Note: CMF = crash modification factors; DLTL = dual left-turn lane; EB = empirical Bayes.
Statistically significant at 95% confidence level shown in bold.
The breakdown of CMFs by the different types of frontal impact crash types yielded noteworthy and interesting results. It was initially thought that a DLTL installation would have the most direct safety impact on left-turn frontal impacts at a subject intersection and specifically for the left turn, same roadway crash type. However, the CMFs for all types of left-turn frontal impact (left-turn, same roadway and left-turn, different roadway) and also specifically for left-turn, same roadway crashes show that there was not a statistically significant change in their trends from the before to the after period. Interestingly, the most positive results come from the angle crash type, where the EB method found a 35% reduction in this specific type of frontal impact. For this study’s treatment site grouping, the reduction in angle crashes appears to be the driving force behind the 17% reduction found for all frontal impact crash types.
Given that a DLTL installation has been shown to result in an overall operational improvement at an intersection through increased left-turning capacity and through reductions in left-turn queue lengths, it is possible that drivers making through movements will be less risk averse because of reductions in their average delay. Additionally, the extra left-turning capacity on a treated approach may result in the typical allocated green time for the treated approach being less than the maximum allowed, which should result in operational improvements for the whole intersection and for all of the movement types. The majority of the treatment sites included in this research are higher-volume urban intersections, where it may be common for through vehicles to have to wait multiple cycles to make their movements through the intersection during the peak congestion hours within the before period.
The DLTL implementations likely resulted in a reduced average delay for through vehicles which in turn makes their drivers less likely to make risky decisions such as running a red light during the first few seconds of the all-red signal phase.
Comparing Sideswipe Trends at Sites with and without Receiving Lane Drops
There were eight treatment sites that had a receiving lane drop for one of their new DLTLs within 0.25 mi of the intersection (treatment sites 5, 13, 21, 26, 28, 31, 34, and 35). The distances from the intersection for these receiving lane drops range from 400 ft to 1,200 ft. In an attempt to determine if receiving lane drops had an effect on sideswipe crash trends, additional CMFs were calculated using the EB method for the grouping of eight sites with a receiving lane drop and for the grouping of 28 treatment sites without a receiving lane drop.
8 treatment sites with a receiving lane drop, Sideswipes CMF: 1.240 ± 0.261
28 treatment sites with continuous receiving lanes, Sideswipes CMF: 1.245 ± 0.104
In the end, the calculated CMFs for sideswipe crashes between these two disaggregated groupings ended up being very close to one another. It is worth nothing that there was a very limited sample size of sites with a receiving lane drop and that sideswipe crashes were examined at the intersection level rather than by approach. Additionally, five of the eight treatment sites with a receiving lane drop also had other geometric or phasing changes accompanying the DLTL installation. The before-after safety effect of the new DLTLs are, therefore, not isolated at those sites.
Pedestrian and Bicycle Crashes
Being predominately in urban and suburban settings, many locations had vulnerable user features such as crosswalks, pedestrian signals, and bicycle lanes. Bus stops were also present in the vicinity of the intersection at some locations. Given the sample size, reliable pedestrian and bicycle crash CMFs were not able to be developed; however, an analysis of these crash types at the 36 treatment sites is provided.
Pedestrian and bicycle involved crashes represent 0.5% of total crashes. The treatment sites averaged 0.06 before period and 0.11 after period pedestrian and bicycle crashes per year. Using the naïve evaluation methodology, there were 9.5 expected pedestrian and bicycle crashes in the studied after period, as compared with 15 observed pedestrian and bicycle crashes in the 151 after period study years.
There were 25 crashes within the study periods, including six pedestrian crashes and four bicycle crashes in the before period and six pedestrian crashes and nine bicycle crashes in the after period. Of the 15 after period crashes, manual review of crash reports reveals that five of those crashes appear related to a treatment approach, meaning either a vulnerable user was crossing a treatment approach, or a vulnerable user or motor vehicle was making a left turn from a treatment approach.
The data suggest an increase in pedestrian and bicycle involved crashes at the treatment sites; however, the crash samples are too small to definitively state vulnerable user safety is negatively affected by a DLTL installation.
Conclusions
More than 125 intersections with at least one DLTL were initially identified as potential sites to be included within this research’s treatment site grouping. Only 36 of these intersections were able to meet the criteria for inclusion within this study and of those 36, just 18 had their DLTL implemented with no other accompanying minor geometric changes or signal phasing changes. Finding DLTL installations that could be reliably evaluated proved to be rather difficult because of persistent changes in the immediate years surrounding the DLTL’s construction or as a result of other major changes occurring at the same time as the DLTL installation that would have overshadowed any effect of the new DLTL. This difficulty in finding treatment sites that are able to be evaluated is likely one of the main reasons there is a knowledge gap for the safety effect of converting a single left-turn lane to a DLTL.
The results from the EB evaluation methodology indicate that a DLTL installation will result in a 16% reduction in fatal and injury crashes, a 17% reduction in frontal impact crashes, and a 24% increase in sideswipe crashes, all of which are statistically significant at the 95% confidence level. A minor reduction in total crashes and a slight increase in PDO crashes were also found, but neither was found to be statistically significant. The combined results indicate that, despite an increase in sideswipe crashes, the trade-off reduction in frontal impacts results in an overall net gain for safety given the reduction in fatal-and-injury crashes.
The majority of the DLTL installations that were evaluated in this effort had receiving lane widths of under 30 ft. Across the 36 treatment sites that were examined in this effort, there was a total of 48 approaches that were converted from a single LTL to a DLTL configuration. Of these 48 approaches, 35 had receiving lane widths of less than 30 ft, including 26 of which that were less than or equal to 24 ft in total width. Just 13 of the examined approaches which received DLTLs had accompanying receiving lanes of 30 ft or greater. The predominance of smaller receiving lane widths may have been a contributing factor to the treatment site grouping’s overall increase in sideswipe crashes.
These crash reductions are based on the grouping of 18 treatment sites which received a clean DLTL installation and had protected phasing during the before and after periods. The safety benefits of can be expected to be significantly more positive should a DLTL installation be completed with an accompanying safety improvement in left-turn phasing. Additionally, it was found that the DLTL installations have a noticeably more positive impact on angle crashes than left-turn frontal impacts, which could be attributed to the DLTL’s resulting improvements in the operational performance of the treated intersection.
Overall, this research team recommends that baseline CMFs of 0.844 for fatal-and-injury crashes and 1.010 for PDO crashes be used by transportation officials when planning future DLTL projects. The use of CMFs for fatal-and-injury crashes and PDO crashes accounts for before-after changes of the whole intersection and covers all crash types. Transportation officials should use this study’s CMFs to make more informed decisions when weighing the benefits and costs of a proposed DLTL project.
The research team found in their conversations with traffic operations engineers, and through a review of published research into this countermeasure, that DLTL treatments are almost always implemented for operational benefits. To date, it has largely just been assumed that the DLTL treatment will have an overall positive safety impact through an improvement in a subject intersection’s operational performance and a resulting decrease in delay. This research fills the knowledge gap of the safety impact of a DLTL installation and provides a foundation on which to build for future safety research into this countermeasure.
Future Research Considerations
In general, the sample size of studied treatment sites could be expanded in future research efforts. This could be accomplished by incorporating multiple states within the treatment site selection process. A larger sample size of treatment sites should allow for CMFs to be developed based on the number of approaches with DLTL installations. The addition of more sites within the treatment grouping may also allow future research to determine if the before-after crash trends for DLTL installations have changed over time (i.e., comparing older DLTL installations to newer DLTL installations).
A deeper dive into a DLTL’s effect on vulnerable road users could also be undertaken in future studies. Just 25 pedestrian and cyclist crashes were observed at this study’s treatment sites during their analysis periods, so it is difficult to draw any meaningful conclusions from this limited sample of data.
This study examined crash trends at the whole-intersection level rather than by approach given the time limitations. It would be beneficial for future research efforts into this countermeasure to examine crash trends specifically by the treated approaches.
Additionally, further breakdowns of treatment sites could examine how different receiving lane scenarios affect sideswipe crash trends. This study briefly analyzed the effects of a receiving lane drop on intersection-wide sideswipe crashes, but the results were limited by the sample size of treatment sites with such a lane drop. It would be beneficial for future studies to analyze sideswipe crash trends with regard to whether one of the DLTL’s receiving lanes quickly drops off after the intersection. Future studies should also consider compiling crash data beyond the typical 150-ft study area to analyze this impact.
Finally, future research efforts which conduct before-after safety evaluations of this countermeasure should consider their need to account for selection bias within their particular grouping of treatment sites. The closeness between this evaluation’s resulting CMFs for the naïve and EB methodologies may suggest that the risk of regression to the mean was minimal for this study’s grouping of treatment sites. As previously discussed, the vast majority of DLTLs are implemented for operational improvement, not as a safety countermeasure. This could suggest that the risk of selection bias, from the viewpoint of safety performance, is negligible and that the observed before period crash totals should be equivalent to what one should expect over a long-term period. Evaluation efforts that aim to build on the findings laid out in this research should consider whether the EB method, the primary benefit of which is its ability to account for regression to the mean, is necessary. Alternative before-after evaluation methodologies such as comparison groups or a naïve method with a SPF-based volume adjustment may be more appropriate if the risk of selection bias, and regression to the mean, is determined to be minimal or negligible.
Footnotes
Acknowledgements
The research team would like to thank Jonathan Moreno, Papa Dieng, and Joshua Sutton for their assistance in the manual review of frontal impact crash reports. The authors would also like to thank Joe Hummer and Shawn Troy for expressing a need for this research to be conducted and for providing guidance throughout the evaluation process.
Author Contributions
The authors confirm contribution to the paper as follows: study conception and design: Timothy Nye and Carrie Simpson; data collection: Timothy Nye; analysis and interpretation of results: Timothy Nye and Carrie Simpson; draft manuscript preparation: Timothy Nye and Carrie Simpson. All authors reviewed the results and approved the final version of the manuscript.
Declaration of Conflicting Interests
The author(s) declared no potential conflicts of interest with respect to the research, authorship, and/or publication of this article.
Funding
The author(s) received no financial support for the research, authorship, and/or publication of this article.

The work reported in this paper was performed while the authors worked at the North Carolina Department of Transportation. The contents of the paper do not represent the views or opinions of that institution, and any errors in the paper are those of the authors.