



Abstract
The design and construction of pavements necessitate careful consideration of longevity, cost-effectiveness, sustainability, and safety, with a focus on enhancing the durability and lifespan of dense-graded asphalt (DGA) surface mixtures. This paper discusses a research project the Federal Highway Administration (FHWA) initiated to assess the macrotexture characteristics of DGA mixture pavement—particularly concerning safety at higher speeds. The project aims to develop an efficient testing procedure for measuring macrotexture during mixture design and field-testing processes, striking a balance between longevity, cost-effectiveness, sustainability, and safety in pavement design and construction. The study began with a comprehensive review of existing practices, leading to the selection and testing of a unique laser texture scanner capable of noncontact macrotexture measurement. The subsequent phase involved validating the suggested macrotexture measurement system through data collected from State-sponsored projects under the FHWA Mobile Asphalt Technology Center program. Macrotexture measurements were collected from field cores and laboratory-compacted specimens from various State departments of transportation projects and analyzed. Preliminary analysis of the limited dataset to date revealed a positive correlation between average macrotexture measurements from gyratory specimens’ top surface and field core macrotexture measurements. The FHWA developed a draft test method for measuring macrotexture on laboratory specimens and field cores, thereby aiming to reduce procedural variability. Interlaboratory macrotexture test results demonstrated good reproducibility, with an average coefficient of variation of approximately 20%. Overall, this research project seeks to advance the understanding and measurement of macrotexture in DGA mixture pavements and thereby contribute to the development of safe pavements.
Keywords
Pavement surface texture plays important roles in roadway safety and noise issues. More than 40,000 deaths and 2.4 million injuries occurred in more than 12.1 million vehicle crashes in the United States in 2019 ( 1 ). Sixteen percent of those crashes took place on wet pavement. The two main causes of wet-weather crashes are hydroplaning (loss of contact between tires and pavement surface owing to a film of water) and poor visibility owing to splash and spray. Inadequate friction also contributes to many dry-weather accidents—particularly in work zones and intersections where braking and unusual vehicle movements are common ( 2 ).
Friction or skid resistance can be an important safety factor concerning pavements and is accounted for by proper material selection, design, and construction. Several factors influence skid resistance, and pavement surface texture can be an important factor that engineers can measure and control. Two types of surface texture affect pavement friction: microtexture (wavelengths of 1 µm to 0.5 mm) and macrotexture (wavelengths of greater than 0.5 mm to 50 mm).
Aggregate particles generally provide microtexture in asphalt pavement through their relative roughness, whereas aggregate gradation generally provides macrotexture in asphalt pavement. With the current focus on dense-graded asphalt (DGA) surface mixture durability, some engineers worry that in some cases, less macrotexture than in previously constructed mixtures may be provided. It is suggested that owner-agencies establish texture depth targets for new and in-service pavement surfaces based on project-specific factors. No optimal macrotexture measurement exists for inclusion in this safety analysis. However, mean profile depth (MPD) is the one most used in the United States for network assessments. ASTM E1845 ( 3 ) is the protocol for MPD and guides the user as to what data to collect and how to calculate MPD. It does not, however, address either testing variability or the verification process. Currently, no standard certification protocols or sensor/algorithm verification protocols exist for MPD measurement systems.
The project’s purpose is to raise awareness about the importance of adequate pavement macrotexture in DGA surface mixtures with regard to safety. The project aims to identify appropriate test systems—particularly noncontact (laser-based) systems—capable of measuring macrotexture in both laboratory and field settings. The selected systems should apply to common DGA specimen geometries such as those from the Superpave Gyratory Compactor. This research will aid in achieving the challenging goal of balancing longevity, cost-effectiveness, sustainability, and safety in DGA mixture design.
Objectives
This project consisted of two phases. The objective of the first phase was to identify efficient laboratory systems for evaluating DGA macrotexture by using standard sample geometries. The subsequent phase involved collecting macrotexture data from multiple projects to validate the equipment identified in the first phase. Specific tasks in the subsequent phase included developing a standardized test plan for field data collection, establishing operational procedures for collecting macrotexture data on different specimens, determining correlations between field and laboratory measurements, and developing a standardized test protocol for measuring macrotexture.
Macrotexture System Selection Process
Selection Criteria
The selection criteria used for identifying a suitable test system for macrotexture measurements were as follows:
the system is suggested to be noncontact and nondestructive;
the system is suggested to be commercially available equipment;
the system is suggested to be reasonably priced for purchase.
Evaluation of Macrotexture Technology and Devices
The macrotexture technology measurements and devices evaluated in this project can be categorized into three main types.
Volumetric or sand patch method, ASTM E1845 ( 3 ).
Two-dimensional (2D) profiles:
Three-dimensional (3D) area measurements:
After an initial equipment specification evaluation of the different devices, the project team concluded that the LTS 9500 is the most suitable for measuring macrotexture on gyratory-compacted specimens because it met all the selection criteria. The decision was based on several factors, including the equipment’s ease of operation, accurate surface area measurements, quick display of scanned 3D images, reasonable cost, lightweight and portable design, and battery-charging capability. Additionally, the equipment allows for data storage by connecting to a tablet.
Phase I Assessment: Evaluation of LTS
The main objective of Phase I was to identify a suitable noncontact macrotexture-measuring device that could be used on conventional laboratory-prepared gyratory specimens and field cores. As mentioned earlier, the LTS 9500 device was chosen for evaluation. The next step was to determine the LTS 9500’s effectiveness in measuring macrotexture on conventional laboratory-prepared gyratory specimens and on field cores. The LTS equipment itself is a portable device that can easily be carried into the field to scan freshly paved asphalt pavement surfaces. The device scans an area of 100 mm by 100 mm and uses the manufacturer’s developed software to process the data. The LTS takes a line scan every 0.0408 mm, resulting in a total of 2,048 line scans for the 100-mm length, with each line scan including approximately 2,448 transverse data points and taking about 90 s for each scan. The average MPD is calculated across the 100-mm-by-100-mm scanned area. A typical summary file is shown in Table 1. Finally, a summary of the test results can be exported in Microsoft® Excel format for further analysis.
Typical Test Results Summary
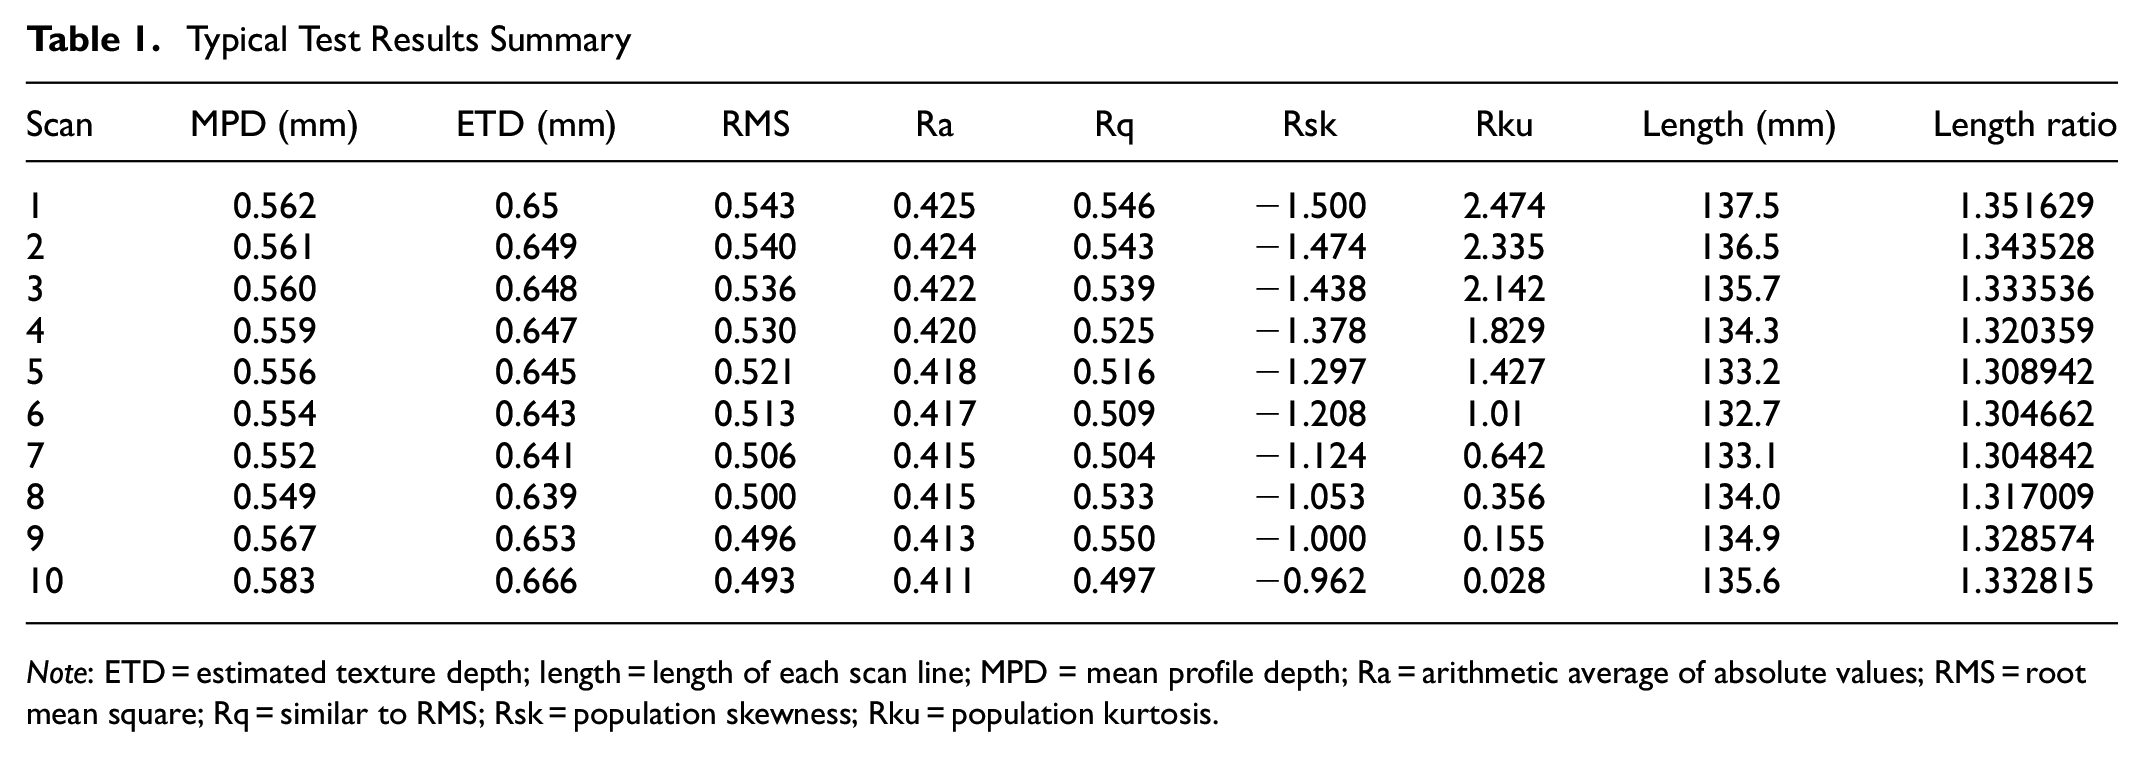
Note: ETD = estimated texture depth; length = length of each scan line; MPD = mean profile depth; Ra = arithmetic average of absolute values; RMS = root mean square; Rq = similar to RMS; Rsk = population skewness; Rku = population kurtosis.
Macrotexture Parameter and Data Processing
Various parameters are used for characterizing and quantifying macrotexture. Mean texture depth (MTD) is based on a 3D representation of macrotexture, traditionally measured using the sand patch or volumetric method. Although the sand patch test may not be suitable for network-level measurements, recent claims of 3D devices’ simulating digital sand patch measurements still make MTD relevant. For 2D measurements, the MPD and root mean square (RMS) of texture are commonly used with laser or vehicle-mounted devices. The ISO 13473-2 standard provides guidance on low-pass and high-pass filtering in computations of MPD. MPD has been widely used in the United States for safety analysis and pavement surface characterization.
The data processing procedure follows ISO 13473-2 ( 11 ), involving two main steps. The first step removes spurious readings from the profile data to use accurate measurements. The second step processes the cleaned data—including spike identification, reshaping, and normalization of profile sharpness—which are achieved through high-pass filtering and low-pass filtering to normalize the profile sharpness uniformly.
Effectiveness of LTS
Initial macrotexture measurements were gathered on freshly prepared gyratory specimens. During initial measurements, the project team experienced artificial spikes from the shiny surface of the freshly prepared gyratory specimens. When the laser contacts the smooth and shiny surface of an asphalt film, specular reflection takes place, creating artificial protrusions. The undetected, invalid protrusions are defined as spikes ( 12 ). Spikes are unusually high and sharply defined peaks in the measured profile that are not parts of the true profile. Spikes are pervasive issues with regard to laser devices and can significantly affect calculation of MPD ( 12 ). The project team conducted an investigation to reduce or eliminate these undetected spikes owing to reflection. One way to reduce spikes is to cover the asphalt surface with an anti-reflective coating. The use of anti-reflective products has no impact on texture evaluation because macrotexture may not necessarily exist at the same length scale as a potential spray and may not affect the surface profile as regards its macrotexture.
Several anti-reflective products were available in the market. Four products were selected for evaluation as follows:
3D spray
dulling spray
talcum powder
cornstarch.
A 3D spray and a dulling spray (Krylon® 1310) ( 13 ) were the two products that can be used as anti-reflective agents for the purpose of reducing or eliminating the reflectance of asphalt surfaces. The two sprays were used to reduce the glare or specular reflection from asphalt surface, thereby making it more suitable for macrotexture measurement.
Each of the listed products evaluated and used in this study has its own advantages and disadvantages. Table 2 summarizes the advantages and challenges of the products.
Anti-reflective Agents or Products

An evaluation to determine an appropriate anti-reflective coating and MPD measurements on gyratory specimens and asphalt concrete slabs was conducted. For this experiment, a total of seven gyratory specimens of a dimension of 150 mm in diameter by 100 mm in height were prepared using a 9.5-mm nominal maximum-aggregate-size (NMAS) mixture with 4% air voids. The macrotexture measurements were first made on uncoated (no anti-reflective coating) specimens. After uncoated specimens were measured, the specimens were coated with anti-reflective coatings to make macrotexture measurement using the LTS device. Figure 1 shows the comparison of MPD values of uncoated and coated gyratory specimens. The MPD values ranged from 0.48 mm to 0.67 mm, with uncoated exhibiting the higher MPD, and 3D spray exhibiting the lower. The 3D spray was a visible coating, and the values may have been lower owing to macrotexture crevasses’ being covered with 3D spray. The talcum powder and dulling spray values were similar. The talcum powder was not effective in covering the dullness. The coefficient of variation ranged from 3.0 to 12.2%, with at least three replicate measurements for each coating type.

Comparison of mean profile depths (MPDs) of gyratory specimens with anti-reflective coatings.
Based on test results with a limited number of gyratory specimens, the project team was able to determine that the LTS is feasible for measuring macrotexture on gyratory specimens and can easily be carried to the field. The spikes attributed to specular reflection can be eliminated by using the anti-reflective coating. The dulling spray was selected as the most appropriate product for dulling surfaces of freshly prepared gyratory specimens.
Fabrication of Specimen Holder
One of the challenges the research team faced during the preliminary laboratory evaluation involved placement of the specimen under the scanner at the same location each time to take a measurement. It was time-consuming, and in some cases, the 100-mm-square area was not captured entirely, thereby giving erroneous results. The project team, in coordination with the machine shop at Federal Highway Administration’s (FHWA) Turner-Fairbank Highway Research Center (TFHRC), designed and fabricated a specimen holder that is easy to operate, capable of accommodating variable-thickness specimens, and gives accurate placement of specimens to capture a 100-mm-by-100-mm area. The specimen holder is shown in Figure 2.

Photograph of gyratory specimen holder.
This uniquely designed specimen holder has a platform to place the sample at the center of the platform with a 150-mm-diameter circle engraved on the base. It has a platform that slides front to back for easy specimen handling. The platform can also move up and down to adjust the height depending on the thickness of the laboratory-prepared gyratory specimens or field cores, and it accommodates any specimens smaller than 100 mm in thickness.
Phase II Assessment: Field Validation
The subsequent phase of this project involved the collection of data from various DGA projects to assess macrotexture test methods. Both laboratory and field data were gathered from these projects, facilitated through the Mobile Asphalt Technology Center (MATC) program. The first project focused on State A, where the evaluation of LTS was conducted alongside the volumetric approach—specifically, the sand patch method—and the CTM method. To ensure consistency, the project team established a standard operating procedure and test plan for field data collection by using the sand patch test (ASTM E965), a CTM (ASTM E2157), and the LTS. The forthcoming section gives a brief overview of the developments, data collection, test results, and analysis.
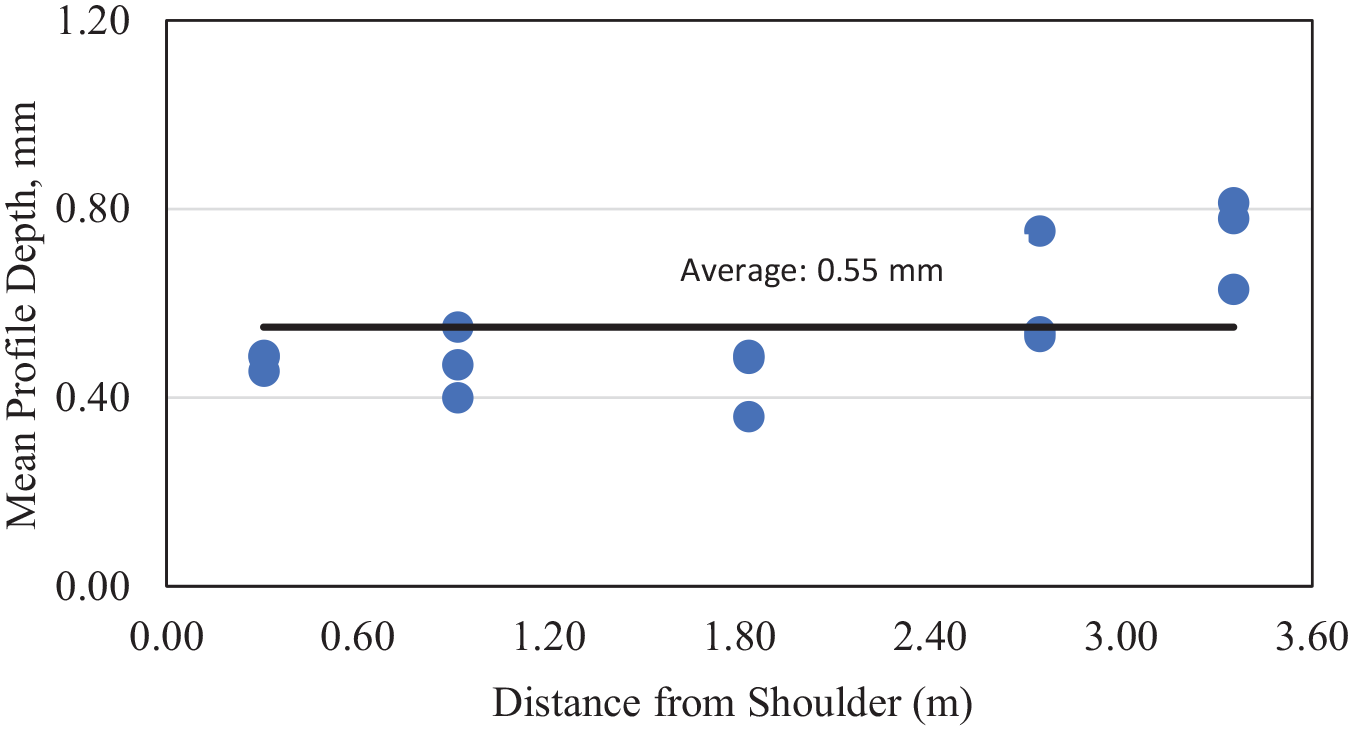
The State A test section was constructed with 9.5-mm NMAS DGA mixtures. All macrotexture testing was conducted within one production day of mix to reduce material variability, and the loose mix was also sampled from the same truckload of mixture as the test section in the field. A total of six 5-gal buckets of loose mixture were collected for preparing laboratory-compacted gyratory specimens for macrotexture evaluation. The CTM test locations were marked at the lane center: 0.91 m on each side of the lane center and 0.60 m outside that, for a total of five CTM transverse test locations per longitudinal location. Details of CTM test locations are shown in Figure 3.

Circular track meter (CTM) transverse test and core locations.
The CTM test locations shown are marked 1 through 5 per longitudinal location. Test location 2 is considered the left wheel path, and test location 4 the right wheel path in the direction of traffic. All testing was conducted after the last roller pass and before trafficking. CTM tests were conducted in accordance with ASTM E2157. The MATC team conducted sand patch tests at each of the CTM test locations (a total of 15 sand patch tests) in accordance with ASTM E965. Cores with diameters of 6 in (150 mm) were extracted from CTM test locations 2, 3, and 4—depicted in Figure 3 with orange circles—exclusively from one of the longitudinal positions.
Figure 4 shows measured MPD across the pavement. MPD ranged from 0.36 mm to 0.81 mm, with an average MPD value of 0.55 mm and a coefficient of variation of 24.8%, which represents the average macrotexture of pavement test section within one truckload.
Circular track meter (CTM) test results.
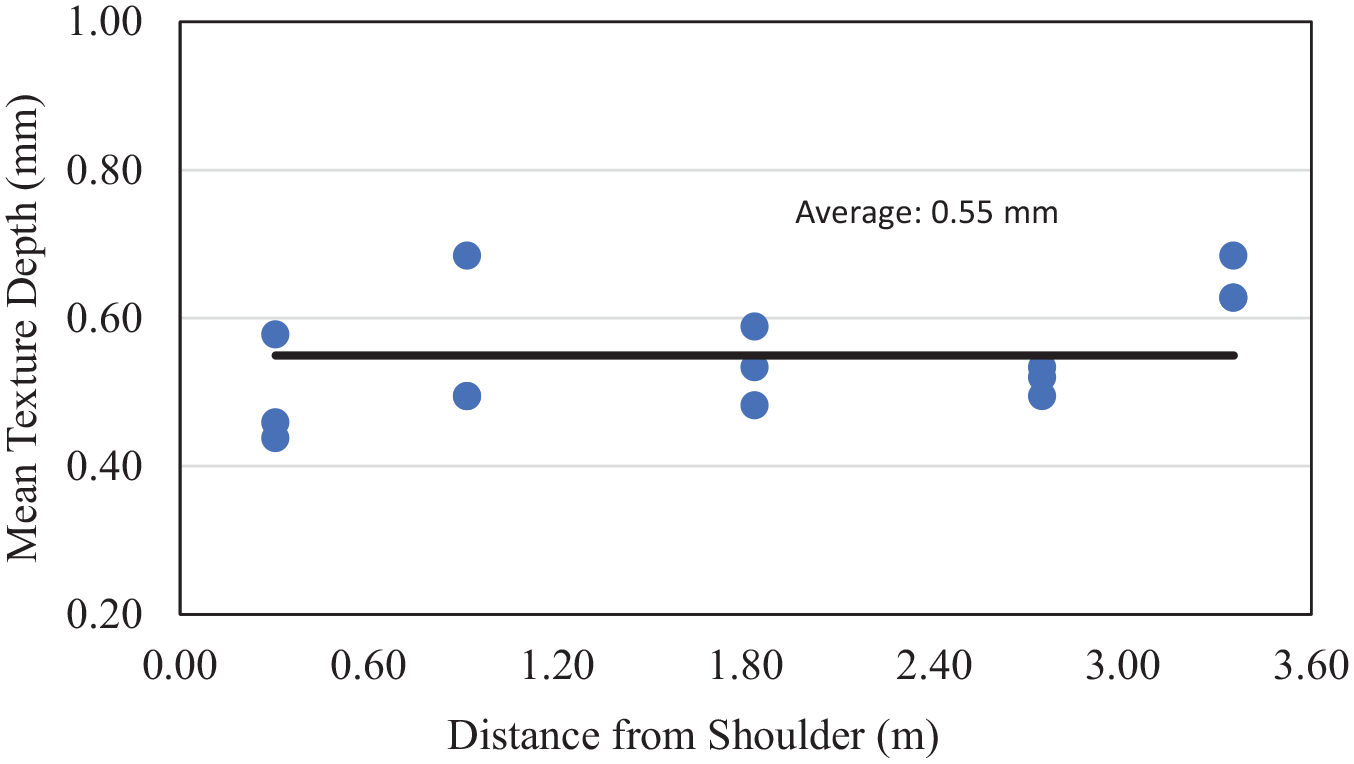
MTD was measured across the pavement by using the sand patch method, as shown in Figure 5. The average MTD ranged from 0.44 to 0.68 mm, with an average MTD value of 0.55 mm and a coefficient of variation of 13.8%.
Sand patch test results.
Laboratory Data Collection from State Project A
A total of 12 gyratory specimens of dimensions 150 mm in diameter by 100 mm in height were prepared with 4% target air voids by using the 9.5-mm NMAS loose mixture collected from the State A project. Macrotexture measurements were taken on the laboratory-mixed and laboratory-compacted DGA specimens and field cores. The test plan consisted of three field cores, identified as B2, B3, and B4 in Figure 3 for laboratory measurements.
Preliminary Data Analysis
The project team analyzed the MPDs of gyratory specimens, considering both the top and bottom surfaces. The team consistently observed that the MPDs of the bottom surfaces were higher than those of the top surfaces. Clear texture differences between the top and bottom surfaces are illustrated in Figures 6a and 7b. These texture disparities can be attributed to the concentration of air voids during compaction at the bottom of the gyratory mold. Additionally, the location of the gyratory compactor ram—whether it is placed at the top or bottom—may also influence these texture variations. For that reason, in a comparison of the specimens with field measurements, the top surfaces of the gyratory specimens were deemed more suitable. Recognizing the significance of the disparity, the team conducted further investigation into the difference between the top and bottom surfaces in the subsequent phases. The gyratory compactor used in this instance is a bottom-loading device with the ram on the bottom.

(a) Three-dimensional (3D) image of top surface. (b) 3D image of bottom surface.

Average mean profile depth (MPD) values of the laboratory-compacted specimens.
Figure 7 displays the average MPD values of 12 laboratory-compacted gyratory specimens with various combinations of anti-reflective coatings, along with uncoated specimens. The initial scans were conducted on uncoated specimens 1–6, and subsequently, talcum powder was applied to their top surfaces, and the bottom surfaces were coated with 3D spray. Following the initial scans, uncoated specimens 7–12 were scanned and then coated with dulling spray for measurements. The MPDs exhibited similar values among all coatings and orientations, ranging from 0.603 mm to 0.680 mm, with a coefficient of variation (COV) ranging from 11.7 to 22.3%. In this particular case, according to the analysis of variance (ANOVA), the macrotexture of both the top and bottom surfaces exhibited no significant difference. Nevertheless, it is noteworthy that the surfaces displayed a relatively higher level of macrotexture in comparison to the other surfaces under investigation.
Macrotexture Data Evaluation from State B Project
Macrotexture data were collected from a subsequent State B project. In this project, the following objectives were evaluated:
laboratory and field macrotexture relationships;
comparison of top and bottom surfaces’ macrotexture of gyratory specimens
interlaboratory macrotexture comparisons.
A total of 12 roadway cores were collected—six of them obtained during the first day of production (P1), and the other six obtained on the following day (P2) from the State B project. The MATC prepared 13 gyratory-compacted specimens in the laboratory: six were from the mixture samples collected on P1, and seven were from the mixture samples collected from P2. Each specimen was grouped into two categories, with half compacted to the design number of gyrations, Ndesign (75 gyrations), and the other half compacted to a target air void content of 7.0 ± 0.5%. Ndesign represents the number of gyrations required to produce a specimen with the same density as expected in the field after densification owing to traffic. Each of the 13 specimens had a diameter of 150 mm and a target height of 115 mm ± 5 mm. For each production day, five of the six cores were randomly selected from sections representing the entire day’s production, whereas the sixth core was taken from the section of pavement corresponding to the truckload of material from which the loose mixture was sampled.
Each of the field cores and gyratory-compacted specimens was scanned using the LTS by placing the specimens on the sample holder one at a time, as explained earlier in this report. The two laboratories conducting the testing were anonymously identified as Laboratory A (Lab A) and Laboratory B (Lab B) and completed testing on the same set of specimens within a couple of weeks of each other. The macrotexture measurements on the top and bottom surfaces were initially conducted by Lab A on uncoated gyratory-compacted specimens to see whether reflectance was an issue. The artificial spikes were not noticeable, and the anti-reflective coating was not used during the initial measurement. It appears that the need for anti-reflective coating is also dependent on the type of asphalt binder used. It is suggested that users evaluate the surface scan to assess the necessity of the anti-reflective coating. All the test specimens were transported to Lab B for macrotexture measurements. Lab B used the same LTS model and same specimen holder as Lab A. Lab B conducted the macrotexture measurements on the top and bottom surfaces of the uncoated gyratory specimens and the top surfaces of the field cores on the same set of specimens. Details of the test results and analysis are described in the following sections. Comparisons of the field core MPDs from two production days—P1 and P2—are shown in Figure 8. Similarly, comparisons of MPDs of the gyratory specimen from the P1 and P2 loose mixture are shown in Figure 9.

Mean profile depths (MPDs) of field cores from Lab A and Lab B.
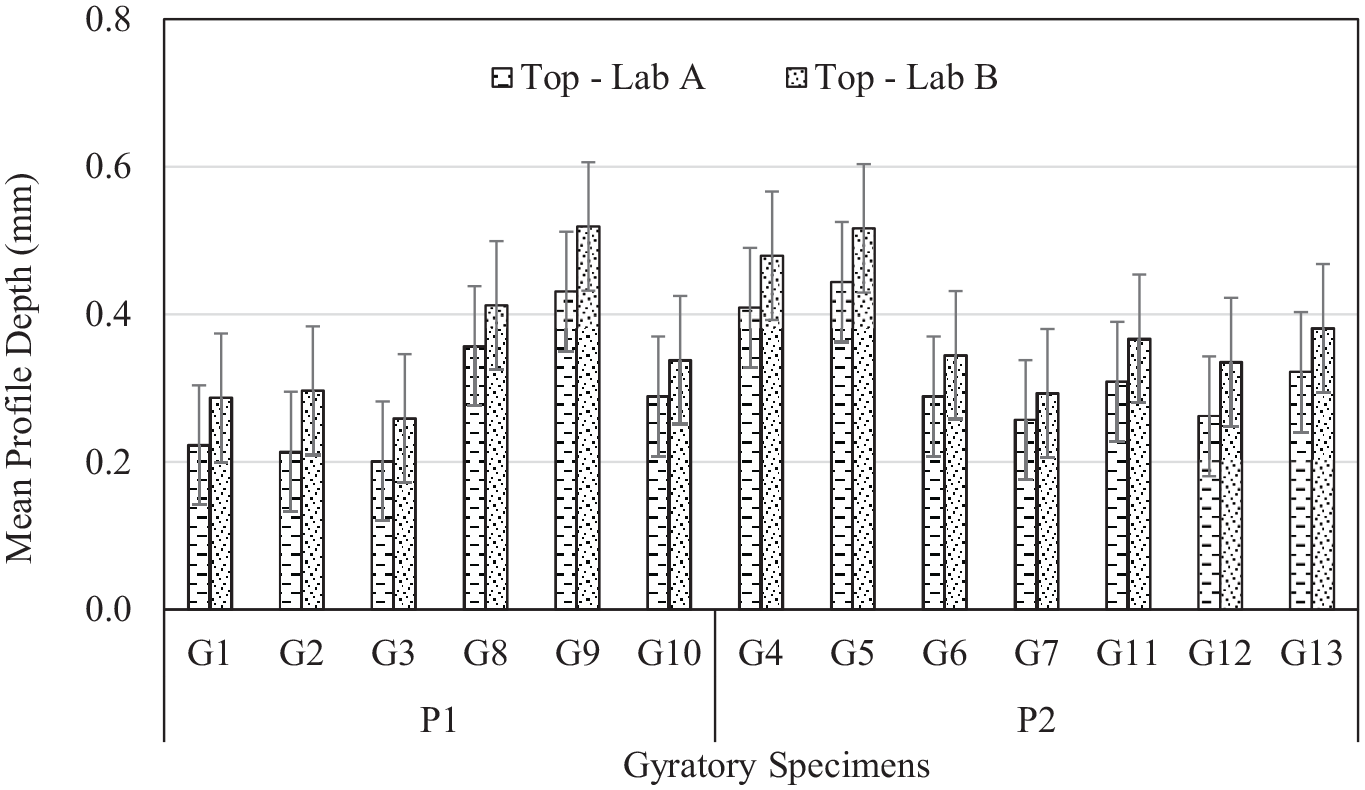
Mean profile depths (MPDs) of gyratory specimens from Lab A and Lab B.
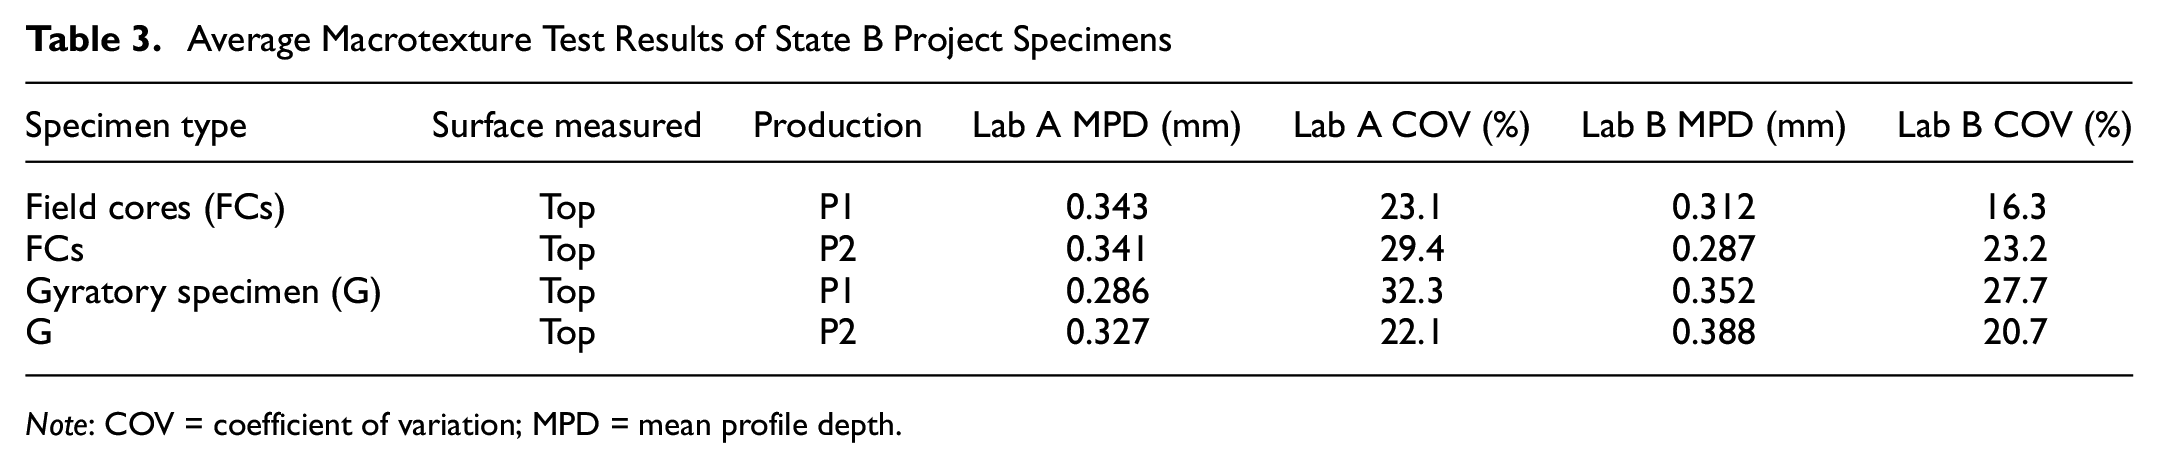
The average MPDs of all field cores and laboratory specimens collected from the State B project are shown in Table 3.
Average Macrotexture Test Results of State B Project Specimens
Note: COV = coefficient of variation; MPD = mean profile depth.
The coefficient of variation between the two laboratories showed clear bias, indicating differences in measurements despite using the same model of LTS and testing the same specimens. The operator, equipment, and procedural errors were identified as significant variables contributing to those differences. If the variation was due solely to the asphalt mixture, the macrotexture values measured would have been similar between the equipment. Further investigation revealed variations in specimen orientation, placement, and distance between the top surface and the scanner window for each laboratory, leading to increased test result variability. To address the inconsistency, a standardized macrotexture test protocol was developed to ensure consistent procedures across laboratories and reduce testing variability.
Data Collection Using Standardized Test Method
The macrotexture measurements were repeated on the same State B project set of field core and gyratory specimens by Lab A and then by Lab B within a couple of weeks in accordance with the standardized test protocol. During the data collection and processing phase, the investigators noticed the macrotexture data dropouts around the edges of gyratory specimens and field cores and that the dropouts were significant in some specimens. Figure 10 shows an example of a gyratory specimen clearly exhibiting the data dropout near a corner of the measurement area. These dropouts could have been attributable to the specimen’s being outside the 100-mm-square scanning area or owing to a large chip on the specimen or if the cored specimen was less than 150 mm in diameter. Errors attributed to dropouts can have a significant effect on the macrotexture profile, eventually resulting in erroneous MPD values—even after application of the ISO filtering method of data processing. The LTS software enables users to crop the scanned surface profile to eliminate the dropouts and then reprocess the data.
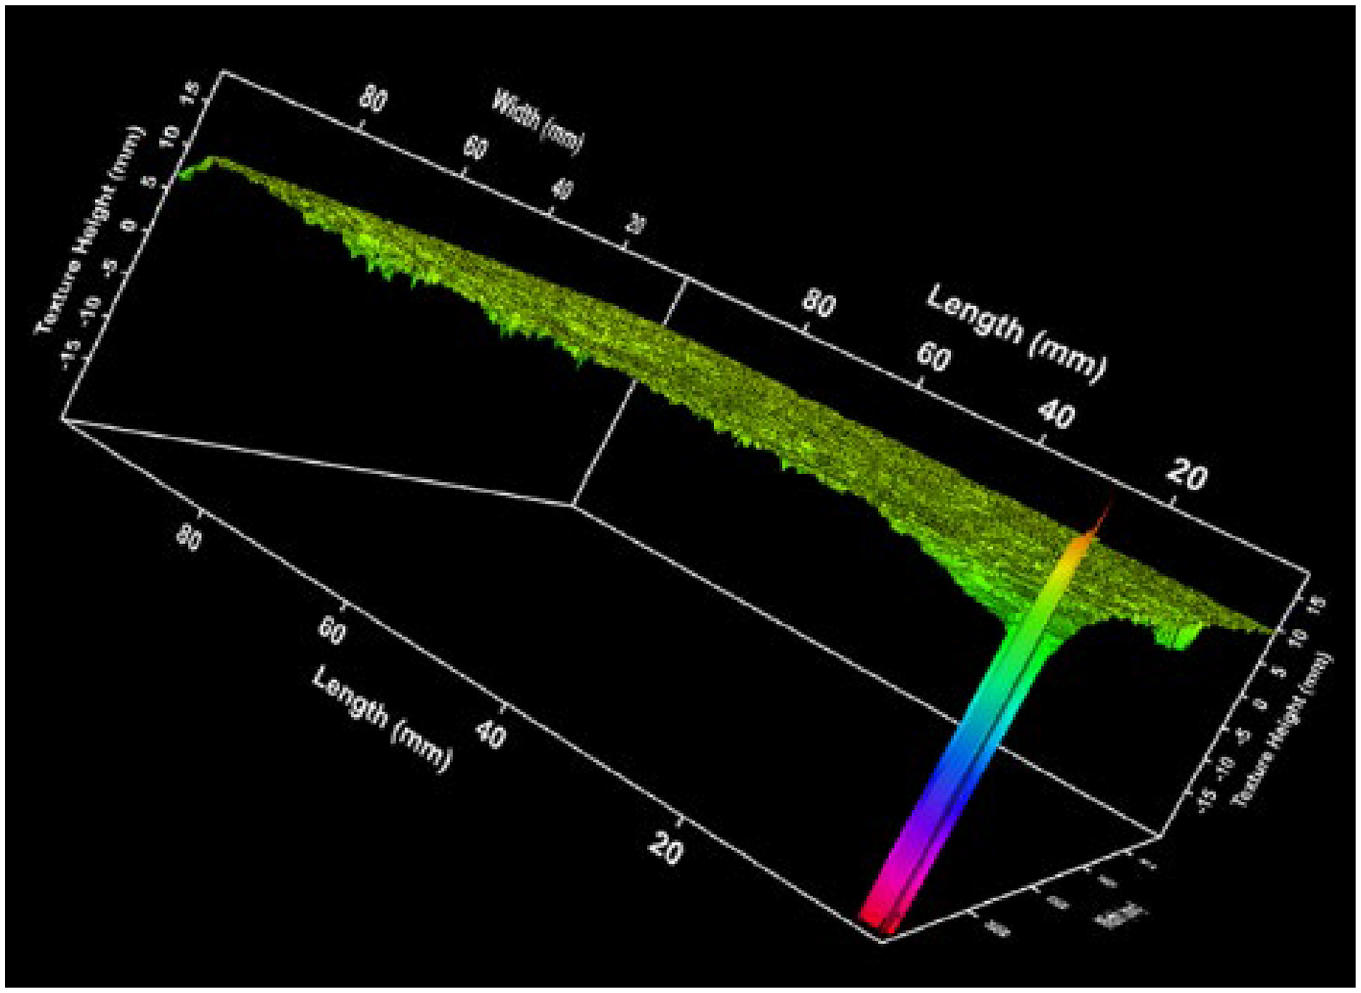
Macrotexture profile showing dropouts at the edge.
Figure 11 shows the profile after the cropping and reprocessing of the data.

Macrotexture profile after cropping.
To maintain data consistency, all data files were cropped and reprocessed to calculate MPDs from the top surfaces of the gyratory and field core specimens in the State B project. The cropping was performed to remove profile edges with significant dropouts—without applying specific dimensions. The investigators are considering implementing a cropping step with specific dimensions to retain as much scanned surface area as possible. Such improvements in cropping and the standardized test protocol were made to ensure reproducible results and will be incorporated into the standardized test method. The MPDs of field cores and gyratory specimens after cropping are shown in Figures 12 and 13, respectively.
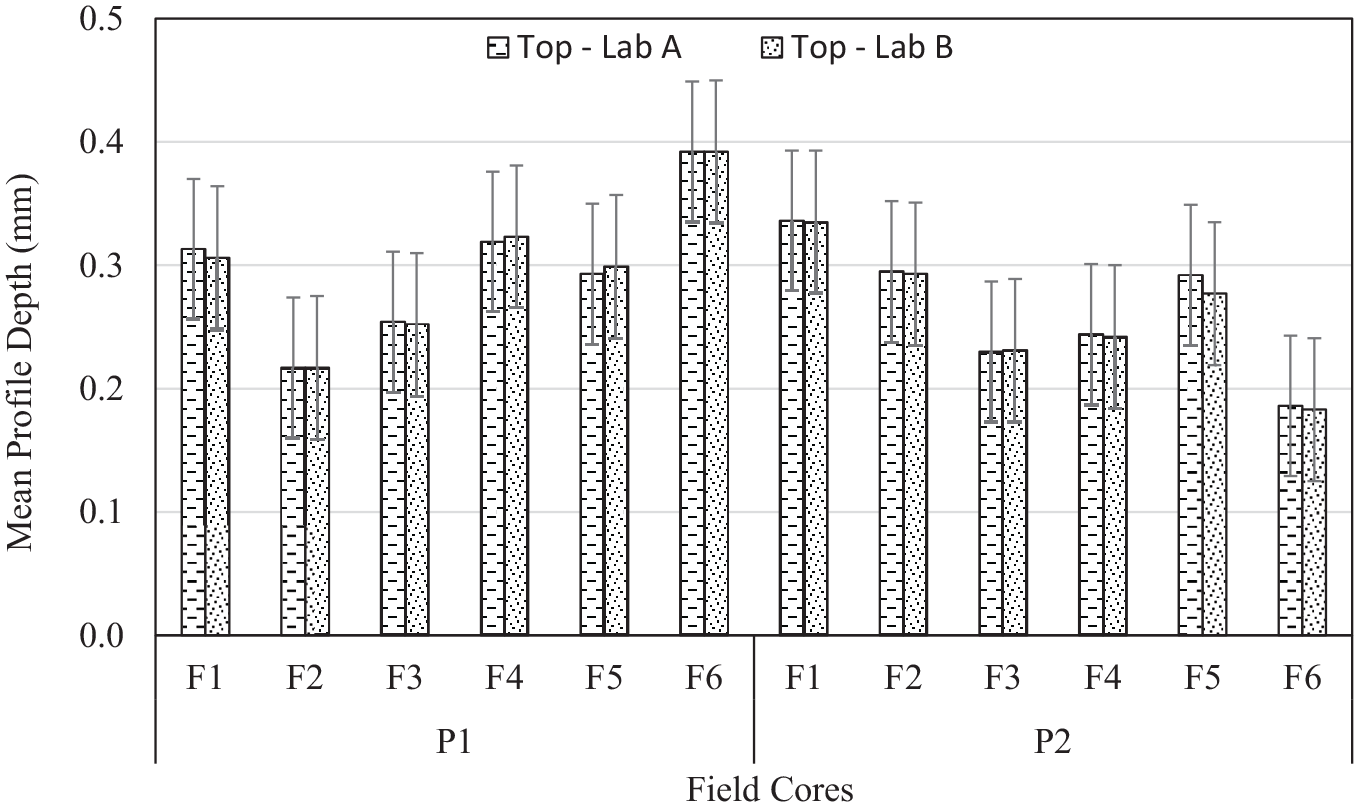
Mean profile depths (MPDs) of field cores from Lab A and Lab B after cropping.
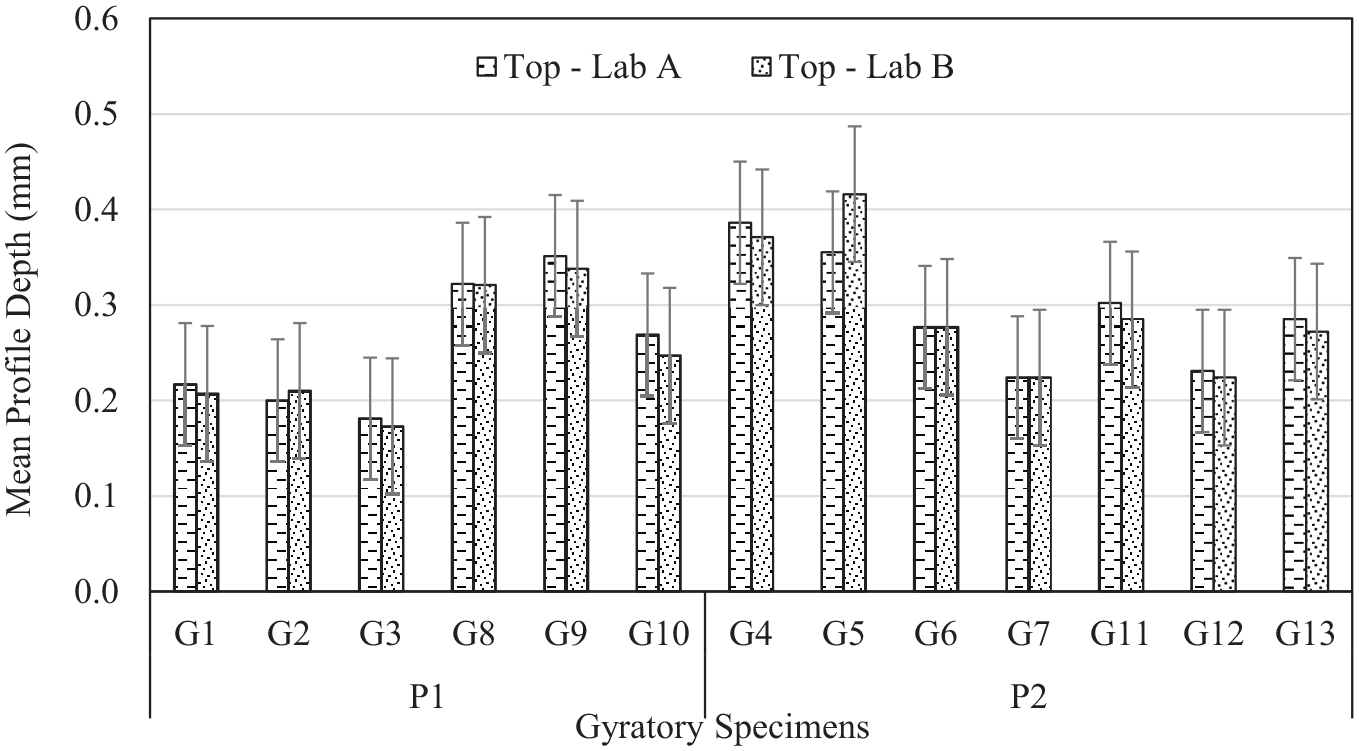
Mean profile depths (MPDs) of gyratory specimens from Lab A and Lab B after cropping.
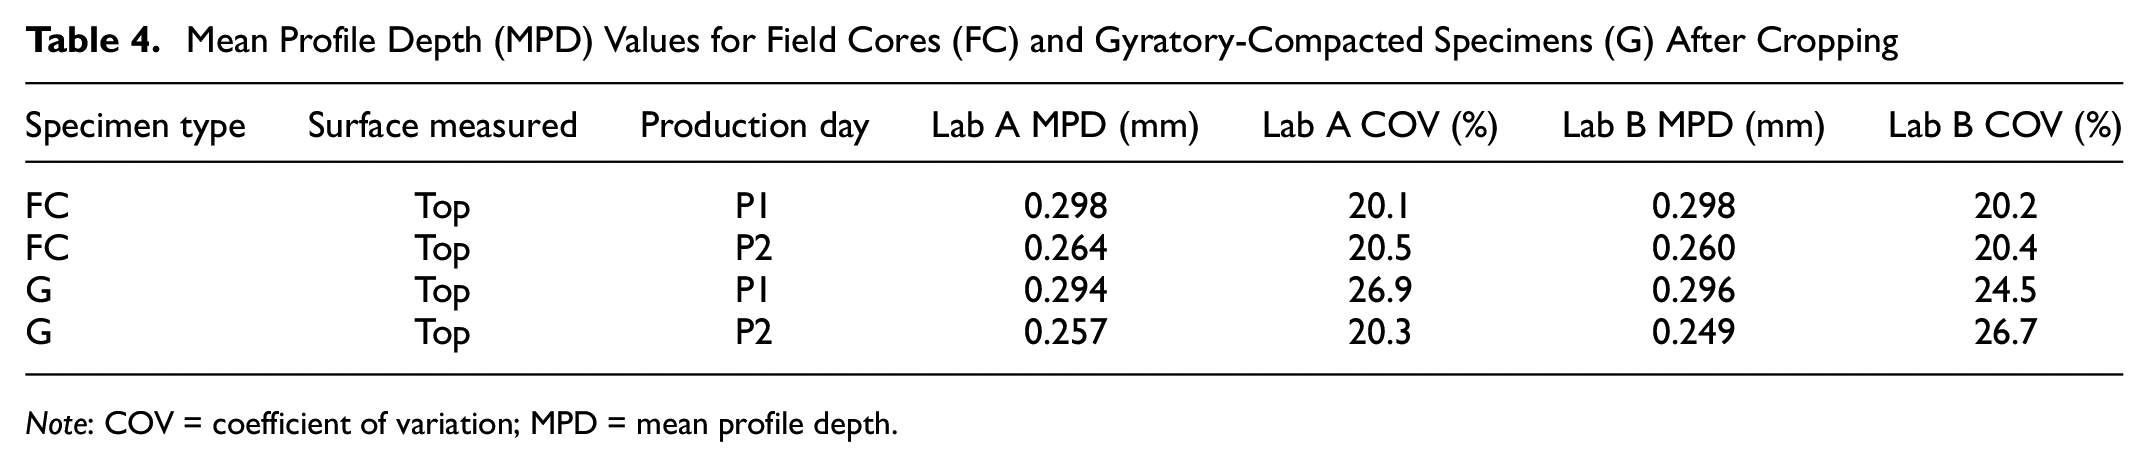
The average MPD of all the field cores and gyratory-compacted specimens was determined with the cropped data, as shown in Table 4.
Mean Profile Depth (MPD) Values for Field Cores (FC) and Gyratory-Compacted Specimens (G) After Cropping
Note: COV = coefficient of variation; MPD = mean profile depth.
The field cores and gyratory specimens exhibited good agreement with the average MPD values of production days P1 and P2, as evident from Table 3 and Figures 12 and 13. There was a maximum reduction in coefficient of variation from 29.4 to 20.5% for the field cores and from 32.3 to 26.9% for the gyratory specimens. The reproducibility of MPD values across the two laboratories also improved. The average MPD values of field cores ranged from 0.264 mm to 0.298 mm from Lab A and from 0.260 mm to 0.298 mm for Lab B, respectively. The average MPD values for gyratory specimens from both production days were also comparable between Lab A and Lab B, at 0.279 mm and 0.273 mm, respectively. The differences were statistically insignificant.
Macrotexture Evaluation of Testing in the Longitudinal and Transverse Directions
The research team assessed macrotexture measurements taken in both the longitudinal and transverse directions (specimen turned 90 degrees) to determine any differences. Figure 14 illustrates the comparison of MPD measured in the longitudinal and transverse directions on field core specimens from the State B project.
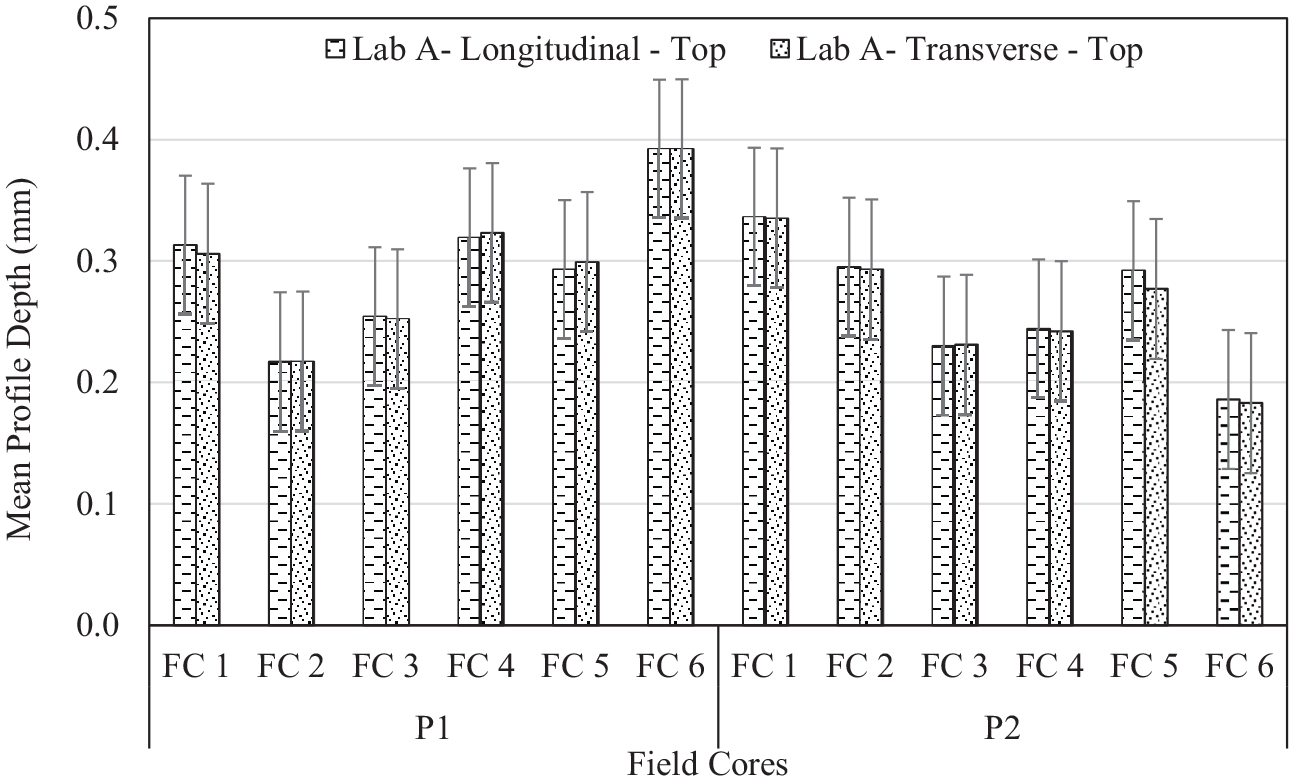
Field core mean profile depths (MPDs) in longitudinal and transverse direction of field cores.
For gyratory specimens, quadrants were marked for ease of measurement. The specimens were tested, turned 90 degrees, and tested again to measure MPD. Figure 15 compares MPDs tested at zero degrees and 90 degrees for the gyratory-compacted specimens.
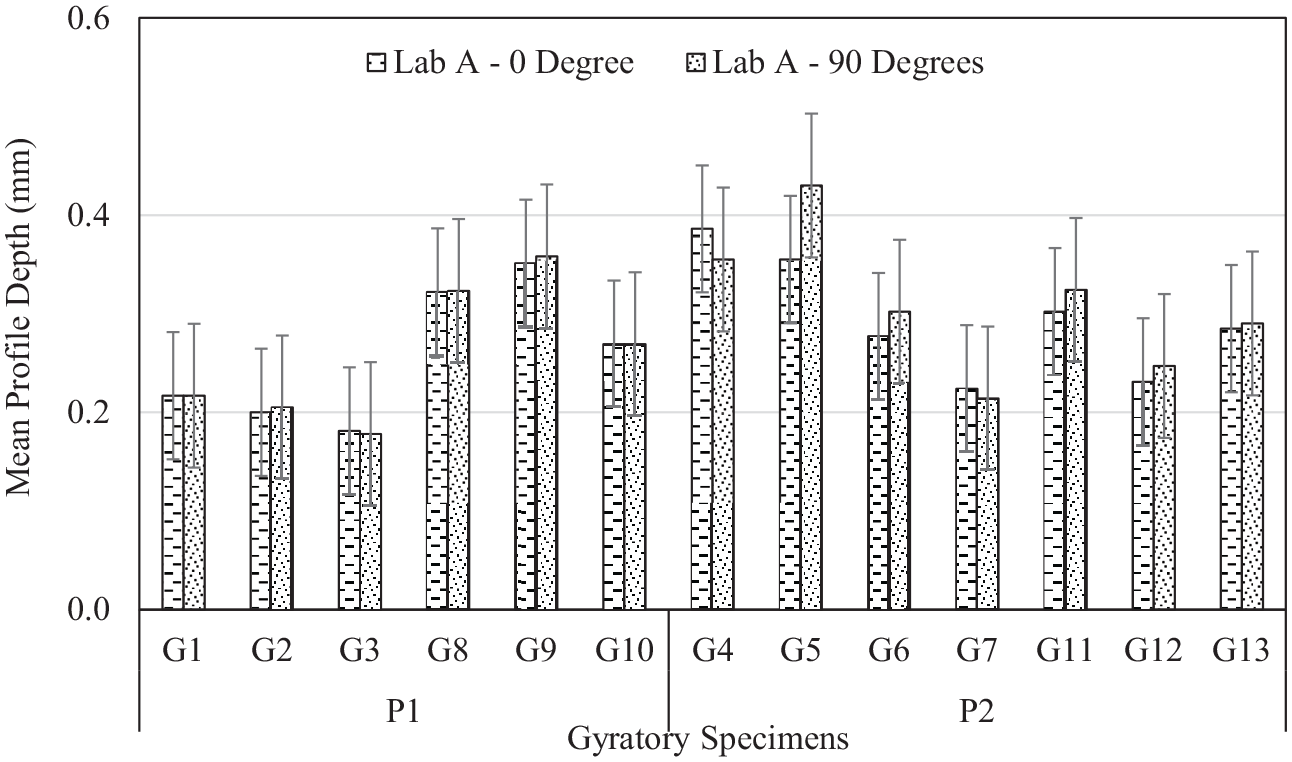
Mean profile depth (MPD) values of gyratory specimens in longitudinal and transverse directions.
Figures 14 and 15 show that MPD values were very similar, as expected. The average values of all specimens were same. Lab B test results also confirmed that the MPD values of longitudinal and transverse directions were similar for both gyratory specimens and field cores.
Macrotexture Test Protocol Refinement
To enhance the repeatability of macrotexture measurements and reduce variability, the test protocol underwent revision. Specifically, the revised protocol introduced a cropping step wherein 15 mm were trimmed from both the left and right sides of the square area encompassing the macrotexture measurements. In contrast, the preceding protocol did not specify specific dimensions for cropping. While it was previously suggested that the top surfaces of the gyratory specimens were of closer resemblance to the field measurements, additional data analysis was necessary to conclusively determine whether measurements from the top or bottom surfaces more closely correlated with field measurements. For this analysis, the field cores and gyratory macrotexture data collected by both Lab A and Lab B were processed using the newly revised test protocol.
The data analysis focused on the following surfaces and surface combinations:
field core top surface: longitudinal (direction of traffic) (F-L);
field core top surface: transverse (90 degrees to direction of traffic) (F-T);
field core longitudinal and transverse top surface average (F-L/T average);
gyratory specimen top surface: zero (0) degrees (G T-0);
gyratory specimen top surface: 90 degrees (G T-90);
gyratory specimen 0 and 90 degrees top surface average (G T 0-90 average);
gyratory specimen bottom surface: zero (0) degrees (G B-0);
gyratory specimen bottom surface: 90 degrees (G B-90);
gyratory specimen 0 and 90 degrees bottom surface average (G B 0-90 average);
gyratory average of top and bottom surfaces zero (0) degrees (G T/B 0);
gyratory average of top and bottom surfaces 90 degrees (G T/B 90).
For the field cores, only uncoated top surfaces were considered for analysis. For gyratory-compacted specimens, both uncoated and dulling-spray-coated surfaces (both top and bottom) were considered for analysis.
Figure 16 shows the average MPD of uncoated gyratory specimen surfaces compared with top surfaces of uncoated field cores from the State B project. A one-way ANOVA was performed on field cores and the top surfaces of gyratory specimens from Lab A. The results of the one-way ANOVA revealed no statistically significant difference between the mean MPD values of uncoated field cores and the uncoated top surfaces of the gyratory specimens (p = 0.576) from Lab A. Additionally, a one-way ANOVA was conducted on the field cores and the bottom surfaces of the gyratory specimens from Lab A, and the difference between the mean MPD values of the field cores and uncoated bottom surfaces was highly significant (p = 0.001). A similar observation was made for Lab B.

Comparison of mean profile depth (MPD) values of uncoated gyratory surfaces and field data.
Figure 17 shows the average MPD of the dulling-spray-coated gyratory specimen surfaces compared with the top surfaces of uncoated field cores from the State B project. A one-way ANOVA was performed on field cores and the top surfaces of the dulling-spray-coated gyratory specimens from Lab A. The results of the one-way ANOVA revealed no statistically significant differences between the mean MPD values of uncoated field cores and the dulling spray-coated top surfaces of the gyratory specimens (p = 0.244) from Lab A. Additionally, a one-way ANOVA was conducted on the field cores and the bottom surfaces of the dulling-spray-coated gyratory specimens from Lab A, and the differences between the mean MPD values of the uncoated field cores and dulling-spray-coated bottom surfaces were highly significant (p = 0.002). Similar observations were made for Lab B.

Mean profile depth (MPD) values comparison of dulling spray-coated gyratory surfaces and field cores.
Macrotexture Data Evaluation from State C Project
The next set of macrotexture data was collected from a State C project. In this project, gyratory specimens were prepared at two different air void levels: Nd and 7%. A total of three field cores were collected for evaluation. Six gyratory specimens were prepared in the laboratory by using the loose mix collected from the project by MATC. For this project analysis, the macrotexture data from both the field cores and the gyratory specimens, collected by both Lab A and Lab B, were processed using the newly revised test protocol.
Figure 18 compares MPD values between dulling-spray-coated gyratory specimens and field cores from the State C project. A one-way ANOVA revealed no statistically significant difference between the mean MPD values of the field cores (UC) and the dulling-spray-coated top surfaces of the Nd gyratory specimens (p > 0.05).
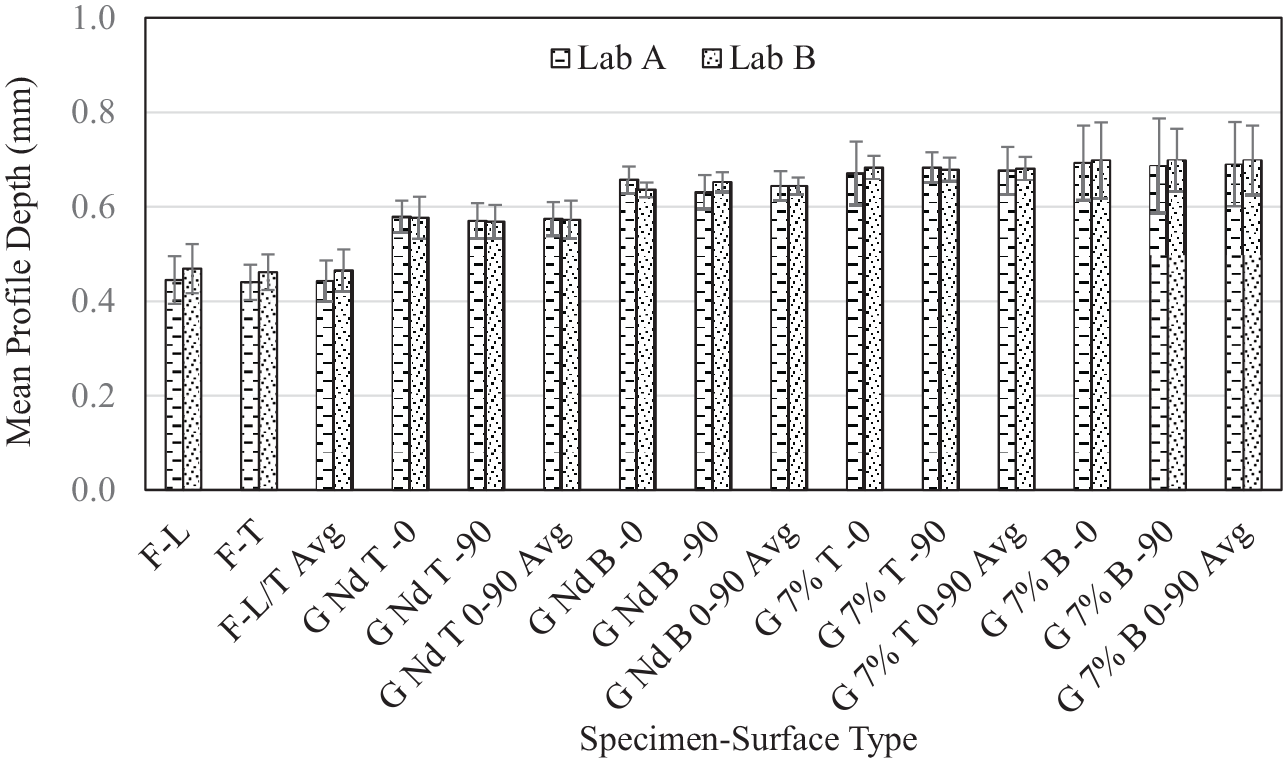
Comparison of mean profile depth (MPD) values of dulling-spray-coated gyratory specimens and field cores from the State C project.
The 7% air voids gyratory top surfaces and bottom surfaces exhibited the highest MPD values compared with the Nd and field cores.
Macrotexture Data Evaluation from the State D Project
Figure 19 compares MPD values between dulling-spray-coated gyratory specimens and field cores obtained from the State D project. In this project, 10 field cores and six gyratory specimens were evaluated. Gyratory specimens included both Nd and 7% air voids. The analysis for this project specifically focused on the data from Lab A. Figure 19 shows that the average MPD values of the dulling-spray-coated top surfaces of the gyratory specimens (Nd) are similar to those of the uncoated field cores. In other words, the MPD values obtained from the gyratory samples are comparable to those from the field cores. As mentioned, the 7% air voids gyratory top surfaces and bottom surfaces exhibited the highest MPD values compared with the Nd and field cores as observed in the State C project.

Comparison of the mean profile depth (MPD) values of dulling-spray-coated gyratory specimens and field cores from the State D project.
Based on data collected from four State departments of transportation (DOTs) projects, the average MPD values of a gyratory specimen’s top surface correlates to the field measurements compared with all other surface types and combinations. The relationship of a gyratory specimen’s MPD to field measurements will continue to evolve; however, at this time, it appears that gyratory specimens’ top surfaces are considered reasonable to use during mix design and production to assess the macrotexture of DGA mixtures.
Conclusions and Recommendations
The findings of this study demonstrated that the LTS effectively measures macrotexture profiles on both laboratory-fabricated gyratory specimens and field cores. The implementation of a standardized testing protocol—along with techniques like data cropping—served to improve measurement consistency and repeatability, allowing for more accurate assessment of pavement surface characteristics. The use of a dulling spray showed promise as an anti-reflective agent. Interlaboratory test results of field cores and laboratory gyratory specimens from different sources exhibited good repeatability and reproducibility. Differences in macrotexture between longitudinal and transverse testing directions were insignificant, as were differences of 0 degrees to 90 degrees testing directions. However, it is worth noting that the macrotexture of the top and bottom surfaces of gyratory specimens differed, with MPD values generally higher on bottom surfaces. Based on data analysis from five State DOT projects, macrotexture measurements from the top surfaces of gyratory specimens correlated well with field core measurements, making them appropriate test specimen surfaces for assessing the macrotexture of DGA mixture during mix design and production. Additionally, a draft test protocol has been developed for measuring macrotexture by using an LTS on both laboratory-prepared gyratory specimens and field cores.
Future Plans
The research team is planning to proceed with demonstration of the LTS to the State DOTs through the MATC program. Additional data from other State projects and the Pavement Testing Facility at Pavement Testing Facility at TFHRC will be collected and analyzed to refine the macrotexture test method. Another plan is to examine macrotexture readings over time after completion of finish rolling, such as 1 day, 1 week, and 1 month after pavement has been built.
Footnotes
Acknowledgements
The authors of this paper acknowledge Satish Belagutti, who was unavailable to confirm authorship, but all coauthors agree to Satish’s role in conducting the data analysis, processing and assessing the data, and preparing the initial draft of this paper, which was submitted to the Transportation Research Board on August 30, 2023. Thanks are also extended to Steven Portillo of Genex Systems for contributions to the fabrication and testing in this work. Furthermore, we acknowledge Mark Leichty of Ames Engineering for generosity in loaning the equipment and providing valuable input during the initial evaluation.
Author Contributions
The authors confirm contribution to the paper as follows: study conception and design, analysis and interpretation of results: by Andy Mergenmeier, David J. Mensching, Maryam S. Sakhaeifar, Leslie Ann Myers and Ram Kumar Veeraragavan, Maryam S. Sakhaeifar; draft manuscript preparation. All authors reviewed the results and approved the final version of the manuscript.
Declaration of Conflicting Interests
The authors declared no potential conflicts of interest with respect to the research, authorship, and/or publication of this article.
Funding
The authors disclosed receipt of the following financial support for the research, authorship, and/or publication of this article: This research study was done as part of work done at the Federal Highway Administration (FHWA).