
Abstract
Multi-function services characteristic of complexes, complicated spatial structure, and inaccurate parking guidance in complex parking lots create many issues for drivers, including orientation problems, excessive parking time, and difficultly finding a parking space close to the desired destination. Complex parking lot guidance systems (CPLGSs), if accurately designed, can potentially make a substantial contribution to alleviate these problems and reduce drivers’ travel time while improving the parking experience. However, the extent of this contribution depends on drivers’ acceptance of this technology. This paper reports on the intention of complex visitors to use CPLGSs. Specifically, an integrated model combining the technology acceptance model and the theory of planned behavior was developed and tested to analyze the factors that can affect drivers’ behavioral attitudes and intentions for CPLGSs. Perceived risk is included as an antecedent on behavioral attitude. Data were collected through an online questionnaire, and 810 valid questionnaires were obtained. Results from a structural equation model show that perceived usefulness, subjective norm, behavioral attitude, and perceived behavioral control are positively connected with behavioral intention, while perceived risk is negatively related to behavioral attitude. Findings on mediators are also discussed. In addition, multi-group differences are analyzed, revealing that the use intention of the age ≤ 40 group is more positively influenced by subjective norms compared with the age > 40 group. Moreover, perceived ease of use has a strong influence on behavioral attitude, especially among individuals who travel to a complex frequently. The theoretical implications in this paper are intended to guide the service improvement of CPLGSs and other parking guidance systems.
Keywords
With the continuous progress of urbanization, urban land resources are increasingly scarce. To make full use of limited land resources, dense and vertical land uses are advocated ( 1 ). This has led to the construction of many urban complexes, which offer a diverse range of services and products to satisfy the diversified needs of urban residents. Examples can be found in different countries and cities, such as the Rockefeller Center in New York, La Défense in Paris, Roppongi Hills in Tokyo, and China Central Place in Beijing.
The concept of an urban complex refers to the organic combination of a variety of different activities spaces (commerce, office, entertainment, hotel, residence, etc.) in a group of buildings ( 2 ). As such, the complexes have become important gathering points for a various range of activities in the city. Taking Shanghai as an example, 225 urban complexes had been built by the end of 2017, with a total building area of 16.37 million m2, with an annual passenger flow of 2.13 billion persons and a total of 145,000 parking spaces ( 3 ). By the end of 2021, Shanghai accommodated 343 complexes of more than 30,000 m2 and 15 super complexes of more than 200,000 m2 ( 4 ). The large-scale development of urban complexes and the increasing influx of visitors require the creation of extensive parking lots that can accommodate high volumes of parked vehicles. This results in complex parking lots with large surface areas, numerous parking spaces, and complex spatial configurations. These characteristics can create several issues for car drivers, such as spatial disorientation when navigating the complex parking lots and difficulty finding a parking space close to the desired destination, which is located on upper levels of the complex ( 5 – 7 ). Even if drivers find a parking space easily, they may still face issues in finding the optimal pedestrian facility (e.g., elevators, escalators, stairs) leading to the desired activity place because of a lack of clear guiding signs and effective parking guidance. It is common for drivers to spend a considerable amount of time searching for their upper-level destinations because of using the wrong pedestrian facilities. All of these time inefficiencies can negatively affect drivers’ parking experience and their satisfaction with the complex parking lot, potentially leading to decreased satisfaction and loyalty toward the visited urban complex. The design and implementation of complex parking lot guidance systems (CPLGSs) that take into account the complicated spatial structure of a complex parking lot and drivers’ guidance needs may help to improve drivers’ travel experience and satisfaction.
The complex nature of problems associated with complex parking lots has led to the emergence of different strands of literature, focusing on various aspects such as parking operation evaluation ( 6 , 7 ), spatial layout optimization ( 8 ), and traffic organization ( 9 ). Some previous studies on CPLGSs focus on the short-term prediction of vacant parking spaces ( 10 ) and the dynamic allocation of parking spaces ( 5 ). With regards to the features of a CPLGS, Liu pointed out that such a system should include certain functionalities, such as access controlling, parking charging, and a parking space guidance module ( 11 ). However, to the best of our knowledge, there is a research gap in understanding the users’ behavioral intentions (BIs) toward CPLGSs. Given that a CPLGS can be seen as a new technology or service, it is important to explore its acceptance among drivers. In view of this research gap and the increasing diffusion of urban complexes, this study aims to identify the factors that affect drivers’ BI toward CPLGSs. In doing so, first, the design concept of a CPLGS that meets drivers’ parking demand in the complex parking lot based on drivers’ guidance needs is proposed. The suggested concept is then used to develop a conceptual framework for drivers’ BI based on validated socio-psychological and behavioral models, namely the technology acceptance model (TAM) and the theory of planned behavior (TPB). These two well-established theoretical frameworks are often utilized to understand end users’ intentions to adopt new technology systems and are combined in a joint framework to incorporate the factors related to users’ attitudes and perceptions toward new services or technology, as well as user-related social and cognitive dimensions. Specifically, in this study the TAM and TPB theories are extended by including an additional construct, that is, perceived risk (PR). Considering the potential loss of control over parking decisions and the leakage of travel information that may result from relying on the CPLGS app, incorporating PR in the conceptual model can provide further insights into drivers’ BI toward this new service.
Empirical data gathered through an online questionnaire distributed in China are employed to examine the hypotheses formulated on the basis of the developed conceptual model. Structural equation modeling (SEM) is used to assess the hypothesized relationships and unravel the factors that drive users’ intentions to use CPLGSs.
The remainder of this paper is organized as follows. First, existing literature is reviewed. Second, the CPLGS design concept and the conceptual framework based on the combined TAM and TBP (C-TAM-TPB), along with its underlying hypotheses, are presented. Next, the research methodology is described, which also includes the details about collected data. Then, the data analysis and hypotheses testing results are explained. Finally, the model findings and conclusion, with implications, limitations, and recommendations for future research, are discussed.
Literature Review
Examining the potential of a new technology or product in the market before large investment is essential to avoid wasting public or private funds. Therefore, conducting preliminary research on user BIs (to use the product or service) becomes crucial. This approach usually helps to gain valuable insights into the users’ acceptance of these innovations and enables an understanding of the factors that affect their acceptance. From the drivers’ perspective, a CPLGS represents a new service enabled by an innovative transportation technology. Consequently, a comprehensive understanding of drivers’ acceptance of such a system is crucial for its successful introduction, ensuring that its innovative nature aligns well with user expectations and maximizes its outreach and impact.
A widely adopted methodological approach in studies on users’ acceptance and BI is SEM ( 12 ). SEM builds on established theoretical frameworks to test hypotheses, and verifies and analyzes the impacts of unobserved variables on users’ intentions to adopt and use new services or technologies. This method considers the interrelationships among various constructs and facilitates a systematic analysis of their effects. By employing SEM, it is possible to better understand the factors that drive users’ attitudes and intentions to use CPLGSs. Within this domain, two widely utilized frameworks are the TAM and the TPB. TAM was originally introduced by Davis, and has become one of the most widely used models of acceptance information technology ( 13 , 14 ). The model proposes that the behavior of an individual using information technology is driven by the individual’s BI, which in turn is generally influenced by the individual’s attitude toward usage, perceived usefulness (PU), and perceived ease of use (PEU) of the information technology. On the other hand, TPB offers a social-psychological framework that takes into account social and cognitive factors, including subjective norms (SNs), perceived behavioral control (PBC), and behavioral attitude (BA), all of which serve as key determinants of individuals’ BIs ( 15 ). As such, it is widely used to explain the relationship between attitude and behavior and can help to understand how individuals form and change their behavior patterns.
Some researchers have claimed that using the TAM model to conduct intentional behavior research may overlook the influence of social and control factors, despite evidence that demonstrates the impact of such factors on the users’ intention to utilize new technologies ( 16 – 18 ). In contrast, SNs and PBC are key variables of the TPB model, which to some extent can supplement the TAM’s limited coverage of social and control variables ( 16 , 19 ). By combining TAM and TPB models into the C-TAM-TPB model, a more unified and comprehensive framework emerges ( 16 , 20 ).
Existing literature shows that studies on parking services use intention have applied several different behavioral frameworks, among which are TPB, TAM, and C-TAM-TPB. For example, Ye et al. ( 21 ) and Yang et al. ( 22 ) studied drivers’ willingness to use shared automated driving services and parking apps based on the TAM model. Niu et al. ( 23 ), Liang et al. ( 16 ), and Ning et al. ( 17 ) studied the influential factors and willingness of drivers to use shared parking by utilizing the TAM and C-TAM-TPB models. However, to the best of our knowledge, no existing research has investigated user BI toward CPLGSs. Moreover, some scholars have incorporated PR into the modeling framework to analyze its impact on users’ BAs of parking services. As defined by Bauer, PR represents “a combination of uncertainty plus seriousness of outcome involved” ( 24 ). Ye et al. ( 21 ) and Ning et al. ( 17 ) have identified PR related to the shared autonomous vehicle services and shared parking system, including risks associated with cost, safety, perfectness of functions, facilities, and services, and have demonstrated that PRs can negatively affect users’ attitudes toward such parking services. In this study, potential PRs related to CPLGSs are mined and incorporated into the modeling framework to analyze whether PRs affect users’ attitudes toward the CPLGS usage.
CPLGS Concept, Theoretical Model, and Hypotheses
CPLGS Design Concept
The process of finding a suitable parking place in a complex parking lot is more complicated compared with other types of parking situations. This implies that drivers’ guidance needs to extend beyond merely knowing the availability of parking spaces. In fact, the identification of parking lot entrances and exits is also needed, particularly in cases where multiple entrances and exits are present. Additionally, drivers are interested in seeking information about parking zones, pedestrian facilities (such as elevators, escalators, and stairs), and destination locations in the upper levels of the complex. To better understand the key aspects of the drivers’ travel process in complex parking lots and their interaction with CPLGSs, schematic diagrams are presented in Figure 1 illustrating the sequential stages from arrival at the complex to departure from the complex.

Sequential stages of drivers arriving and leaving the complex: (a) drivers arriving at the complex and (b) drivers leaving the complex.
A CPLGS can be conceived as a system that operates via a mobile application (app). To offer an adequate guidance through all these stages, a CPLGS should include the following functions.
1) Entrance recommendation: This is especially important for parking lots with multiple entrances. Based on the name or type of place of activity that the drivers enter into the CPLGS mobile phone app, the system recommends the closest entrance to the activity location within the complex by providing a guidance path from the current location to the parking lot entrance, as shown in Figure 2.
2) Parking space guidance: Once the driver enters the parking lot, the CPLGS guides the driver to the parking space closest to the final destination to minimize the driver travel time, including the driving time (entrance → parking zone → parking space) and walking time after parking (parking space → pedestrian facility → the place of activity at the upper levels of the complex), as shown in Figure 3. In this process, different weights can be assigned to the driving time versus walking time depending on users’ physical conditions, ages, and companions (young kids, elderly), so that the parking space guidance can be customized. To ensure that the allocated parking space is not used by other CPLGS users or non-CPLGS users, an intelligent automatic parking lock should be installed on the parking space ( 25 – 27 ). In this proposed system, as soon as a CPLGS user books a parking space, the allocated parking space would be removed from the application so other app users cannot book it. When the driver using the CPLGS reaches the designated parking space, they can unlock the parking space through the CPLGS mobile app and then use the parking space. The configuration of intelligent automatic parking locks should be tailored to the number of users and the budget of the parking lot operator. In the initial stages of CPLGS implementation, the number of users may not have reached a certain scale, and priority can be given to installing intelligent automatic parking locks in strategically located spaces. As the user base expands, parking spaces equipped with intelligent automatic parking locks should be progressively extended.
3) Pedestrian facility guidance: After parking, the CPLGS guides the driver to the nearest pedestrian facility (elevators, escalators, stairs), allowing the driver to reach the place of activity on the upper floors of the parking lot quickly, as indicated in Figure 3.
4) Place of activity route guidance: the CPLGS provides the driver with information about the location of the desired place of activity within the complex (e.g., floor number) as well as the shortest walking path from the pedestrian facility (elevators, escalators, stairs) to the desired destination.
5) Reverse path guidance: Once the driver completes the activity, the system guides the driver back to the parked vehicle and shows the departure route to exit the complex and reach the final destination, as indicated in Figure 4.
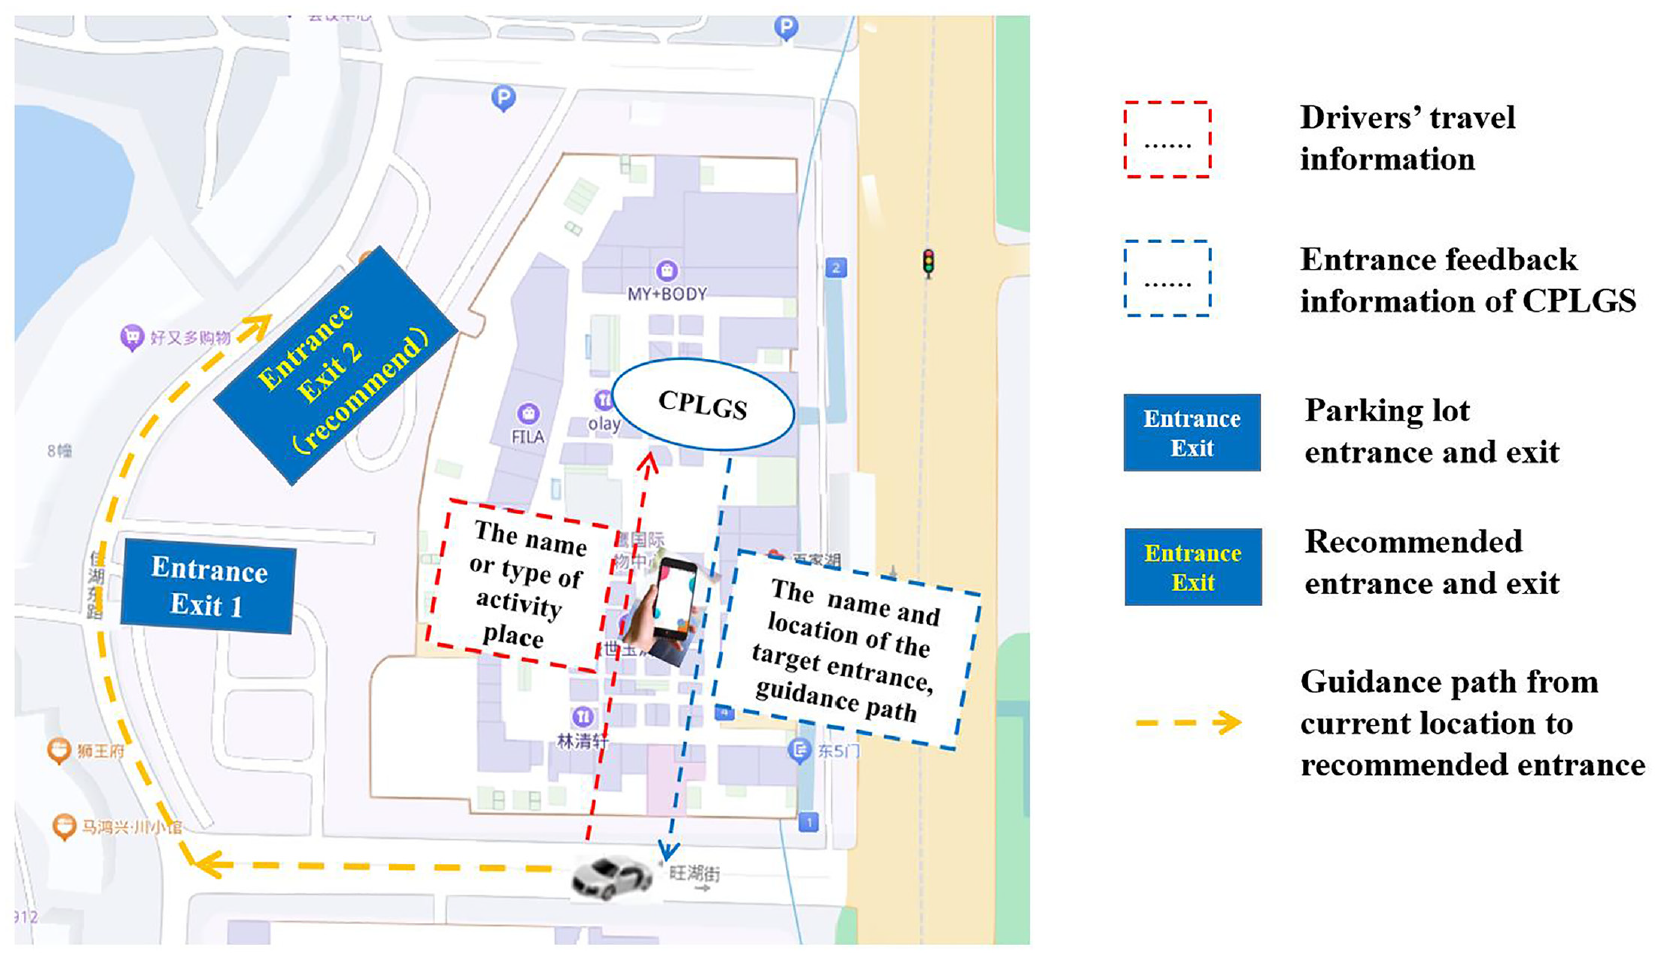
Diagram for guidance of parking lot entrance.
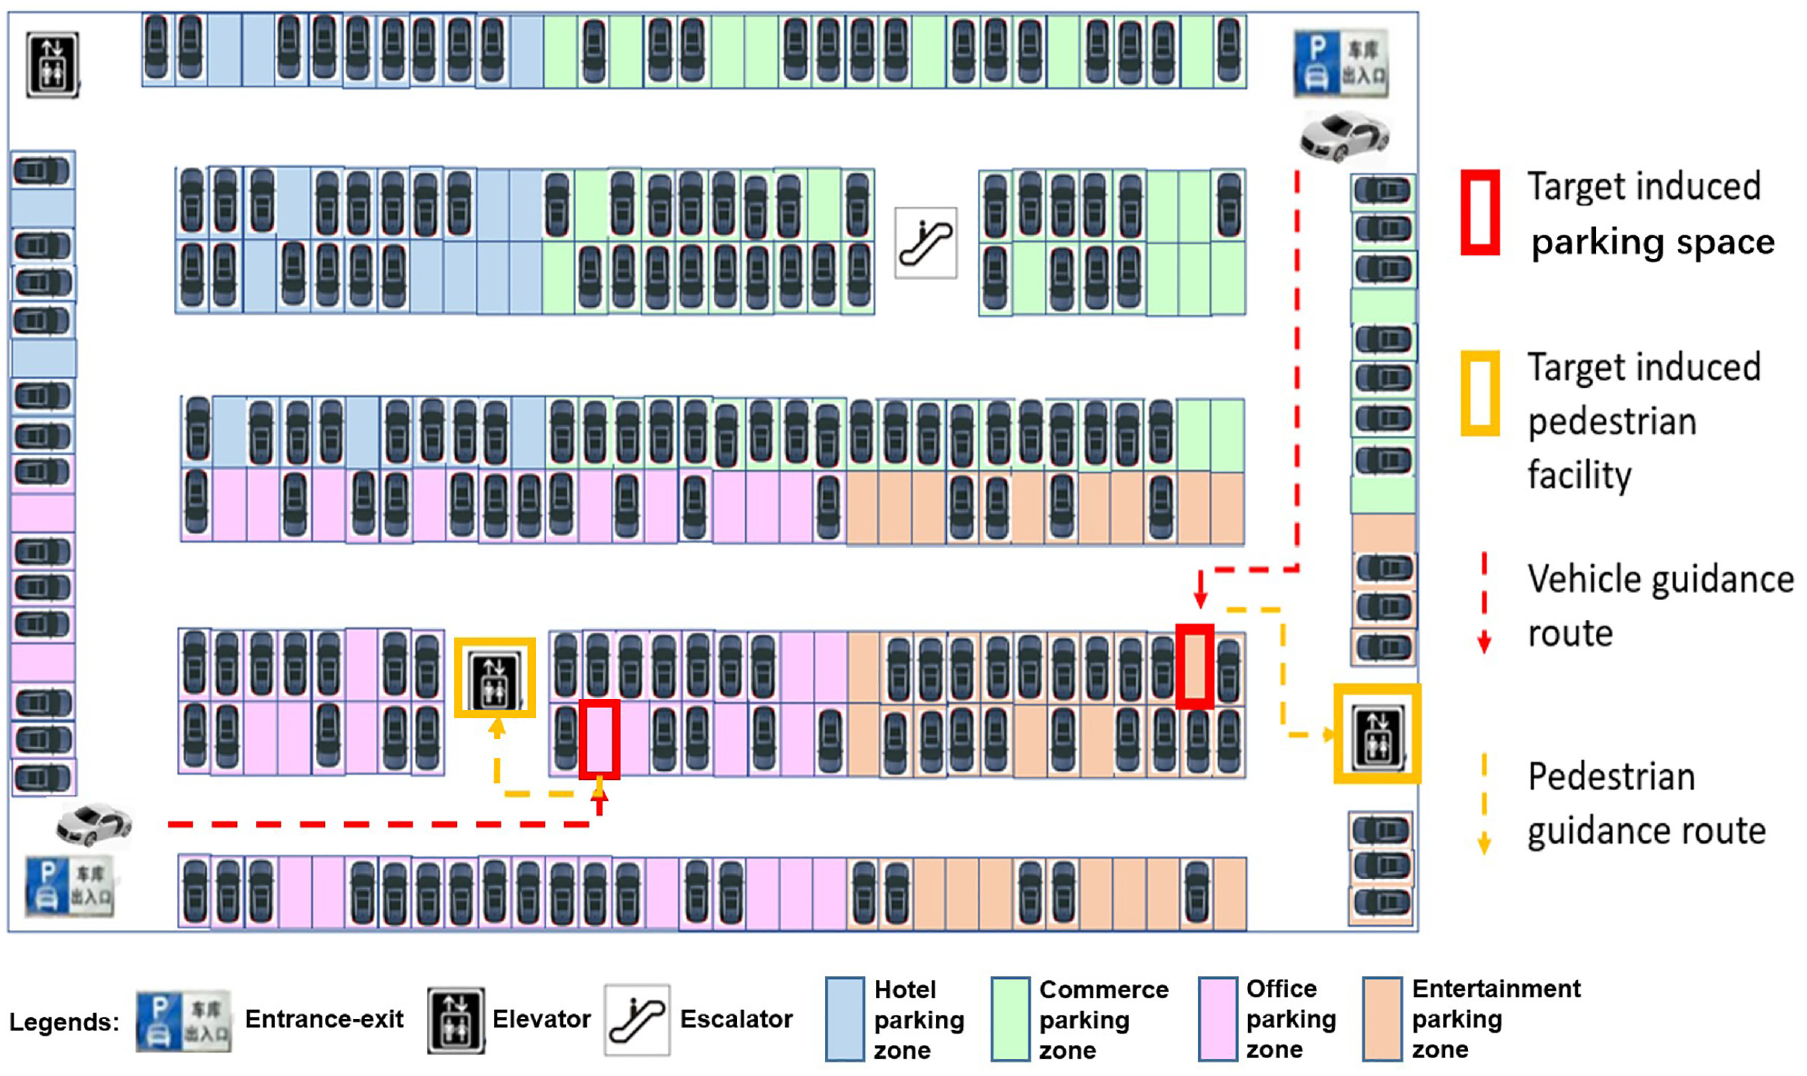
Diagram for guidance of parking space and pedestrian facility.
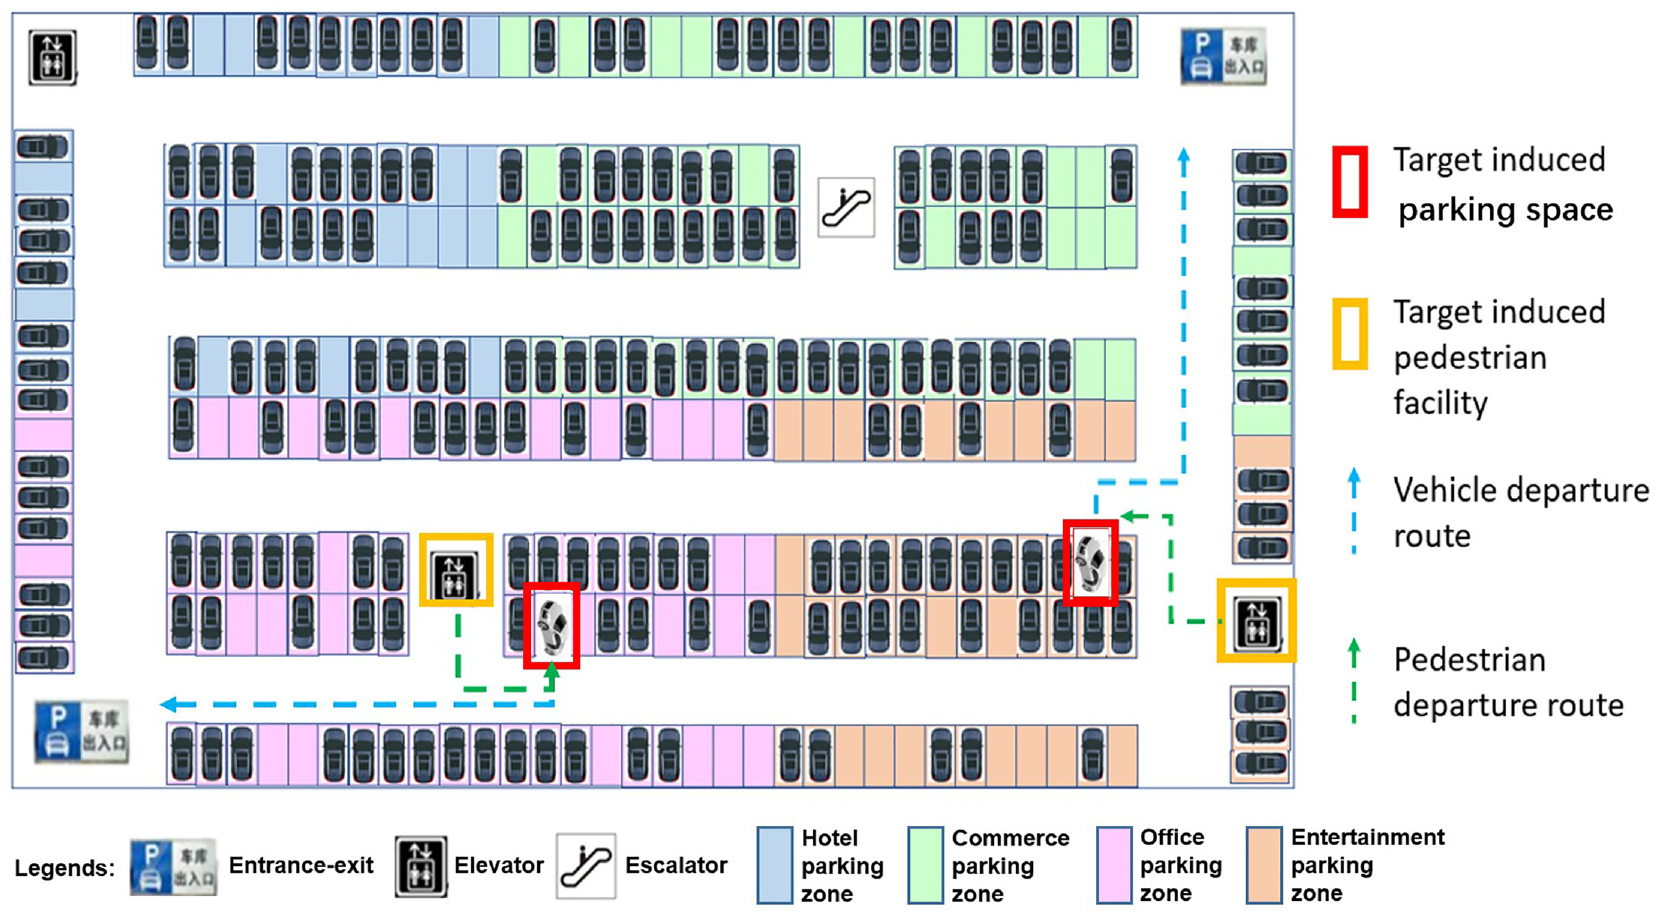
Diagram for reverse path recommendation.
Hypothesis Relationships Based on C-TAM-TPB Theory
The proposed CPLGS concept is expected to reduce drivers’ travel time and improve drivers’ spatial perception of the complex parking lot. However, to comprehend the effectiveness of such a system, it is crucial to investigate the factors affecting drivers’ BAs and intentions toward the system before its introduction into the market. As discussed before, the C-TAM-TPB model was chosen as the theoretical framework to study the drivers’ BI process. PR is an additional construct of the framework.
Figure 5 provides a complete overview of the conceptual model and the developed hypotheses. The model includes seven constructs: perceived ease of use (PEU), perceived usefulness (PU), subjective norm (SN), perceived behavioral control (PBC), perceived risk (PR), behavioral attitude (BA) and behavioral intention (BI).
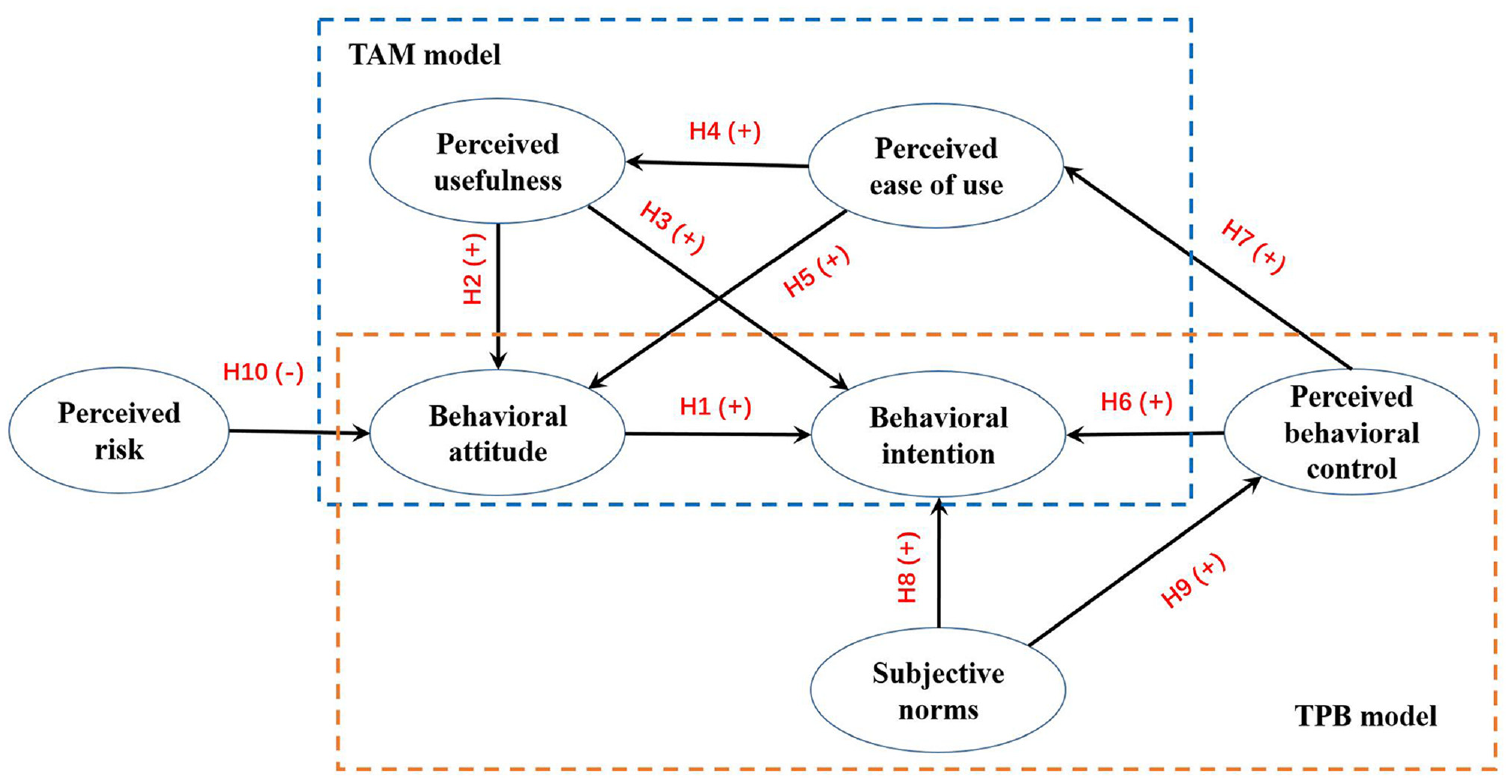
Model hypothesis structure.
As shown in Figure 5, the following research hypotheses are proposed.
BA refers to the individual’s positive or negative evaluation of new technologies or specific behaviors, and BI refers to the individual’s subjective will to perform a certain behavior ( 28 , 29 ). Since individuals usually want to perform specific behaviors according to their own attitudes, BA generally has a positive impact on BI ( 15 ). The positive effect of BA on BI has been demonstrated in the field of parking services ( 16 , 17 , 21 ).
PU refers to the perception of using a certain technology to improve personal work efficiency and work performance ( 14 ). In the context of CPLGSs, the designed usefulness of the system includes reducing drivers’ travel time, increasing drivers’ spatial perception in the parking lot, reducing environmental pollution, and so forth. Previous studies show that PU has a positive impact on BA and BI (14, 16, 17, 21, 30, 31).
PEU reflects an individual’s view on the ease of using new technologies ( 13 ), and it involves matching users’ capabilities with the skills needed to use new technologies ( 32 ). Venkatesh pointed out that although users perceive the potential benefits of using new technologies, the realization of such benefits depends on their ability to use those technologies effectively ( 33 ). Much research has proved that PEU has a positive impact on PU (16–18, 21–23, 31). Therefore, it is expected that when drivers perceive CPLGSs as easy to use, the PU of CPLGSs also increases.
In several studies, it has been proved that PEU directly affects BA, that is, the easier the technology or product is to operate and use, the more likely users are to develop a positive attitude toward its usage ( 16 , 18 , 21 ). This relationship is reflected in the hypothesis with regard to the significant positive impact of drivers’ PEU on the BA toward CPLGSs.
PBC refers to the degree to which an individual perceives the ease of executing a specific behavior, and it reflects the individual’s perception of factors that promote or hinder the execution of the behavior ( 34 , 35 ). Literature has shown that PBC has a positive effect on BI. When users feel that they have the ability, patience, knowledge, or resources to use new technologies or systems, they are more likely to adopt them. Examples of previous evidence include studies on the intention to use shared parking ( 16 , 17 ), shared bicycles ( 36 ), bus rapid transit (BRT) systems ( 35 ), and so forth. Similarly, it is expected that PBC has a positive effect on drivers’ BI with regard to CPLGSs.
Some scholars have also pointed out that PBC can have a positive effect on PEU. Examples of previous evidence include studies on the intention to use e-learning systems ( 37 ), adaptive museum guides ( 38 ), smart product-service systems in sharing economy scenarios ( 39 ), and so forth. In line with these findings, we propose a similar hypothetical relationship, suggesting that when drivers perceive that they possess the ability, patience, or convenience to use CPLGSs, they are more likely to find it easier to use CPLGSs.
An SN is the external pressures and social opinions felt by individuals when they perform certain behaviors ( 28 , 29 ). When users decide whether to perform a specific behavior, they may be influenced by suggestions from people who can affect their behavior or people who are important to them ( 17 ). Examples of previous evidence of such relationships include studies investigating bicycle use in the post-COVID-19 period ( 18 ) and use of bike sharing in tourism areas ( 36 ), shared parking use ( 16 ), and electric vehicle purchase intention ( 34 ). Comparably, we formulated a hypothesis indicating that the SN has a favorable impact on drivers’ BI toward CPLGSs.
Some scholars have established and verified that SN can also directly and positively affect PBC. For example, Shi et al. ( 40 ) and Xiao et al. ( 41 ) found that SN can positively affect PBC with reference to drivers’ fatigued driving behavior and road-crossing violations among young pedestrians. In the context of this study, it is hypothesized that when people who are important to the drivers expect them to use CPLGSs, or social networks and news publicity influence drivers to use CPLGSs, they will develop stronger PBC toward CPLGSs, which means they believe they have the ability, patience, or convenience to use CPLGSs.
In addition to PEU and PU, many scholars have added PR to assess the impact of PR on BA ( 17 , 21 , 23 ). In the field of transportation, users’ PR appeared to affect their travel behavior and transportation mode selection significantly ( 42 ), and related behavioral studies also indicate that PR negatively affects users’ BA toward some parking services ( 17 , 21 ). During the use of CPLGSs, drivers may perceive some risks, such as concerns about driving distance and potential loss of control over parking decisions. Further, if the CPLGS app cannot effectively protect users’ travel information, some sensitive user travel information (e.g., arrival and departure time, destination) could be leaked. In this study, the hypothesis that PR has a significant negative impact on BA toward CPLGSs was established.
Research Methodology and Data Collection
To test the proposed conceptual model (Figure 5), data were collected via an online questionnaire, which comprised two main parts. First, the description of CPLGSs with all the proposed functions (see the section on CPLGS design concept) was shown to respondents. Then, respondents were asked to indicate the level of their (dis)agreements with the statements designed to measure the seven constructs included in the conceptual model. The second part of the questionnaire included questions about the socio-economic and travel-related characteristics of respondents.
Measurement Instrument
The measurement instrument was developed for the seven psychological constructs included in the conceptual framework, namely BA, BI, SN, PBC, PEU, PU, and PR. Since these constructs cannot be measured directly, some observable measurement items were created. These items are listed in Table 1. The observable measurement items are derived from existing studies (also discussed in the section on hypothesis relationships based on C-TAM-TPB) and adapted to reflect the CPLGS context. In the questionnaire, respondents were thus presented with this list of statements and asked to report to what extent they agree with each survey item using a five-point Likert scale ( 16 , 21 , 23 ), including “strongly disagree,”“disagree,”“neutral,”“agree” and “strongly agree.” Some survey items were presented on a reverse scale as a strategy to alleviate the influence of a common response bias known as acquiescence ( 43 ). These “reversed” items were then re-coded for data analysis.
Latent Factors and Survey Items

Note: CPLGS = complex parking lot guidance system.* = reversed item.
Survey Administration and Sample Characteristics
An online survey platform, Wenjuanxing (www.wjx.cn), which is widely used in China for research purposes, was used to design the online survey questionnaire. The questionnaire was distributed in two waves. The first was administrated in October 2022 and the second in April 2023. The invitations containing the shared questionnaire link were sent out through the WeChat social platform using a snowball sampling method. A total of 917 questionnaires were collected. After filtering out some invalid questionnaires, such as those with low variance in answers across the various questions, as well as those with logical contradictions based on reverse questions, 810 valid questionnaires were obtained, with a recovery rate of 88.33%. To ensure that the respondents are visitors of urban complexes, a question about the frequency of visits to urban complexes was also asked, and the questionnaire data of respondents who had not visited the complex were excluded. Although CPLGS is used by drivers, the respondents without driver’s licenses were retained in the sample as they may also be car passengers or future drivers that could use the guidance system.
Table 2 reports the descriptive statistics of the sample. The proportion of male and female respondents were 48.15% and 51.85%, respectively, which is similar to the proportion distribution of complex visitors in Chinese key cities in 2020 (male 47.25%, female 52.75%) ( 44 ). The proportions of the age group of 18–40 in the sample accounted for 79.01%, which is consistent with 83.25% of complex visitors in Chinese key cities in this age range ( 44 ). With reference to occupational status, the proportion of enterprise employees, public institution employees, and civil servants is relatively high.
Descriptive Statistics of Respondents

In addition, most of the respondents have driver’s licenses, accounting for 97.78%. A large proportion of respondents reported having a driving experience of 3–5 years (31.69%) followed by those with 1–2 years and 6–10 years, accounting for 26.01% and 23.36% respectively. A question about the frequency of visits to urban complexes was also asked, revealing that a higher proportion of respondents visit the complexes 1 or 2 days per week (34.69%), followed by those who visit the complexes 2 or 3 days per month (29.63%) and 3 or 4 days per week (14.82%).
Data Analysis and Results
In this study, SEM is employed to verify the proposed hypotheses. For further details on SEM methodology, the reader is referred to the researches of Anderson and Gerbing ( 45 ) and Hassan and Abdel-Aty ( 46 ). This modeling approach generally involves two steps. First, the validity of the measurement instruments needs to be tested to verify if the items used in the questionnaire can effectively measure the theoretical constructs of the conceptual model. For this purpose, exploratory factor analysis (EFA) and confirmatory factor analysis (CFA) are conducted. Then, the structural model can be built following the predetermined hypothesis relationships. The validity of the structural model is assessed through various fitness indexes (e.g., CMIN/DF, TLI (Tucker-lewis index), CFI (Comparative fit index)), while path coefficients are used to test the strength and direction of the hypothesized relationships. Mediation and multi-group analyses are also employed to explain further the influence relationship between factors and the differences between different groups.
EFA and CFA
First, EFA is conducted to verify whether the seven constructs do exhibit distinctive features. Factor structure obtained from EFA serves as a valuable starting point for CFA, especially in cases where the research content is relatively new and not well understood, as with CPLGSs ( 47 ). All of the 29 items shown in Table 1 are used in the EFA. Before conducting the EFA, the sampling adequacy and significant correlations in the data for the factor analysis are assessed using the Kaiser Meyer-Olkin measurement (kmo = 0.92) and Bartlett sphericity test (significance level: p < 0.00), which both met the minimum requirements for EFA ( 48 , 49 ), supporting data suitability. Next, EFA is conducted using the method of principal component and varimax rotation. As expected, seven constructs are extracted. Only items with factor loads greater than 0.5 are retained, leading to the deletion of only two items with lower loads, namely PBC4 and PBC5. The rotated factor solution is shown in Table 3.
Factor Structure and Loadings in EFA
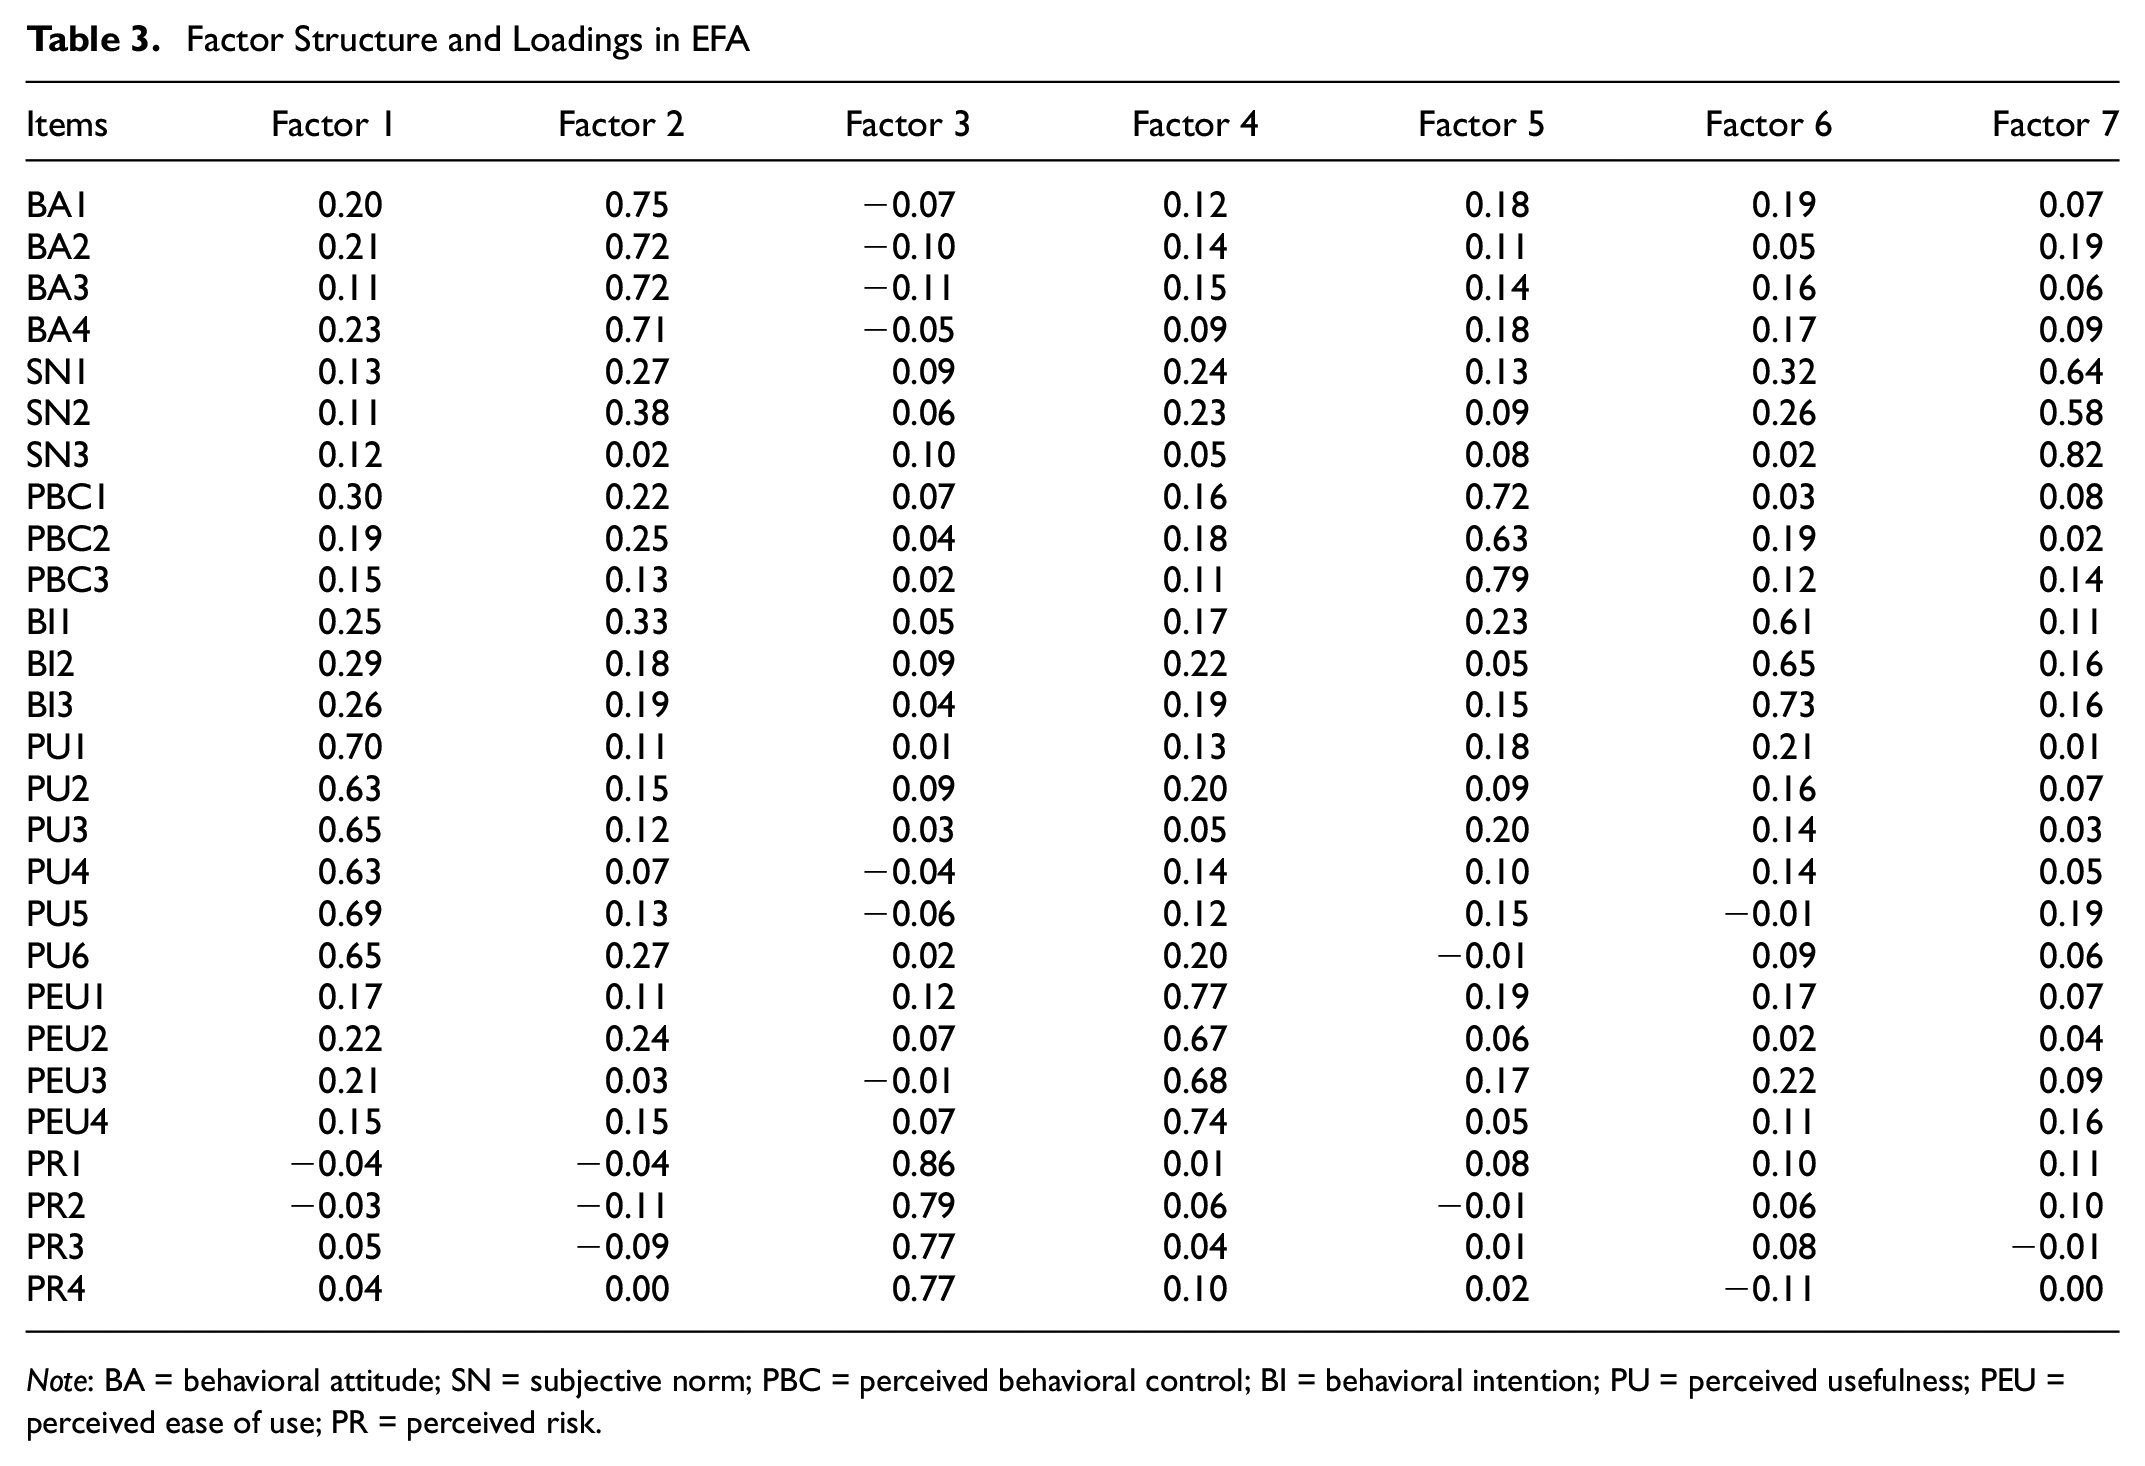
Note: BA = behavioral attitude; SN = subjective norm; PBC = perceived behavioral control; BI = behavioral intention; PU = perceived usefulness; PEU = perceived ease of use; PR = perceived risk.
Descriptive statistics of raw scores for measured items are reported in Table 4. The average score provided by respondents consistently is above the midpoint of the scale, indicating a positive inclination toward agreement with the statements. Next, the internal consistency is tested in SPSS (Statistical Package for Social Sciences) using Cronbach’s alpha ( 50 ). Table 4 shows that Cronbach’s alpha values of the extracted constructs are greater than 0.70, except for SN where the Cronbach’s alpha is slightly below, at 0.69, close to the acceptable threshold of 0.7 ( 50 – 52 ).
The Descriptive Statistics and Measurement Index
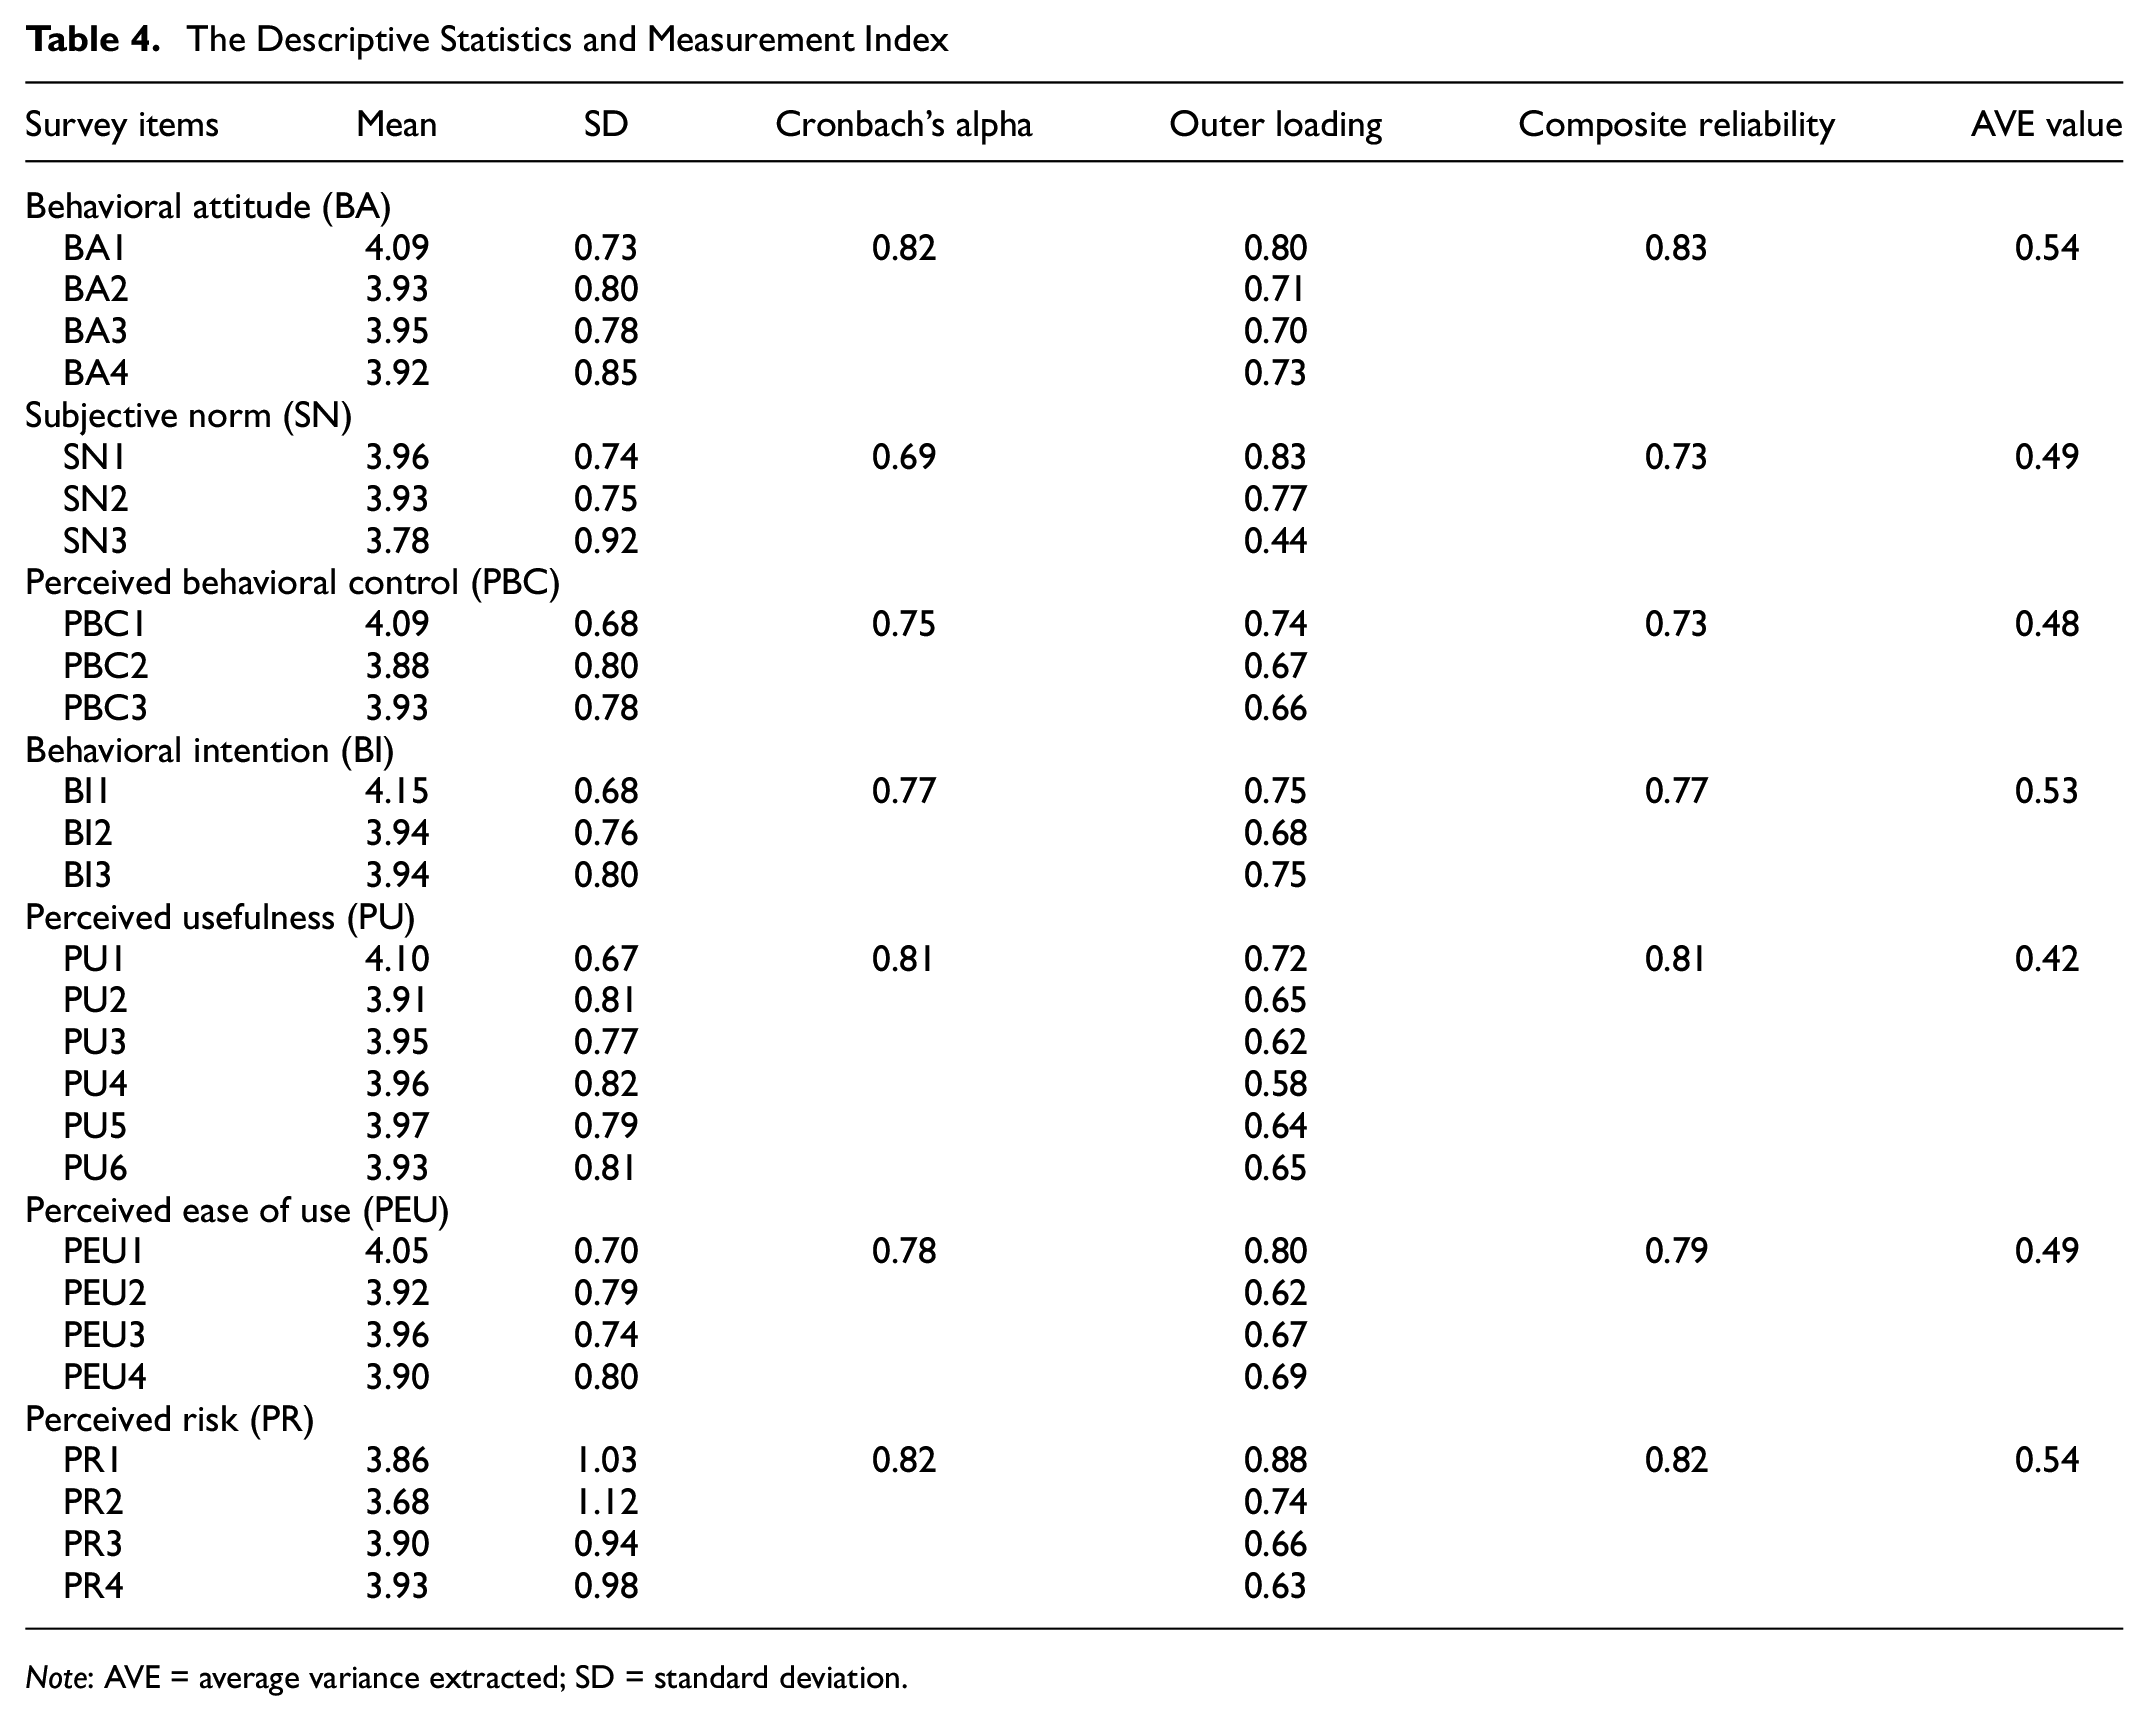
Note: AVE = average variance extracted; SD = standard deviation.
Then, CFA is performed to assess the validity of the items used to measure the identified latent constructs. Specifically, both convergent validity and discriminant validity are tested. Convergent validity assesses the degree of correlation between items belonging to the same underlying latent construct. Composite reliability (CR) and average variance extracted (AVE) are the measurement index. It is recommended that CR and AVE are greater than 0.7 and 0.4 respectively ( 52 , 53 ). As shown in Table 4, the above requirements are met.
The discriminant validity, reflecting the extent to which the factors differ from one another, is also assessed and considered as acceptable according to the Fornell-Larcker criterion shown in Table 5. The square root of each construct’s AVE is greater than the bivariate correlations with any other factors ( 54 ).
Discriminant Validity Test
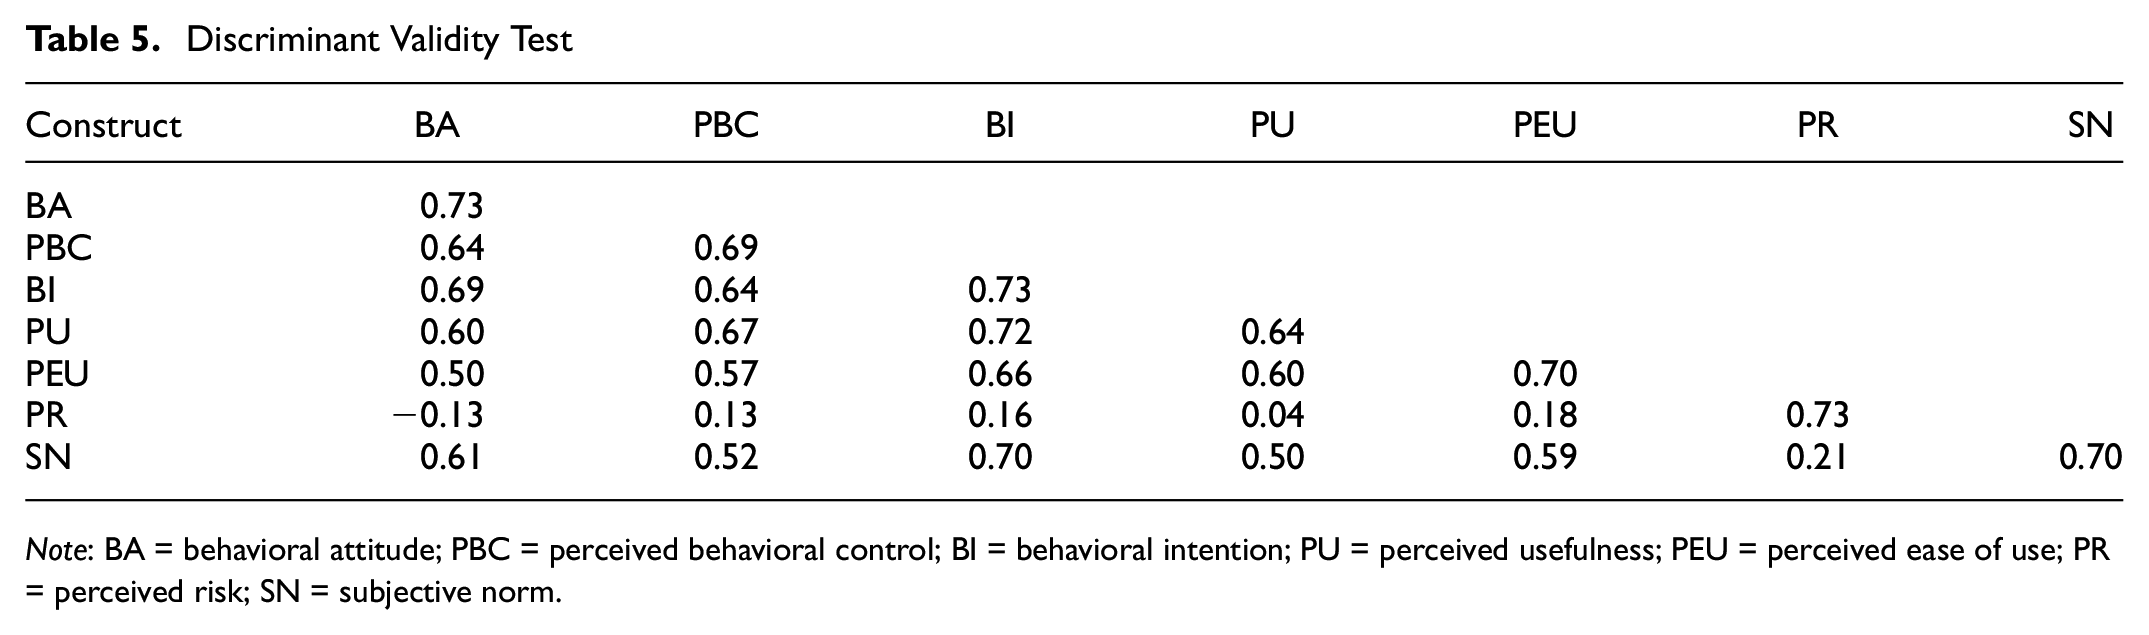
Note: BA = behavioral attitude; PBC = perceived behavioral control; BI = behavioral intention; PU = perceived usefulness; PEU = perceived ease of use; PR = perceived risk; SN = subjective norm.
Structural Equation Model
To test the proposed hypotheses 1–10, a structural equation model is built using AMOS (Analysis of Moment Structures) software, as shown in Figure 6. Before calibrating the structural model, multicollinearity among various independent variables is examined in two subparts of the model and specifically for: BA, PU, SN, and PBC in predicting BI; and PU, PEU, and PR in predicting BA. Multicollinearity problems, which affect parameter estimation, may in fact occur when the endogenous construct is predicted by multiple exogenous constructs in the research model ( 17 ). The variance inflation factor (VIF) of the exogenous constructs in the two subparts of the model is calculated. The value of VIF less than 5 denotes the absence of a multicollinearity problem ( 55 ). Results showed that the VIF values of the two subparts respectively range from 1.34 to 1.62 and 1.02 to 1.36, indicating that there is no multicollinearity problem in the structural model. The obtained model’s goodness-of-fits indexes indicate a good overall fit to the data when compared with acceptable values ( 17 , 21 , 23 ), as shown in Table 6.

Structural equation model results (standardized estimates).
Fitting Indexes

Note: TLI = Tucker-lewis index; CFI = Comparative fit index; AGFI = Adjusted goodness of fit index; IFI = Incremental fit index; RMSEA = Root-mean-square error of approximation; PGFI = Parsimonious goodness-fit-index; PNFI = Parsimonious normed fit index.
The estimation results of the final structural equation model are shown in Figure 6 and Table 7. The p-values of hypotheses 1–8 and 10 are smaller than 0.01, while the p-value of hypothesis 9 is smaller than 0.05. It is therefore concluded that the proposed hypotheses are all supported. Explicitly, the results show a positive effect of BA, SN, PU, PBC on BI, with PU (β = 0.37) and SN (β = 0.32) having higher effects on BI compared with BA (β = 0.22) and PBC (β = 0.17). Furthermore, PU and PEU are shown to affect BA positively, as hypothesized. In particular, the estimated coefficients show that the effect of PEU (β = 0.40) on BA is stronger than that of PU (β = 0.32). The results also show that PR (β = −0.20) has a negative impact on BA, in line with our expectations. The estimated coefficients further indicate that PU is significantly affected by PEU (β = 0.69), which in turn is significantly affected by PBC (β = 0.77), and PBC is significantly influenced by SN (β = 0.63). These findings provide support for the formulated hypotheses.
Results of Hypothesized Model Testing
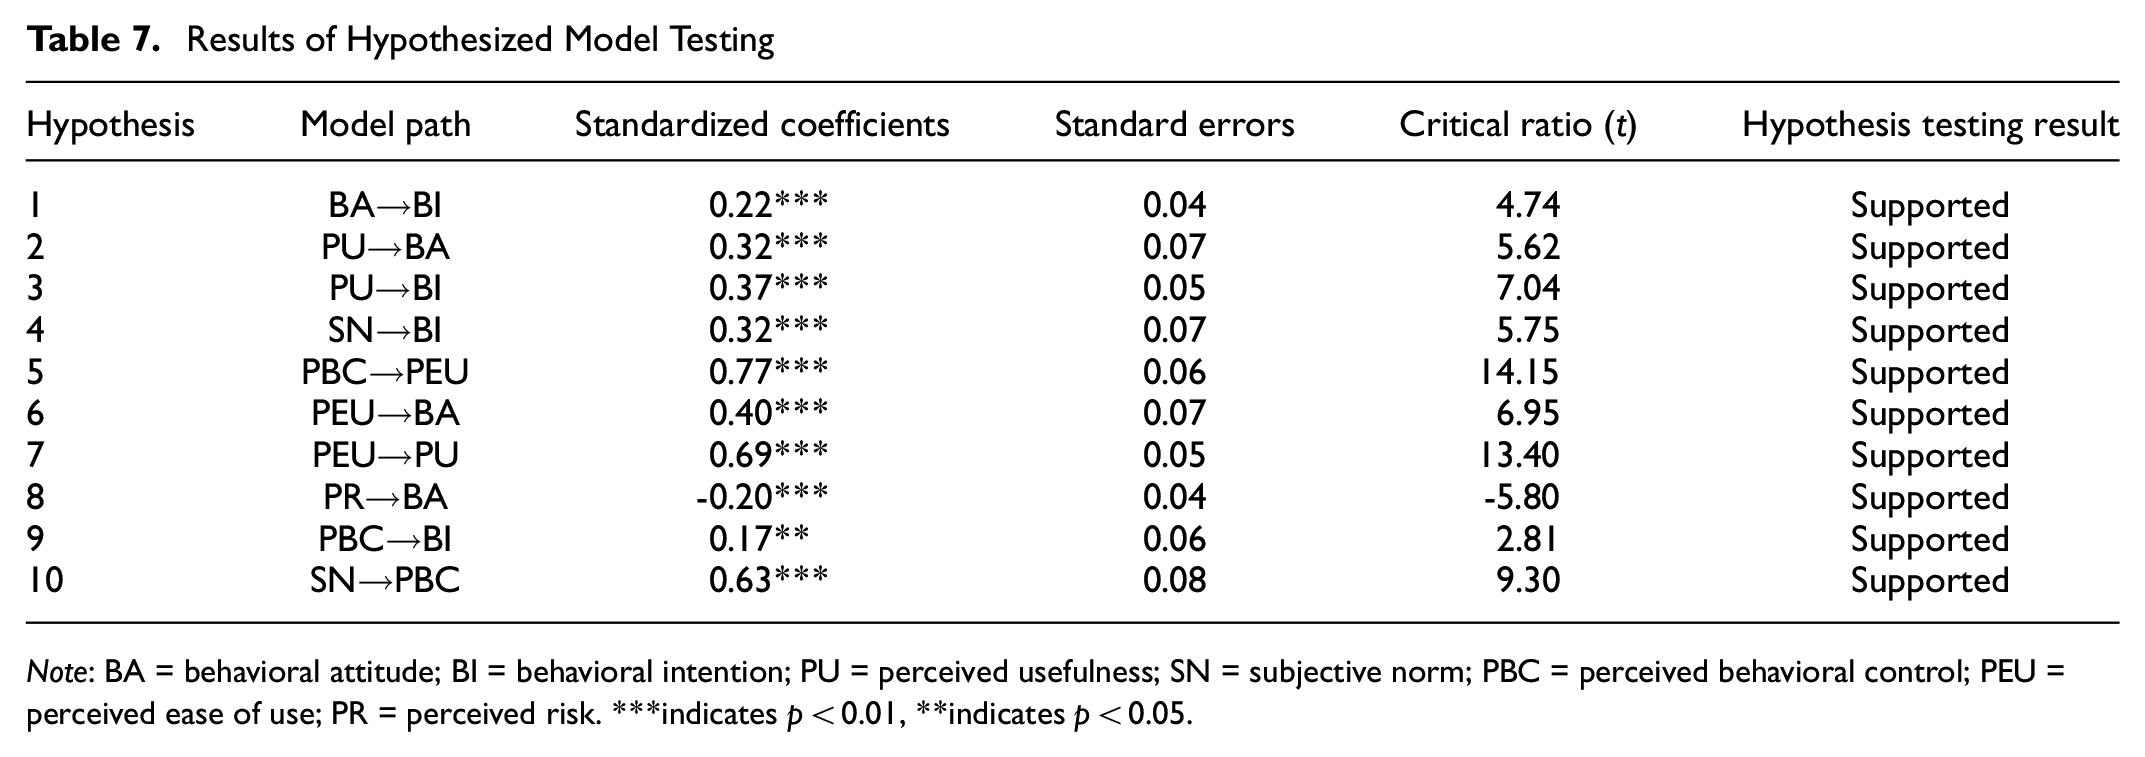
Note: BA = behavioral attitude; BI = behavioral intention; PU = perceived usefulness; SN = subjective norm; PBC = perceived behavioral control; PEU = perceived ease of use; PR = perceived risk. ***indicates p < 0.01, **indicates p < 0.05.
To analyze whether there are factors that play mediating roles in the constructed influence relationships, a mediation analysis by the means of bootstrapping is carried out ( 56 , 57 ). When the interval value between the lower and upper values of bias-corrected 95% confidence intervals (CI) does not contain 0, there is a significant influence relationship in the path ( 58 , 59 ). There are three sets of relationship paths with mediating effects in the model, namely “PEU→PU→BA,”“PU→BA→BI,” and “SN→PBC→BI.” As shown in Table 8 , the three hypothetical paths all pass the test. Specifically, PEU can indirectly affect BA through PU, with influence coefficients equal to 0.22. PU can indirectly affect BI through BA, with influence coefficients equal to 0.07. SN can indirectly affect BI through PBC, with influence coefficients of 0.11. These estimations indicate that PU, BA, and PBC can respectively serve as bridges connecting PEU and BA, PU and BI, and SN and BI.
Test of Mediation by Bootstrapping Approach

Note: PEU = perceived ease of use; PU = perceived usefulness; BA = behavioral attitude; BI = behavioral intention; SN = subjective norm; PBC = perceived behavioral control.
Multi-Group Analysis
Multi-group analysis (MGA) is also conducted because it allows analysis of potential differences among various groups ( 60 , 61 ). Steps of MGA include: 1) grouping the overall sample according to the research purpose and sample characteristics; 2) analyzing whether the factor loadings in the measurement model are equivalent in different groups, and if they are equivalent, proceeding to the next step, and if not, then MGA cannot be conducted; 3) comparing the significance of the difference in χ2/df between the unconstrained structural model and constrained structural model, to determine whether there are differences in hypothetical paths between different groups; 4) based on the critical ratios of differences (CRD) test, analyzing which specific hypothetical path differs between different groups ( 60 , 62 ).
“Age” and “visiting frequency” are used as grouping criteria in this paper. Age is widely employed in previous studies as a grouping criterion to examine behavioral differences among distinct groups. These studies are diverse and span a wide array of fields and applications. For instance, this approach has been employed in studies exploring usage intentions with regard to the combined use of bicycle and public transportation ( 63 ), as well as in studies investigating residents’ low-carbon behaviors ( 64 ). In addition, we assume that the significance of certain relationships among the seven constructs may differ among drivers with different visiting frequencies to urban complexes. The defined grouping categories are shown in Table 9. Referring to the research of Wang et al. ( 64 ), the age of 40 is used as the interval for grouping, and respondents were divided into two groups: respondents aged 40 or under and respondents aged over 40. In relation to visiting frequency, the overall respondents are divided into low and high frequency visitors. The low frequency group includes respondents who reported traveling to a complex a few days per month, while the second group contains those who reported traveling to complexes at least once per week.
Grouping Categories of Multiple Groups

First, the measurement invariances of the two types of multi-group measurement models are tested and the results indicate that both models are invariant at the metric level (p = 0.09 > 0.05; p = 0.40 > 0.05) ( 60 , 61 ). The results suggest that the factor loadings in the measurement model are equivalent across the age ≤ 40 and age > 40 groups and the low and high visiting frequency groups.
Second, the unconstrained structural model, which allowed the structural paths to vary across age and travel frequency status, is compared with the constrained structural model, which constrains equal factor loadings, covariance, weights, and residuals for the age ≤ 40 and age > 40 groups and the low and high frequency travel groups ( 61 , 65 ). For the grouping index “age”, the results show that the unconstrained model (χ2 = 1,221.87, df = 628) and constrained model (χ2 = 1,325.55, df = 692) have significant differences (p < 0.05). Similarly, for the grouping index “visiting frequency,” the results shows that the unconstrained model (χ2 = 1,238.64, df = 628) and constrained model (χ2 = 1,364.71, df = 692) have significant differences (p < 0.05). Therefore, it is concluded that there are significant differences of influence coefficients in some hypothetical paths between different groups.
To examine in which paths the differences lay, the CRD test is used ( 60 , 61 , 66 ). If the absolute value of the CRD of a path is greater than 1.96 (significance level is 0.05), it indicates that there is a significant difference between the two groups in that specific relationship ( 67 ). Table 10 shows the CRD values and path coefficients for different groups and visiting frequency. For the MGA based on age, the hypothetical path SN→BI is significantly different across the age ≤ 40 group and the age > 40 group (CRD = −2.35). In particular, the path coefficient of age ≤ 40 (0.39) is greater than that of age > 40 (0.02), indicating that the use intention of the younger age group is more positively influenced by suggestions from the people who can affect their behavior or people who are important to them or social networks and news publicity. This result is consistent with the conclusions of Zhou ( 68 ) and Hao ( 69 ), who point out that the younger age group is more susceptible to subjective norms. For the MGA based on visiting frequency, there are two hypothetical paths with CRD larger than 1.96. Specifically, the CRD value for the path BA→BI equals −2.53, and the one for PEU→BA equals −2.69. These values indicate that BA has a stronger influence on BI among people with a higher visiting frequency. Also, for this group, PEU has a strong influence on BA. As shown in Table 10, with the exception of the paths we have discussed, the majority of the paths exhibit CDR values below the threshold of 1.96. This suggests that there is no statistically significant difference among the identified groups for the defined hypothetical paths.
Comparison of Differences among Multiple Groups

Note: BA = behavioral attitude; BI = behavioral intention; PU = perceived usefulness; SN = subjective norm; PBC = perceived behavioral control; PEU = perceived ease of use; PR = perceived risk. *p < 0.1. **p < 0.05. ***p < 0.01.
Conclusion
Interpretation of Results and Implications
The present study utilized a structural equation model on the theoretical foundation of C-TAM-TPB to assess drivers’ BIs to use CPLGSs. In addition to the theoretical constructs from TAM and TPB, PR is incorporated into the conceptual framework to explore if it has an impact on driver’s attitude toward CPLGSs. Specifically, model estimates confirm that the developed theoretical model explains drivers’ acceptance of CPLGSs well.
In particular, findings reveal that the factors that directly affect drivers’ BIs to use CPLGSs include BA, PU, SNs, and PBC. It was found that PU and SNs represent stronger predictors of use intention compared with BA and PBC. Furthermore, the model structure indicates that BA plays a central role in linking various factors and generating a series of influence relationships. For example, BA is an important mediating factor connecting BI with PU.
PU plays a crucial role in shaping drivers’ BAs and BIs toward the use of CPLGSs. When drivers perceive CPLGSs as useful across various aspects, they are more likely to develop a positive attitude and usage intention toward CPLGSs. In this study, six aspects are used to represent the PU of CPLGSs, which are: 1) preventing drivers from getting lost in the parking lot; 2) enhancing the overall organization and efficiency of the parking process, leading to a more orderly parking experience; 3) assisting drivers in quickly finding the nearest parking space to their destination; 4) reducing vehicles cruising, thus minimizing pollution inside the parking lot; 5) facilitating easy retrieval and departure routes for vehicles after completing activities; and 6) improving drivers’ overall travel efficiency inside the parking lot. To improve drivers’ favorable attitude and intention toward CPLGSs, it is necessary to ensure that these six aspects are incorporated into the functional design of the system. Moreover, highlighting these aspects in marketing promotion campaigns can further emphasize the benefits and value proposition of using CPLGSs.
SN also plays a significant role in influencing drivers’ BIs, both directly and indirectly. This means that when most people who are important to drivers or whose opinions are valued and respected by drivers expect drivers to use a CPLGS, it is more likely to generate a positive intention toward its use. In addition, the promotion of social networks and news publicity can positively influence drivers’ inclination to use CPLGSs. This implies that dissemination of information through these channels can raise awareness and highlight the benefits of a CPLGS, thereby further encourage drivers to adopt the system. Specifically, according to MGA, drivers aged 40 or under are more likely to be influenced by subjective norms to use CPLGSs. Consequently, more promotional resources should be targeted toward this particular age group.
Findings reveal that PEU directly affects BA, especially for drivers who visit urban complexes once or more per week. When drivers perceive that it is easy to understand the information and service provided by a CPLGS, and find it is easy to operate and interact with a CPLGS through the app, they are more likely to have a positive attitude to use it. This represents valuable information for the design of the interactive interface of the system app. Explicitly, to improve drivers’ use attitude, the information provided by CPLGSs should be clearly displayed and explained in a user-friendly graphical interface, and the user operation process should be simplified. Lastly, PEU was found to exert a significant and positive direct influence on PU.
PBC, which is an important component in TPB theory, positively and directly affects drivers’ use intentions for CPLGSs. When drivers perceive that they possess the necessary ability, patience, and convenience to utilize a CPLGS, they are more inclined to adopt it. PBC has been found to affect PEU positively and directly. In other words, when drivers perceive they possess the required skills, patience, and convenience to use a CPLGS, they also perceive it as easier to use. Further, SN has been proved to affect PBC directly and positively. If most people who are important to drivers or whose opinions are valued and respected by drivers expect them to use a CPLGS, or if social networks and news publicity advocate its usage, drivers are more likely to feel capable of using a CPLGS, exhibit patience in using the system, and find it user-friendly.
PR was added to the model. As expected, this construct has a direct negative impact on BA. This implies that when drivers perceive potential risks associated with using a CPLGS, such as the potential loss of control over parking decisions and the consequences that may result from relying on a CPLGS, they are more likely to show a negative attitude toward CPLGSs. Therefore, these risks should be addressed when developing CPLGSs. To alleviate drivers’ concerns about driving distance and potential loss of control over parking decisions, a marketing campaign of a CPLGS should be implemented through the app or other mass media. In doing this, particular emphasis should be placed on highlighting how the recommendation of suitable parking spaces and the route guidance are designed to reduce both driving and walking time significantly, thus emphasizing the benefits of the system. Moreover, addressing drivers’ concerns about the uncertain allocation of parking spaces is essential. In situations where the parking spaces in the optimal parking zone are fully occupied, CPLGSs should be designed to search for parking spaces in adjacent and suboptimal parking zones. Furthermore, CPLGSs should prioritize protecting users’ sensitive information, such as travel destination, arrival and departure time, and other travel-related details. To address drivers’ concerns about data privacy and to improve transparency, we recommend the inclusion of specific statements on the CPLGS app interface. These statements will seek users’ consent for sharing their location information, and possibly their activity purpose, to provide tailored guidance services. Users will be assured that a CPLGS strictly complies with data privacy regulations. The following is recommended to be included.
1) Location information sharing: this offers users the choice to decide whether they are willing to share their location information and to select the level of access permissions that best suit their preferences (e.g., one-time use inquiry, permission only during active usage, continuous access, or opting out). Either “permitted while using” or “always allowed” access permissions is necessary for the use of CPLGS parking guidance service.
2) Travel information contribution: users are informed that providing specific travel information, such as their destination category or name, is crucial for optimizing their entire travel experience, from origin to parking to activity and back. Without this information, users may choose to navigate parking independently, which could potentially lead to longer travel times for both driving and walking phases. The users can be assured that the shared information is solely utilized for the parking guidance service and, as such, is optimizing parking efficiency.
Through these efforts, we believe it would be possible to foster user trust, reduce concerns about data privacy, and encourage active participation in sharing travel information. By doing so, CPLGSs can deliver a high level of service quality in the realm of parking guidance while respecting users’ data privacy preferences. In this way, it would be possible to enhance trust and instill confidence among drivers, encouraging them to use the system.
On the whole, matching the PU of CPLGSs (e.g., preventing drivers from getting lost; enhancing the overall parking organization and travel efficiency inside the parking lot; assisting drivers in quickly finding the nearest parking space to their destination; reducing vehicles cruising, thus minimizing pollution; facilitating easy retrieval and departure routes), simplifying the operation and presentation of information and services, strengthening the promotion of CPLGSs through social networks and news publicity, and addressing PRs (e.g., drivers’ doubts about driving distance; potential loss of control over parking decision;, privacy of travel information) can contribute to improving drivers’ attitudes to and use intention for CPLGSs. These theoretical implications can also provide guidance for improving other parking guidance systems.
Limitations and Future Research
This study contains several limitations. The current framework can be enhanced by incorporating other potential factors such as users’ perceived trust ( 17 , 47 ), interest in technology ( 36 ), and users’ personality characteristics (e.g., big five personality).
This research was conducted before the launch of CPLGSs into the market. It would be interesting to extend the study to the actual use behavior of CPLGSs once such a service appears in the market, and similar studies could also be conducted to enable comparative analysis of the degree of change in impact factors and influential relationships. In addition, external variables can affect usage behavior as mediated by the belief and attitude constructs ( 70 ). The exploration and analysis of external variables can help to design and formulate effective intervention measures, thereby improving user acceptance and usage behavior ( 71 , 72 ). An interesting research for our future studies would be to examine the influence of external variables on salient beliefs (e.g., PEU, PU). In future studies, it may also be worthwhile to explore the underlying determinants of attitudes, subjective norms, and PBC. This could provide a better understanding of the relationship between beliefs and their evaluations in shaping individuals’ perceptions in the context of CPLGSs. To do so, additional data need to be collected. Finally, to better understand drivers’ preferences toward various aspects of CPLGSs, a stated choice experiment could be conducted.
Footnotes
Author Contributions
The authors confirm contribution to the paper as follows: study conception and design: G. Yang, V. Caiati, S. Rasouli, J. Chen; data collection: G. Yang; analysis and interpretation of results: G. Yang, V. Caiati, S. Rasouli, J. Chen; draft manuscript preparation: G. Yang, V. Caiati. All authors reviewed the results and approved the final version of the manuscript.
Declaration of Conflicting Interests
The authors declared no potential conflicts of interest with respect to the research, authorship, and/or publication of this article.
Funding
The authors disclosed receipt of the following financial support for the research, authorship, and/or publication of this article: This research is supported by National Natural Science Foundation of China (52302388) and the Natural Science Foundation of Jiangsu Province (BK20230853).