



Abstract
With the introduction of traffic speed deflection devices (TSDD), collecting network-level surface deflection data becomes more efficient and convenient. State highway agencies (SHAs) are paying more attention to the incorporation of structural information into pavement management systems to support maintenance and rehabilitation (M&R) analysis. For those SHAs who conduct M&R analysis based solely on surface condition data, it is crucial to understand how the inclusion of structural condition data may affect the performance model, which structural indices may be well-suited for their needs, and where these indices may be placed in their current flowchart of M&R analysis. To address these issues, in this study, the effects of eight structural indices obtained from TSDD on surface condition deterioration were investigated using TSDD data and surface condition data collected in Tennessee. The effects of structural indices on surface deterioration were evaluated using multiple regression, classification and regression tree analysis, and 1-year deterioration curve analysis. Surface curvature index, SCI_12, was found to be a significant factor influencing surface deteriorations. Structural indices representing condition of base layers and subgrade were less sensitive to the surface deterioration. To facilitate implementation, a flowchart of how to incorporate structural indices into M&R analysis procedure was proposed.
Keywords
Pavement surface deflection is a critical data element in pavement management systems (PMS) to evaluate the structural condition of pavements and then determine the needs for structural improvement. Falling weight deflectometer (FWD) is usually used to gather such data for evaluating pavement structural capacity. The deflection basin is used to determine the pavement structural parameters for use in both empirical ( 1 ) and mechanistic-empirical pavement design guides ( 2 ). However, because of its low data-collection efficiency and high traffic-control expense, FWD is often used for pavement survey at project level. Although some agencies perform FWD tests at network level, the collection frequencies are lower than for surface data collection ( 3 ). Since there is usually a gap of structural capacity information in PMS, the results of network-level maintenance and rehabilitation (M&R) analysis are generally based on surface condition data and may not be able to identify the projects that need structural improvement in a timely and accurate way.
To fill the data gap in PMS, in recent years, more state highway agencies (SHAs) are paying attention to traffic speed deflection devices (TSDD), which can collect surface deflection data at traffic speeds without lane closures. Federal Highway Administration (FHWA) conducted a project of TSDD to assess the feasibility and demonstrate the use of TSDD for network-level pavement structural evaluation ( 4 ). Based on the findings and results from the demonstration, in 2019, a Transportation Pooled Fund study, TPF-5(385) ‘‘Pavement Structural Evaluation with Traffic Speed Deflection Devices” focusing on collecting and analyzing TSDD data was initiated with 26 participating SHAs ( 5 ).
One of the topics on TSDD is how to incorporate TSDD data into PMS for decision-making ( 5 ). As structural measures were originally developed based on the deflection curves from FWD, the feasibility of using these measures calculated from TSDD deflection basin were first investigated. Surface curvature index (SCI) and deflection slope index (DSI) are widely used by pavement engineers to evaluate structural condition. SCI is defined as the difference in deflections between the loading center and a point 8 in. or 12 in. from the loading center. DSI, on the other hand, is the difference in deflections between any two points within the deflection basin, typically measured at 8, 12, 24, or 36 in. from the loading center. SCI is primarily associated with the structural condition of surface layer, while DSI is indicative of base or subbase structural condition, depending on the thickness and types of these layers. Katicha et al. systematically investigated SCI and DSI and found similar conclusions are drawn with either index. They also found that TSDD-based subgrade resilient modulus (MR) was not well correlated to the FWD-based MR. As a result, TSDD-based subgrade strength is not recommended in PMS ( 6 ). Nasimifar et al. ( 7 ) evaluated 67 deflection basin indices and found that deflection slope indices DSI200_300 (D200-D300) and DSI300_900 (D300-D900) were well related with indices with fatigue and rutting strains, respectively. By comparing TSDD and FWD, Shrestha et al. ( 8 ) found that the distribution of effective structural number (SNeff) from two devices was similar and had very little difference identifying structurally weak section between using SNeff and SCI300. Huang et al. ( 9 ) recommended using D0, SCI_12 and D24 to evaluate the strength of the entire pavement, asphalt concrete (AC) layer, and subgrade, respectively.
Based on Virginia Department of Transportation’s method, Katicha et al. ( 5 ) proposed a two-step method to incorporate TSDD data into PMS, including 1) determination of preliminary treatment category selected based solely on the surface condition; and 2) adjustment of treatment category by further considering the structural condition. To incorporate structural condition indices into decision trees for project recommendations, it is crucial to understand the relationships between TSDD-based structural indices and surface distresses. Unfortunately, it is difficult to establish direct relationships between structural indices and surface distresses. Although some of these structural indices are mechanically related to the pavement responses, it is difficult to build direct relationship between these indices and individual surface distresses that are associated with these pavement responses.
Structural condition indices and surface condition indices interact with each other to some extent. Figure 1 illustrates the change of deterioration curves after each resurfacing event. As can be seen, if the structural distresses are not well addressed in each resurfacing event, the evolution of distresses inside pavement could result in faster deterioration of surface performance and shorter service lives. Therefore, structural condition could potentially affect the deterioration of surface condition. To incorporate TSDD-based indices into PMS, understanding how structural indices affect surface deterioration and their relationships are crucial. The structure and trigger values in the decision trees could also be determined based on these relationships. By investigating the relationship between structural condition indices and agency-defined surface condition index, the structural indices that may be more suitable for an agency’s PMS can be identified. Meanwhile, the structural indices and surface condition indices should be used in a complementary manner such that a complete picture of pavement condition can be captured from these indices.
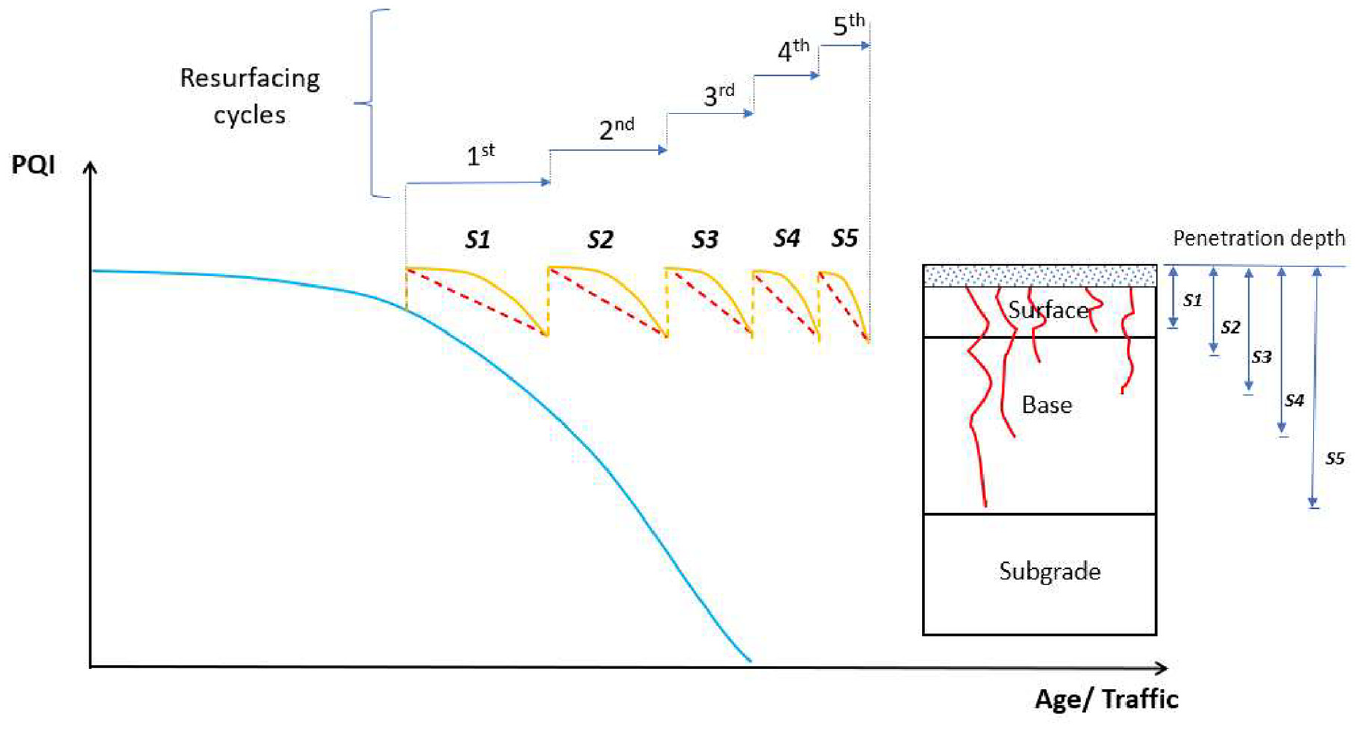
Change of deterioration curves after each resurfacing event.
In a previous study, the author found that performance indices initially decreased with the increase of TSDD-based indices and became stable thereafter with TSDD-based indices greater than a certain threshold ( 10 ). However, there might be some exceptions. For example, a newly resurfaced segment on a weak base or subgrade may have the same surface condition index as that on a strong base or subgrade. Because of different supporting conditions, under the same traffic level, segments with stronger supporting layers would deteriorate slower than those with weaker supporting layers.
To address this issue, in this study, the effect of TSDD-based structural indices on the deterioration of surface condition was investigated. The deterioration rates of surface condition determine the shapes of performance curves which are used for performance predictions and cost-benefit analyses. Structural improvement is needed for pavement segments with higher deterioration rate of surface condition than those with lower deterioration rate even if they have the same surface condition ratings. The example provided in this study could be used by SHAs to evaluate the effect of TSDD-based indices on their surface deterioration indices or models and then incorporate these structural indices into PMS.
Objective and Scope
The objectives of this study were to 1) identify the TSDD-based structural indices that significantly influence the decline in surface condition, and 2) evaluate the effects of TSDD-based indices on surface deterioration rates. TSDD data was collected between 2019 and 2021. Pavement condition data which included different types of surface cracks, rutting, and roughness were collected within the same period. Pavement structural information and traffic information were also investigated in this study.
Data Preparation
Deflection Data Collection
Deflection data in this study were collected using TSDD developed by Greenwood Engineering. The data were collected between 2019 and 2021 via Transportation Pooled Fund study, TPF 5-(385) “Pavement Structural Evaluation with Traffic Speed Deflection Devices” ( 5 ). Figure 2 shows a map of routes where TSDD data were collected in the State of Tennessee. Over 900 mi of roadway segment data were collected by the TPF study, including flexible pavements and composite pavements. In this study, only flexible pavements were investigated.
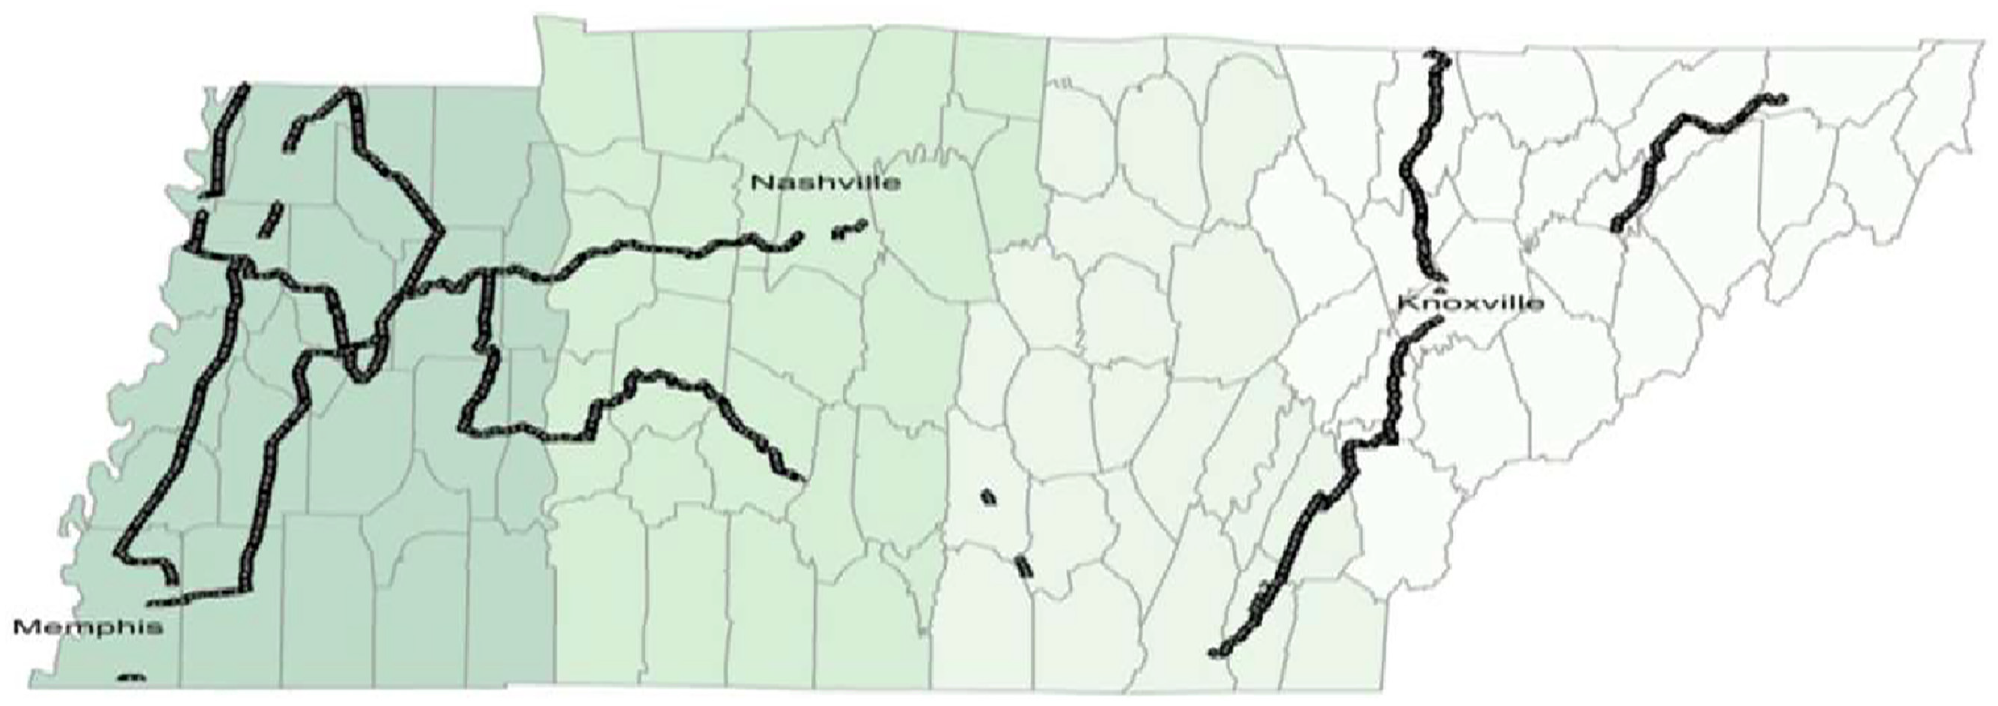
Map of routes with traffic speed deflectometer ( 9 ).
TSDD was equipped with Doppler lasers, which were mounted on a servo-hydraulic beam to measure the deflection velocity of a loaded pavement. One of the lasers which was placed at 138 in. from the load was used as a reference value with assumption of zero deflection when the surface deflection basin was calculated from the raw data using area under the curve (AUTC) method.
Deflection Indices
Deflection basin describes the deformation of a loaded pavement surface and can be used to calculate structural parameters for evaluating the pavement structural condition. The structural indices may be classified into two types: 1) deflection-based indices, which are directly calculated from deflection basin; and 2) structural-condition parameters, which are determined based on back-calculation method, such as layer modulus, and structural numbers. Table 1 summarizes the deflection-based structural indices which were considered in this study.
Summary of Deflection-Based Structural Condition Indices

Since the change of dynamic load during testing could potentially influence the deflection readings, all the deflection measurements were normalized before calculating structural indices. Assuming the deflections are proportional to the applied load, the normalized deflection measurements can be expressed as Equation 1.

where
Temperature Correction
Temperature correction approaches for TSDD data are still being developed. Nasimifar et al. ( 14 ) developed a temperature correction method for surface curvature index (SCI12) based on a data set built from responses computed with dynamic-viscoelastic analysis under moving load. Both asphalt layer thickness and latitude of location are considered. The temperature correction function is expressed as Equation 2.

where λ = temperature adjustment factor; SCIref = adjusted SCI value at reference temperature, (Tref); Tref = 20°C in this study; T = temperature at mid-depth of AC layer, determined by BELLS model ( 12 ); hAC = thickness of AC layers; and φ = latitude of location of testing, (30°–50°).
Based on the rehabilitation design for flexible pavement in AASHTO 93 design guide, deflection at the loading center, D0, needs to be corrected to reference temperature of 68°F before calculating the equivalent modulus to determine effective structural number, SNeff. ( 1 ) In this study, D0 was adjusted based on the temperature correction method in AASHTO 93 design guide.
Pavement Surface Condition
Surface condition data were collected using 3-D imaging system. The distress data collected for flexible pavements include fatigue cracks, longitudinal wheel-path and non-wheel-path cracks, transverse cracks, block cracks, and rut depth. The extent of different types of cracks were recorded at three severity levels: low, moderate, and high. These distress data were calculated to pavement distress index (PDI) and reported at an interval of 0.1 mi. International roughness index (IRI) was also collected and reported at the same interval. An overall index, called pavement quality index (PQI), was calculated based on PDI and IRI. PQI is expressed as Equation 3.
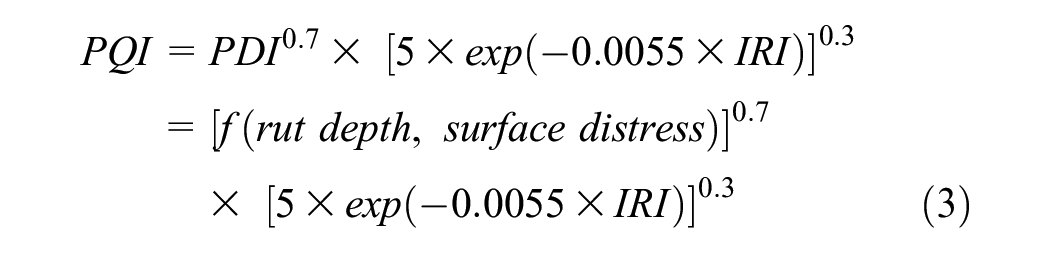
where PDI is a combined index that contains different type of surface distresses, including alligator cracks, block cracks, pothole/patching, longitudinal wheel-path cracks and non-wheel-path cracks, transverse cracks, and rut depth. Details on how to calculate PDI can be found in a previous publication ( 15 ).
PDI and PQI are scaled from 0 to 5, with 5 being the best condition and 0 being the worst condition. The pavement condition data and indices were obtained from the Tennessee Department of Transportation (TDOT) pavement management system between 2019 and 2022.
Data Processing
Raw deflection curves were reported at an interval of 0.01 mi (52.8 ft). Structural indices were initially calculated based on raw deflection curves. Since pavement surface condition indices are reported at an interval of 0.1 mi (528 ft), the structural condition indices were then averaged to match the interval of the surface condition indices. Note that the method of averaging the structural indices could potentially affect the relationship between structural indices and surface condition indices. For example, averaging the structural indices along the distance might overlook some weak spots. This study’s primary focus was on identifying a general trend between structural indices and change in surface condition indices. Therefore, structural indices were averaged using the same interval as surface condition indices.
It should be noted that deflection and surface condition data used in the study were not collected concurrently. This is owing to the use of surface condition data from different years to determine the deterioration of surface condition. Therefore, the disparity in testing conditions might also influence the correlation results between surface condition and structural condition. In this work, average values were used for each 0.1-mi segment. Future studies could explore alternative methods for selecting representative values, considering factors like reliability and data variability.
Table 2 lists the summary of pavement data in this study.
Summary of Data Used in this Study
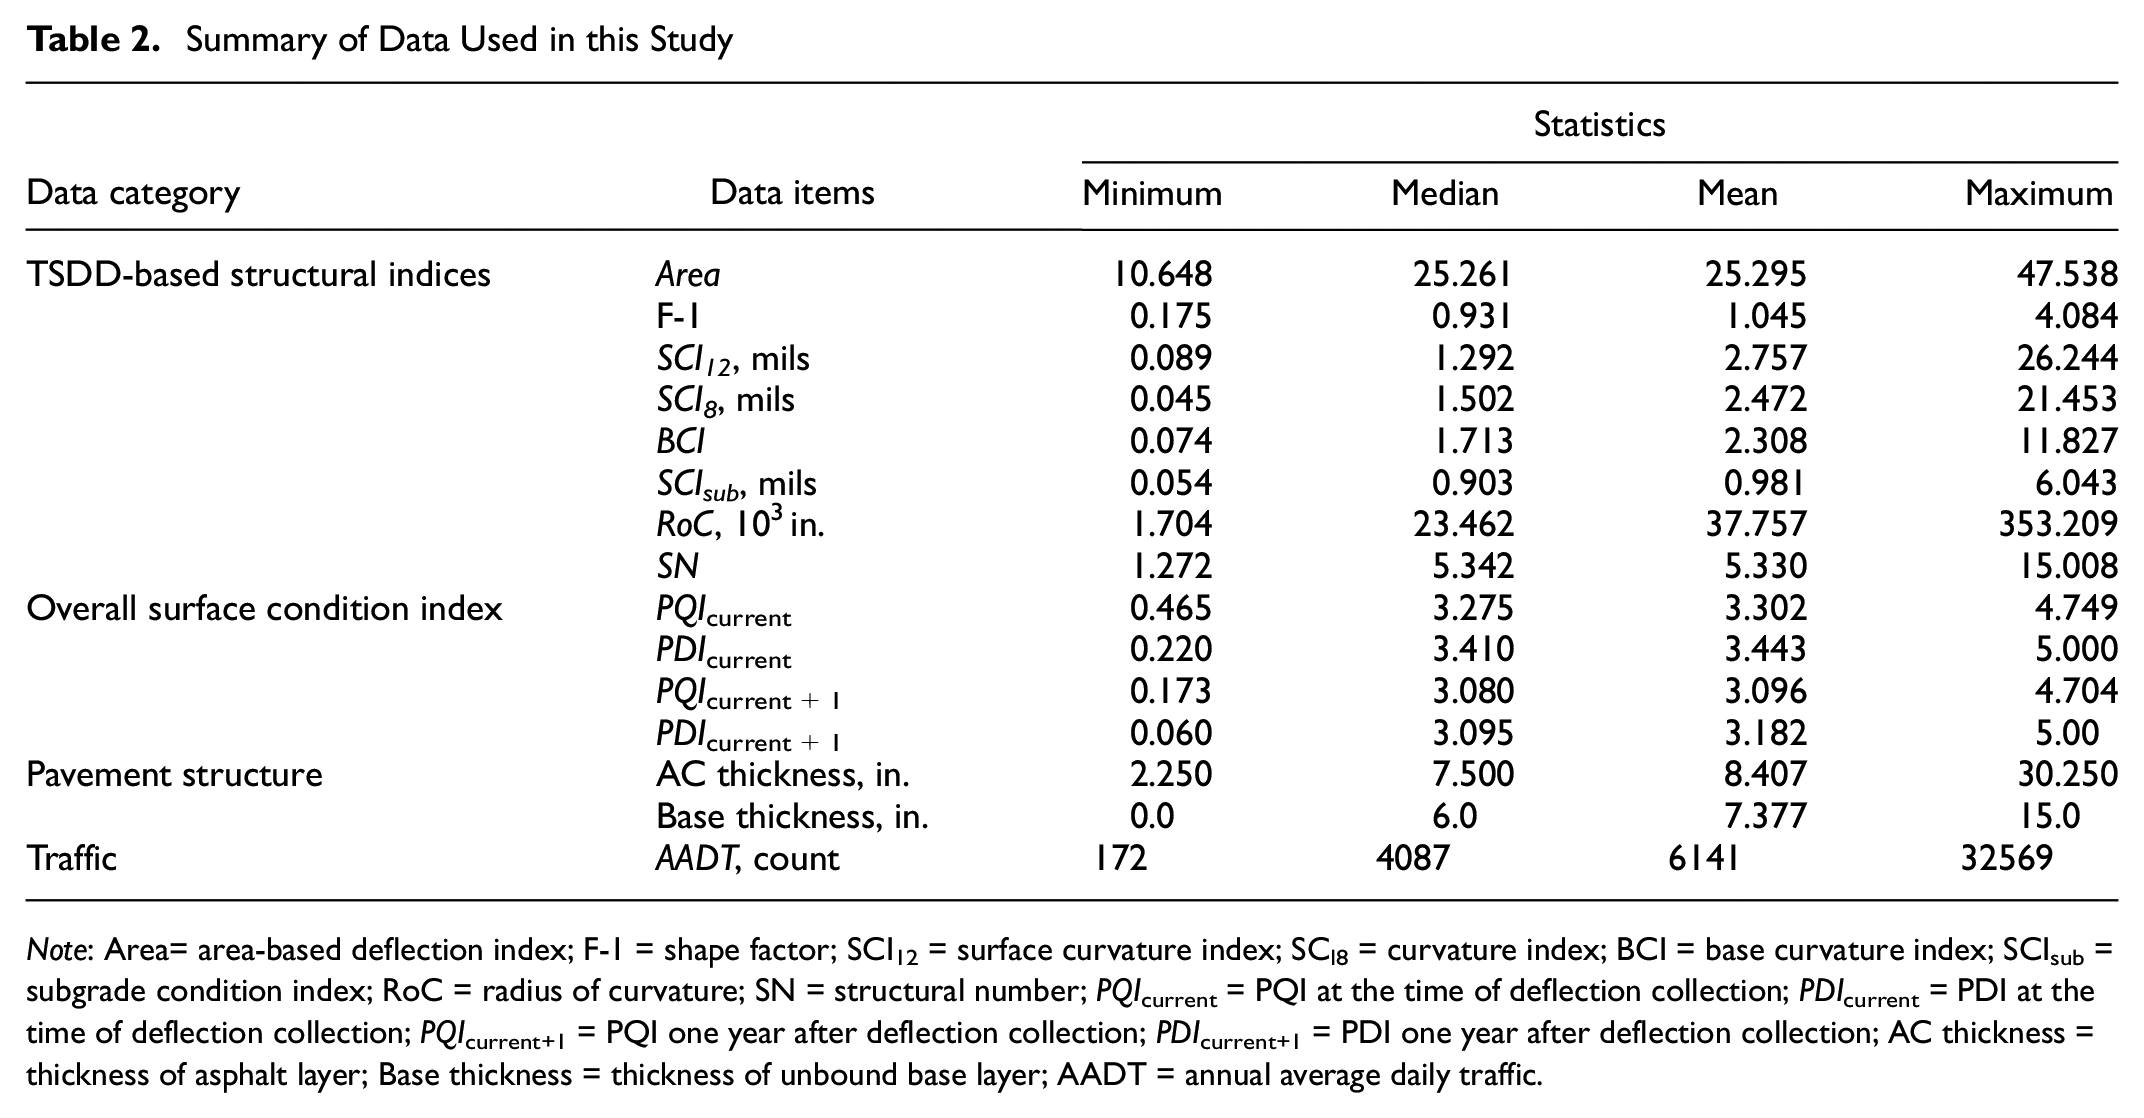
Note: Area= area-based deflection index; F-1 = shape factor; SCI12 = surface curvature index; SCI8 = curvature index; BCI = base curvature index; SCIsub = subgrade condition index; RoC = radius of curvature; SN = structural number; PQIcurrent = PQI at the time of deflection collection; PDIcurrent = PDI at the time of deflection collection; PQIcurrent+1 = PQI one year after deflection collection; PDIcurrent+1 = PDI one year after deflection collection; AC thickness = thickness of asphalt layer; Base thickness = thickness of unbound base layer; AADT = annual average daily traffic.
Identification of TSDD-Based Indices Influencing the Change of Surface Condition
The change rates of surface condition were calculated based on the change of surface condition indices (both PQI and PDI) between two years, which is expressed as Equation 4.

where Δindex is the change rate of surface condition index; Index is the surface condition index (PDI or PQI); and i is the year when the surface condition data was collected.
Classification and Regression Tree (CART) Analysis Results
CART analysis utilizes recursive partitioning algorithm to build a binary tree structure which divides the input data into homogeneous subsets by minimizing the level of impurity within each subset. Two main types of trees are used in CART analysis: classification trees, which deal with categorical dependent variables; and regression trees, which are used for predicting continuous variables. For classification trees, the terminal nodes in the trees are determined by maximizing purity of each subset, whereas for regression trees, they are determined by minimizing the variance of the variables of each subset.
Figure 3, a and b, illustrates the cluster dendrograms of CART analysis results for change of PDI and PQI, respectively. As indicated in the dendrograms, SCI_12, radius of curvature (RoC), AC thickness, annual average daily traffic (AADT), and Area were found to significantly affect the change in PDI between two years, whereas SCI_12, AC thickness, AADT, structural number (SN), SCI_8, SCI_ sub , and Area were significant factors for PQI deterioration. Both SCI_ 12 and Area were identified as significant structural indices for change rates of both PDI and PQI.
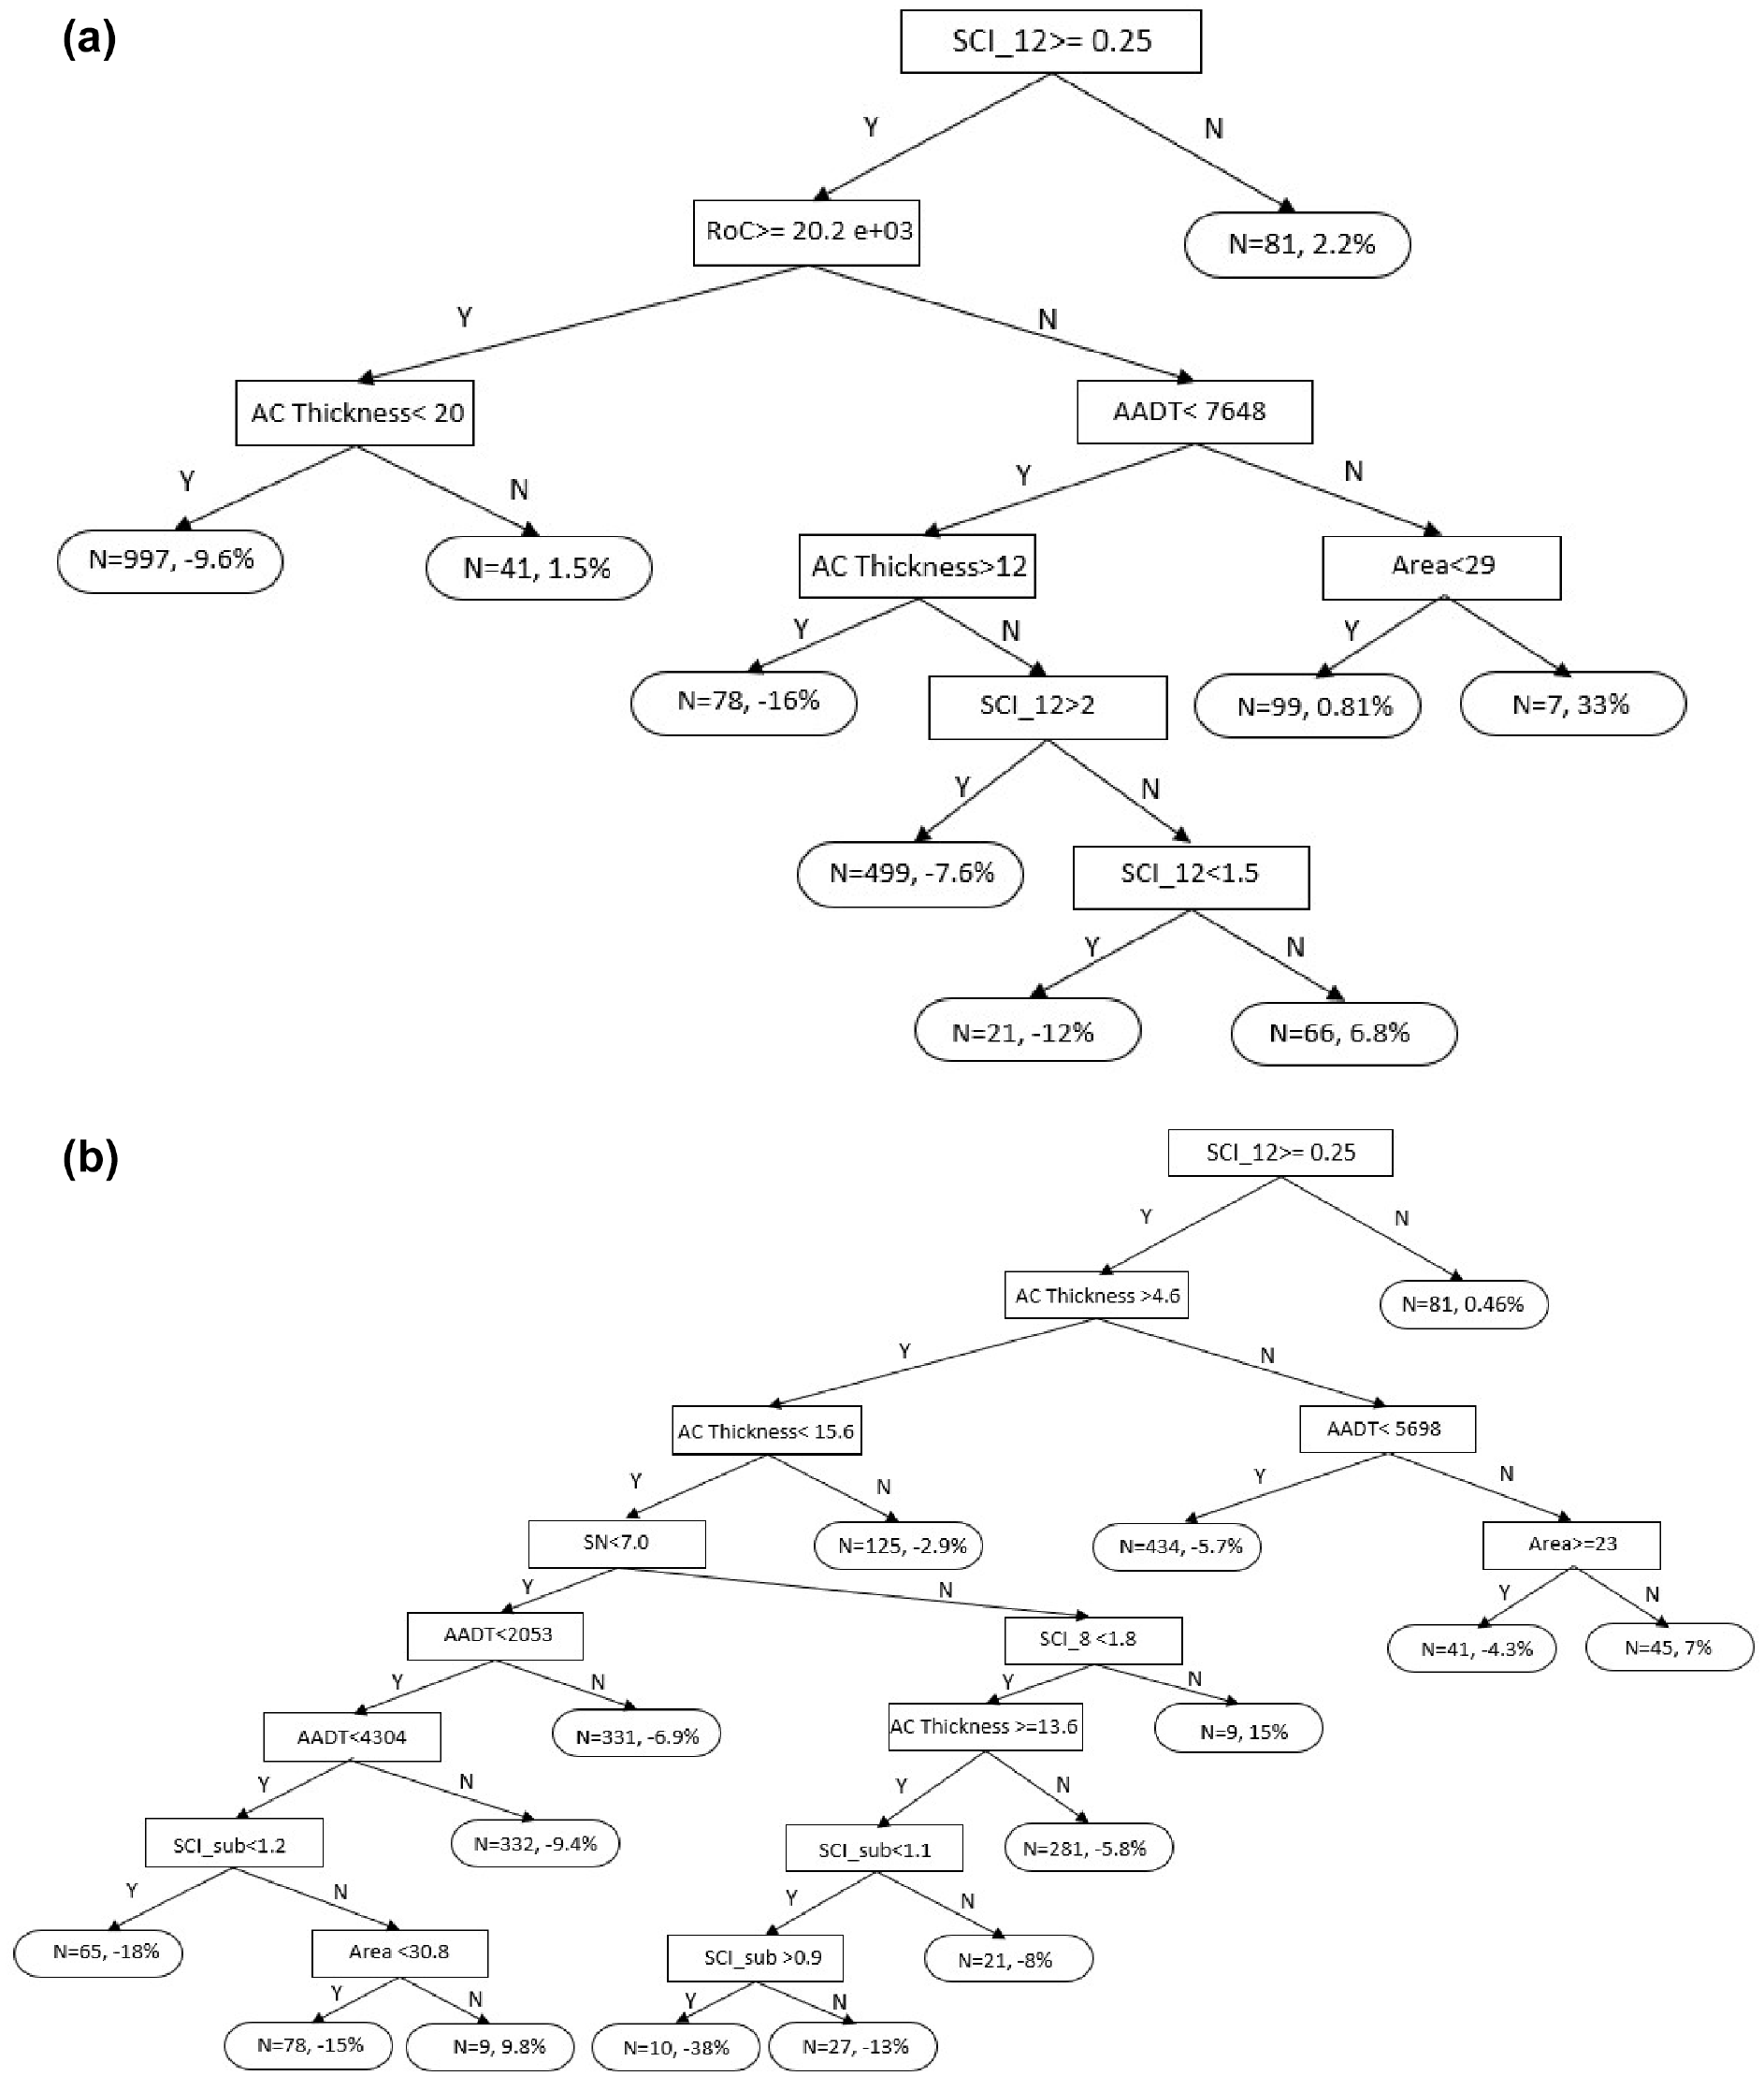
Cluster analysis for change rate of surface condition indices (PDI and PQI): (a) cluster dendrogram for PDI deterioration and (b) cluster dendrogram for PQI deterioration.
Multiple Regression Results
Multiple regression analysis was employed as another way to identify the TSDD-based indices that may significantly affect the change of surface condition indices. The results of multiple regression analysis for PDI and PQI are listed in Tables 3 and 4. An alpha value of 0.05 (confident level of 95%) was used to determine whether a variable is significant. P-value less than 0.05 means the variable is significant. As indicated in Table 3, the variables that significantly influenced the PDI changes included Area, SCI12, base curvature index (BCI), SCI_sub, SN, and thickness for asphalt layer and base layer. Table 4 indicated that other than the thickness for asphalt layer and base layer, all the structural indices except F1 shape factor and RoC were found to be significant.
Results of Multiple Regression Analysis for PDI Model

Note: * indicates the variable is significant in the model; Intercept = parameter from multiple regression analysis; Area = area-based deflection index; F-1 = shape factor; SCI12 = surface curvature index; SCI8 = curvature index; BCI = base curvature index; SCIsub = subgrade condition index; RoC = radius of curvature; SN = structural number; AC thickness = thickness of asphalt layer; Base thickness = thickness of unbound base layer; AADT = annual average daily traffic.
Results of Multiple Regression Analysis for PQI Model

Note: * indicates the variable is significant in the model; Intercept = parameter from multiple regression analysis; Area = area-based deflection index; F-1 = shape factor; SCI12 = surface curvature index; SCI8 = curvature index; BCI = base curvature index; SCIsub = subgrade condition index; RoC = radius of curvature; SN = structural number; AC thickness = thickness of asphalt layer; Base thickness = thickness of unbound base layer; AADT = annual average daily traffic.
As expected, thickness of asphalt layer was identified as a significant variable for the change of surface condition indices by both CART and multiple regression analysis. Meanwhile, in multiple regression model, the change of PDI and PQI was not significantly influenced by AADT. The impact of base thickness on index changes was not significant in decision tree models. The results of regression analysis appeared to contradict the widely accepted notion that traffic generally plays an important role in the deterioration of pavement condition. One possible explanation for this discrepancy could be that the influence of AADT was not as significant as other factors, such as layer thickness, in linear model. This is because AADT does not account for load spectrum of traffic, which is a major factor in pavement deterioration. If equivalent single-axle loads (ESAL) had been included in the regression analysis, they might have been identified as a significant factor. However, the truck class information was not available, making it challenging to estimate ESAL solely based on AADT and truck percentage. Therefore, only AADT was used in the regression analysis.
For TSDD-based structural indices that are directly calculated from deflection basin (exclude SN), both SCI_12 and Area were identified as significant factors for the change of surface condition indices by both methods. Both indices include deflections at loading center and 12 in. from loading center. This meant that deflections at these two points might be closely related to the change of surface condition. The structural indices were found to be more sensitive to the change of PQI than that of PDI. For PQI change, five out of total seven structural indices were found to be significant in multiple regression method, and four out of seven structural indices were identified as significant factors in CART method. In contrast, three out of seven structural indices were identified as significant for the change of PDI by multiple regression and CART method, respectively. As mentioned earlier, PDI only contains surface distresses, whereas PQI contains both PDI and IRI. The inclusion of IRI in PQI calculation may result in more structural indices being sensitive to PQI change. This is in line with previous studies where deflection measurements were found to be influenced by surface roughness ( 10 , 16 ).
The influence of SN and BCI on change in indices seemed to contradict engineering judgment. In Tables 3 and 4, the values in the “Estimate” column for SN were positive, indicating that the change of indices increased with increasing SN. This means that segments with higher SN exhibited higher deterioration rate of surface condition. The negative values for BCI in both tables indicated that the change in indices decreased as BCI increased. This finding indicated that segments with weaker base layer exhibited lower deterioration of surface condition.
SN is a structural condition index that incorporates both deflection and layer thickness information. It is an indicator of existing pavement structural condition and an estimate of whether an existing pavement structure is sufficient to carry future traffic. In general, segments with stronger structural condition (higher SN) are likely to carry more ESAL than those with lower SN. Furthermore, higher ESAL could potentially contribute to higher deterioration rates of surface condition for segments. Unfortunately, owing to lack of ESAL information in this study, the impacts of ESAL on surface condition deterioration were not clear.
BCI is the difference in deflections at two fixed points of deflection basin. The influence of base layer condition on deflection basin varies depending on many factors, including layer thickness and modulus of surface and base. As the influence of SN and BCI on change in surface condition indices may deviate from the expectations, more data are needed to validate these findings.
It should be noted that it was not the intention of this study to predict structural indices using surface condition indices. Both regression and CART analyses were employed to determine which structural indices might have significant impact on the deterioration of the surface condition. Both structural and surface condition indices should be used in the M&R analysis to make a reasonable decision.
Relationship Between TSDD-Based Indices and Deterioration of Surface Condition
1-Year Deterioration Curve
The relationships of surface condition index between two continuous years indicate the trend of decline in condition index within a year. The relationship can be defined using linear model as Equation 5.

where Indexi, and Indexi+1 are surface condition index at year i and year i+1, respectively; a is the slope of linear model; and b is the intercept of linear model.
To facilitate the comparison, intercept of linear model is set to zero. Then, the slopes determined by the regression analysis can be used to compare the difference in the deterioration rates. Generally, smaller slopes mean higher deterioration rates for surface condition. Slopes are generally less than 1, meaning pavement condition index values will not increase without significant maintenance activities being applied. Most PMS employed deterministic model forms to establish performance prediction models. The shapes of these performance curves are closely related to the slope determined in Equation 5. Therefore, understanding the influence of TSDD-based indices on the slopes of 1-year deterioration curves is helpful in establishing performance models.
Effect of Deflection-Based Indices on Deterioration Rates of Surface Condition
Figure 4 illustrates an example where an SCI_12 of 12 mils was employed to split the data set into two subsets. In each subset, slope a in Equation 5 was determined. As can be seen, the slope of PDI is 0.9376 for the subset of “SCI_12<12 mils” (see blue dots in Figure 3), whereas that is 0.8457 for the subset of “SCI_12>12 mils” (see orange dots in Figure 3). This trend was generally in agreement with what was indicated by SCI_12. Since lower SCI_12 values indicate stronger pavement surface structure, the road segments in the subset of “SCI_12<12 mils” were generally structurally stronger than those in the subset of “SCI_12>12 mils”. As expected, the deterioration rate of PDI in “SCI_12<12 mils” subset was lower than that in “SCI_12>12 mils” subset.

Example of deterioration rates of PDI for two subsets split by an index value.
By investigating the relationships between change of deflection indices and deterioration of surface condition, one may understand how surface deflection indices may affect network-level surface deterioration and which of these indices may closely relate to deterioration of surface condition. In this section, different TSDD-based structural condition indices, including SN, SCI_12, RoC, BCI, and Area, were investigated using the above-mentioned method.
Figure 5 illustrates the relationships between SN and slopes of PDI and PQI. SN with both slopes of PDI and PQI exhibited similar pattern. Slopes of both indices for “SN<SNi” were greater than those for “SN >SNi” with SN less than about 7.5. With SN greater than 7.5, slopes of both PDI and PQI for “SN >SNi” appeared to be higher than those for “SN<SNi”. This means the deteriorations of surface condition indices were not always in line with the change of SN.
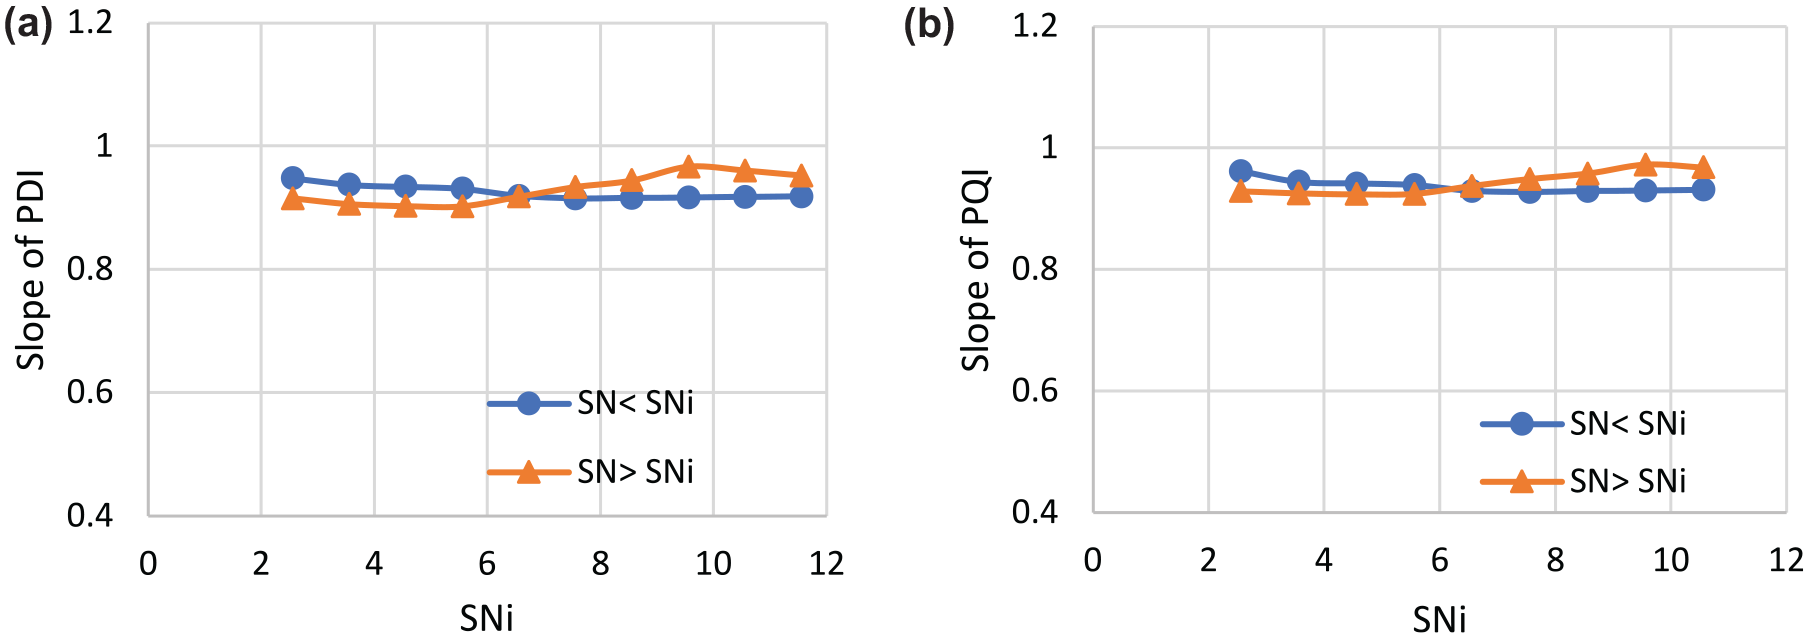
Relationship between SN and deterioration rate of surface condition: (a) SN and slope of PDI and (b) SN and slope of PQI.
SN is determined by thickness of layers above subgrade. Even with the same deflection basin, SN values for road segments with different layer thicknesses may be significantly different. Meanwhile, some road segments with low SN values and traffic volumes may deteriorate more slowly than those with high SN values and traffic volumes. SN from existing pavements is primarily compared against the required SN, which is determined from predicted future ESAL, to determine the needs for structural improvement. The existing SN, in this case, seemed not well correlated with deterioration of pavement condition indices.
Figure 6 illustrates the relationships between SCI_12 and slopes of PDI and PQI. No significant difference of slopes was found with SCI_12 less than 6 mils. With the increase of threshold values, the slopes of both PDI and PQI for the subset with higher SCI_12 value decreased, which indicated the deterioration rates of PDI and PQI increased. As SCI_12 increased, the structural capacity of surface layers decreased, which resulted in an increase in deterioration rates of surface condition.
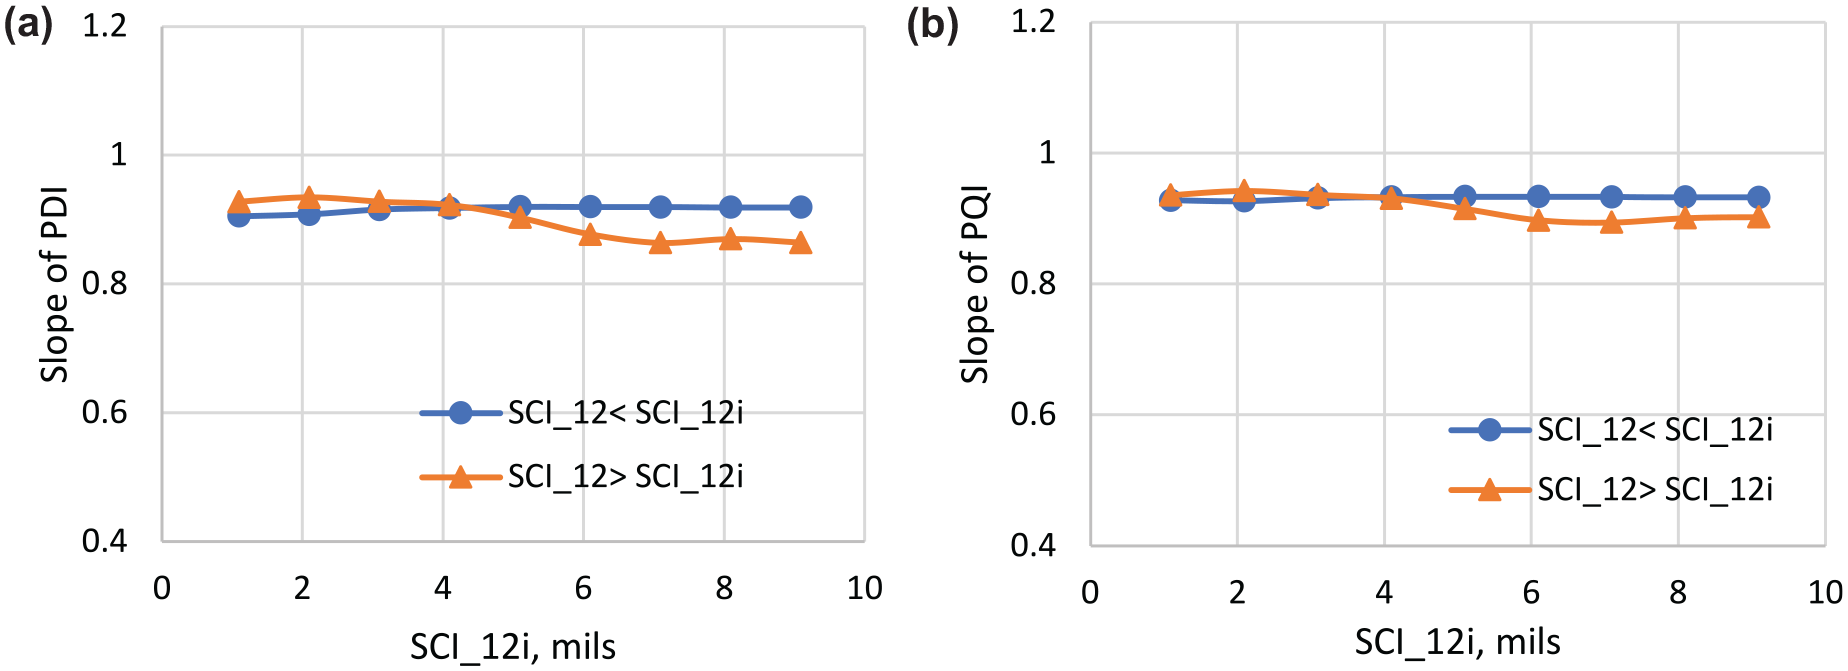
Relationship between SCI_12 and deterioration rate of surface condition: (a) SCI_12 and slope of PDI and (b) SCI_12 and slope of PQI.
From Figure 6, SCI_12 of 6 mils seemed to be the value beyond which the changes of surface condition indices between two years started to become significant. In this study, the proportion of road segments with SCI_12 greater than 6 mils was less than 10%. Because of the small sample size, it is difficult to establish reliable relationships between SCI_12 and slopes of surface condition indices for SCI_12 greater than 10 mils. With more data being collected, Figure 6 may be improved accordingly.
Figure 7 illustrated the relationships between RoC and slopes of PDI and PQI. No significant difference of slopes was found between two “RoC<RoCi” and “RoC> RoCi” with RoC less than 100*103 in. When RoC was greater than 100*103 in., segments with greater RoC exhibited higher slopes of PDI and PQI, which indicated the deterioration rates were lower. RoC is associated with the tensile strains at the bottom of AC layer. With the increase of RoC, the tensile strain at the bottom of AC layers decreases. Therefore, in general, road segments with greater RoC exhibit fewer fatigue cracks and have longer service life.

Relationship between RoC and deterioration rate of surface condition: (a) RoC and slope of PDI and (b) RoC and slope of PQI.
From Figure 7, one may conclude that RoC might be a good indicator to differentiate the deterioration rates of surface condition if it is beyond a certain value which, in this case, was about 100*103 in. There seemed be no significant difference in deterioration rates with RoC below this value.
Figure 8 illustrated the relationships between BCI and slopes of PDI and PQI. The slopes of PDI and PQI for “BCI>BCIi” were found to be close to those for “BCI<BCIi”. This means BCI was not well correlated with the deterioration of surface condition. This is because BCI which is the difference between deflection at 12 in. and 24 in. from the loading center is generally associated with the condition of base layer. The base layer condition is somewhat indirectly associated with the surface condition. As a result, the effect of change of BCI on surface deterioration was not significant.
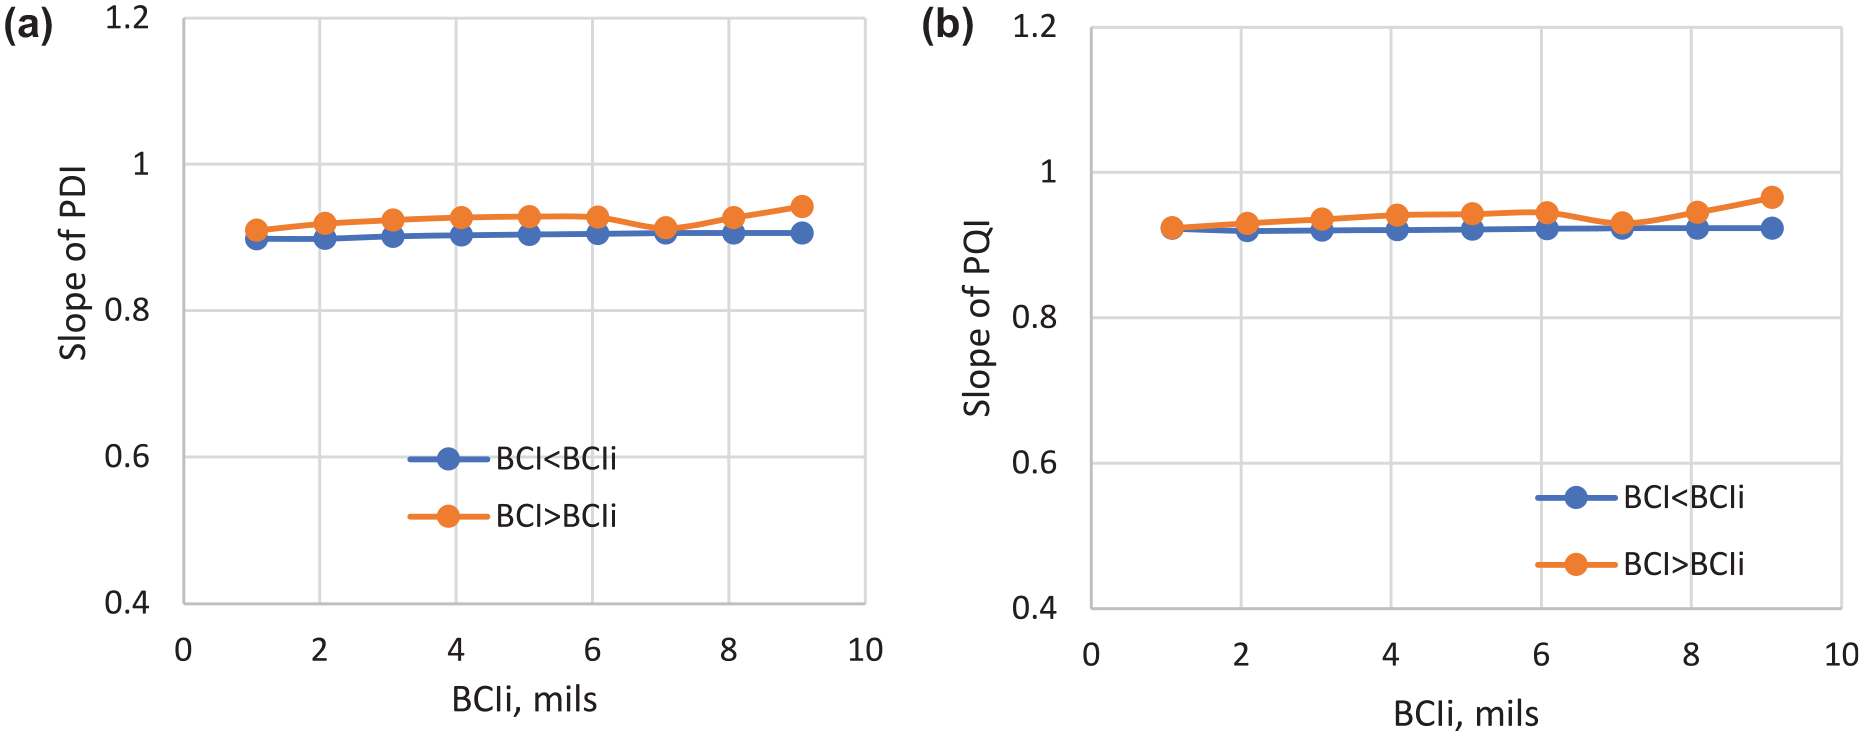
Relationship between BCI and deterioration rate of surface condition: (a) BCI and slope of PDI and (b) BCI and slope of PQI.
Figure 9 illustrated the relationships between Area and slopes of PDI and PQI. Area is the standardized area of deflection basin based on seven-sensor configuration. It appeared that there was no significant difference of the slopes of both indices between two subsets. This means the area of the deflection basin was not sensitive to the deterioration of surface condition. The area of deflection basin contains structure information not only from the surface layers but from the base layer and subgrade, whereas PDI and PQI only contain information from top surface. Since the structural conditions of base layer and subgrade partially contribute to Area, the influence of change of Area on surface deterioration became less significant.

Relationship between Area and deterioration rate of surface condition: (a) Area and slope of PDI and (b) Area and slope of PQI.
Figures 5–9 showed no significant difference in slope of surface indices between the two subsets for BCI and Area. SN did not appear to be closely related to expected change in surface deterioration. SCI_12 and RoC, which are believed to be closely related to surface condition, could be used to establish performance prediction models.
Framework of Determination of Threshold for TSDD-Based Indices
Selection of the appropriate structural indices to be included in PMS is crucial to improve the overall quality of M&R analysis. Because of the limited amount of structural condition data that is available, the authors only proposed a framework of how to incorporate network-level structural data into PMS in this paper. Further improvement on performance models and decision trees will be made when more network-level structural condition data are available.
Figure 10 illustrated a general flowchart of how to use PMS data to determine the work program for resurfacing program. The parts in the dash-line boxes are based on surface condition data. As can be seen, surface distresses are calculated into overall surface condition indices, which are used to develop performance model to project future conditions of pavements. Based on the findings of this study, some of these structural indices may be incorporated into calculation of surface overall index or development of prediction models, while others are suitable to be included in decision trees. TSDD-based indices can be incorporated into prediction models in two ways. One is to include the structural index as a predictor in the prediction model. Another is to use the structural index to classify the prediction models into different groups. How to incorporate the structural index in prediction models depends on how the structural index affects the change of pavement condition indices. The methods discussed in this study could be used to evaluate these structural indices. For those TSDD-based indices that are suitable for decision tree analysis, further studies on how to set the triggers for these TSDD-based indices may be conducted. The example of evaluating the relationship between TSDD-based indices and deterioration of surface condition provided in this study may be used for determining these trigger values.
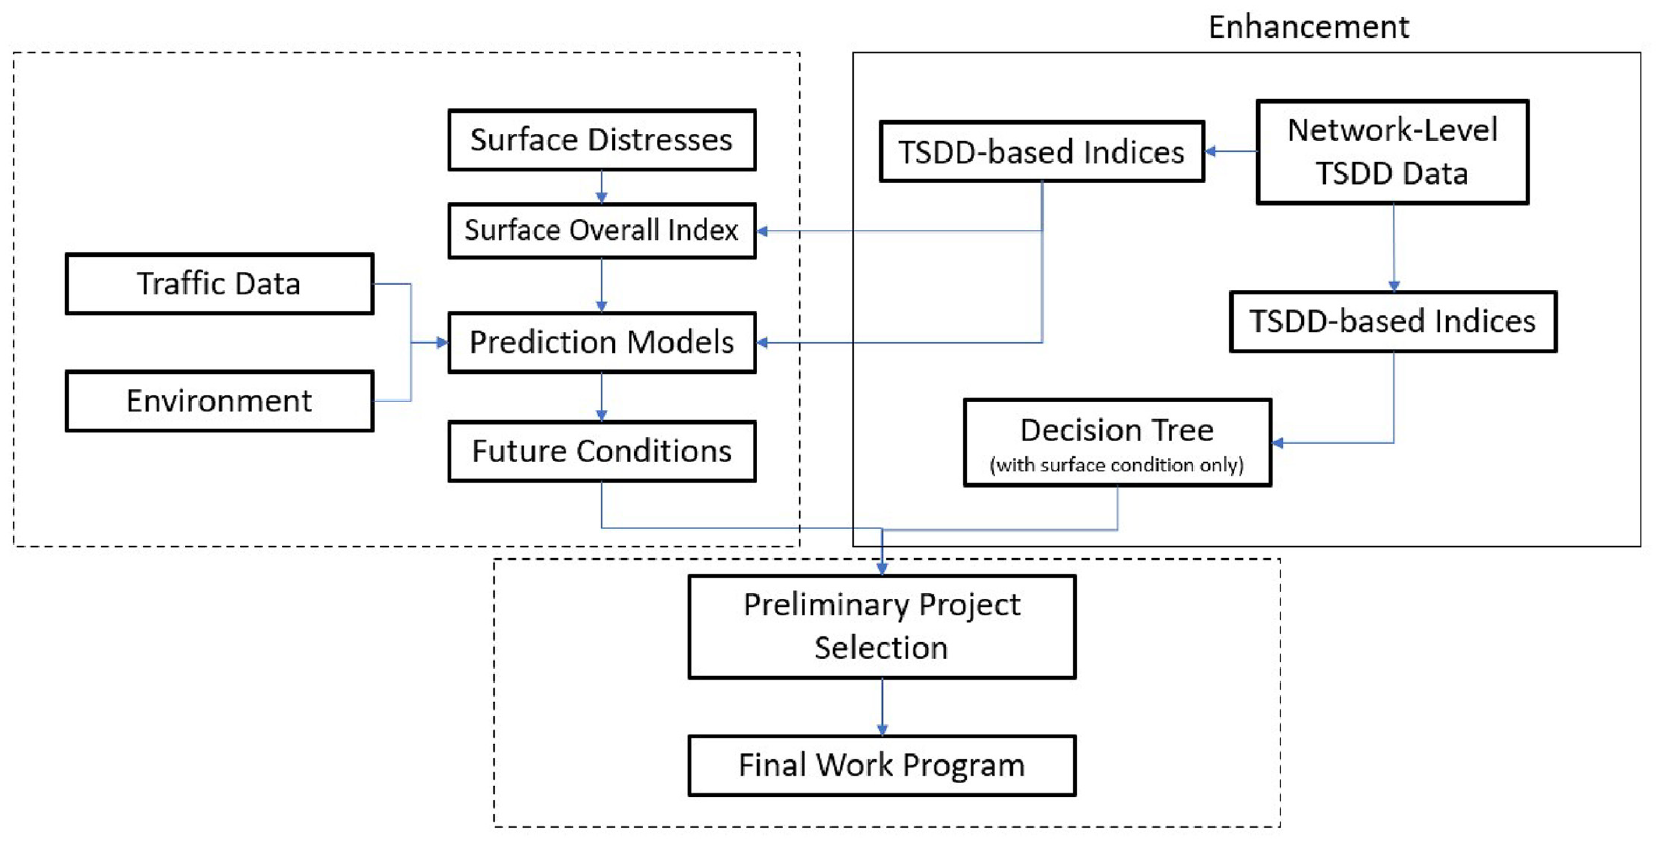
General flowchart of maintenance and rehabilitation analysis with structural data enhancement.
Discussion
In this study, the deflection was normalized by simply assuming the deflections are proportional to the applied load before calculating TSDD-based indices. The coefficient used to normalize deflection is based on the ratio of applied load to a standard load of 9,000 lb. It is important to note that the coefficients for the points on the deflection basin other than D0 might be different. Generally, these coefficients can be determined by obtaining deflection basins at different loading levels for FWD setting. Unfortunately, acquiring deflection basins for the same point with different loading levels for TSDD setting is challenging. Although some researchers are investigating the influence of speed and temperature superposition on deflection measurements ( 17 ), a general procedure for standardizing deflection basin is needed so the effect of loading on TSDD-based deflection could be considered. Owing to the absence of a standardized data processing procedure for deflection basin, the back-calculated subgrade modulus was not employed in this study since its calculation is solely based on deflection at one point.
The regression analysis of surface condition indices between two years indicated that SN of existing pavements seemed not consistent with the expectation. Segments with small SN values had higher slope, which indicated the surface deterioration rates were lower. Therefore, existing SN may not be recommended to be included in establishing performance models. As it was found to be significant to the change of pavement surface conditions by both multiple regression and CART methods, existing SN is recommended to be included in decision trees for identifying under-designed pavement segments and used for identifying the needs for structural improvement for the agencies who use AASHTO 93 design guide.
Table 5 summarized the TSDD-based structural indices investigated in the study and whether they significantly influenced the change of PDI and PQI and were sensitive to the surface deterioration. Δindex calculated from Equation 4 indicates the change rate of surface condition index between two years. The purpose of identifying the structural indices significantly influencing Δindex was to find structural indices that are best suited for project-level analysis. The relationship between structural indices and surface deterioration based on 1-year deterioration curve was established to understand how the structural indices affect the general trend of surface deterioration. The results may be applicable for network-level application, such as establishment of prediction models. Therefore, the results from these analyses were slightly different. One may also find that there were discrepancies between multiple regression and CART analysis. Since the relationships between structural condition and surface condition are not clear, it is difficult to decide which models are suitable for this case. In this study, both models were employed. With the implementation of TSDD-based indices into PMS, further evaluations are needed based on the feedback from the results of M&R analysis.
Summary of TSDD-Based Structural Indices
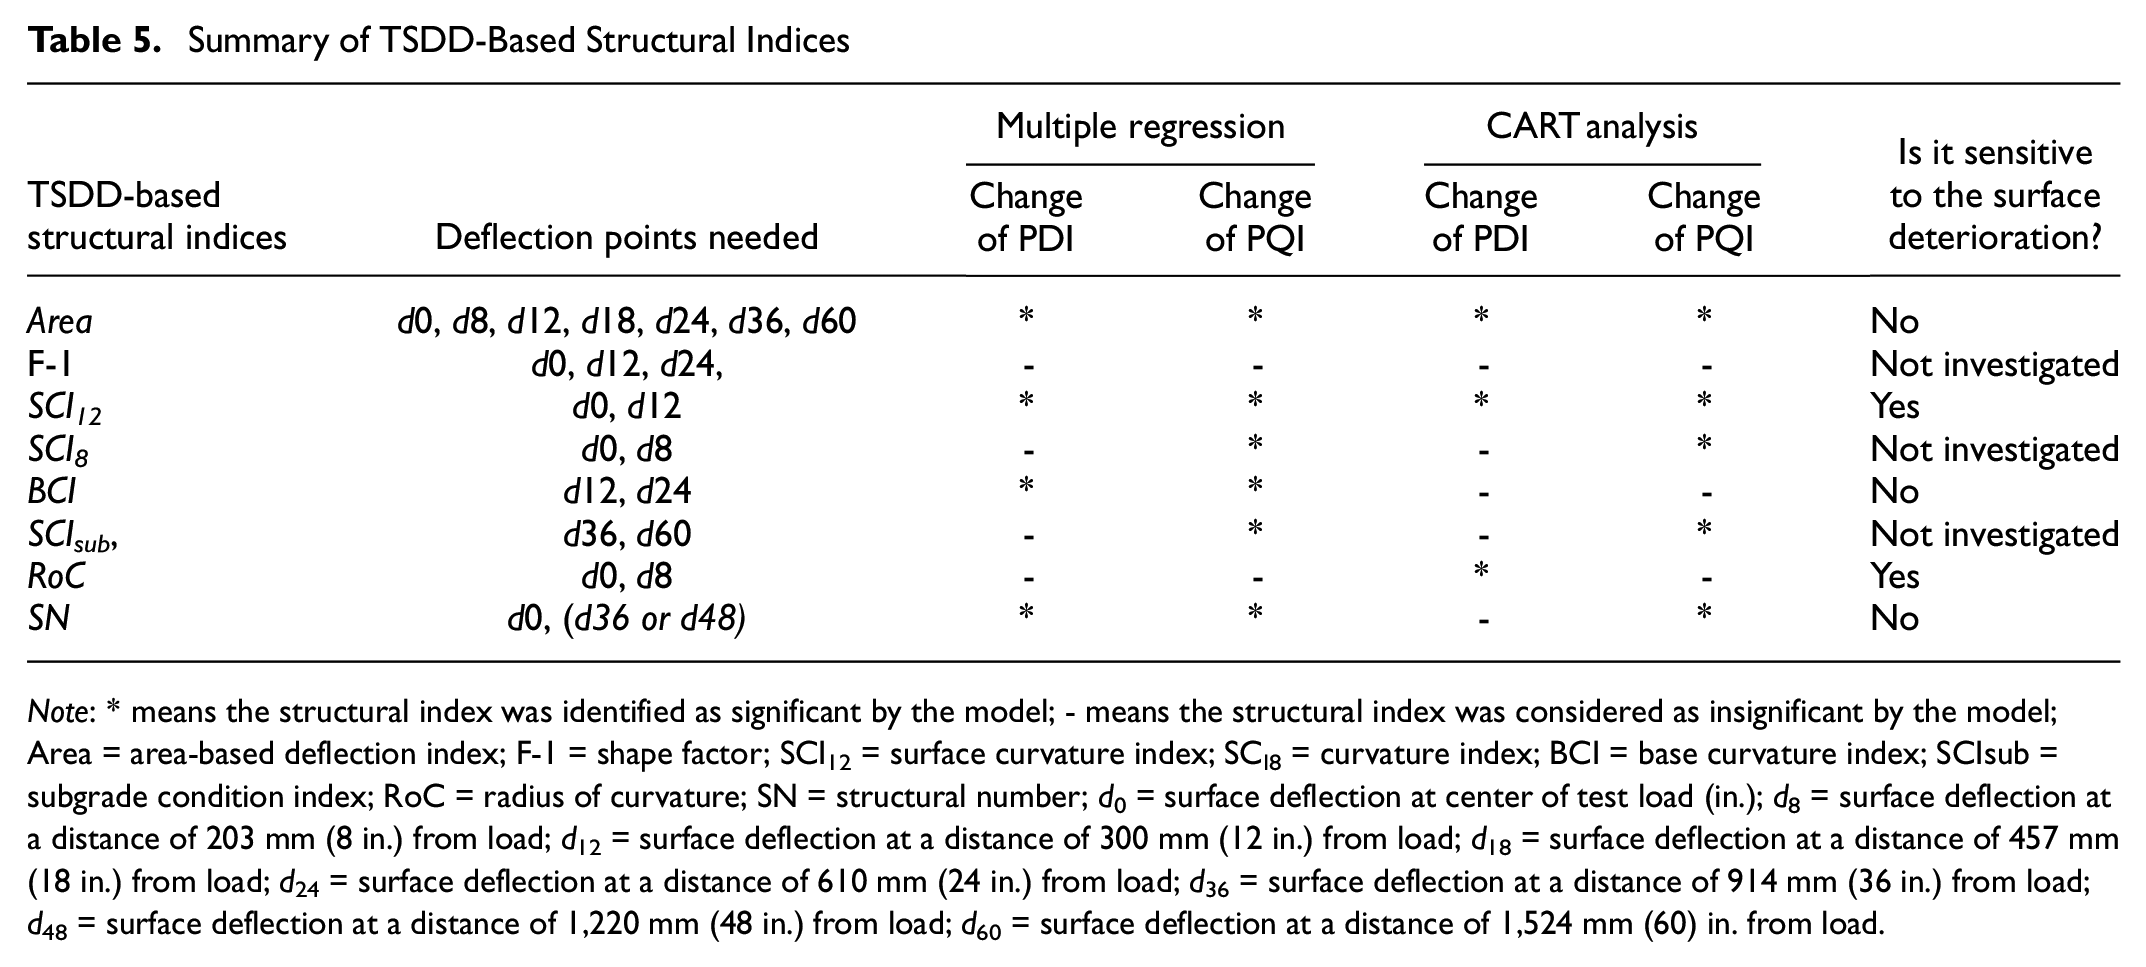
Note: * means the structural index was identified as significant by the model; - means the structural index was considered as insignificant by the model; Area = area-based deflection index; F-1 = shape factor; SCI12 = surface curvature index; SCI8 = curvature index; BCI = base curvature index; SCIsub = subgrade condition index; RoC = radius of curvature; SN = structural number; d0 = surface deflection at center of test load (in.); d8 = surface deflection at a distance of 203 mm (8 in.) from load; d12 = surface deflection at a distance of 300 mm (12 in.) from load; d18 = surface deflection at a distance of 457 mm (18 in.) from load; d24 = surface deflection at a distance of 610 mm (24 in.) from load; d36 = surface deflection at a distance of 914 mm (36 in.) from load; d48 = surface deflection at a distance of 1,220 mm (48 in.) from load; d60 = surface deflection at a distance of 1,524 mm (60) in. from load.
Conclusion
In this study, the relationship between network-level structural condition indices obtained from continuous surface deflection and the deterioration of surface condition for flexible pavements was evaluated. The structural indices that were significantly related to the decline in surface condition were investigated. Then, the effects of changes of structural indices on deterioration rate of surface condition indices were quantitively evaluated using 1-year deterioration curves. A flowchart of how to incorporate network-level structural indices into PMS was proposed. The following conclusions were drawn.
• Both SCI_12 and Area were found to significantly influence the change of pavement condition indices (PDI and PQI) between two years.
• Both SCI_12 and RoC appeared to be sensitive to the deterioration rates of surface condition indices, which meant these measures could be used to establish deterministic performance prediction models.
• As expected, TSDD-based indices which are associated with the condition of base layers and subgrade were less sensitive to the surface deterioration rates.
• TSDD-based indices were found to be more sensitive to the change of PQI than PDI.
Based on the conclusions above, SCI_12 and RoC could be valuable input parameters for adjusting shape of prediction curves in models. This is because they appeared to be closely related to the slope change of surface indices. These indices might also be useful in decision trees for preliminary identification of roadway segments with higher deterioration rates. In TDOT’s current PMS, predicted PQI values are calculated based on PDI and IRI prediction models. Therefore, establishing PQI prediction models with structural condition indices (such as SCI_12 and Area) has the potential to significantly improve the accuracy of PQI prediction.
This study aimed to evaluate the impact of structural index on the deterioration rate of surface condition indices. As the deterioration rates were derived from data spanning two consecutive years, the variability of surface condition data could potentially influence the results. This variability can be attributed to factors such as testing speeds, the type of cracks, and the reporting interval ( 18 ). Owing to the limited availability of data, it is challenging to determine the extent to which these factors influenced the outcomes. To mitigate the influence of data variability, a longer monitoring period could be employed to evaluate the overall trend of surface deterioration. For example, utilizing surface condition indices from a period of three years or longer might reduce the variability of surface condition indices.
Footnotes
Author Contributions
The authors confirm contribution to the paper as follows: study conception and design: Xiaoyang Jia and Di Zhu; data collection: Xiaoyang Jia, Di Zhu; analysis and interpretation of results: Xiaoyang Jia, Di Zhu; draft manuscript preparation: Xiaoyang Jia. All authors reviewed the results and approved the final version of the manuscript.
Declaration of Conflicting Interests
The author(s) declared no potential conflicts of interest with respect to the research, authorship, and/or publication of this article.
Funding
The author(s) received no financial support for the research, authorship, and/or publication of this article.

Data Accessibility Statement
Some or all data, models, and code that support the findings of this study are available from the corresponding author on reasonable request.
The contents of this paper reflect the views of the authors, who are responsible for the facts and the accuracy of the data presented, and do not reflect the views of Tennessee Department of Transportation. The contents do not constitute a standard, specification, or regulation.