



Abstract
The development of public charging infrastructure is crucial to support mass electric vehicle (EV) adoption. Although many cities worldwide have already installed an initial network of public chargers, it is often unclear whether the current supply of infrastructure is in line with demand and how many more charging stations are required to cope with future EV growth. In this sense, transactional charging data on the existing network can help answer these questions. We present a novel method that uses historical charging data as input to obtain answers to the following questions: (a) How many more chargers are required to meet future demand? and (b) Where should these new chargers be installed? By mining the individual charging behavior of EV drivers, we show that overflow dynamics can be found between charging stations. That is, when a preferred charging station is fully occupied, it is found that EV drivers divert to other charging stations nearby. Identifying these dynamics allows us to simulate the impact of a demand increase on the charging infrastructure network more accurately. We found the number of new chargers required to be significantly lower when considering overflow dynamics. Our simulations indicate that if demand is doubled, 30%–50% fewer charging points are needed compared with a situation in which overflow dynamics are neglected but the same failure rate is still maintained (i.e., percentage of failed charging sessions in the network). Determining the exact number of chargers will depend on the failure rate policymakers are willing to accept, reflecting the trade-off between charging convenience and utilization.
The electrification of the transport sector will require a big investment in charging infrastructure worldwide. As well as having chargers available at home and the workplace, the public domain constitutes an important part of the total charger supply ( 1 , 2 ). This is especially the case in large cities and urbanized areas where many residents and visitors do not have access to off-street parking and, thus, rely on public infrastructure for their charging needs. Although many cities already have an initial network of public chargers up and running, many more additional chargers are required to support mass EV adoption ( 3 ). Considering the scarcity of available space in densely populated areas and the cost of installing new chargers, key questions for urban planners and charging point operators (CPOs) are how many additional chargers are needed to meet future demand and where these new chargers should be installed. Incorrect decisions with regard to either of these dimensions could result in under- or overutilized charging stations, leading to a waste of public resources (space and money), and could possibly hamper future EV adoption.
To this end, policymakers can use the observed charging behavior from the initial charging network to make more informed decisions as to how to upgrade it. Despite the high value of charging data as a source of information, research showing how these data can be translated into policy decisions is still lacking. To bridge this gap in the literature, we present a novel model that uses existing charging data to obtain answers to the following: How many more chargers are required for different demand growth scenarios? and What are the optimal locations for these new chargers? The model itself consists of three parts: (a) grouping charging stations that are used interchangeably by groups of EV drivers into zones; (b) identifying the overflow dynamics between charging stations in the same zone (i.e., which chargers are used as an alternative to each other); and (c) simulating the effect of an increase in charging demand, considering the overflow.
Literature Review
Considerable research has been focused on the problem of how to design a robust network of charging stations for EVs. Even before EVs came onto the market, initial research used proxy variables to estimate which locations would be most suitable for EV chargers. Cai et al. ( 4 ) provide an overview, indicating that traffic data, gas station locations, and vehicle ownership rates are often used as proxies. With the number of EV adopters starting to rise, another line of research has focused on characterizing early adopters according to their sociodemographic profile. Studies based on EV adoption data from the UK ( 5 ), Ireland ( 6 ), and Pennsylvania ( 7 ) indicate that early adopters are more likely to be found in suburban regions and have the following characteristics: a high income; a higher median age; are more likely to own their own home; have a smaller household size; and have access to more than one car. These attributes have been used in case studies conducted in Milan ( 8 ) and in the county of Tyne and Wear (UK) ( 9 ) to locate charging stations according to where early adopters are most likely to live.
Seeking more data-driven approaches, others have modeled charging infrastructure from large-scale trajectory data, household travel surveys, or surveys of the EV population. Cai et al. ( 4 ) mine vehicle trajectory data stemming from an internal combustion engine taxi fleet in Beijing to study charging station planning and the impact of charging stations on the environment and the electricity grid. Mandev et al. ( 10 ) collect fuel consumption data on plug-in hybrid EVs (PHEVs) from the U.S.A. and Canada to study their charging behavior empirically. They find that PHEV owners charge about once per day, mostly during the night. Li and Jenn ( 11 ) use individual activity-based travel diary data from California to determine optimal charging locations, the optimal charging strategy, and the required number of chargers. Lee et al. ( 12 ) survey the EV population in California and find that the use of public, workplace, and home chargers is interconnected. They find that although the majority of EV drivers rely solely on charging at home, 30%–40% of the EV population display a mixed use of infrastructure depending on sociodemographic and EV characteristics.
Although these findings provide useful inputs for urban planners to assist them in developing an initial network of chargers, the question remains how this network should be upgraded over time to keep up with future EV charging demand. In this sense, observed data on the usage of the existing charging network allows us to understand the complex charging behavior of EV drivers ( 13 ) and, therefore, constitutes an important source of information. However, there are fewer studies showing how charging data can translate into policy decisions as to how many more chargers are needed and where they should be located. Wagner et al. ( 14 ) and Pevec et al. ( 15 ) use a two-step approach in which they first predict the utilization of potential new chargers based on historical charging data from Amsterdam and the Netherlands. In a second step, they use this prediction as input for an optimization model to find the optimal locations for new chargers. However, the authors do not consider to what extent the existing charging supply sufficiently covers the charging demand and how many more charging stations are required to cope with different EV growth scenarios. Helmus et al. ( 16 ), Wolbertus et al. ( 17 ), and Hoekstra and Hogeveen ( 18 ) propose agent-based simulation models (ABMs) based on charging data from the Netherlands to answer these questions. However, such models have certain limitations. First, ABMs are computationally expensive, and their models are trained on multiyear charging data sets, requiring a high level of data maturity. Second, although Helmus et al. ( 16 ) model the charging behavior through the concept of EV driver interaction, they do so indirectly, through external decision rules.
In this study, we propose a novel method using transactional charging data to simulate how many more charging stations are needed for different future EV growth scenarios, as well as the optimal locations for these charging stations. The contributions of our study can be summarized as follows. First, the majority of existing studies use simulated data or variables related to EV ownership to model charging infrastructure. We contribute by demonstrating how observed charging data at the individual EV driver level can be used as input for infrastructure planning, allowing for more data-driven assessment. Second, to determine how many more charging stations are required, it is necessary to know whether the current supply of infrastructure is in line with demand. Through the concept of failure rate (i.e., percentage of failed charging sessions in the network) we show how demand and supply can be matched and, thus, we are able to formulate exactly how many more chargers are required. Third, our model introduces the novel concepts of “charging zones” (see Definition 1) and “overflow sessions” (see Definition 2) and demonstrates how they can be retrieved empirically from charging transactions. This leads to a deeper understanding of charging infrastructure data and provides new tools for planners to assist in decision-making with regard to the location of new charging stations.
Data
The data set includes one full year of charging transactions (also referred to as sessions) from December 2021 to November 2022, recorded at 197 on-street, public level 2 charging stations in the Brussels-Capital Region. Each charging station has a unique location and is equipped with two charging points (CPs). Only stations that were available for the full period of observation (installed before December 1, 2021) are included. Each charging transaction is characterized by a unique ID assigned to the charging station (indicating where the session happened) and the EV driver (indicating who performed the session). The whole set of charging stations in Brussels is referred to as the charging network. Descriptive statistics on both are described below.
Charging Stations
OpenStreetMap is used to calculate the walking time between each pair of stations, and this is used later as input in the clustering model. Figure 1 shows a map of all charging stations in the data set and Figure 2 shows the distribution of the walking time from each station to the nearest other station. The mean walking time to the closest neighbor is 5.03 min, and for 99% of all the charging stations, the walking time is less than 15 min.
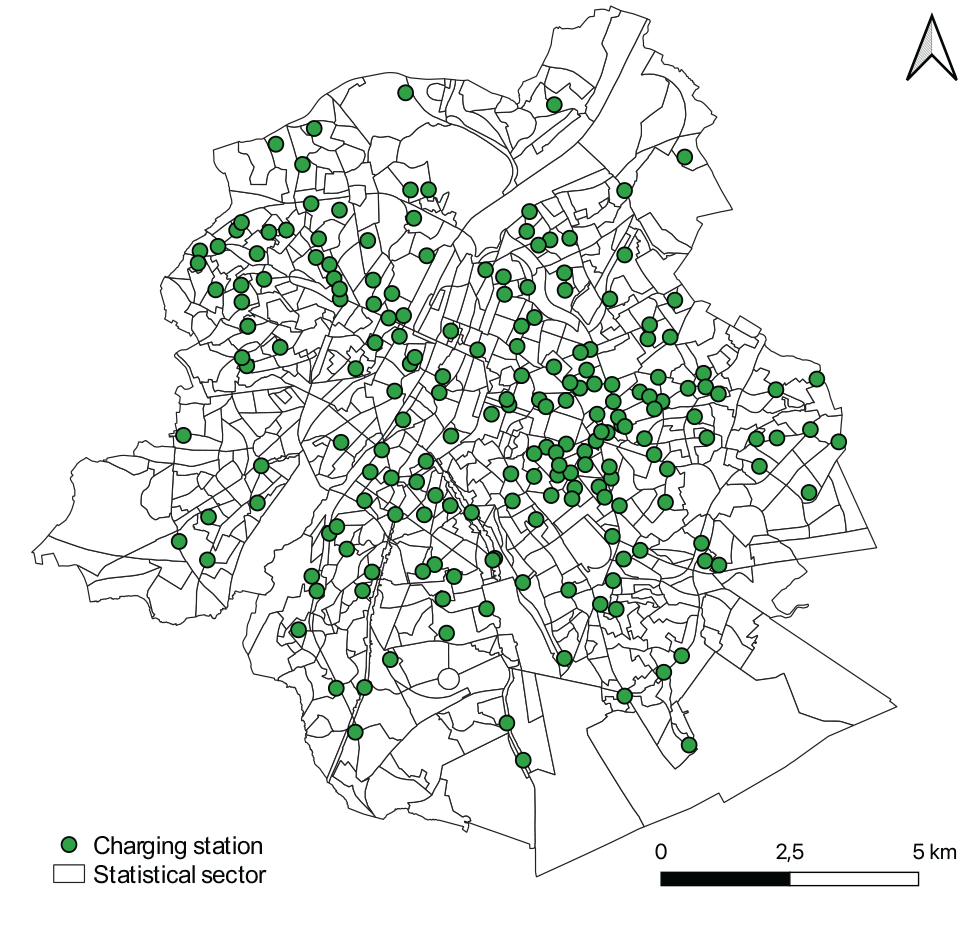
Map of all public charging stations.

Walking time from a charging station to its nearest neighbor charging station.
EV Drivers
Each EV driver in the data set is identified with a unique ID based on the charging card that was used for the transaction. This allows us to analyze charging behavior at the microlevel of the individual EV driver. Table 1 describes the EV driver according to where they charge (multiple or single locations) and when they charge (day only, night only, or both day and night). Most of the EV drivers (57%) only charge at a single location. Most of this group consists of daytime-only users, probably visitors who use the public charging stations infrequently. Of the EV drivers who charge at multiple locations (43%), the majority are day only or day and night users. These are most likely residents and visitors who use the charging infrastructure more frequently than EV drivers who use a single location.
EV Driver Typology

Note: EV = electric vehicle.
Methods
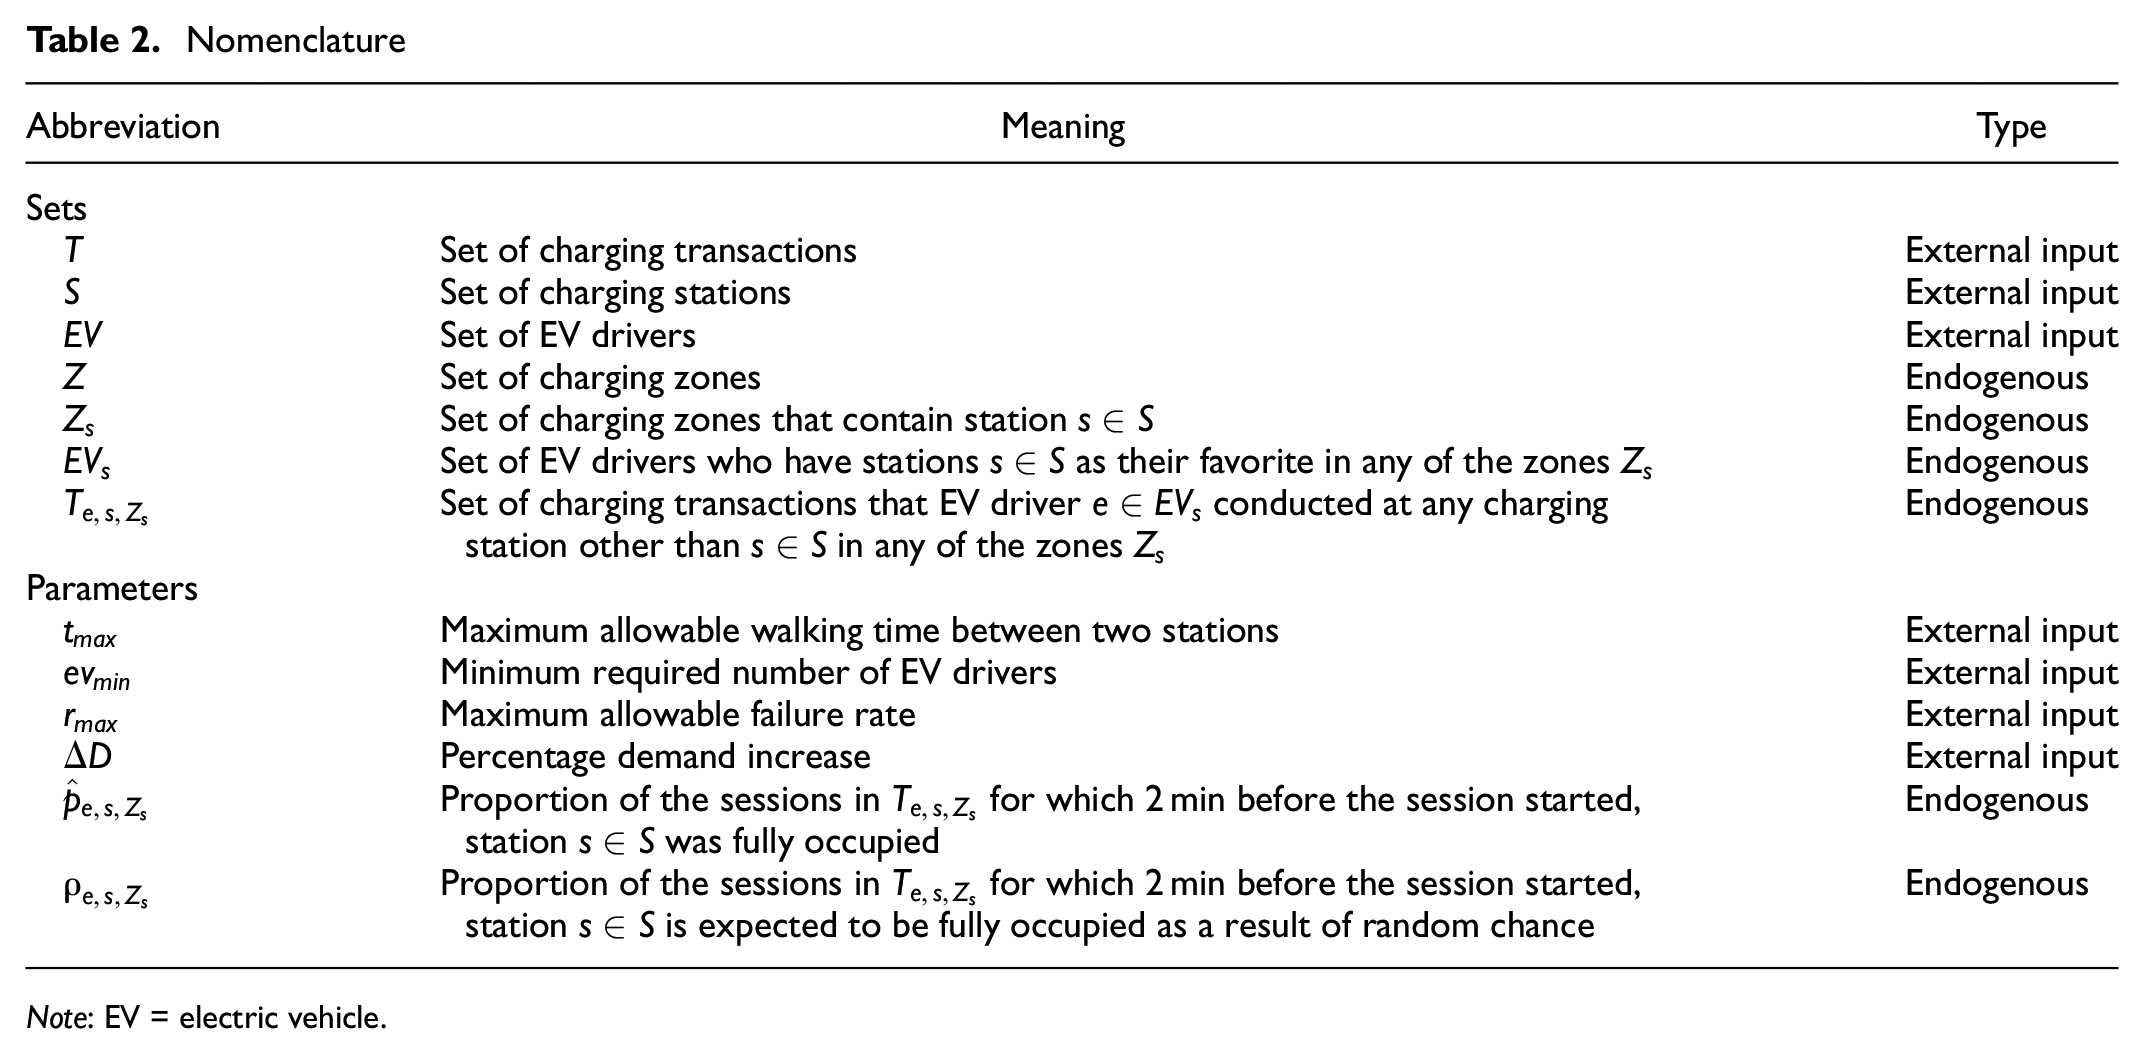
The novelty of our model is that we combine both the geographical information on the charging stations and the individual charging data on the EV driver to identify overflow dynamics. The analysis includes three steps. First, charging stations are clustered together into charging zones. Second, the overflow dynamics within the zones are mined from the charging data. Third, the simulation model assesses the impact of an increase in charging demand. An overview of the nomenclature used can be found in Table 2.
Nomenclature
Note: EV = electric vehicle.
Step 1: Clustering
The goal of clustering is to group together charging stations that are used interchangeably by multiple EV drivers. The underlying idea is that when a preferred charging station is not available for an EV driver to charge his/her vehicle, it is likely that he/she will charge it at the next available charging station, given that it is still within reasonable walking distance of the driver’s destination. Identifying these groups of charging stations, defined here as charging zones, allows us to model how one station within a zone will be affected by the activity at the other stations in that zone.
Although clustering charging stations has already been studied in the EV literature ( 15 , 19–21), no research to date has considered the underlying group of EV drivers who visit the stations as a clustering criterion. Traditional clustering methods (e.g., K-means ( 21 , 22 ), Gaussian mixture models ( 13 , 23 ), and density-based clustering [ 24 ]) are less suitable because of the combinatorial explosion of all possible “station–EV driver” combinations ( 25 ). Therefore, we utilize association rule mining to find groups of charging stations that are all visited interchangeably by multiple EV drivers.
1.
2.
Based on Definition 1, all charging zones can be found in two steps. First, all the largest groups of stations for which the walking time between any pair of them is less than
Step 2: Identifying Overflow Dynamics
Once charging zones have been identified, we can mine for the presence of overflow dynamics within the zones. Overflow dynamics show to which (if any) charging stations EV drivers divert when a preferred station is not available. For this, we employ the concept of an overflow session, which is given in Definition 2.
Definition 2 implies causality, meaning that an overflow session only happens at a certain station because another station was occupied. To identify overflow sessions, we test statistically for the presence of causality as is shown in the process in Figure 3. This is an iterative process, which is repeated for each charging station
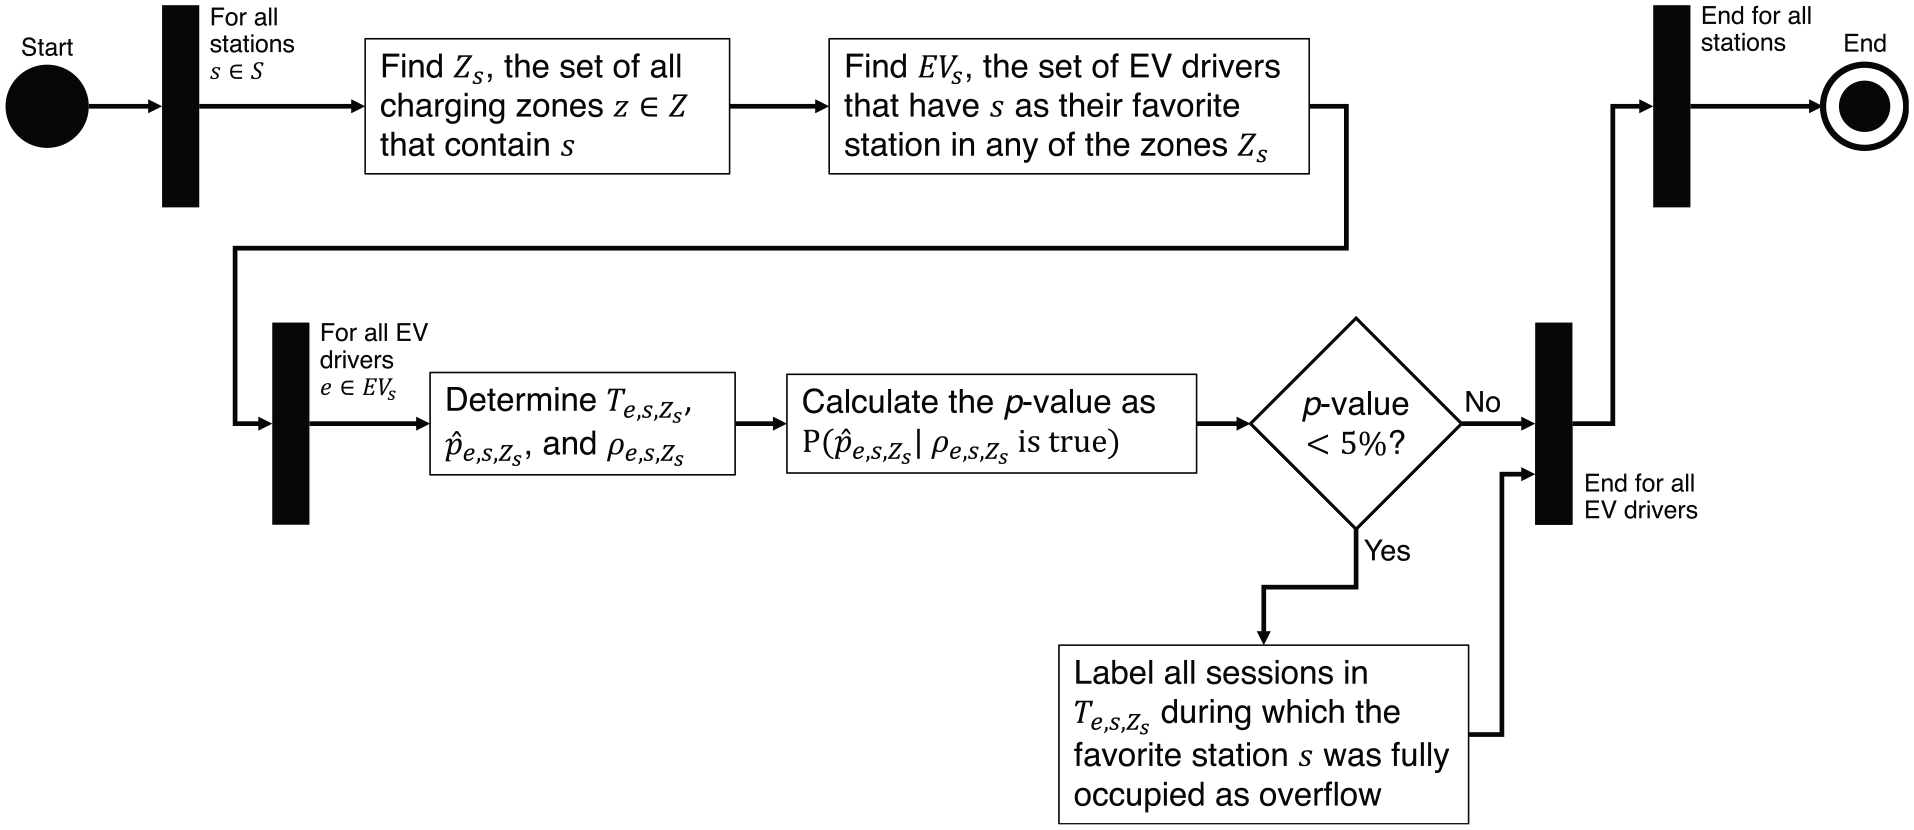
Overview of the process of identifying overflow dynamics.
However, this is not yet evidence for causality because it is possible that the EV driver wanted to charge elsewhere, and that the favorite station was fully occupied at that time by random chance. Therefore, we also calculate the proportion
Step 3: Simulation
Finally, the effect of an increase in demand on the charging network is simulated. This is done in two steps as shown in Figure 4. In the first step, new charging sessions are randomly generated. Given the demand increase
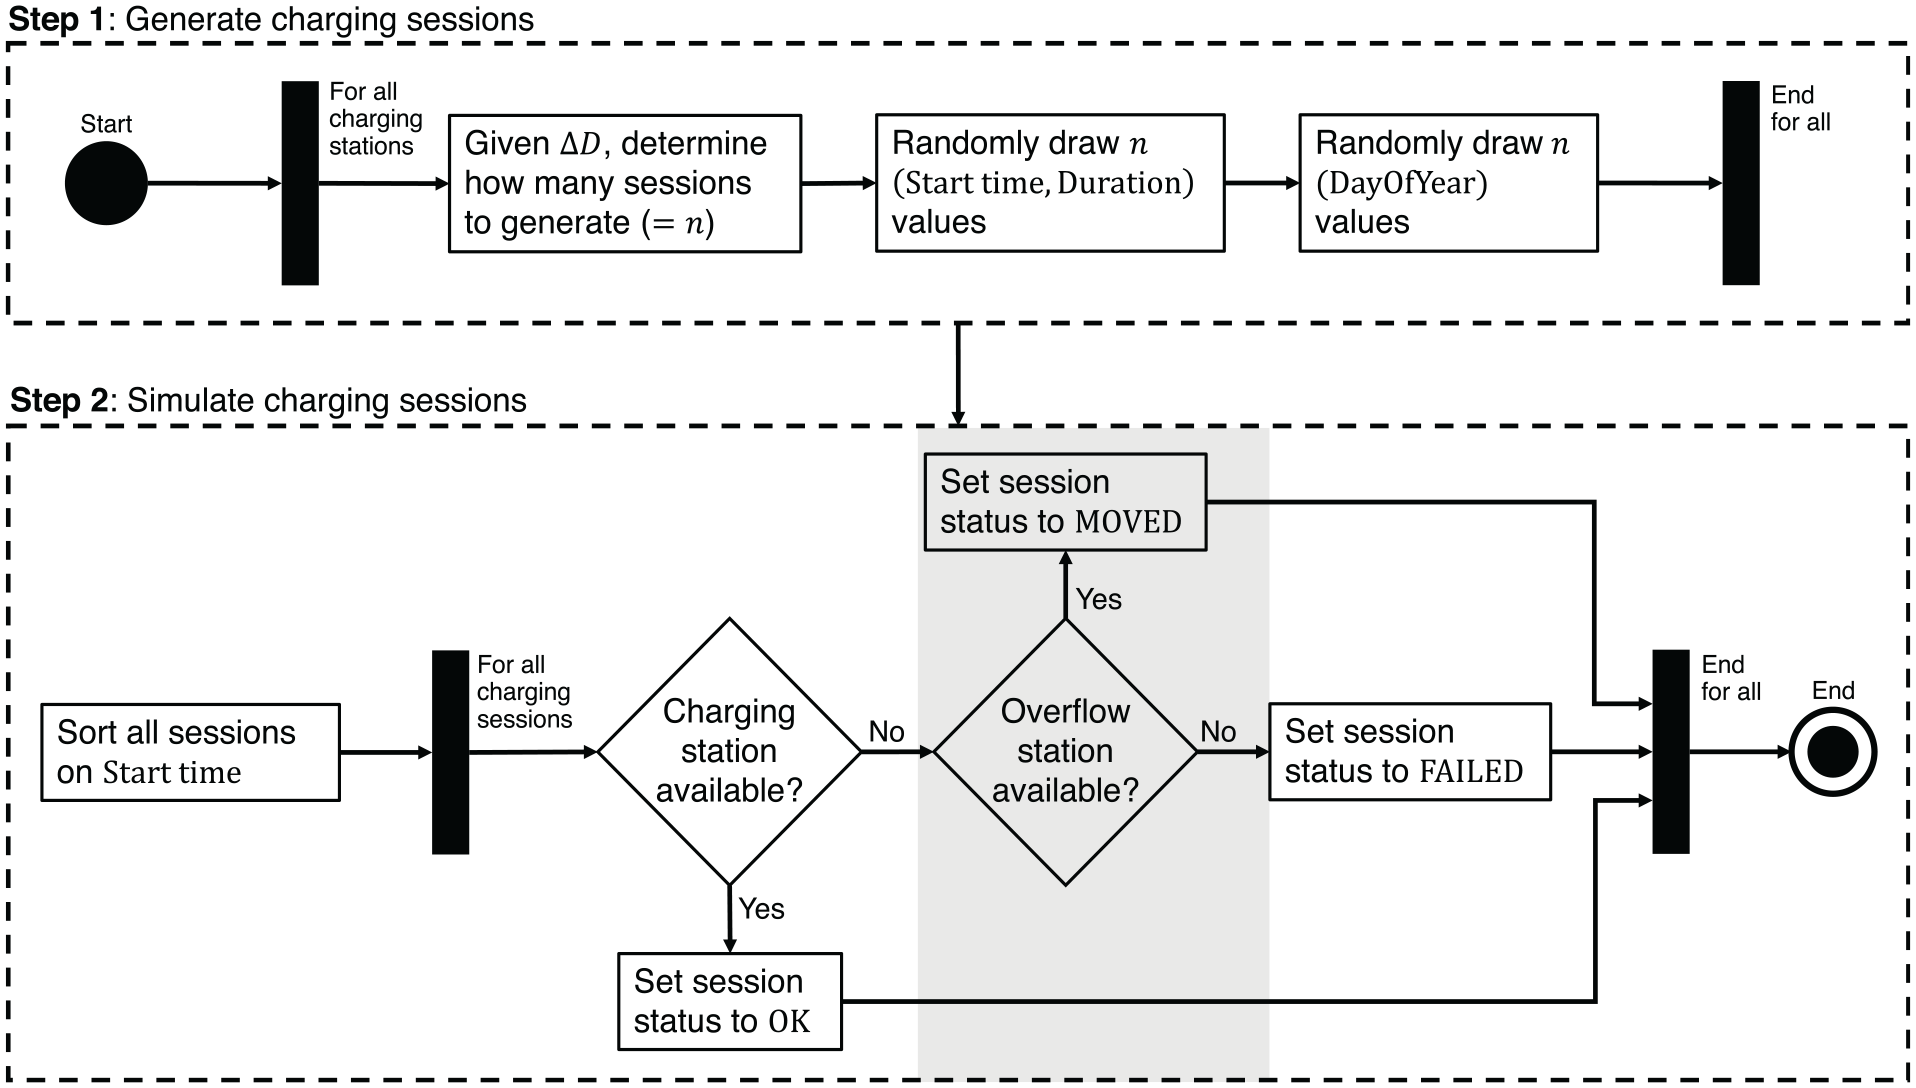
Overview of the simulation model.

Start time and duration distribution.
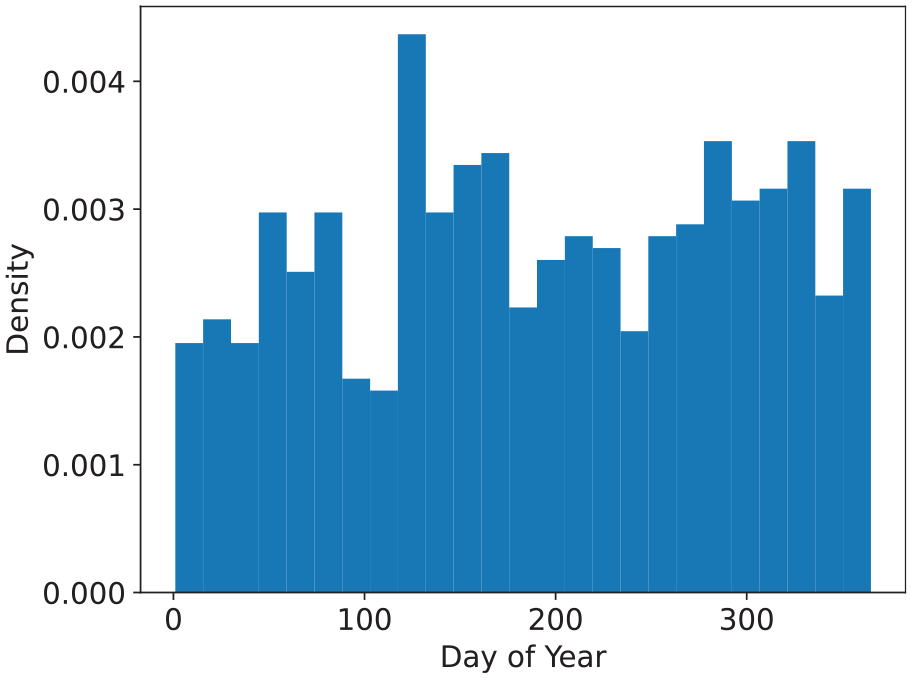
Day of year distribution for one charging station.
In the second step, all charging sessions (both existing and newly generated) are sorted according to their start time and iteratively passed through to verify their status. In the baseline model, only two statuses are possible: either the charging station at which the session is planned to take place is available (“
Results
Charging Zones
The charging zones are visualized for two areas in Brussels in Figures 7 and 8, using a threshold walking time
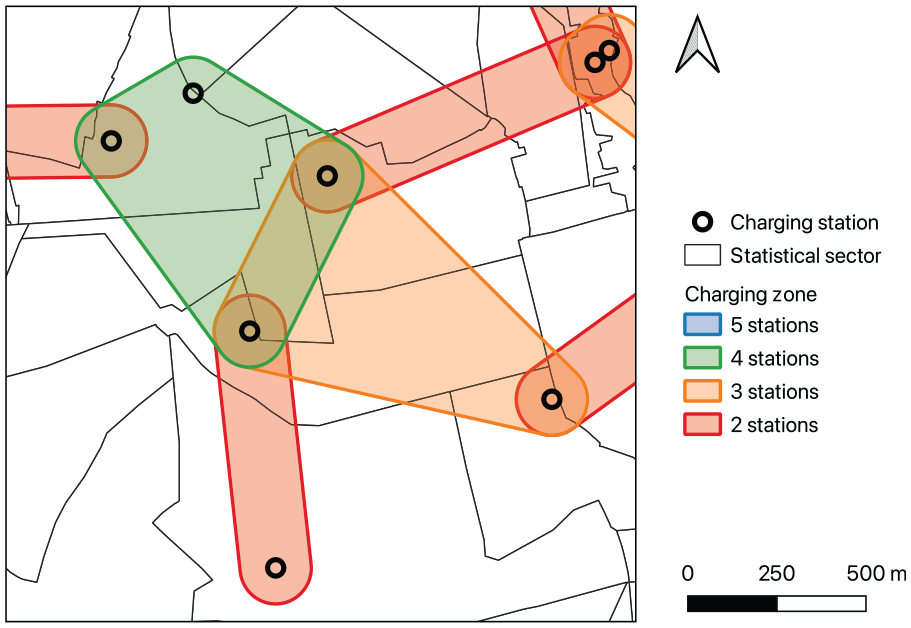
Charging zones in a low-density area.
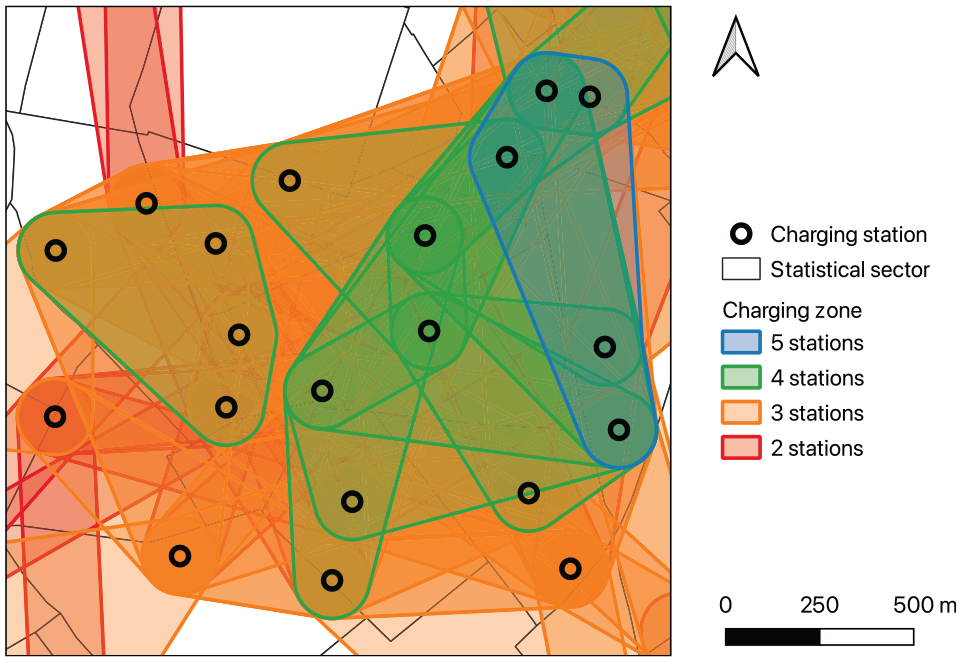
Charging zones in a high-density area.
Displaying the charging network according to the different zones provides new insights for planners when deciding on the location of new stations. Each zone indicates that all the charging stations within that zone are being visited by a shared group of EV drivers. As such, these stations may serve as an alternative for each other when one is fully occupied. Although Definition 1 ensures that one zone can never be a full subset of another zone, many are found to overlap partially. This reflects the notion that a single charging station can serve multiple groups of EV drivers operating in its near surroundings. In areas where the density of charging stations is high (Figure 8), more zones that partially overlap are found.
Overflow Dynamics
The overflow dynamics are visually represented in overflow plots, as shown in Figure 9. The nodes in the graph represent the charging stations (respective to their geographical location), and the arcs between them indicate the number of overflow sessions that have been identified between the stations. The size of the nodes is proportional to the charging activity measured at that station and the width of the arcs with the number of overflow sessions. The arcs always originate at the node with the same color as the arc. For instance, 134 overflow sessions that took place at station D only because station C was occupied have been identified. Some overflow originating from station C is even captured by the more remote stations B and A. Figure 10 shows the same overflow plot for one of the charging zones in the high-density station area from Figure 8. Given the high density of the charging stations in this area, many overflow relations are found.

Overflow plot for the four-station charging zone in Figure 7.
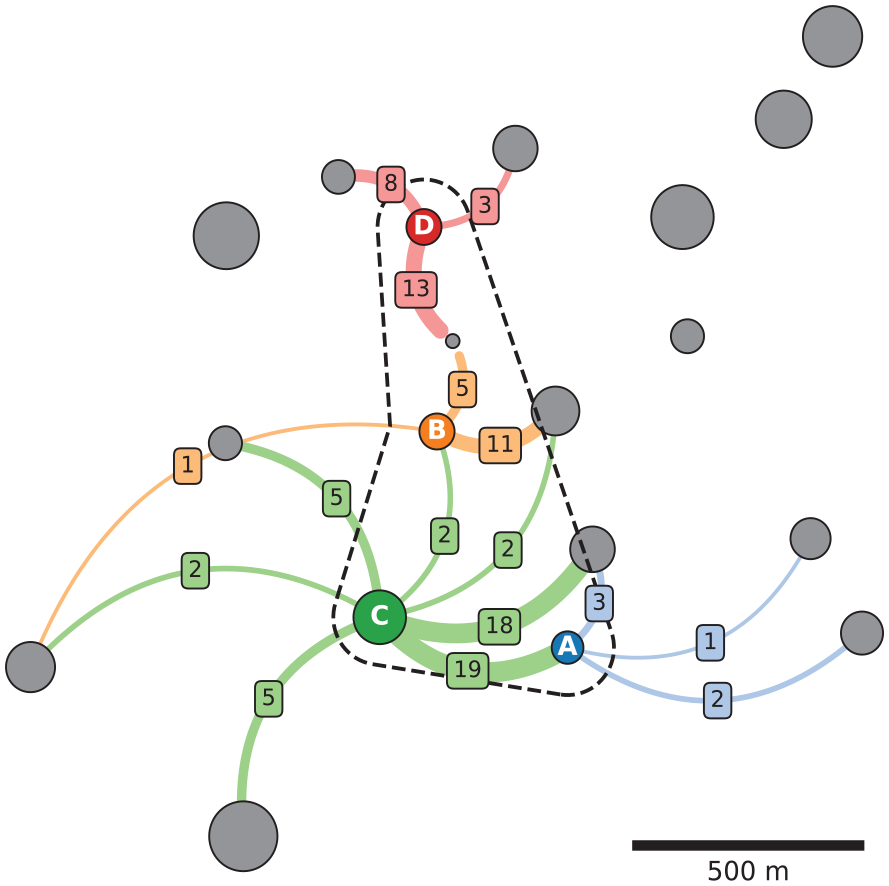
Overflow plot for one of the four-station charging zones in Figure 8.
The overflow plots also show that charging stations nearby tend to capture more overflow sessions than remote stations, reflecting the preference of EV drivers for charging their vehicles as close as possible to their initially preferred charging station. The distribution of distances between the preferred station and the overflow station eventually chosen is presented in Figure 11. The mean distance is 402 m (median 362 m), and 95% of all overflow sessions occurred within 788 m of the preferred station. Therefore, charging stations located more than roughly 800 m away from each other are unlikely to be used as alternatives, and will not have an overlapping catchment area anymore. These plots also give an insight into the potential for cannibalization (i.e., one charging station attracting charging sessions at the expense of another), which can be a useful tool for urban planners when evaluating candidate sites for new stations.
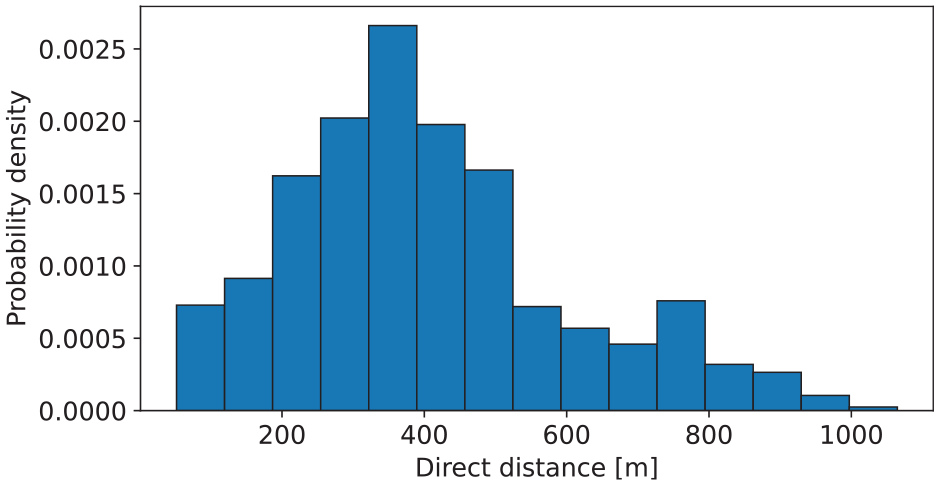
Distribution of the direct distance between the preferred station and the chosen overflow station.
Figure 12 depicts the relationship between the number of overflow sessions and the utilization rate of a charging station. To preserve the confidentiality of the data, utilization is min–max normalized between 0 and 1 (1 representing the highest utilization found and 0 the lowest) Interestingly, the scatterplot shows an exponential relationship between both variables. Overflow sessions are rarely found for stations with a low utilization level; however, as utilization increases, the number of overflow sessions tends to increase more than is proportional. High observed utilization does not guarantee more overflow, because this will still depend on the number of nearby stations available to capture overflow. Very remote charging stations will always have zero overflow sessions, because no nearby station is available to capture demand.
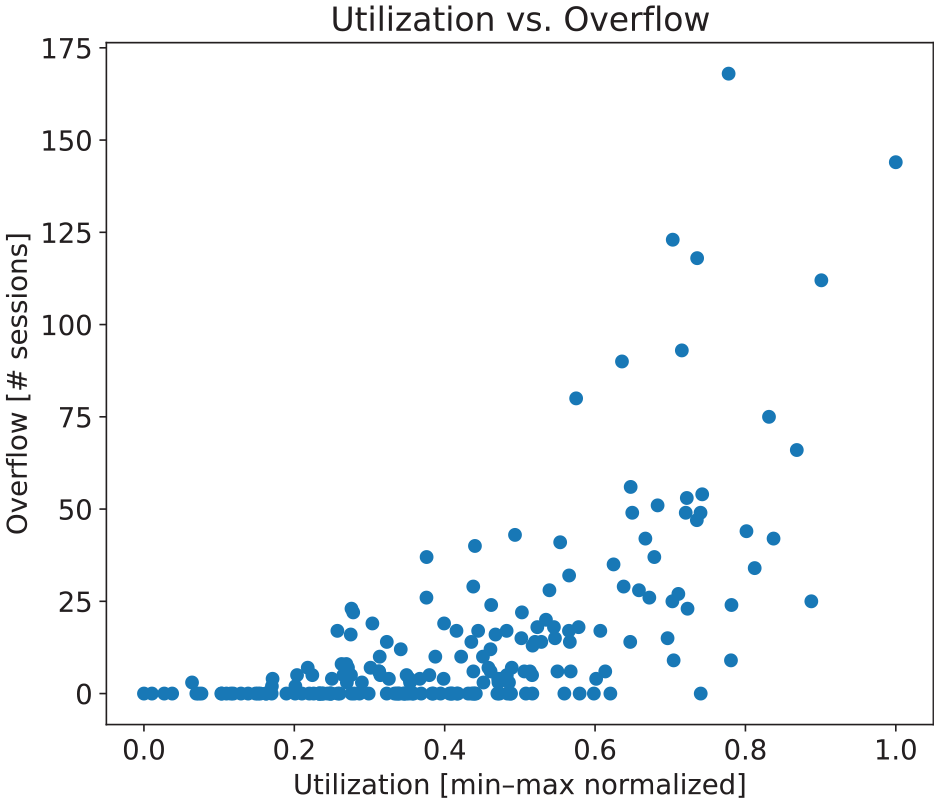
Overflow sessions versus utilization rate.
Future Growth Scenarios
Once the overflow dynamics between charging stations have been mapped, they can be used as input for the simulation model. Figure 13 shows the percentage of all sessions labeled as failed for different demand increase scenarios while keeping the charging infrastructure supply at the same level. The percentage of failed sessions is consistently lower in the overflow model compared with the baseline model, because the former assumes EV drivers will use an overflow station nearby (if available) when their preferred station is occupied.

Percentage of failed sessions per demand increase.
Given all failed sessions in a certain growth scenario, it is possible to determine the minimum number of new CPs required to reach
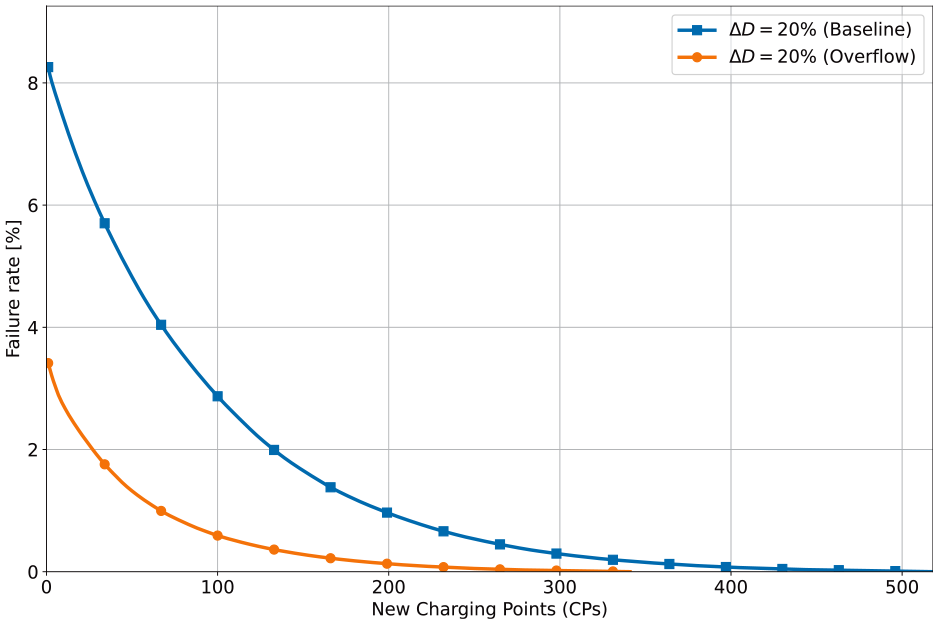
Additional CPs required for a 20% demand increase (overflow versus baseline).
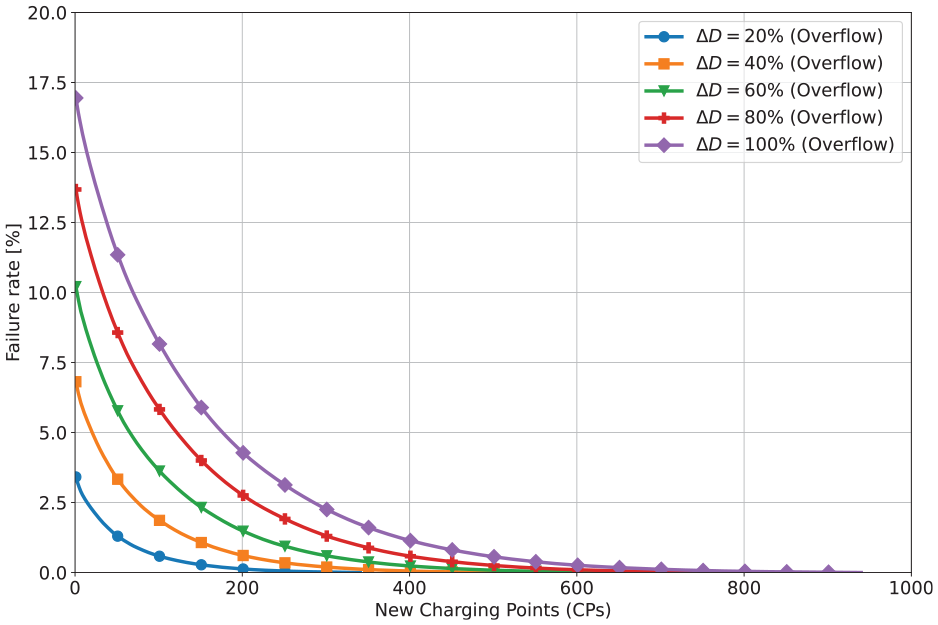
Additional CPs required for different demand increases.
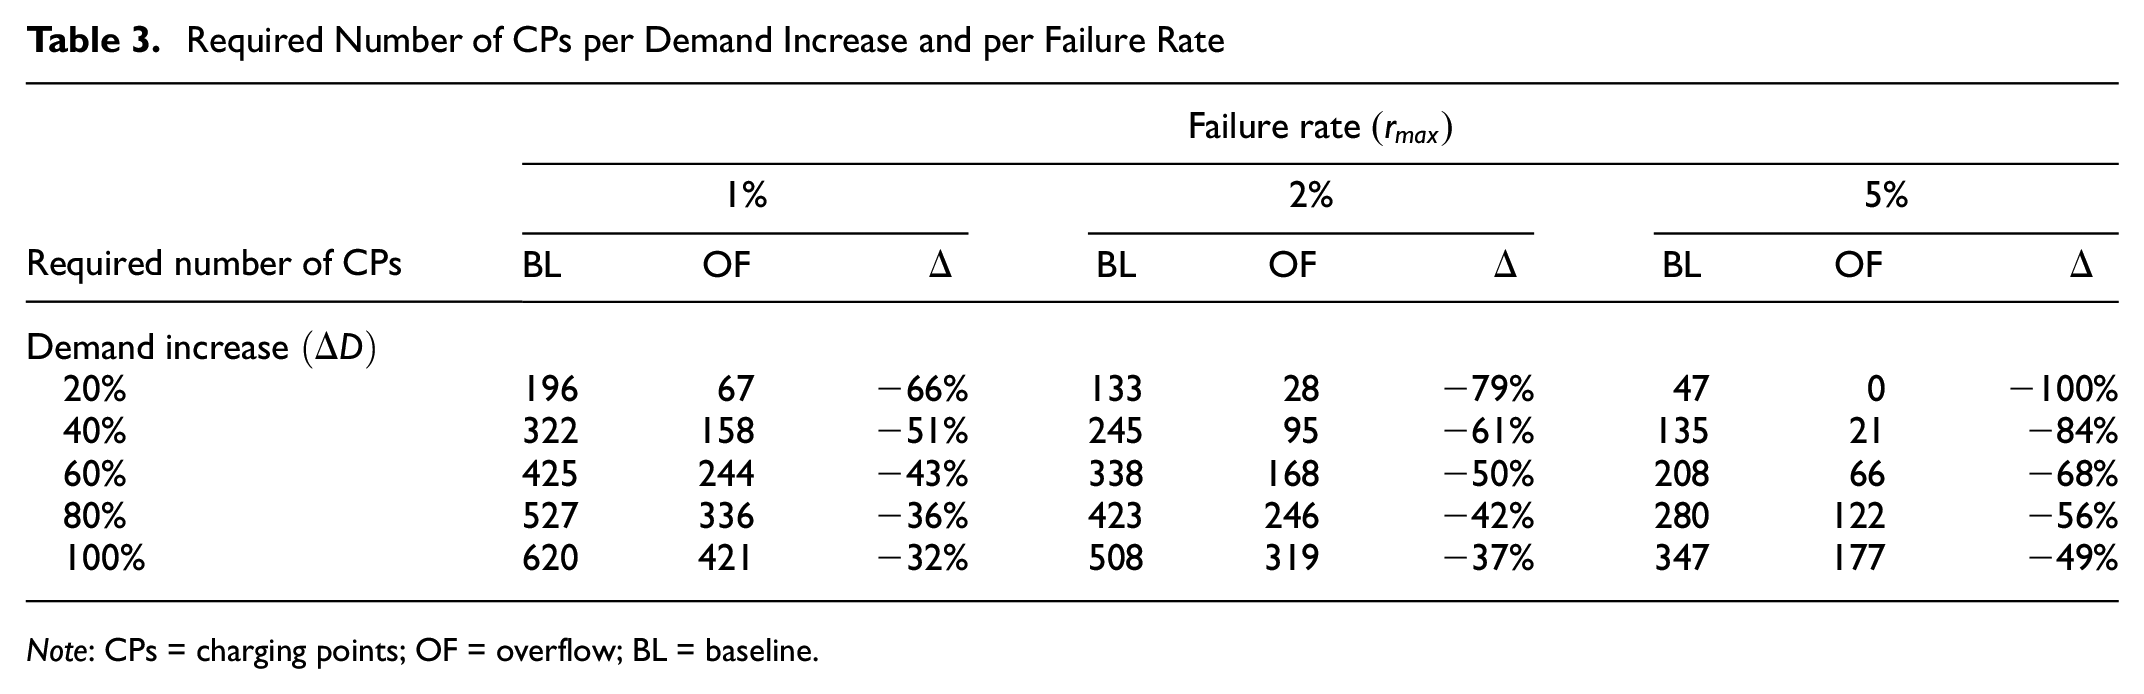
The exact number of new CPs required will depend on the failure rate that policymakers are willing to accept
Required Number of CPs per Demand Increase and per Failure Rate
Note: CPs = charging points; OF = overflow; BL = baseline.
The most suitable locations for the new CPs can also be retrieved from the model. Figure 16 shows for
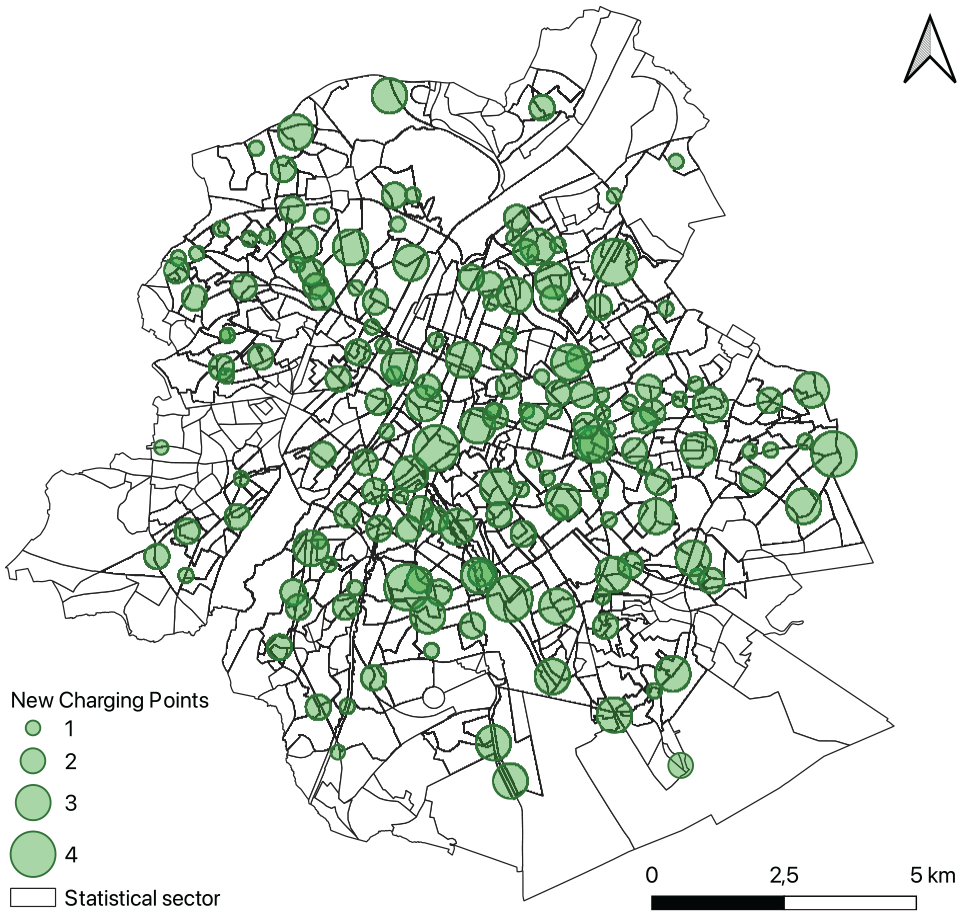
Optimal locations of new CPs for
Discussion
By grouping charging stations into zones and mining the individual charging behavior of EV drivers, we find underlying overflow dynamics between charging stations. These dynamics reveal how EV drivers behave when a preferred station is unavailable and which stations capture overflow sessions from each other. When overflow is found at a charging station, it is an indication that the true demand for this station is higher than that observed from the charging data. Hüttel et al. ( 28 ) found that this censorship bias occurs up to 61% of the time in some areas in Copenhagen, and that it reduces the performance of demand estimation models. Our study can alleviate this bias because the overflow dynamics give a more accurate view of the actual demand for charging stations.
Interestingly, it was found that the number of overflow sessions measured at a station increases more than proportional to the utilization rate of that station. Similar results were found by Helmus et al. ( 16 ), who reported a nonlinear relationship between system inconvenience (i.e., failed connection attempts) on the one hand and the number of EV drivers in the charging network on the other. However, a fundamental difference between the work of Helmus et al. ( 16 ) and the model presented in this paper is that Helmus et al. ( 16 ) measure inconvenience indirectly from running ABMs, whereas in this paper we retrieve overflow sessions directly from mining the observed charging behavior at the level of the individual EV driver.
Policymakers and CPOs can use the concept of overflow sessions to assess possible cannibalization when installing new charging stations close to existing ones. Furthermore, we found that charging stations located more than roughly 800m away from each other are unlikely to be used as alternatives for each other. This threshold distance can be used as input for urban planners when creating a charging network based on coverage (e.g., Dong et al. [ 29 ], De Clerck and Vanhaverbeke [ 30 ], Frade et al. [ 31 ]). Furthermore, CPOs can use this threshold to determine when a competing charging station is operating in the same catchment area as an existing one.
Our models show that considerably fewer CPs are required when incorporating overflow dynamics. For example, if the demand is doubled, 30%–50% fewer CPs are needed compared with when overflow dynamics are neglected (see Table 3). Ignoring the charging behavior of EV drivers overestimates the number of CPs required and results in overinvestments. At first sight, this might be nuanced because the overflow simulation model assumes that all EV drivers are willing to charge at any nearby available overflow station. In reality, this may not hold true for all EV drivers, and the true number of CPs required might be higher than reported in the overflow model. Nevertheless, the concept of overflow dynamics only considers the “instant” substitution between charging stations in the same zone. Depending on the state of charge of the vehicle and the range anxiety of the EV driver, some drivers may decide to delay the charging session and go elsewhere in the city at a different time or combine it with the next charging session. This “delayed” and “combine” type of substitution is not considered in the model and could further reduce the required number of CPs.
Determining the exact number of new CPs to be installed does not depend solely on the future growth of EVs, but is also determined by the failure rate policymakers are willing to accept. In the extreme case of reaching 0% failed sessions, a considerable number of CPs will need to be installed as demonstrated by Figure 15. This is not advisable, because a large investment would be required and the utilization would be extremely low as a result of the small share of failed sessions that each additional CP would capture. Although a too-high failure rate can result in congested charging stations and user inconvenience, having a minimum rate might be desirable. Previous research has indicated the mixed use of charging stations for both parking and charging ( 21 , 32 ) and, thus, not every transaction reflects an inherent demand for charging. Policymakers should set a failure rate that reflects their trade-off between user convenience (i.e., always being able to charge) and utilization (i.e., having charging stations that are sufficiently used).
The simulation model decides where and how many charging stations should be installed, based on reducing the number of failed charging sessions. Because this will always be region-specific, the results as presented in Table 3 and Figure 16 should not be generalized directly to other cities. However, the model itself can easily be calibrated for any city, given that transactional charging data is available. Furthermore, our model can be extended to other performance metrics besides the failure rate. For CPOs, it might be more interesting to see how many more charging stations can be installed if the expected utilization or consumed volume (kWh) of the new CPs is kept sufficiently high. Instead of deciding on a maximum allowable failed rate, a minimum required utilization rate or volume can be set. It is important to consider the overflow relations between charging stations because they reduce the costs of expanding the charging network, but still achieve the same level of performance.
Conclusions
Although most research on modeling EV charging infrastructure has been focused on designing an initial charging network, this study looks further to see how existing charging networks can be upgraded over time to keep up with future EV demand. We analyze one full year of charging transactions at 197 charging stations (394 CPs) and demonstrate how these can be used to obtain answers to the following questions: (a) How many CPs are needed for future growth scenarios? and (b) Where should those CPs be located?
The main findings of our model can be summarized as follows. First, we present a novel method for extracting overflow dynamics between charging stations empirically from transactional charging data. This enhances our understanding of charging networks and shows that to understand the charging behavior at one station, it is necessary to consider also what happens at other stations nearby. Given the detailed spatial level of the overflow plots, they can be used as a tool for evaluating candidate sites when deciding to install new charging stations. Second, we demonstrate the importance of incorporating overflow dynamics between stations. As demand increases, the required number of charging stations is found to be considerably lower when considering that EV drivers will charge at other stations nearby when a preferred station is unavailable. This reflects the ability of the charging network to capture more demand as a result of the available overflow capacity. Third, we show how the exact number of CPs required depends on the allowable failed rate, which is a trade-off between convenience and utilization, and needs to be set by policymakers.
Finally, our research has some limitations. The simulation models will decide on the optimal number of chargers and their locations based on the failed sessions registered at different stations. Thus, the recommended locations for installing new chargers are bound to the existing locations of the stations in the network. Therefore, we recommend that policymakers also install charging stations at new locations as a way of measuring demand and, subsequently, use our method to expand the charging network in a data-driven manner. In addition, the simulation of fictive charging sessions in our study is straightforward and relies on re-sampling existing sessions. More advanced methods (e.g., Lahariya et al. [ 33 ]) are available, and we plan to incorporate them into our future work. Similarly, we assume that each EV driver has a favorite station, identified as the most used station in a specific zone. This may simplify reality, because EV drivers (e.g., some visitors) might have no or even multiple favorite stations within a specific zone. A possible solution would be to differentiate between regular and random EV drivers ( 34 ) and conduct a more extensive analysis of their choice of charging station.
In future work, we plan to incorporate new evaluation metrics into the model (e.g., utilization rate and consumed volume), investigate whether an optimal failure rate can be found, and extend the model to the San Francisco region, which has a different charging location policy. In addition, there are several other promising lines for future research to investigate. First, it would be useful to analyze the trade-off between installing new stations to serve overflow and installing additional plugs directly at existing stations. Second, the concept of overflow dynamics could be of interest for map services so they can more accurately direct EV drivers to available charging stations. Third, the model can be extended to rural areas and direct current fast chargers. Finally, it would be interesting to combine our model with traditional forecasting methods.
Footnotes
Acknowledgements
We thank TotalEnergies for their contribution to the data collection.
Author Contributions
The authors confirm contribution to the paper as follows: study conception and design: S Weekx, G. Tal, L. Vanhaverbeke; data collection: S. Weeks, L. Vanhaverbeke; analysis and interpretation of results: S. Weekx, G. Tal; draft manuscript preparation: S. Weekx, G. Tal. All authors reviewed the results and approved the final version of the manuscript.
Declaration of Conflicting Interests
The author(s) declared no potential conflicts of interest with respect to the research, authorship, and/or publication of this article.
Funding
The author(s) disclosed receipt of the following financial support for the research, authorship, and/or publication of this article: S. Weekx acknowledges fellowships from the Research Foundation – Flanders (FWO) under Grant No. 11I5122N and Grant No. V411523N.
