
Abstract
Flexible culverts made of corrugated steel or plastic are cost-effective and environmentally friendly alternatives to conventional small road and railway bridges. These structures interact with the backfill by deflecting when subjected to overburden loads, enabling them to utilize the surrounding soil by carrying loads in ring compression. In low soil cover situations, the relationship between bending and backfill soil (stiffness) modulus increasingly influences bearing capacity, and therefore must be considered in design. Backfill soil modulus is a direct result of the execution of the backfilling, and recognized as the most important design parameter because of local uncertainties during construction and material variability. This paper gives a review of some of the existing methods for determining backfill soil modulus. It covers development history, theoretical approximations, aspects of crushed rock materials and their quality, and ease of use in routine design. By applying the methods on different materials and comparing the end results with a compilation of large-scale compression tests and materials from various origins, the performance of the reviewed methods is evaluated. It is found that the reviewed methods have specific drawbacks depending on the actual stress condition and backfill material being applied. In addition, most methods are based on reference laboratory tests carried out on specific and sometimes high-quality materials, and therefore fail to reflect how the quality of rock materials influences the backfill modulus. These shortcomings are used to suggest a new outlook that should be considered in future research on backfill design.
Flexible culverts or steel–soil composite bridges (SSCB) are slender pipes or arches that deflect horizontally when subjected to overburden loads, mobilizing surrounding backfill and concentrating the overburden in ring compression rather than bending ( 1 ). The phenomenon of positive soil arching also reduces overburden loads ( 2 ) (Figure 1).
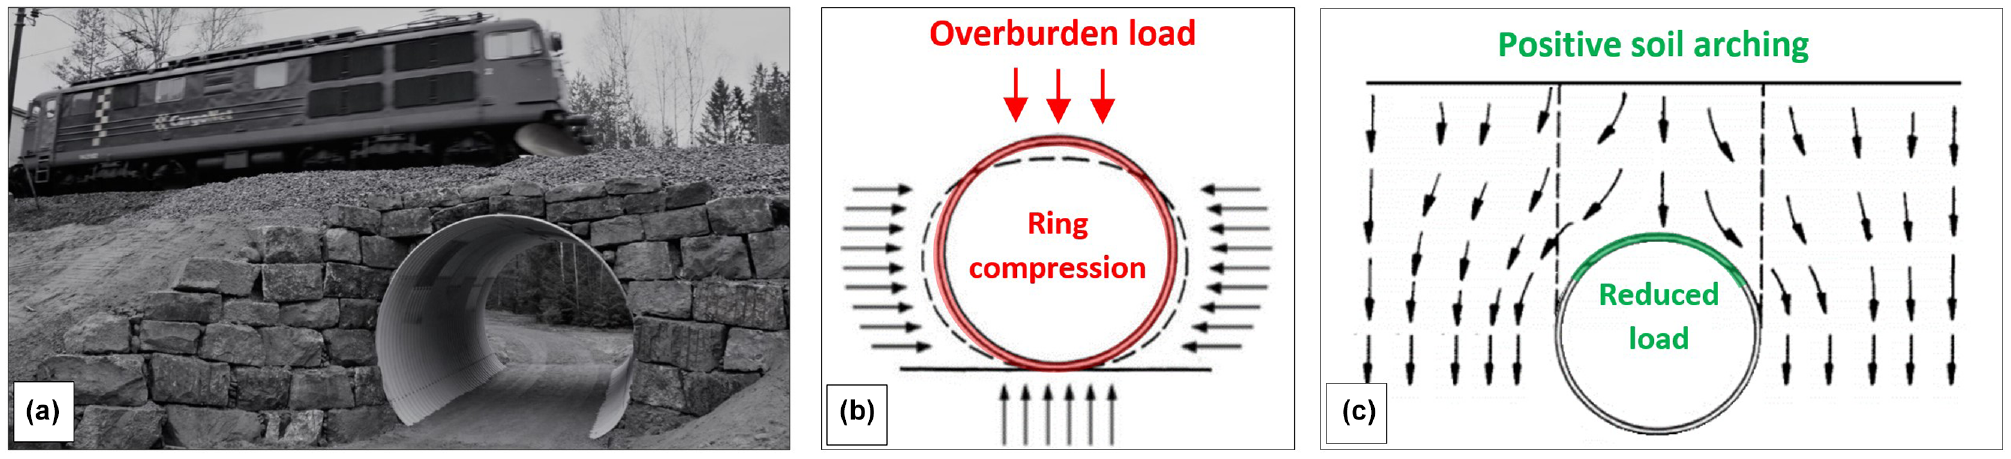
Soil–structure interaction (SSI) of: (a) railway steel–soil composite bridges (SSCB), (b) ring-compression concept, and (c) positive soil arching (ViaCon).
In design ( 3 – 7 ), the SSI-behavior (Figure 1) applies for most spans and shapes of SSCB under sufficient soil cover, with the exception of box shape (H, Figure 2).

Common shapes (a–h) of steel-soil composite bridges.
First design methods concerned relatively small steel pipes and were simplified to treating soil as linear-elastic medium that neglected any modes of bending ( 1 ). As the industry moved toward larger spans, shallower soil cover and heavier overburden loads, bending modes were introduced into design, emphasizing the need to also consider backfill soil modulus.
Attempts to systemize the backfill modulus have evolved from simple site observations and engineering judgment, to actual laboratory tests and a hyperbolic soil model ( 3 – 7 ).
These approaches are semi-empirical at best and use standard geotechnical soil definitions for assessing material quality. They refer to old laboratory tests done before the access to high-quality natural deposited fill materials became depleted ( 8 ), which recently has forced some countries to replace over 80% of natural sand/gravel with crushed (manufactured) rock aggregates ( 9 ).
The rapid shift in material usage suggests there is a need for future backfill design to adapt and consider the possibility that the quality envisioned in existing methods is sometimes not met ( 10 ).
This paper reviews existing backfill design from the North America and Scandinavia, and concerns development history, theoretical approximations, aspects of material variability and ease of use in routine design.
History and Development of Backfill Design
White and Layer introduced the ring-compression concept in 1960, stating that a flexible pipe under sufficient soil cover and quality backfill would be confined when subjected to overburden loads, causing the overburden to be carried in ring compression rather than bending, disregarding backfill soil modulus ( 1 ).
As bending modes were introduced, most authors agreed they relate to some relationship between backfill modulus and structure bending stiffness, often labeled as the flexibility number ( 2 , 5 , 11–13).

where λ = flexibility number, Es = backfill soil modulus (kPa), D = culvert span (m), EI = bending stiffness (Nm2).
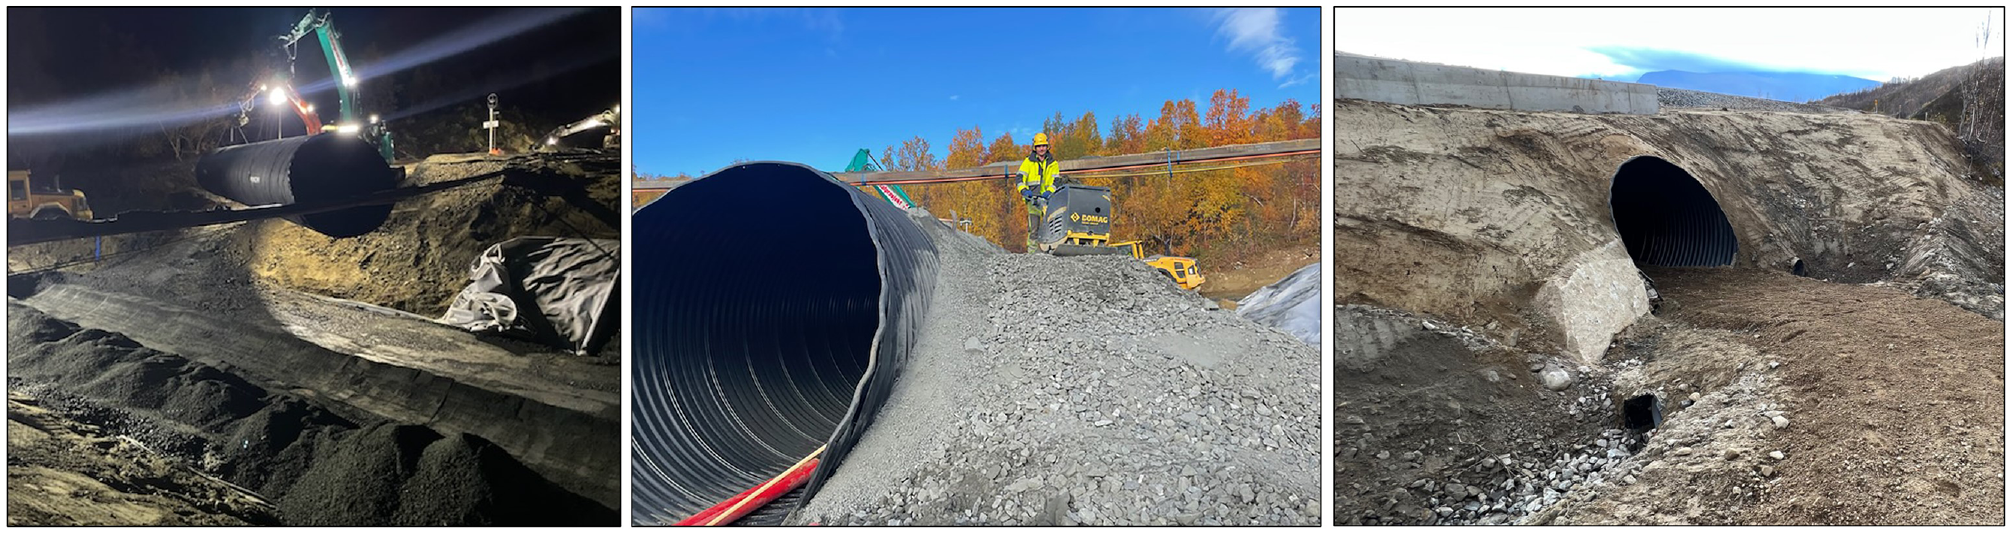
Backfill modulus (Es) represents the soil’s ability to resist the culvert wall from deflecting, and is related to material quality, layer thickness, compaction effort, and soil cover, which are affected by local variations at the actual construction site (Figures 3–8).

Backfill of natural deposited, sandy gravel. Dovre structure, Norway 1985 ( 2 ).
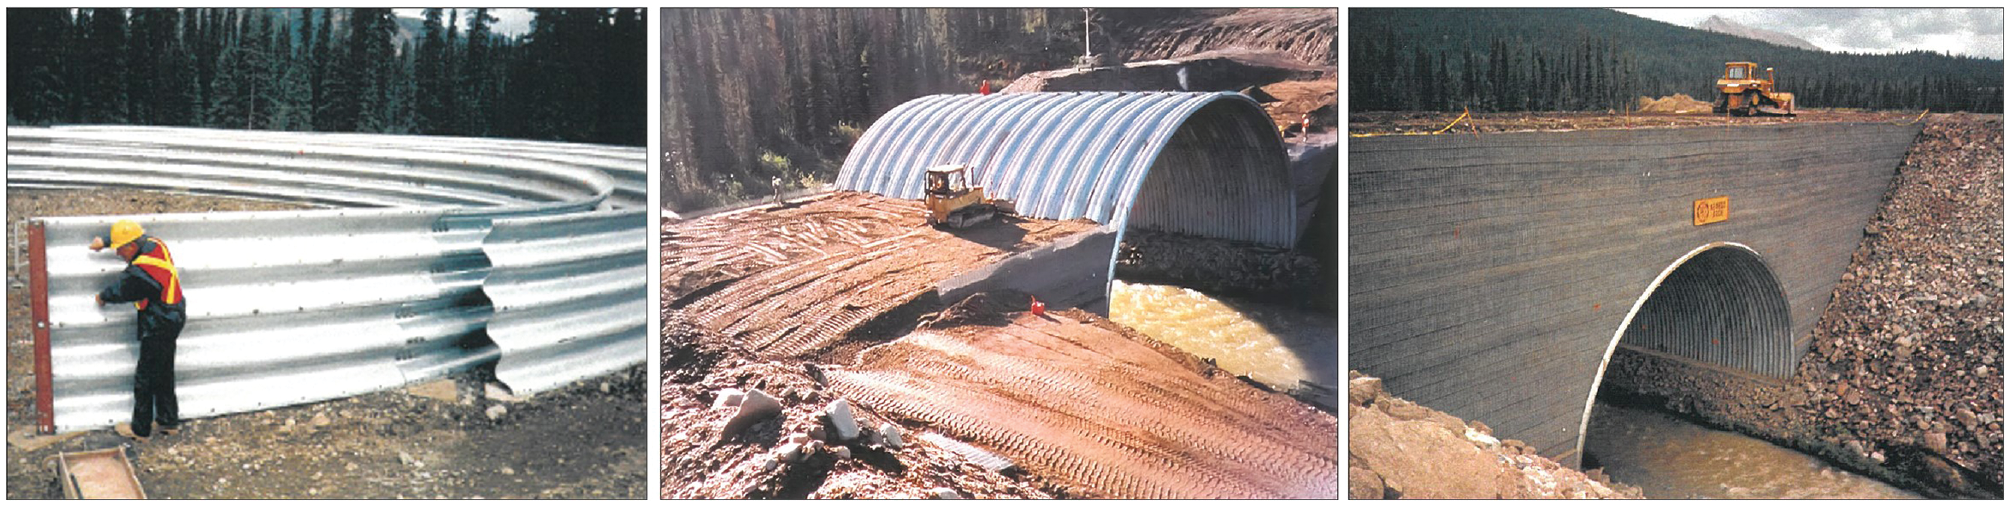
Backfill of natural deposited, sandy gravel. Kemess Creek, Canada 1997 ( 14 ).

Backfill of natural deposited, sandy gravel. Bystrzyca Dusznicka river, Poland 2001 ( 15 ).
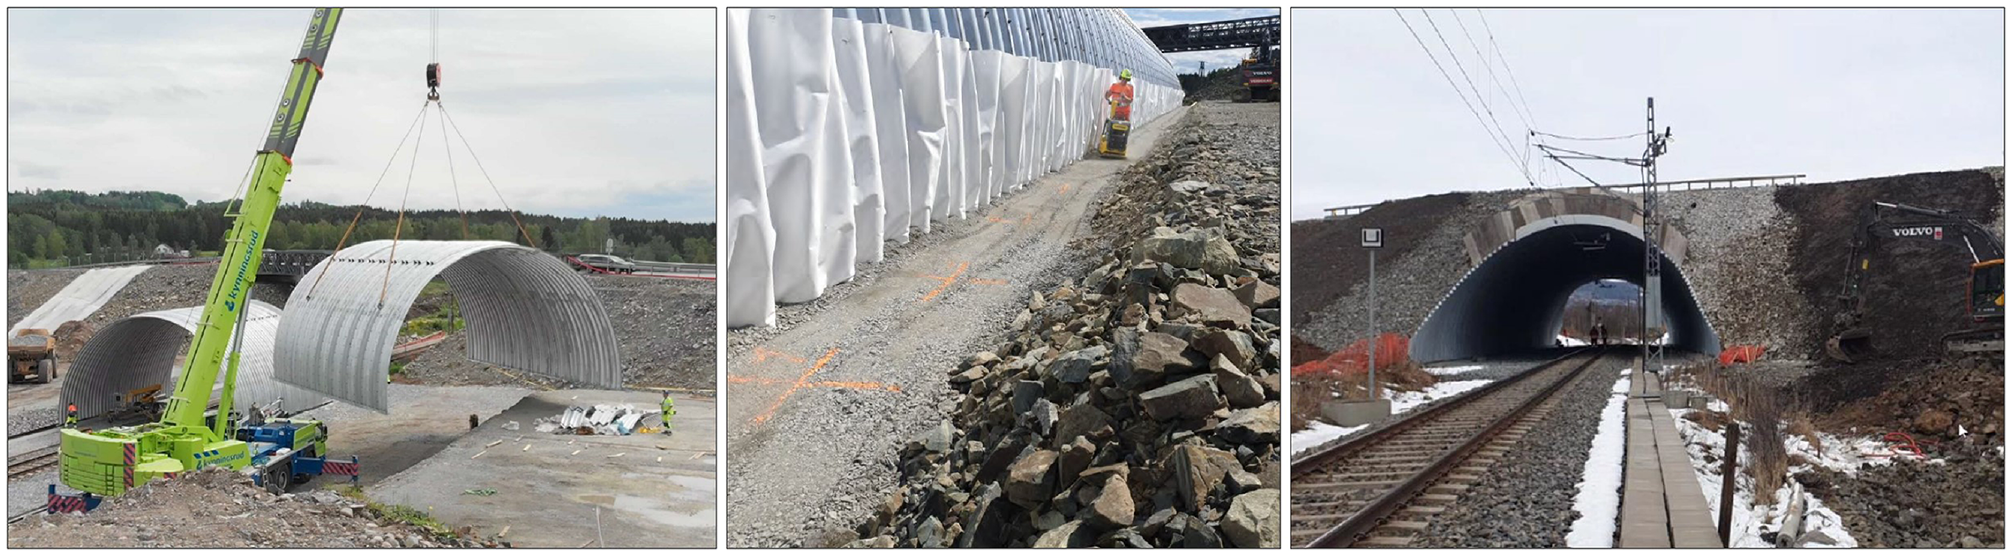
Backfill of crushed rock. Tjernli bridge, Norway 2019 (ViaCon).
Backfill of crushed rock. Bolna railway culvert, Norway 2022 (Multiconsult).

Backfill of crushed rock. Raudsann culvert, Norway 2022 (ViaCon).
Backfill modulus is defined as the average soil modulus around the culvert instantly after backfill completion when soil compressibility most likely is at its highest ( 2 , 5 , 11 , 13 ).
First attempts to systemize the modulus evolved from actual site observations and back-calculation of pipe deflection measurements under various field conditions, systemizing backfill materials by referring them to the Unified Soil Classification System (USCS) soil groups and optimum density ( 6 ).
Duncan and Chang introduced a hyperbolic relationship for the stress-dependent tangent Young’s modulus ( 16 ), that was later adopted by several methods ( 3 , 5 , 7 ).
The following sections show the development of well-established backfill design.
Experience-Based Design
Experience-based design involves methods developed from systemized site observations, where backfill materials are referenced to USCS soil groups and relative Proctor density.
Howard’s Table
Howard systemized backfill soil modulus by back-calculation, using Watkins and Sprangler’s “Iowa formula” on many sites to express backfill modulus as an elastic-type parameter

where Δx = horizontal deflection of pipe (m), D1 = deflection lag factor, K = bedding constant, Wp = load on pipe (kPa), R = pipe radius (m), E’ = modulus of soil reaction (kPa).
The following were compiled into Table 1, known as “Howard’s table” ( 6 ).
Howard’s Characteristic Design Values for Modulus of Soil Reaction (E’) ( 6 )
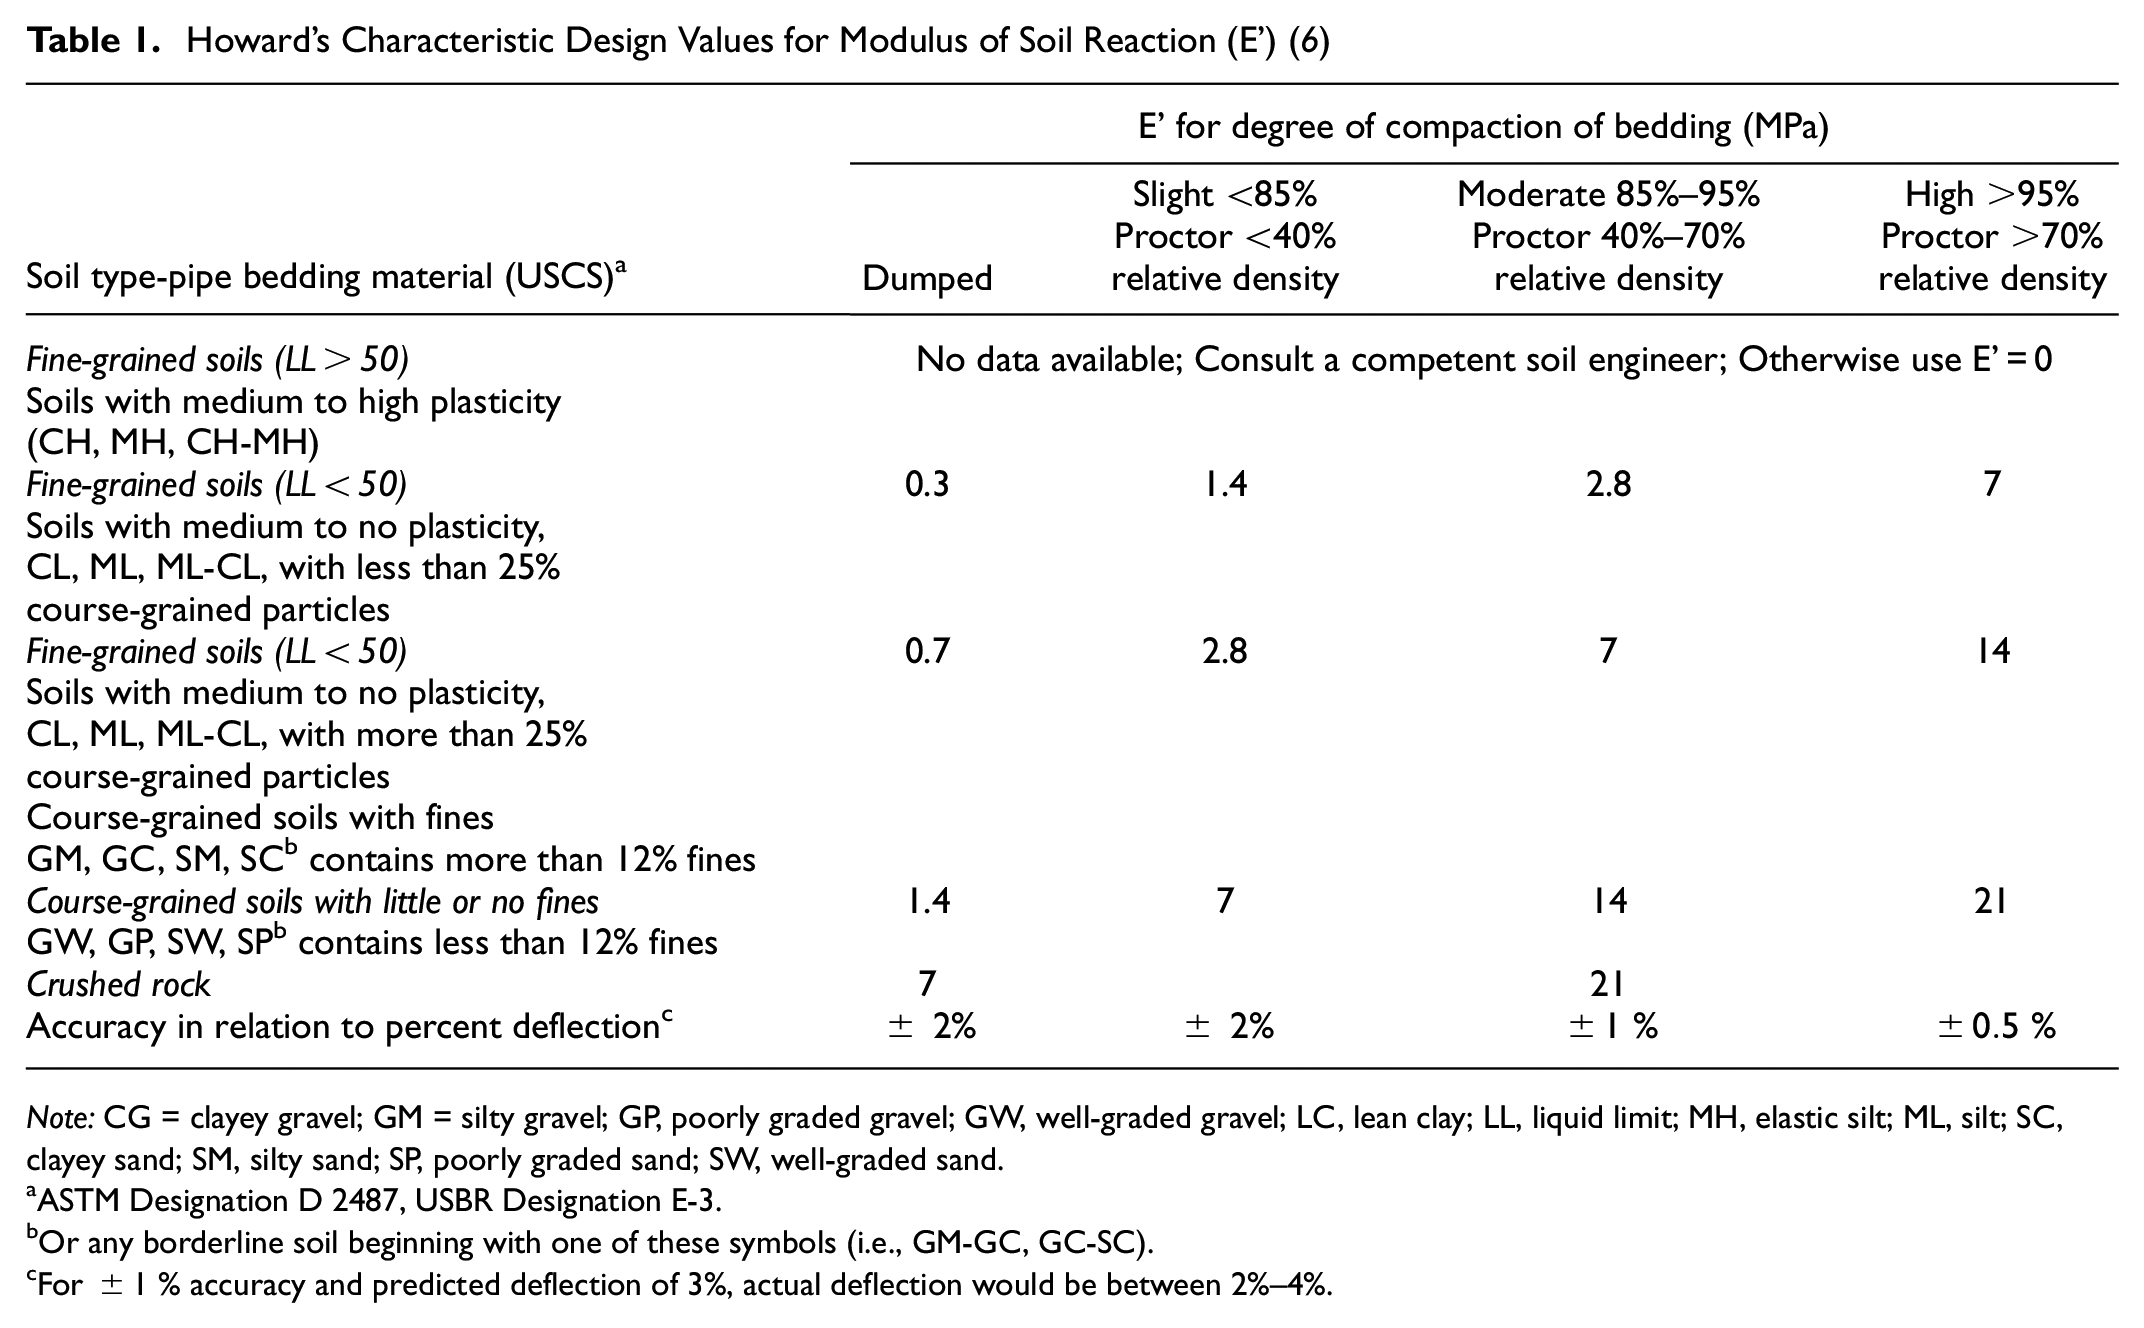
Note: CG = clayey gravel; GM = silty gravel; GP, poorly graded gravel; GW, well-graded gravel; LC, lean clay; LL, liquid limit; MH, elastic silt; ML, silt; SC, clayey sand; SM, silty sand; SP, poorly graded sand; SW, well-graded sand.
ASTM Designation D 2487, USBR Designation E-3.
Or any borderline soil beginning with one of these symbols (i.e., GM-GC, GC-SC).
For
Howard’s table returns mean values and was initially adopted by the American design code AASHTO, but later replaced by McGrath’s modified hyperbolic and incremental secant modulus approach ( 17 ).
CHBDC
The Canadian Highway Bridge Design Code (CHBDC) adopts experience-based backfill modulus made from a compilation of literature, laboratory tests, field reports and finite element (FE) analyses, from which Table 2 for stress-independent backfill modulus were created ( 4 ).
Canadian Highway Bridge Design Code Design Values of Es for Various Soils

Note: GC, clayey gravel; GM, silty gravel; GP, poorly graded gravel; GW, well-graded gravel; SC, clayey sand; SM, silty sand; SP, poorly graded sand; SW, well-graded sand.
These secant moduli apply for both small
Hyperbolic Soil Model
Duncan–Chang’s hyperbolic soil model uses nine separate parameters to define a stress-dependent tangent Young’s modulus ( 16 ). It assumes that soil is initially confined by a hydrostatic pressure (σ3) and subjected to an increasing axial stress that returns a combined stress state (Figure 9c).

Stress condition showing: (a) initial stress, (b) deviatoric stress, and (c) combined stress state.
Each soil increment is treated by means of Hooke’s generalized law of elastic deformation. By expressing stress-dependent elastic Young’s modulus, the model accounts for nonlinearity and is often assumed to be valid for small soil movements up to shear failure ( 16 , 18 ).
The model consists of Janbu’s modulus concept for initial stiffness and confinement, Coulomb-envelope for shear criterion, and Kodner’s hyperbola for non-linear stress–strain behavior ( 19 , 20 ) (Figure 10).
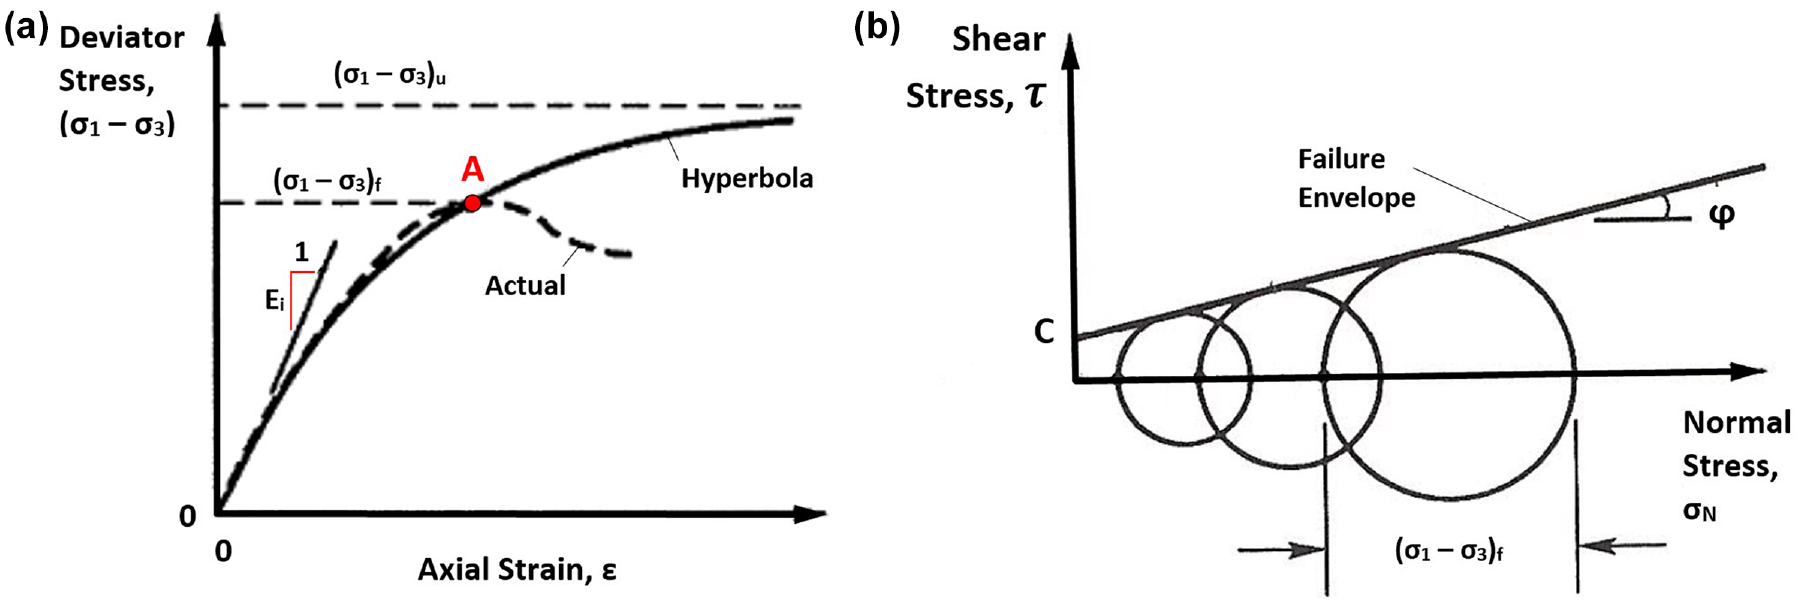
Model conditions showing: (a) Kondner’s hyperbola and (b) Coulomb shear failure criterion.
Janbu’s modulus concept for elastic modulus

Kondner’s hyperbola ( 20 ) for stress–strain relationship up to failure

The hyperbola gives a relationship up to the soil failure point A (Figure 10a). By introducing a failure ratio and expressing the shear failure via a Coulomb criterion, the relationship between failure and ultimate deviatoric stress was expressed ( 16 )

and
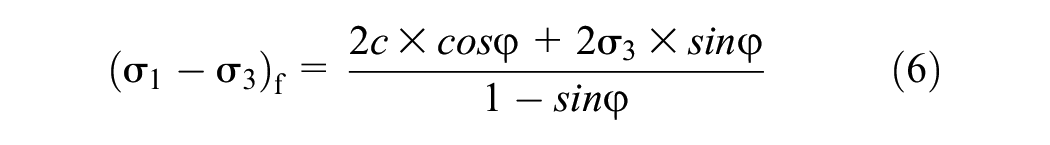
Equation 4 was finalized by factoring out strain, returning an initial condition that is only expressed by stress and that is valid for any strain up to shear failure.
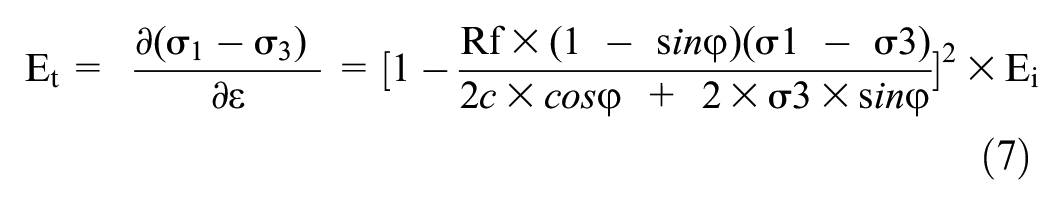
where Pa = atmospheric pressure (Pa≈100 kPa), K = modulus number, n = stress exponent, σ1 = major principal stress (kPa), σ3 = minor principal stress (kPa), εv = axial strain, Ei = initial tangent modulus (kPa), (σ1−σ3)u = ultimate deviatoric stress, (σ1−σ3)f = failure deviatoric stress, Rf = failure ratio, c = mobilized cohesion (kPa), φ = Mobilized friction (°).
Equation 7 returns the incremental tangent Young’s modulus for any stress state, up to shear failure. A set of design parameters for compacted soils can be obtained by curve-fitting the hyperbola from an actual laboratory test, which returns the stress-dependent Young’s modulus for that given soil.
SCI Method
Duncan adopted the hyperbolic soil model by assigning characteristic soil coefficients interpreted from 41 high-quality triaxial tests. By curve-fitting each test (Figure 10a), it was possible to assign characteristic soil parameters to USCS soil groups referencing degree of Proctor compaction ( 5 , 11 , 16 , 18 ).
Each triaxial test was matched to a hyperbola at two points corresponding to 70 and 95% of the soils mobilized strength, and transformed into a linearized plot to interpret Ei and (σ1−σ3)u (Figure 11).


Principle of: (a) curve-fitting and (b) linear transformation and interpretation.
It was observed that hyperbolic coefficients varied quite extensively in each test, and modulus number was found to be closely linked to relative density, soil gradation, particle shape and mineralogy. For design purposes, however, lower-bound characteristic parameters were chosen ( 18 ).
In finalizing the Soil Culvert Interaction (SCI) method, Duncan used FE-analyses to suggest a stress condition at quarter vicinity of culvert that was approximately equal to the average stress around the entire culvert ( 5 ). This stress condition and hyperbolic coefficients were used to finalize relationships between soil secant modulus, soil cover, and degree of standard Proctor (Figure 12).
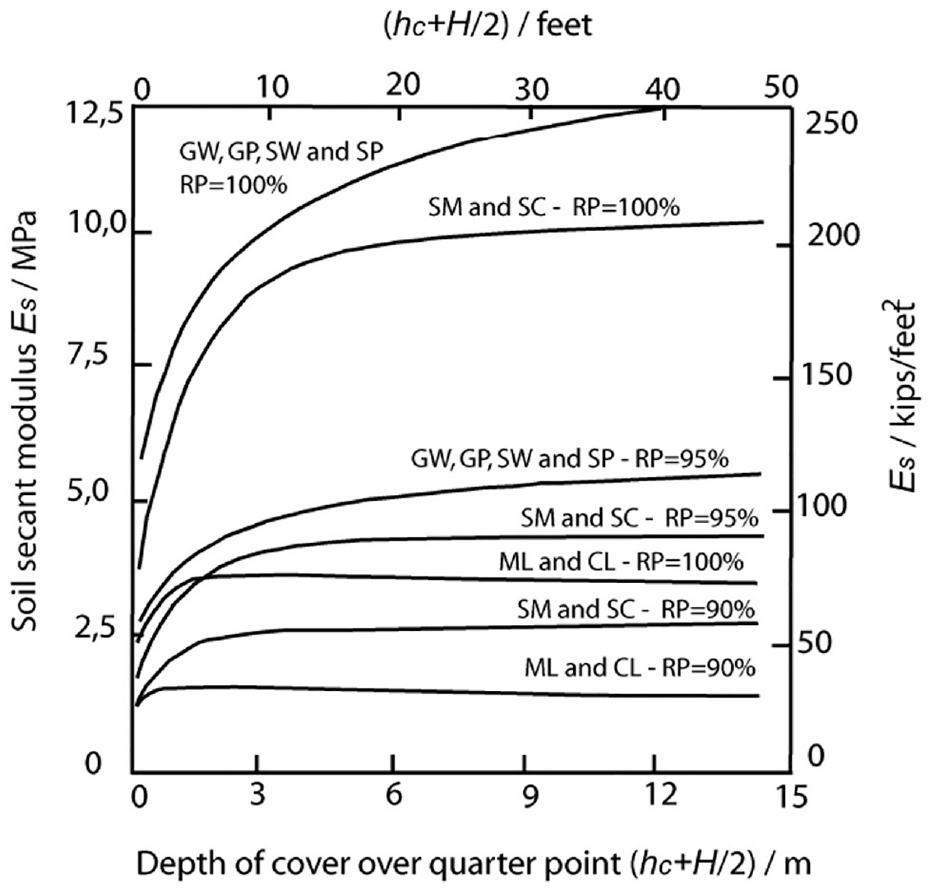
Secant soil modulus according to SCI, altered into SI units ( 21 ).
AASHTO Method
First AASHTO versions incorporated Howard’s table, but the variation in installation effects, soil behavior, and pipe properties made it difficult to comprehend E’ further ( 17 ).
AASHTO later replaced Howard’s table with McGrath’s hyperbolic approach, that suggested backfill soil modulus was closer related to constrained modulus (Ms) than elastic modulus (Ei), and that Selig’s proposed expression for bulk modulus (Equation 9) could be used to alter Duncan–Chang’s hyperbolic soil model (Equation 7) ( 3 , 22 , 23 ).

where Bi = initial tangent bulk modulus (kPa), εu = ultimate volumetric strain, σm = mean stress = (σ1 + 2σ3)/3 (kPa).
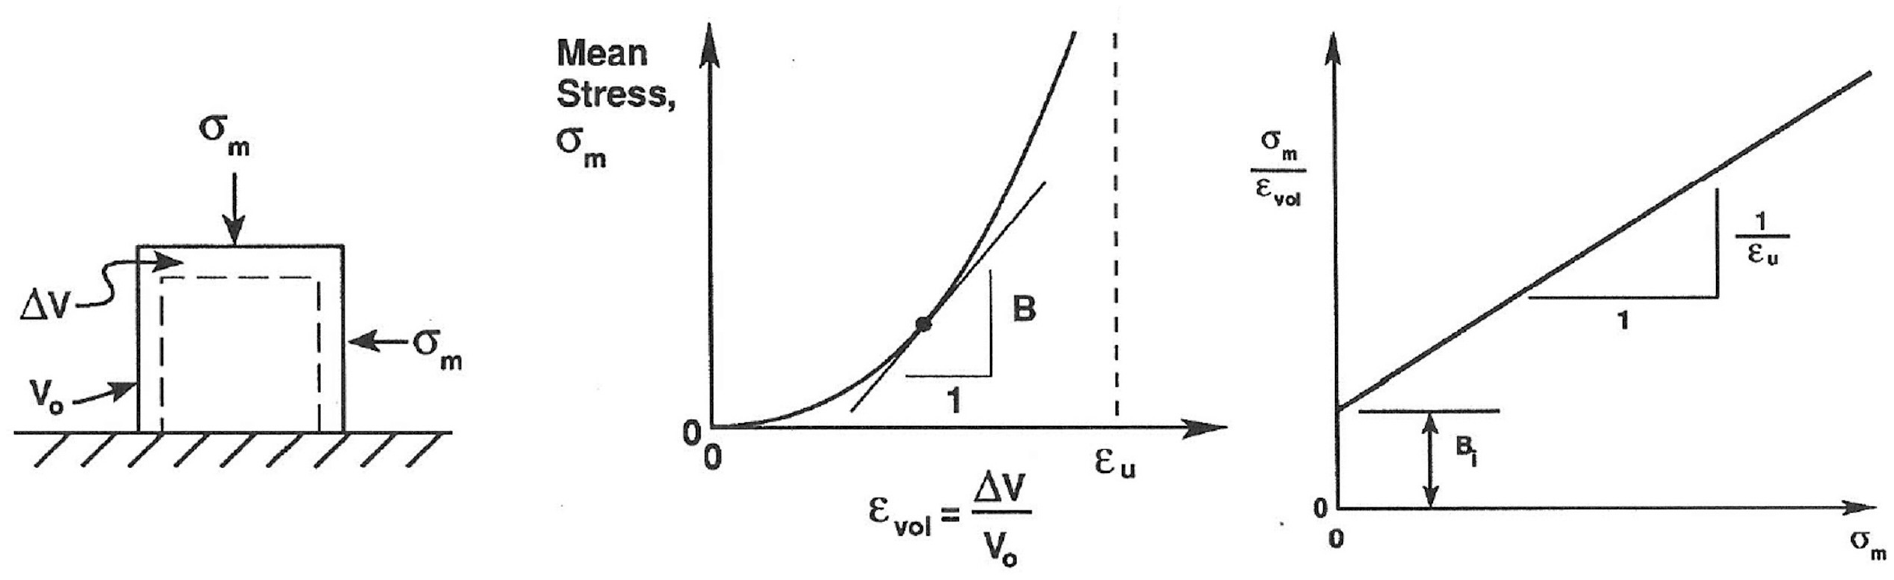
Selig’s hydrostatic condition for bulk modulus, assuming an increasing confining pressure that is equal in all directions, followed by linear transformation of a hyperbola and bulk modulus
Selig first used Equation 9 to interpret a new set of hyperbolic coefficients as an alternative to Duncan’s ( 22 ). McGrath ( 23 ) later introduced the E’≈ Ms assumption together with Equation 9, that introduces

and the relationships in Equations 9 and 10 inserted into Equations 3, 4 and 6
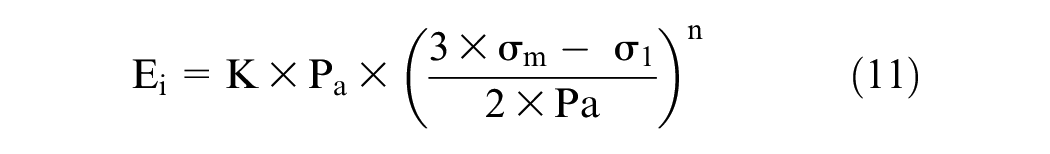

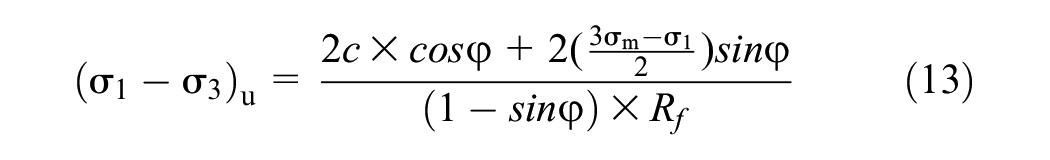
By inserting Equations 11 and 13 into 12, the major principal stress (σ1) could be expressed by vertical strain and hyperbolic coefficients

Assuming constant soil friction at any stress level, Equation 14 can be solved for any one-dimensional stress–strain relationship, given that hyperbolic coefficients (K and n) are available.
Selig’s coefficients were compared with Howard’s table by McGrath, where consistency was found between Selig’s and Howard’s E’-values, but not Duncan’s. Despite Howard’s values not being true, they included a larger amount of field data and variability than Duncan’s, and therefore expected to be closer to mean values (i.e., less conservative) ( 23 ).
McGrath finalized the AASHTO approach by using Selig’s hyperbolic coefficients ( 22 ) and Equation 14, by developing stress–strain curves for USCS soil groups and selecting incremental secant soil moduli as a function of stress ( 11 , 23 , 24 ) (Figure 14 and Table 3).
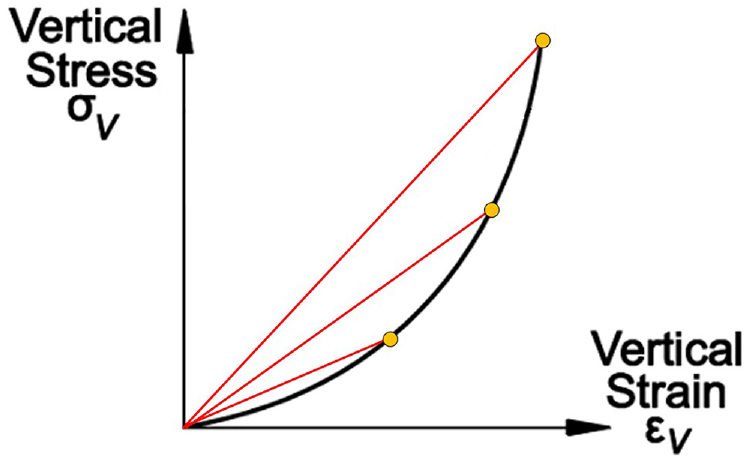
Principle of one-dimensional stress–strain and incremental secant soil modulus.
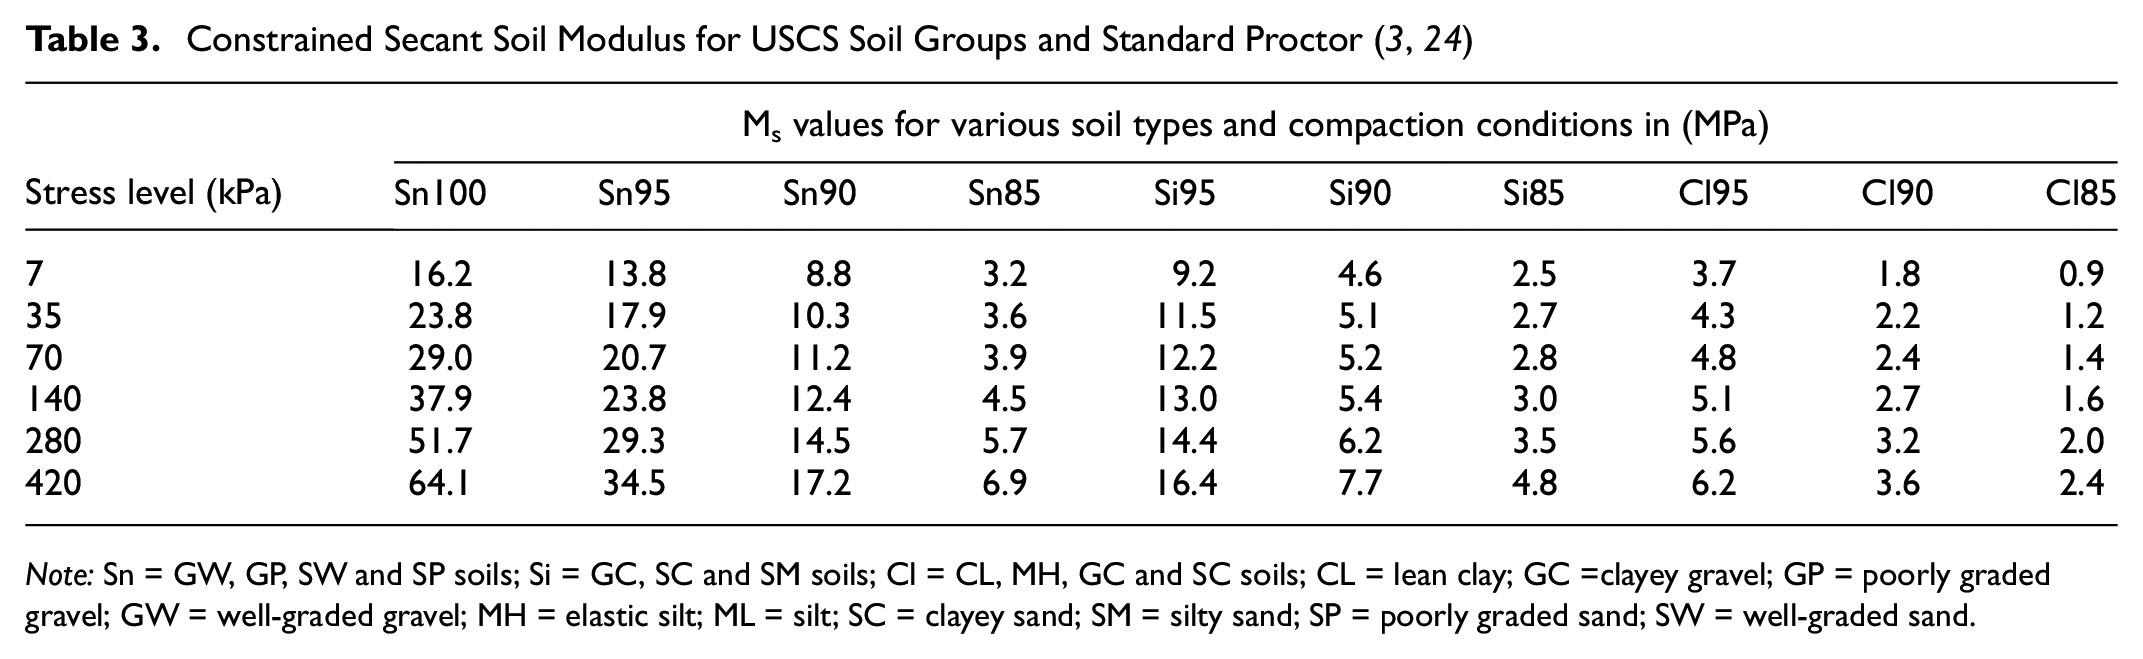
Note: Sn = GW, GP, SW and SP soils; Si = GC, SC and SM soils; Cl = CL, MH, GC and SC soils; CL = lean clay; GC =clayey gravel; GP = poorly graded gravel; GW = well-graded gravel; MH = elastic silt; ML = silt; SC = clayey sand; SM = silty sand; SP = poorly graded sand; SW = well-graded sand.
Swedish Design Method (SDM)
SDM has two backfill design systems, “Method A” that alters Duncan’s original SCI method (Figure 12), and “Method B” that rewrites Duncan–Chang’s hyperbolic relationships (Equation 7) and introduces a statistical expression for modulus number and stress exponent ( 7 , 13 , 25 ).
Method A was obtained by back-calculating Duncan’s secant soil modulus curves,
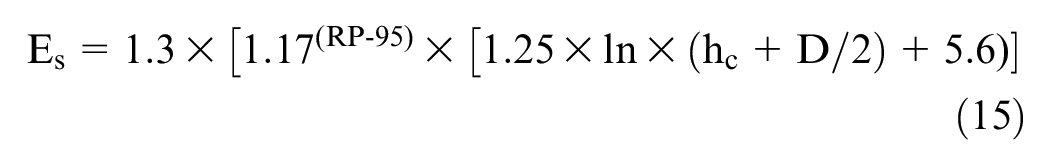
where Es = secant soil modulus (kPa), RP = standard Proctor (%), hc = soil cover (m), D/2 = culvert radius.
Method B was introduced as a less conservative alternative to previous methods, and generally expects the designer to have detailed information about optimal density, grain size, and soil gradation, but with the following limitations:
Particle size distribution (d10, d50, d60) are available, but limited to:

Optimum density (ρopt) and degree of compaction are available.
By expressing rest coefficient with Jaky and Poisson ratio, Petterson established a relationship between Young’s modulus and confined modulus by assuming linear elasticity.


returning
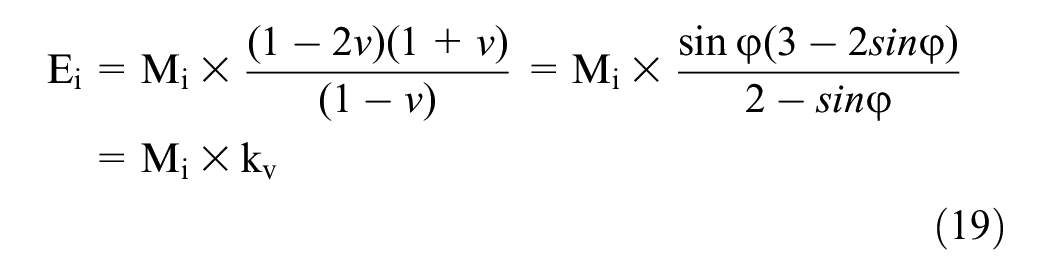
and confined soil modulus according to Janbu ( 19 )

Inserted into Equation 7 and assuming a minor principal stress state (σ’ = σ3’), returns
where Mi = initial confined soil modulus, m = modulus number, a = stress exponent, K0’ = rest pressure coefficient, v = Poisson ratio, kv = notation and where hyperbolic coefficients (m, a) were previously expressed by Andrèasson ( 25 ), from a compilation of various compression tests and regression analyses.
To reference Andrèasson, the minor principal stress state in Equation 21 was transformed back into major stress by Petterson, using rest pressure (Equation 16). In addition, a stress state was also assigned at quarter vicinity of culvert, including Vaslestad’s arching factor

where arching according to Vaslestad ( 2 ) is expressed as


where
where Sar = arching factor, κ = arching coefficient and Sv = friction number.
Returning the main equation of ‘Method B’
Andrèasson suggested that modulus number and stress exponent were primarily governed by soil density (ϒ), soil gradation (Cu), grain size (d50), and grain shape. A sensitivity analysis suggested that expressing modulus number via void ratio and uniformity coefficient would minimize the influence of grain shape ( 25 ).
Andrèasson observed that his relationships for modulus number varied quite significantly between course and fine materials (defined as d50 < 5 mm or d50 > 5 mm), and therefore created two separate expressions for modulus numbers.
For simplicity, Petterson used Andrèasson’s average expression of modulus number instead, and assigned a unit weight of solids at 26 kN/m3 as default ( 7 , 13 )


Material Quality and Stiffness
Properties and quality of backfill materials in existing methods have been defined using geotechnical soil definitions, which normally do not take into account other aspects of material quality like particle shape and brittleness. This chapter studies the influence of material quality on soil modulus by compiling large-scale compression tests performed on gravels, rock, and waste rock materials of various origins ( 25 – 28 ).
The study concludes that material quality is better controlled by knowing the properties of particle shape (roundness and elongation) and brittleness, in addition to conventional geotechnical soil definitions.
Soil Definitions
Today’s backfill design systems apply traditional geotechnical soil definitions from usually AASHTO, ASTM or ISO for assessing materials. In Europe, ISO definitions are used for most geotechnical problems, classifying soil based on grain size composition or fraction (Figure 15), and described by ascribing one or several adjectives.

Primary fraction of soils according to ISO-14688-1:2017 ( 29 ).
Composition in ISO terms means either soil gradation (Uniform Cu < 3, medium
In the United States and Canada, however, backfill design refers to soil groups according to USCS instead, by either ASTM D2487 or AASHTO M-145 definitions. Both definitions distinguish sands from gravels if more than 50% of soil fraction retains on or above sieve No. 4 (4.75 mm).
It is important to highlight that the gradation and composition criteria for assigning a soil group according to AASHTO differs quite a lot from the criteria set by ASTM, that limits to a smaller range of material compositions allowed into the same soil group.
Natural Deposited and Crushed Materials
Traditional ISO definitions (Figure 15) primarily originated from natural deposited soils, whereas crushed, recycled, or waste rock do not have established definitions, despite crushed rock already being extensively used in backfills (cf. Figures 3–8). It is therefore important that clear definitions of “sand” and “gravel” are established for crushed rock before comparing their quality to other backfill materials.
ISO definitions are here thought to be the best choice for both natural deposited and crushed rock materials, as particle shape can be used to distinguish most crushed rock materials from natural deposited ones (Figure 16).

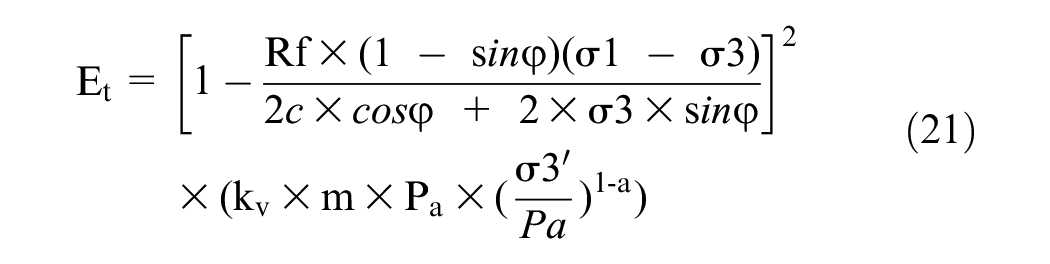
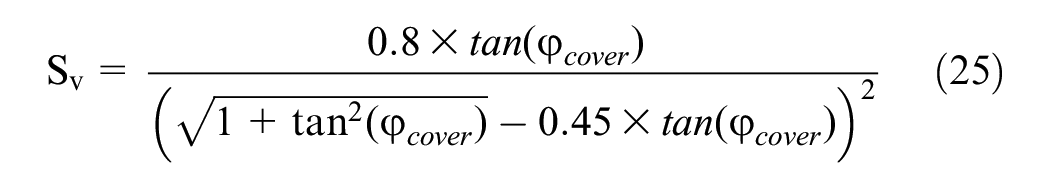
Coarse gravels of: (a) natural deposit and (b) crushed rock (cf. ISO definitions) ( 30 ).
With respect to shape, natural deposited materials have a round to sub-rounded characteristic, whereas crushed rock more often has an angular to sub-angular shape.
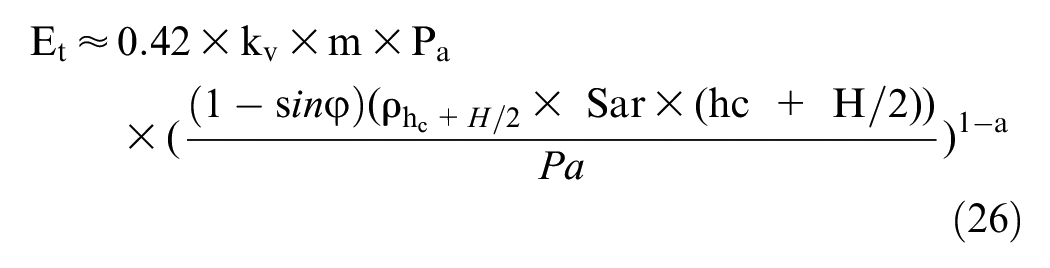
Moreover, shape is also associated with the crushing technology itself, and primary and secondary crushing cycles normally return angular materials (Figure 16b). Under some circumstances, however, like in the concrete industry, third and fourth crushing cycles can be applied to obtain high-quality aggregates with round particles, minimizing the difference between natural deposited and crushed rock (Figure 17).
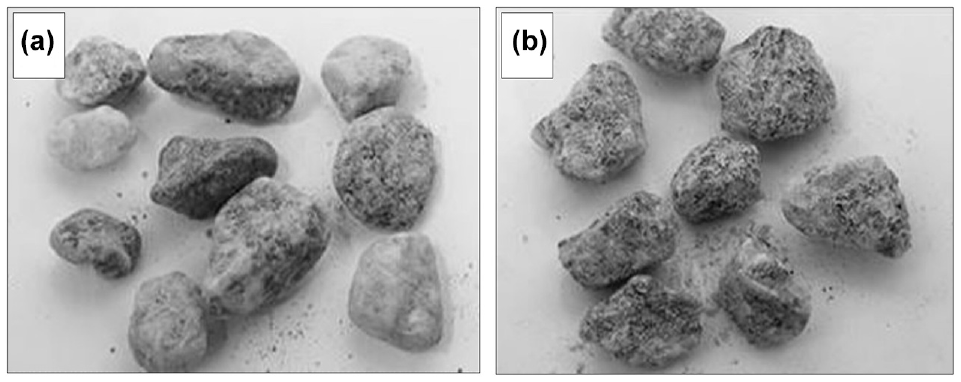
High-quality aggregates from: (a) natural deposit, and (b) crushing plant ( 30 ).
It is therefore the authors’ opinion that ISO definitions can also be applied to crushed materials, and that quality is better assessed by including the properties of grain shape (i.e., roundness and elongation) in addition to geotechnical soil definitions.
Large-Scale Compression Tests
A set of large-scale one-dimensional compression tests were compiled and studied in relation to material quality, grain shape, and soil modulus by means of Janbu’s modulus concept (Equation 20 and Tables 4 and 5).

Note: D&B = drill and blast; n0 = before test; n1 = after test; NA = not applicable; TBM = tunnel boring machine.
Large-scale Laboratory tests from PPI ( 27 )
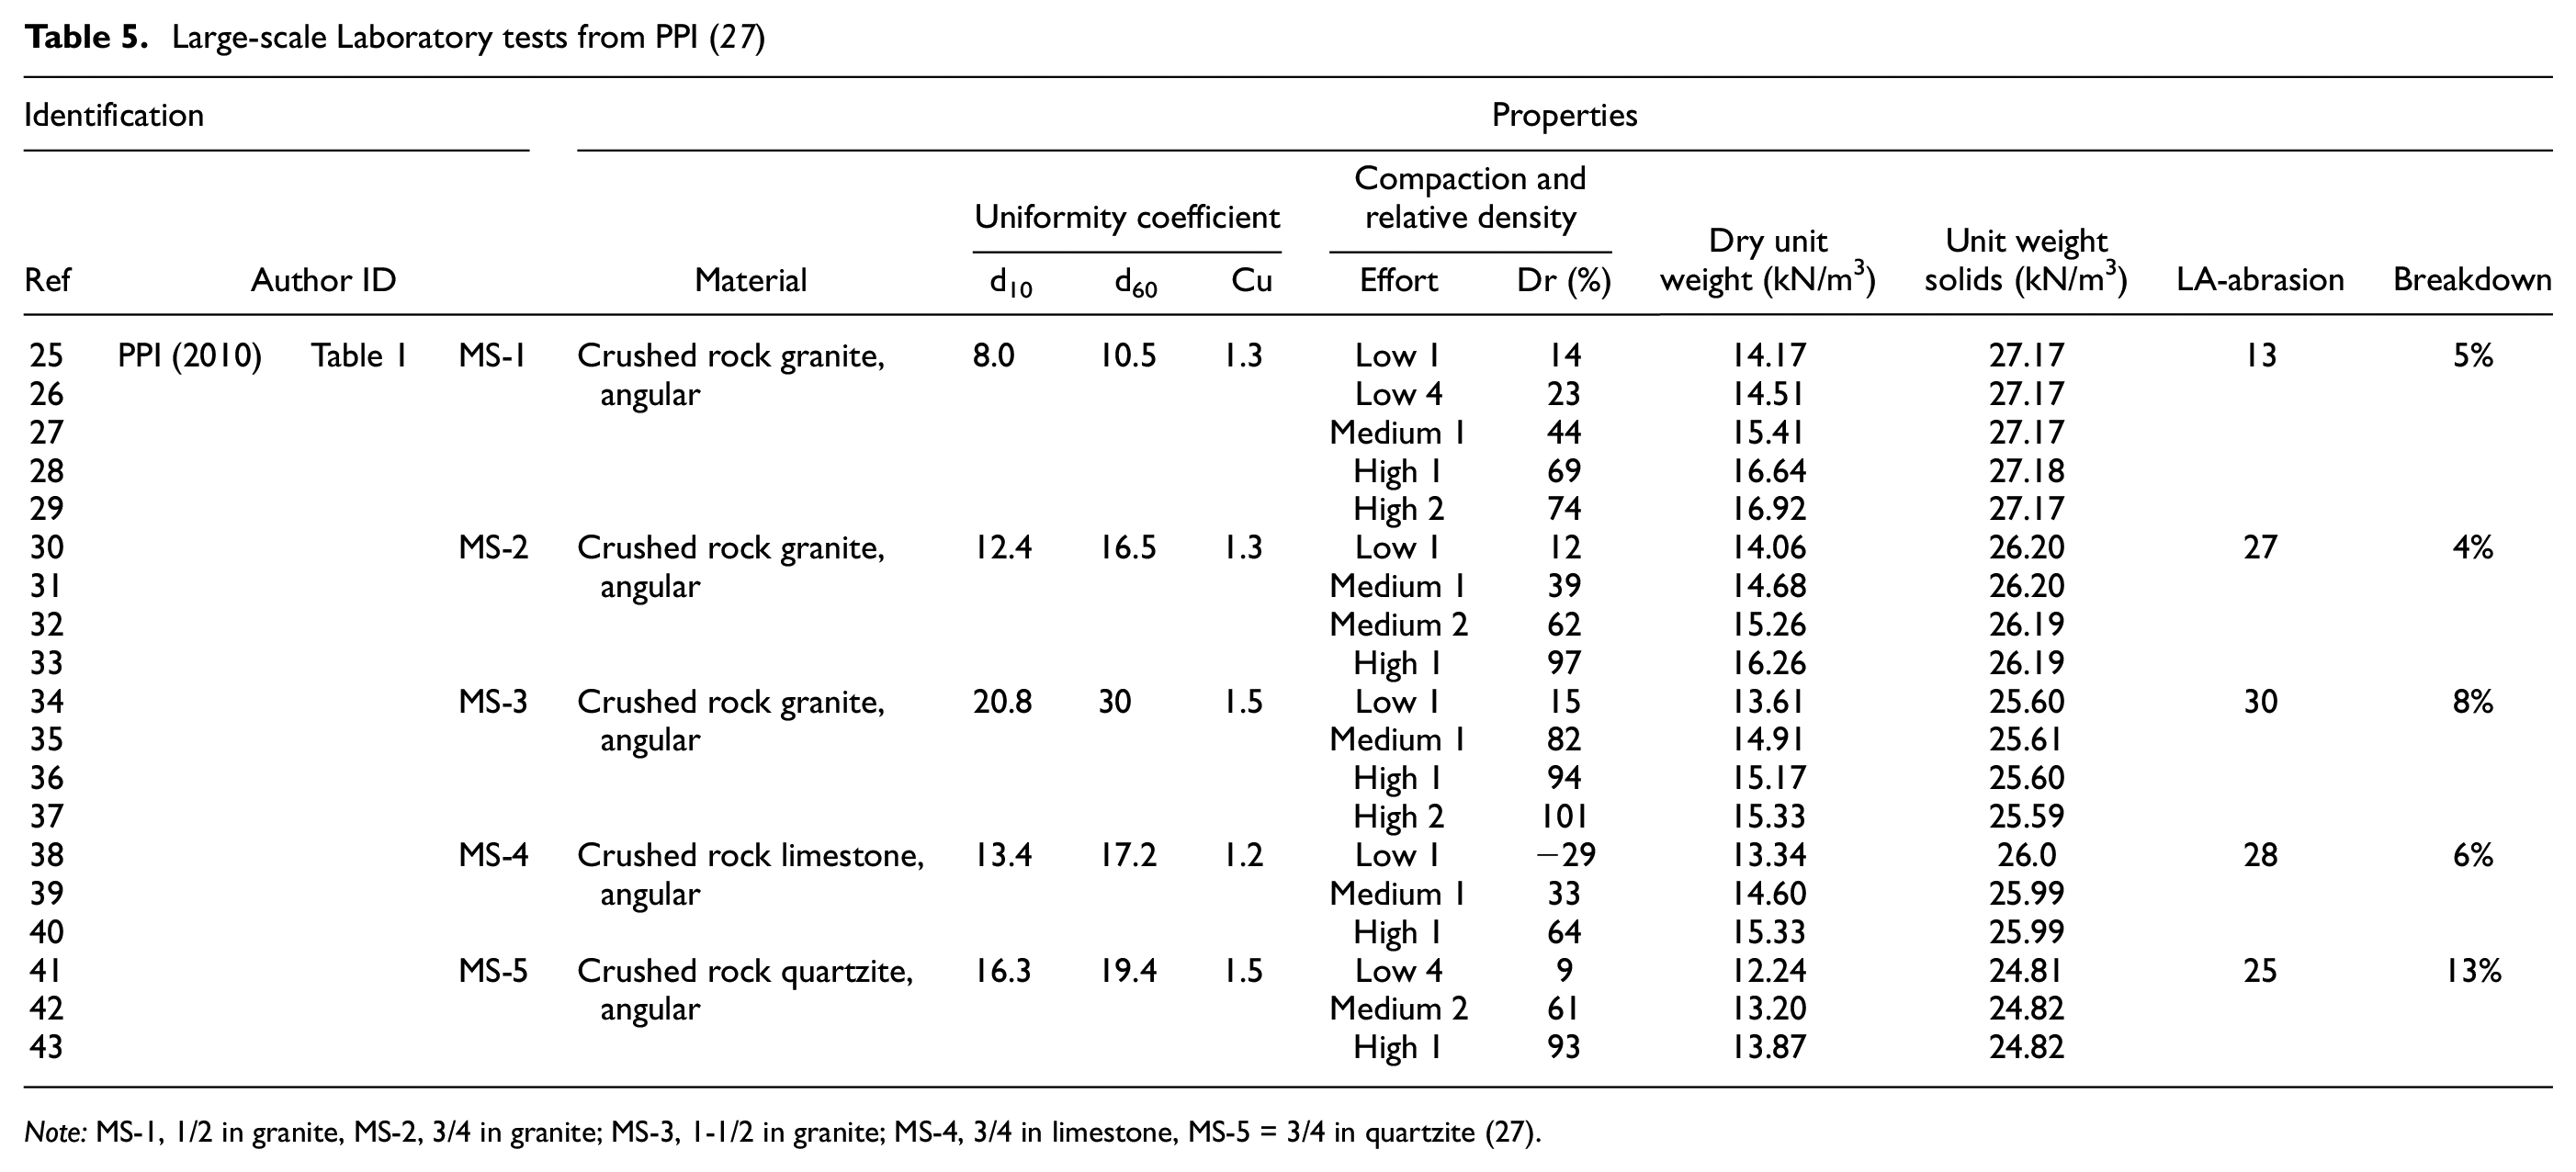
Note: MS-1, 1/2 in granite, MS-2, 3/4 in granite; MS-3, 1-1/2 in granite; MS-4, 3/4 in limestone, MS-5 = 3/4 in quartzite (27).
It is important to highlight that large-scale tests introduce problems with unrealistic side friction, apparatus deformation, and local particle crushing at soil–mold interface, expected to be treated differently by each author ( 24 – 27 ). In addition, some tests were old and had to be inflated and manually extrapolated, introducing additional error at particularly low stress (<100 kPa).
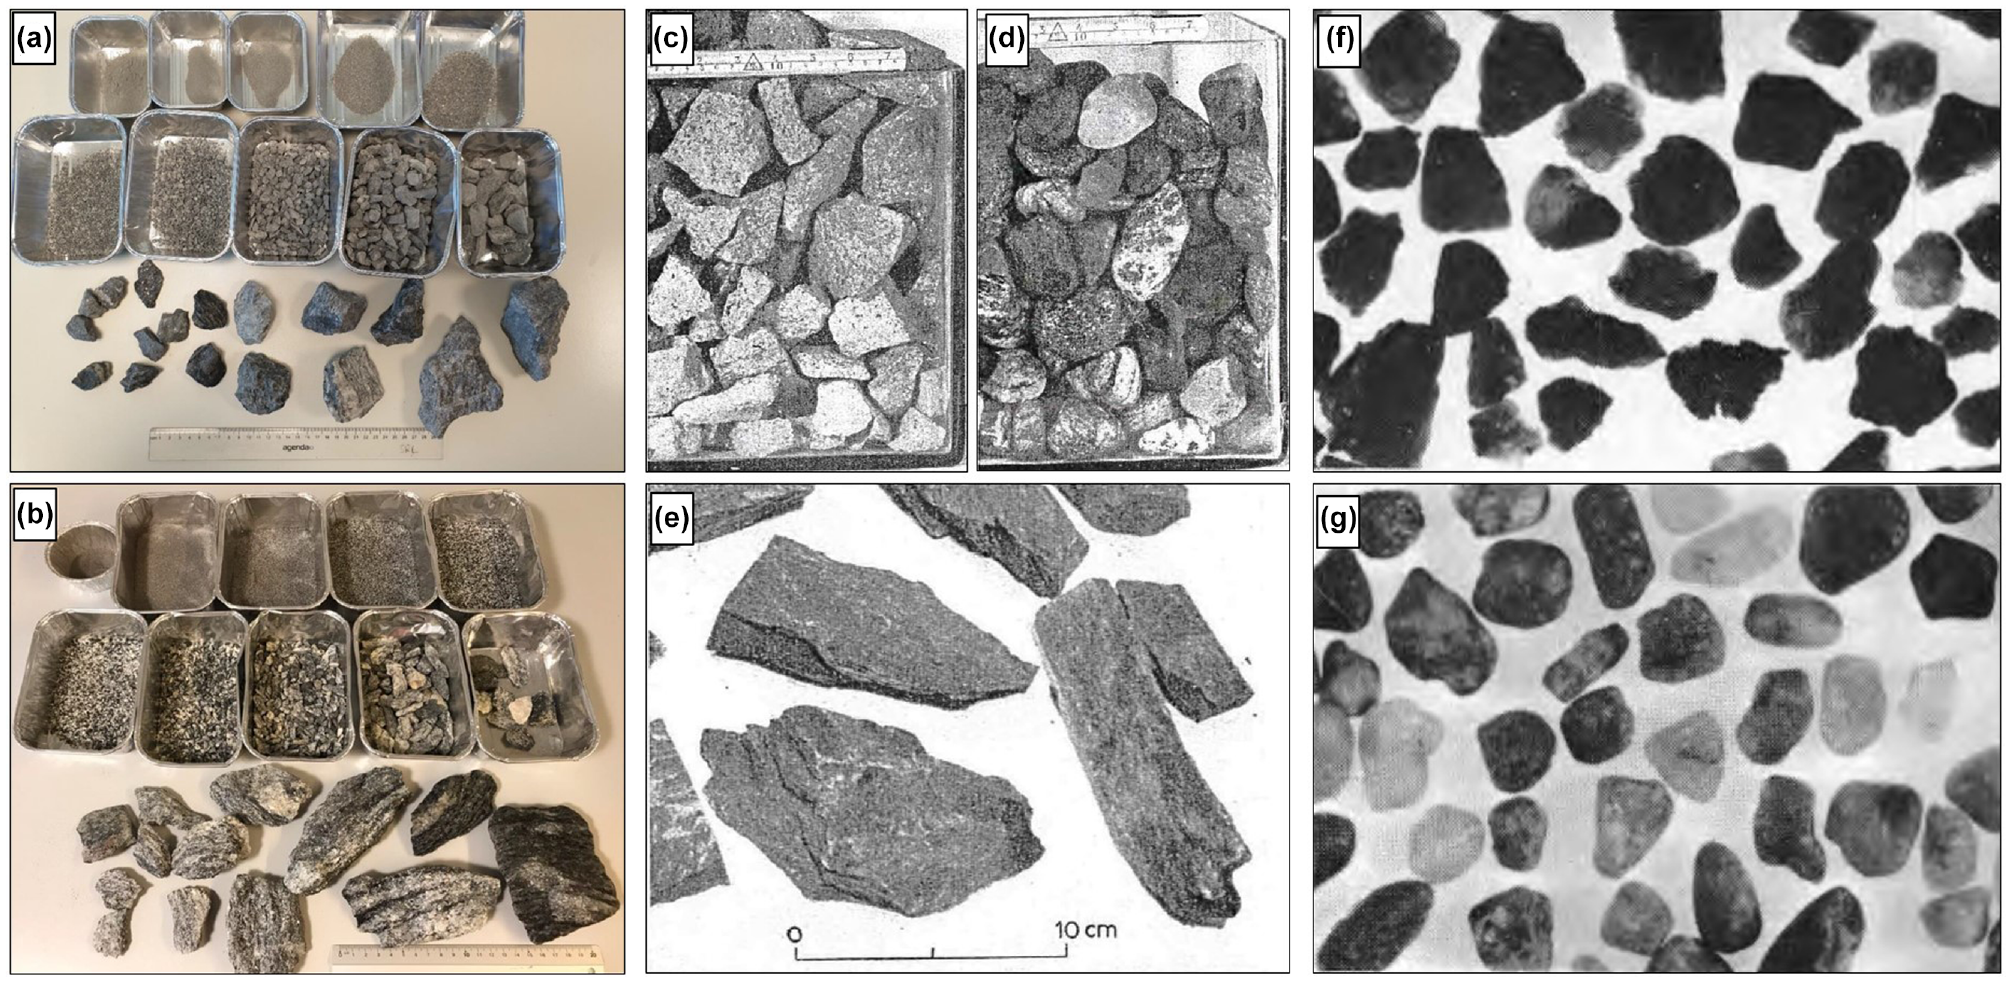
Tested materials came from various sources: crushing plants, natural deposits, waste rock and so forth (Figure 18).
First compilation shows the influence of particle roundness and angularity on compressibility, where only a handful of medium to highly compacted tests were included, and the second compilation compares compressibility of various crushed rock and waste rock materials (Figures 19 and 20).

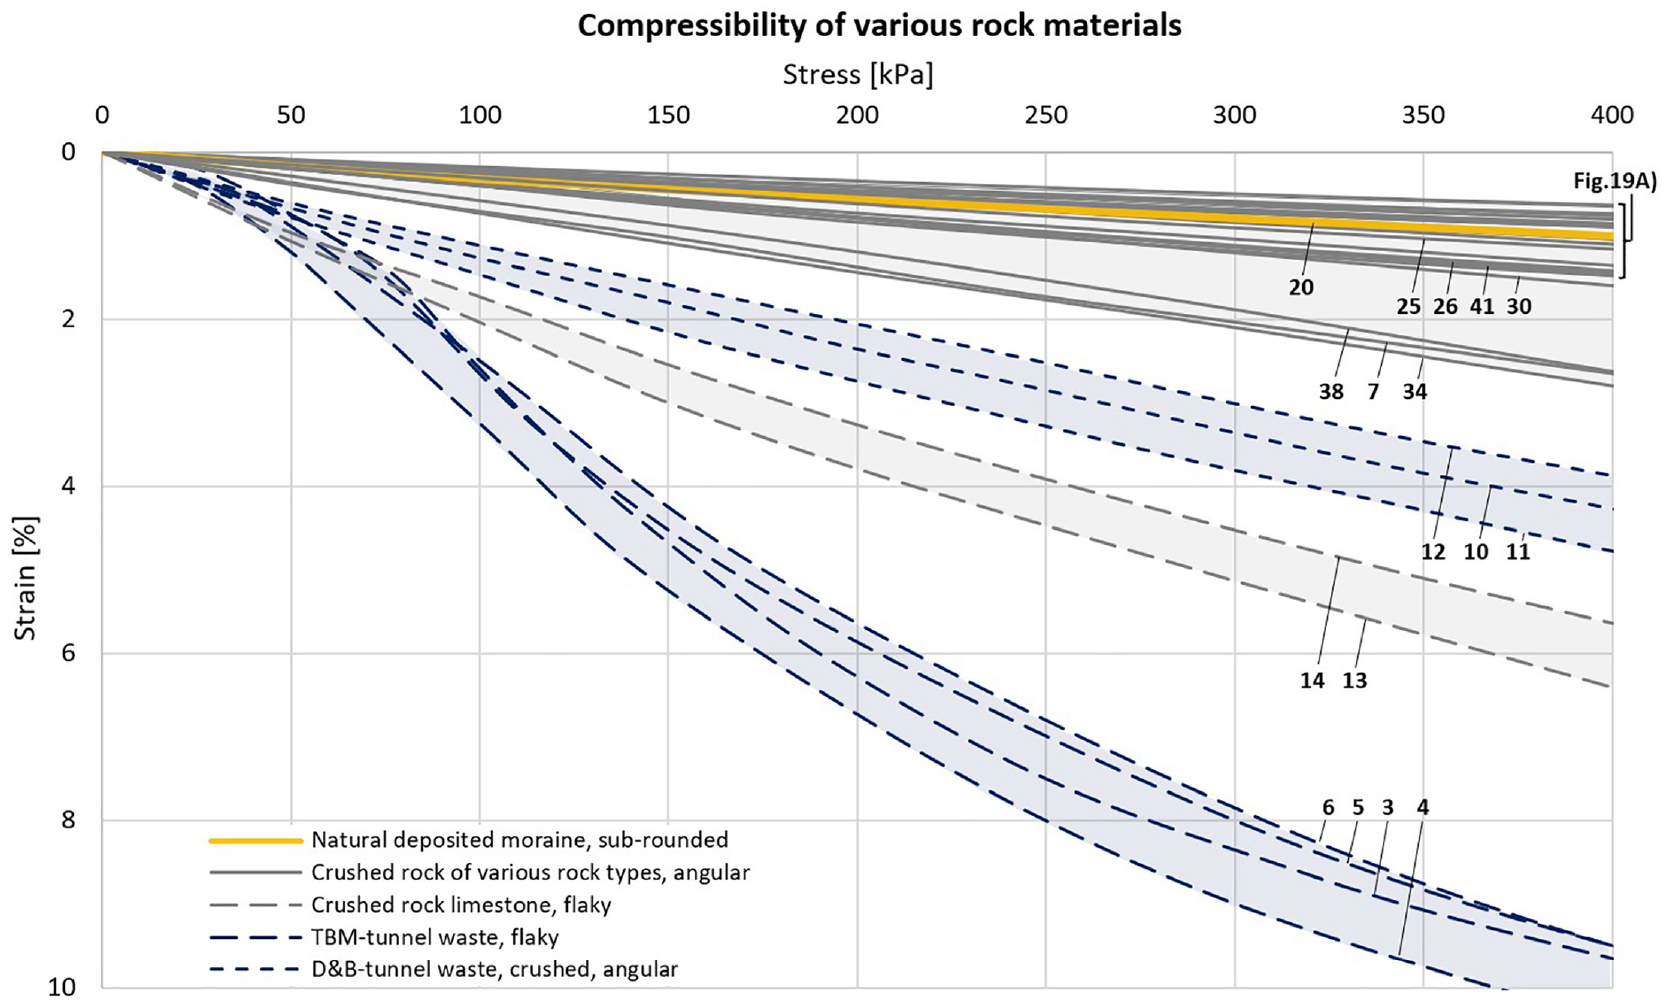
Figures 19 and 20 indicate that the soil sample first undergoes an initial non-linear loading, where particle re-arrangement and volumetric change dominates the behavior, followed by a more linear behavior, where compressibility is governed by mineral and particle strength.
Particle Shape
Round materials (ref. 19-24, Table 4) seem less compressible than angular (ref. 11-36, Tables 4 and 5) at high stress, which is in line with what other authors have previously observed ( 25 – 27 ). This returns a higher Janbu’s modulus number if it is derived from the entire stress–strain range (Figure 19).
As most culverts are actually built under low confinement (<100 kPa), backfill modulus number is more closely related to the slope of initial non-linear loading stage than the slope of the entire stress range (i.e., average), which suggest that the difference in modulus number between angular and round materials is more modest at low confinement than what has previously been suggested ( 18 , 25 ).
Constrained modulus is also stress dependent, where angular materials generally return a larger stress exponent than round materials. If a constant modulus number and unit weight is assumed for three materials, and stress exponents subscribed to them similar to those reported ( 18 , 25 ), angular materials seem more favorable in low-stress conditions compared with round, and may even be stiffer despite having a lower modulus number (Figure 21).

Change in stress exponent with depth, suggesting angular materials often are stiffer than rounded in low-stress conditions.
Material Composition and Brittleness
Figure 20 suggests elongation and brittleness affects compressibility much more than roundness and angularity. Flaky and elongated materials (ref. 4-7 and 17-18, Table 4) are particularly unfavorable, as they are both brittle and exposed to particle breaking under compression ( 25 – 27 ).
In D&B tunnel waste that was later crushed to obtain angular particles (ref. 14-16, Table 4), blasting seems to introduce additional brittleness when compared with crushed rock from a rock quarry, independent of rock type (ref. 14-16 and 1-42, Tables 4 and 5). The influence of rock type, in comparison, seem modest (Table 5 and Figure 20).
Compression testing on moraine (ref. 20, Table 4) with similar gradation as tunnel waste (ref. 15-16 and 17-18, Table 4) suggests the increased compressibility is mostly caused by brittleness, not fines content. D&B tunnel waste that was later sieved (ref. 14, Table 4) confirms this hypothesis, by being more compressible (Figure 20).
Most authors generally agree that high soil gradation (Cu) is favorable by causing the soil particles to distribute stresses among more contact points, resulting in less breakdown of particles and returning a higher modulus. But high gradation may be unfavorable if the amount of fines exceeds a certain limit that causes larger grains to “float,” or if it contains fines of softer particles than the coarse-grained ( 25 , 26 ).
Parameter Study and Review of Existing Methods
A parametric study is carried out using reviewed methods on created materials for estimating backfill soil modulus, followed by a critical review of theoretical approximations, aspects of material quality and ease of use.
Parameter Study and Backfill Design
Four backfill materials were created according to geotechnical ISO definitions and a stress condition assigned at quarter vicinity of culvert at 2, 4 and 6 m depth (Figure 22).

Soil gradation of created materials in design of backfill modulus.
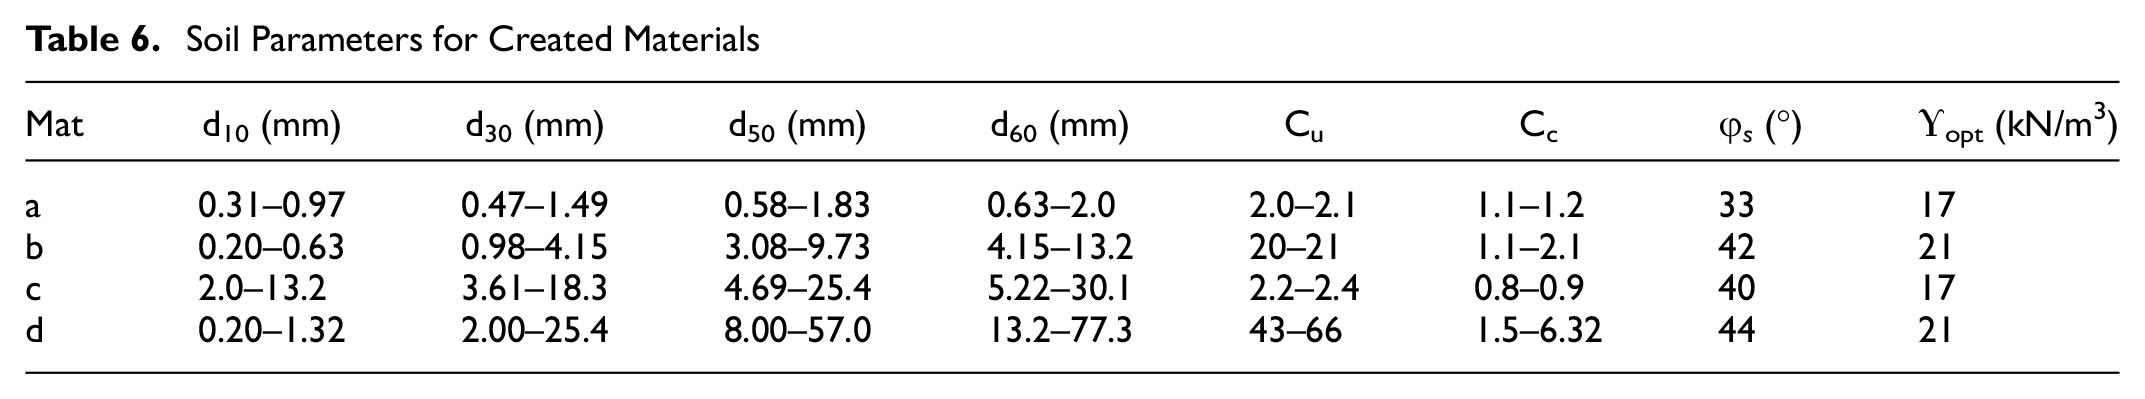
Each material was given an upper and lower-bound gradation limit and ascribed an optimal unit weight (ϒopt) and angle of response (φs) based on an average between round and angular materials, according to previous testing on similar materials ( 12 , 18 , 25–28) (Table 6).
Soil Parameters for Created Materials
Backfill density (ϒ) is chosen at 95% and 100% standard Proctor (RP),

Returning a backfill modulus (Figure 23).

Soil modulus according to SCI, CHBDC, AASHTO and SDM for material (a–d).
Figure 23 shows that SCI is particularly conservative by returning less than half the modulus of CHBDC, AASHTO and SDM, which returns fairly close results. The spread between 95% and 100% compaction curves seem consistent for SCI, CHBDC and AASHTO, but more erratic for SDM.
CHBDC, AASHTO and SCI define all materials within one soil group, but AASHTO is able to distinguish between materials as it includes unit weight.
SDM distinguishes upper from lower-bound gradation curves, unit weight, friction angle, and stone size, and therefore is able to account for most variability.
Review of Design Methods
Hyperbolic soil models are considered reasonable for design purposes, given that hyperbolic parameters are available for the actual material being used.
A drawback in all methods is that they loosely define “crushed rock,” and use it as a collective term that does not specify variation in material quality as a consequence of extraction source, rock type, or production technology, that previously has been shown to affect grain shape and brittleness, thus soil modulus.
The vague definition of what constitutes “acceptable quality” therefore causes certain methods to risk being overly conservative when applying high-quality crushed rock, but exaggerated when applying rock materials of lower quality.
The latter is particularly problematic for countries that have poor quality crushed rock but apply methods based on high-quality laboratory tests.
SCI
Lower-bound hyperbolic coefficients return a method that is overly conservative for most materials. As SCI only requires degree of relative Proctor, soil group, and soil cover as inputs, it is easy to apply but actually limits culvert bearing capacity in design if high-quality materials are being used.
CHBDC
CHBDC is created from engineering judgment, and therefore technically difficult to assess. It returns mean values that are stress-independent, and therefore overly conservative in high-stress conditions. It requires USCS soil groups to be assigned according to ASTM D-2487 (strict), but like SCI, it does not distinguish the difference in unit weight between materials.
AASHTO
AASHTO is relatively easy to use and only requires a defined USCS soil group, degree of relative Proctor, and optimum density, as its stress dependency makes AASHTO include the influence of unit weight, enabling it to distinguish between soil types within a soil group. It is also the most favorable method in high-stress conditions.
The correlation between Selig’s hyperbolic coefficients and Howard’s values suggest the coefficients in AASHTO correspond to mean values, but actual derivation of backfill modulus in AASHTO are incremental secant-values, suggesting they are actually below mean.
A significant drawback is that USCS soil groups may be defined according to both ASTM D-2487 and AASHTO M-145, which increases the permissible variation in quality within a soil group significantly.
SDM
Method B assumes a minor principal stress condition (σ’ = σ3) but transforms it back into principal stress using a rest pressure coefficient. A minor principal stress state in Janbu’s constrained modulus concept (Equation 20) seems counter-intuitive for Petterson’s alleged design optimization, as it is usually the major principal stress.
Arching causes the overburden stress to reduce proportionally with increased soil cover, but measurements on soil arching suggest that overburden pressure is only reduced over the culvert centerline, but increases ring compression as a whole ( 2 ). This implies that Method B’s stress formulation is conservative, especially in high-stress conditions.
Andrèasson’s laboratory tests were carried out on high-quality rock materials; this increases the risk of overestimating the modulus number if applying lower-quality materials. Equation 28 also enables the designer to treat void ratio and soil gradation as independent variables, but favors high optimal unit weight (ϒopt) in conjunction with low soil gradation (Cu).
As soil gradation and unit weight are in fact correlated and standard Proctor tests are usually limited to gravels, the designer risks “guessing” the true ratio between soil gradation and unit weight for coarse materials, enabling the designer to manipulate a relationship that returns the highest modulus (Figure 24).

Relationship between soil gradation (Cu), optimal density (ϒopt) and modulus number (m), according to Equation 28.
Figure 24 shows that soil gradation is negatively correlated with modulus number and vice versa, and explains why material (d) was more unfavorable than material (b) and (c) (Figure 23 and Table 6). This underlines the importance of having a readily available, true relationship between soil gradation and optimum density before applying Method B.
It is therefore concluded that “Method B” is conservative with regard to stress, but risks overestimating the modulus number if medium- to low-quality materials are being applied, and therefore requires an experienced designer.
Conclusions and Further Work
Various design methods for assigning a backfill soil modulus were reviewed and the influence of crushed rock materials and their quality particularly emphasized.
The reviewed methods have specific drawbacks depending on the actual stress condition and backfill material being applied, and this paper highlights them for future designers.
A major drawback found with current design practices is that methods, in general, reference specific and sometimes high-quality test materials while potentially being applied in areas with locally available materials that do not reach the quality envisioned in developing these methods.
As several countries are facing a fast-coming shortage of high-quality fill materials, increased emphasis on sustainability and exploitation of locally available crushed rock materials is expected in the future, which puts even more demand on future design systems being able to distinguish between poor and excellent materials.
Based on these conclusions, the authors suggest a new outlook in future development of backfill design in Europe, which should include:
A framework for assessing backfill material quality to enable designers to distinguish between poor and excellent materials. The study of grain shape (roundness and elongation) and brittleness suggests these quantities are closely correlated with material quality and soil modulus, and should be considered as additional variables to standard geotechnical soil definitions.
Less emphasis on complex design, but more on collaboration between the designer and contractor. If information on gradation curves and material quality is readily available for the designer, it should generally allow for using a higher soil modulus. This can be accounted for by introducing partial factors based on the available information of the backfill material in the design phase.
Footnotes
Acknowledgements
The authors show particular gratitude to Timothy McGrath for sharing his experiences of US practices and background of AASHTO method, and presenting the work for us at TRB 2024.
Author Contributions
The authors confirm contribution to the paper as follows: study conception and design: Sukuvara DS; data collection: Sukuvara DS; analysis and interpretation of results: Sukuvara DS, Vaslestad J, Scibilia E, Baardvik G, Grimstad G; draft manuscript preparation: Sukuvara DS. All authors reviewed the results and approved the final version of the manuscript.
Declaration of Conflicting Interests
The author(s) declared no potential conflicts of interest with respect to the research, authorship, and/or publication of this article.
Funding
The author(s) received no financial support for the research, authorship, and/or publication of this article.