
Abstract
Traffic accidents can lead to rapid changes in the traffic supply and demand at urban intersections, thus causing a severe traffic supply/demand imbalance during specific periods. Responding to accidents requires dynamic and accurate adjustments to optimize intersection resources collaboratively and enhance the real-time reliability and stability of traffic flows during such accidents. Currently, research on traffic incidents rarely considers real-time data-based collaborative optimization theories. Therefore, this study, supported by real-time incident detection technology and accident data, first considers the location and intensity of traffic incidents to update dynamically the changes in intersection traffic demand and supply. Subsequently, a dynamically collaborative optimization method is proposed based on lane assignment and signal timings to minimize the sum of variances of the degree of saturation of various approach lanes. Finally, various traffic demand scenarios are set, and the effectiveness of the proposed model is validated based on numerical and sensitivity analyses. The results demonstrate that compared with signal-only optimization and the highway capacity methods (HCM), the collaborative optimization method presented in this study reduces the average vehicular delay percentages by 8.54% and 16.47%, respectively. Sensitivity analysis indicates that, under various detour rates and detour modes, collaborative optimization methods have effectively mitigated the average vehicular delay at upstream intersections to varying degrees. In the context of real-time accident response, collaborative optimization methods demonstrate a capacity to promptly address the urgency of incidents occurring and maintain a sustained reduction in overall delay levels following detours.
Traffic incidents cause more than 50% of the traffic congestion in urban road networks ( 1 ). The response to urgent incidents that disrupt the normal operation of urban road intersections has become a crucial requirement in city traffic management. Urgent incidents exhibit stochasticity ( 2 ), which decreases the efficiency of traffic flow at intersections. Therefore, urgent incidents affect the reliability and stability of traffic flow at intersections. In recent years, collaborative optimization methods have been successfully applied to traffic signal collaborative control ( 3 , 4 ). However, when a mismatch occurs between short-term traffic supply and demand caused by urgent incidents, there is a need for rapid and accurate adjustment of collaborative resource allocation at intersections ( 5 ). In certain regions, the use of variable lanes has been practiced extensively, providing a foundation for practical applications ( 6 ). Although research has demonstrated the effectiveness of the application of variable lane strategies to all approach lanes of isolated intersections combined with optimized signal timings ( 7 ), there are current theoretical and practical challenges in implementing these adjustments.
Current advanced intelligent urban traffic control systems, supported by achievements in the detection of urgent incidents, can provide ample information technology and data resources ( 8 – 10 ). Simultaneously, many major cities have adopted dynamic lane group (DLG) strategies to address the temporally changing distributions of traffic and tidal traffic ( 11 ). Since its proposal in 1999 ( 12 ), the DLG has been extensively applied as an optimization strategy for collaborative control at urban intersections ( 13 ).
Conventional fixed-time signal control strategies ( 14 ) and simple traffic-responsive approaches ( 15 ) are insufficient for effectively allocating traffic flows during traffic incidents. Researchers are increasingly focusing on responsive signal control strategies based on real-time traffic data. To address this issue, numerous in-depth studies have emerged that focus primarily on adaptive signal control systems (ASCS) and dynamic signal control models.
The ASCS is a real-time traffic control system that adjusts traffic signal timing according to variations in traffic flow. In cases of traffic congestion, particularly in rapidly changing traffic conditions, ASCS can effectively reduce the number of stops for vehicles ( 16 ). Some studies focused on constructing models based on discrete Markov decision processes (MDP) ( 17 ). Additionally, to enhance the optimization efficiency of signal control schemes, advanced theoretical algorithms have been introduced for solving control models ( 18 ), such as the deep policy gradient algorithm ( 19 ), backtracking approximation method ( 20 ), and Lagrangian relaxation algorithm ( 19 ). In recent years, algorithms in the field of artificial intelligence have also been applied in the domain of adaptive signal control, such as fuzzy control ( 21 ) and multiagent systems ( 22 ).
Dynamic traffic signal control models are based on traffic flow predictions. They can use historical traffic flow data and predictive models to forecast future traffic flows and adjust traffic signal timing to achieve improved traffic flow control. These models can be categorized into two types: dynamic traffic signal control models based on traffic flow theory ( 23 ), and dynamic traffic signal control models based on machine learning. The former rely primarily on traffic flow theory and determine optimal signal control strategies based on traffic flow modeling ( 24 ) and simulations ( 25 ). Conversely, the latter are based on machine learning ( 26 ), especially deep learning ( 27 ), and reinforcement learning ( 10 ).
In summary, traffic incidents cause significant changes in traffic supply and demand at urban intersections within a short period. Researchers, both domestically and internationally, have conducted targeted and in-depth research to achieve commendable results in areas such as ASCS and dynamic signal control models. However, existing studies on intersection collaborative optimization have primarily focused on optimization methods for normal conditions with limited exploration of the effectiveness and reliability of these approaches under accident conditions. The impact of accidents on collaborative optimization control systems has not been adequately considered.
This study proposes a dynamic collaborative optimization method for intersection lane assignment and signal timing during traffic incidents. An incident refers to sudden and disruptive safety accidents that cause traffic interruptions and blockages. A variable lane signal sign is used to indicate to the driver which lane function is available in the approaching lane. Collaborative optimization involves the optimization of control strategies and signal timing within the same model. This study focused on the road sections and approach lanes affected by urgent incidents. Based on timely accident detection and traffic state data, this study analyzed the impact of the occurrence locations of urgent incidents at intersections. Subsequently, a collaborative optimization model that prioritizes control at intersections where accidents occur was established. Different scenarios of urgent incidents were set for numerical analysis, and the optimization results of the proposed method were compared with those of signal-only optimization and the highway capacity method (HCM) to validate the effectiveness of the model. Finally, a sensitivity analysis of the detour rates was conducted that identified different improvement effects on the delay reduction at different detour rates and modes in practical applications. Overall, this method provides a comprehensive, collaborative optimization framework for intersection traffic management under the influence of urgent incidents. Therefore, the model has certain advantages in the way it improves traffic efficiency and reduces safety risks at signalized intersections during abnormal disturbances caused by urgent incidents.
The contributions of this study are as follows:
This study proposes a collaborative optimization method for intersections during incidents, extending the application scope of collaborative optimization from normal to abnormal control scenarios.
This method incorporates accident detection data into traffic control input parameters, enabling the dynamic management of incidents and expanding the application scenarios for accident data.
Through sensitivity analysis, the performance of the method in different detour environments is tested, which provides practitioners with the collaborative use of the model and the applicable detour rate, bringing it closer to actual realization.
This paper is organized as follows. We first present a problem description of the incidents, followed by a discussion of the collaborative optimization model for incidents. We then present the benefit analysis using numerical calculations to assess the rationality of the proposed model. This is followed by a sensitivity analysis for assessing the applicability of the proposed model. A summary concludes the paper.
Problem Description
After an incident affects the total traffic flow at the upstream intersection, the vehicles reaching the stop line in the approach lane become the focus of the collaborative optimization. The impact of the incident on traffic flow can be divided into three stages, as shown in Figure 1a. Figure 1, b to
d
, illustrates the resource allocation at the incident intersection. In the conventional progressive optimization model, as shown in Figure 1e, Step 1 determines the lane function

Problem analysis and modeling: (a) traffic supply and demand analysis of the road under incident; (b) intersection geometry layout; (c) signal phase scheme; (d) lane function type; and (e) collaborative optimization model based on lane allocation and signal timing.
In Figure 1, b to d , i represents the intersection branch number, where the four values of i = 1, 2, 3, and 4, respectively and correspond to the south, west, north, and east branches. VL denotes the variable lane for turning, l denotes the number of approaching lanes starting from the leftmost lane, Mi represents the maximum number of approach lanes at fork i, p represents the lane function code, and φ represents the signal phase code. In Figure 1, e, f , g , and z are the optimization objective functions. Q1 and Q2 indicate the permissible ranges of the parameters. To facilitate model representation, Table 1 presents the symbols and parameters used in the following context.
Model Parameter Specification
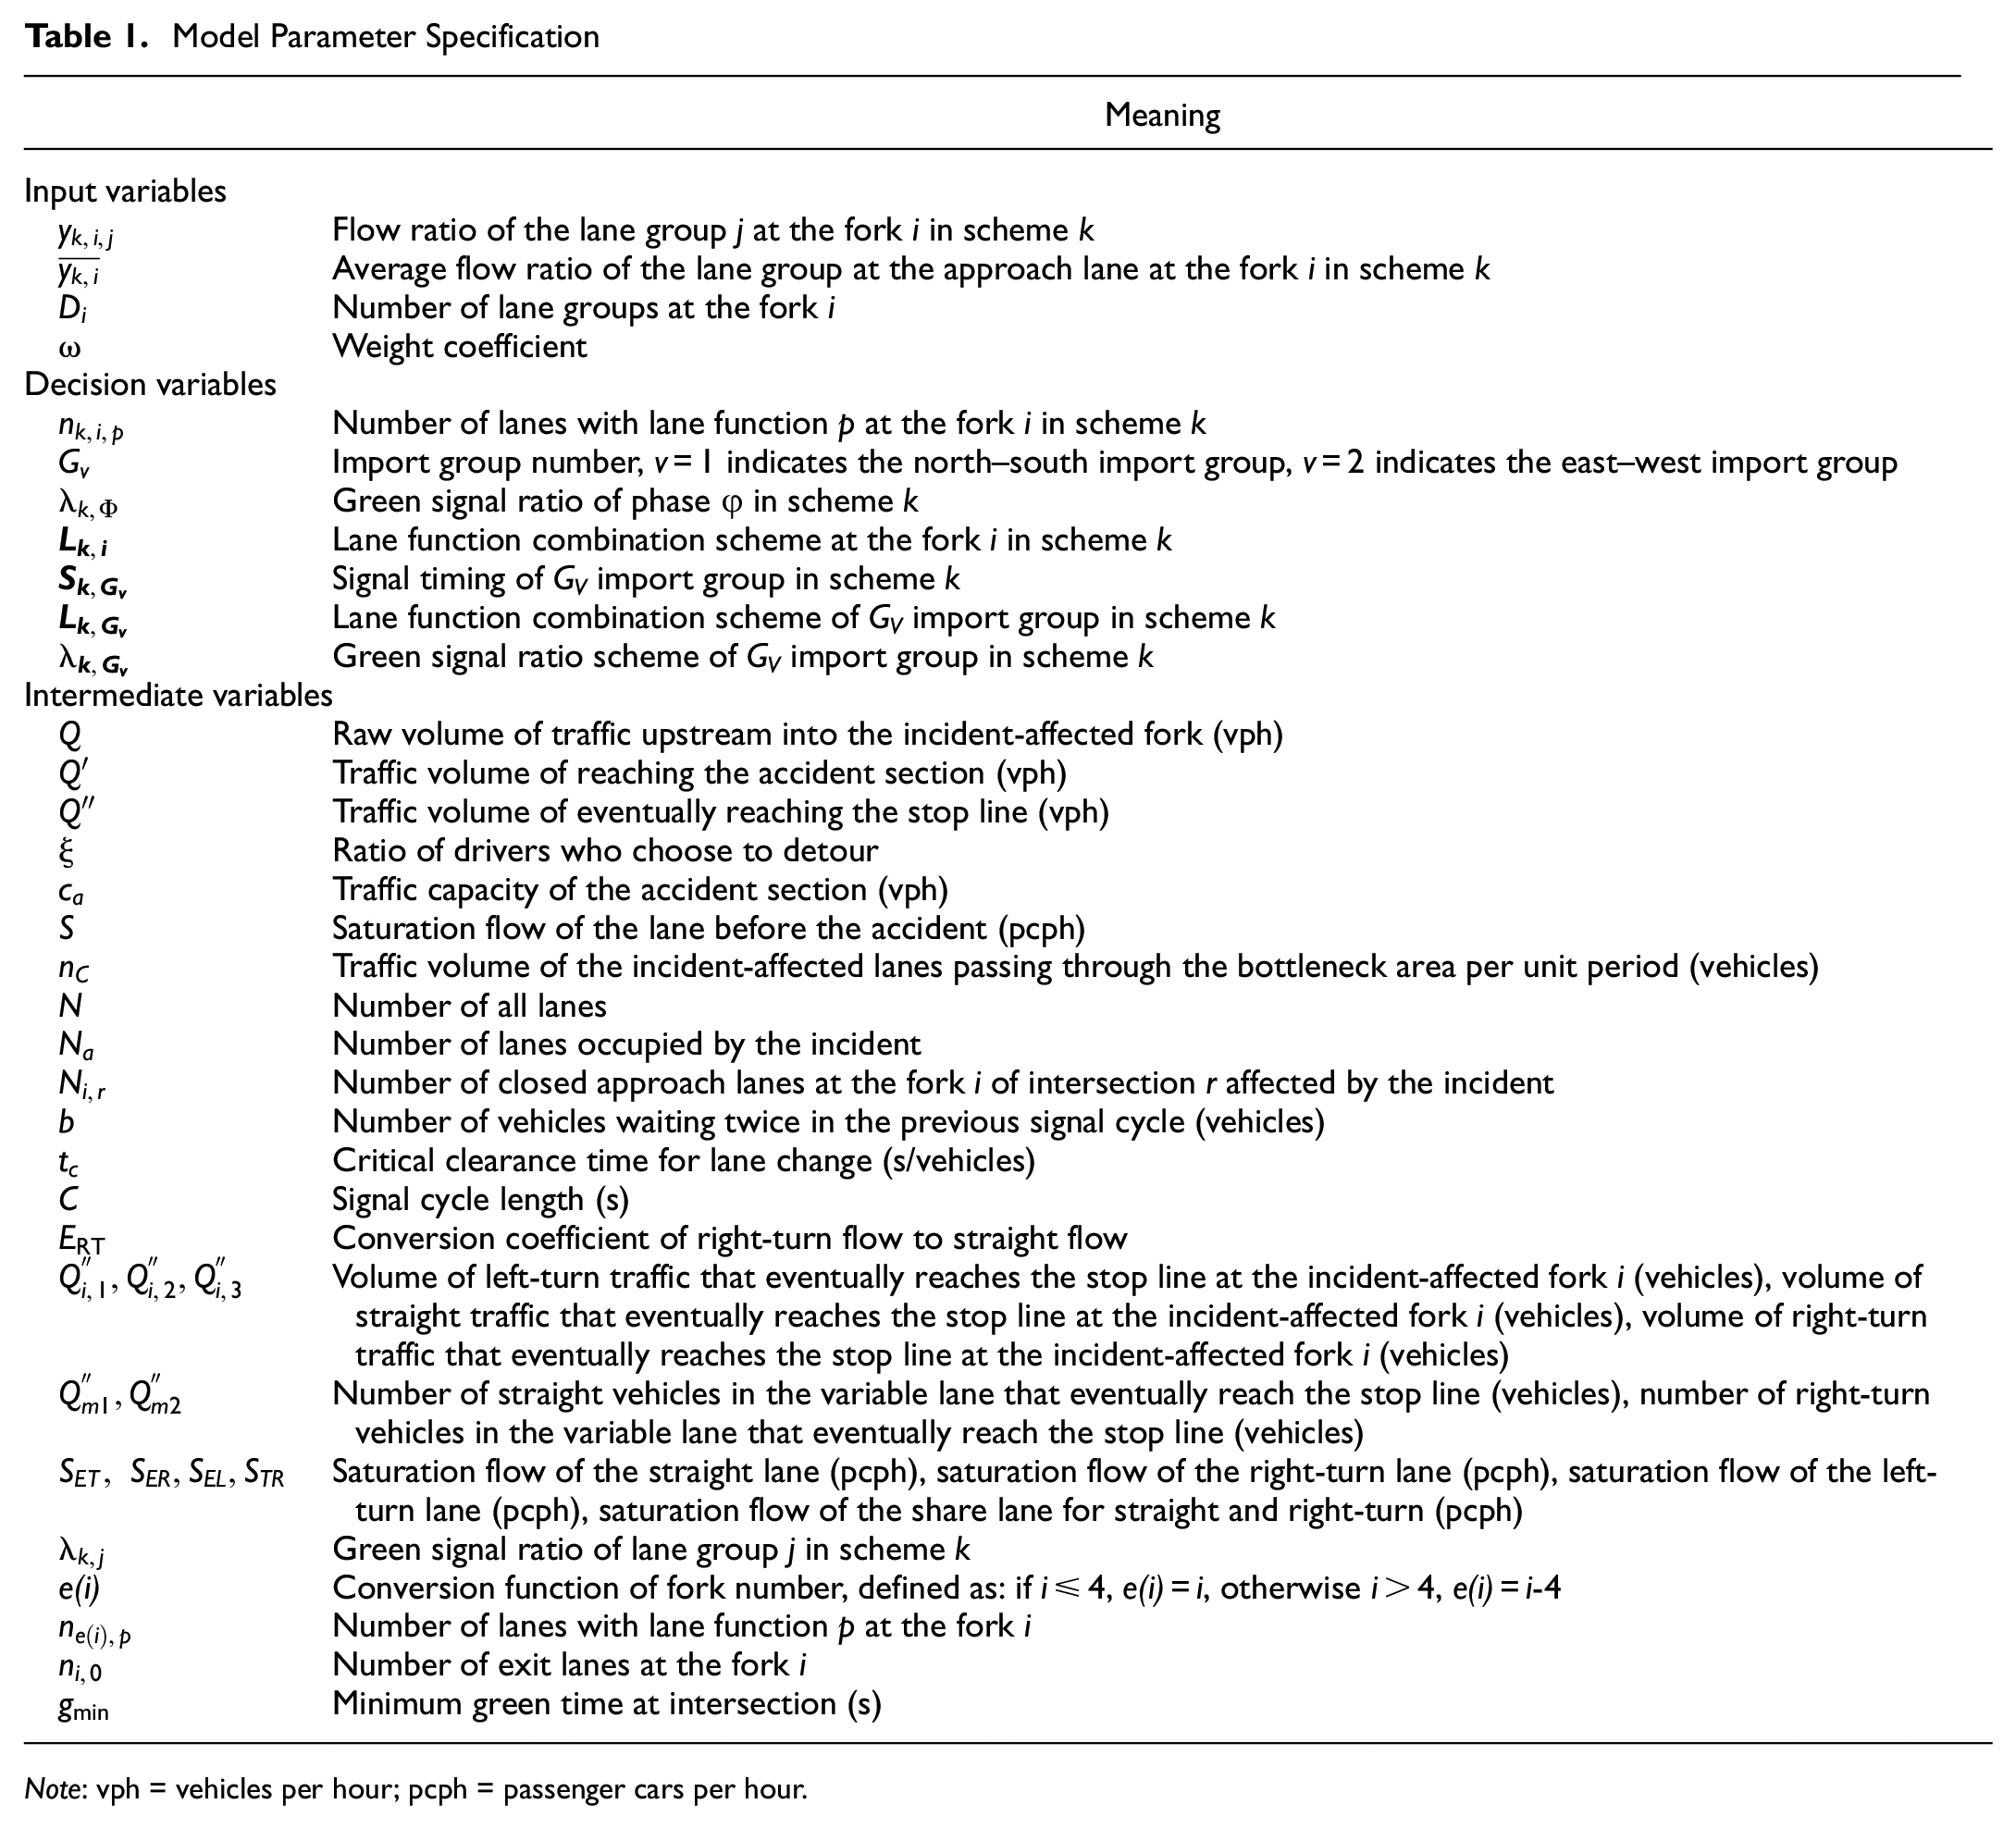
Note: vph = vehicles per hour; pcph = passenger cars per hour.
In the case of an accident at an urban signalized intersection, it is imperative to discern its location and severity accurately to provide precise control criteria for collaborative optimization. This entails analyzing the impact of driving behavior patterns, accident occurrence locations, and the number of affected lanes, thus facilitating updates to the traffic supply–demand of the intersection during the incident.
Driving Characteristic Influence
As shown in Figure 1, drivers approaching an intersection affected by an urgent accident choose different travel routes. Conservative drivers are more inclined to choose detours to bypass the intersection affected by the accident, whereas aggressive drivers choose to enter this intersection. The number of vehicles entering the intersection after a detour is given by Equation 1. Drivers’ detour decisions directly affect the downstream traffic volume; therefore, reasonable control of detour rates plays a crucial role in accident evacuation.

Incidence Occurrence on the Road Section
The incident produced a “bottleneck area” that reduced the traffic capacity of the road section and caused partial congestion, as shown in Figure 1a. During this time, some capacity remains at the incident location, thus allowing vehicles to pass through the bottleneck. When the upstream traffic demand of the incident is not greater than the capacity of the road section or slightly greater than the remaining capacity with a short incident duration, a rational adjustment of the signal timing at the entrance can facilitate normal traffic flow, reducing vehicle delays in the approach lane from the incident direction. The remaining capacity of a road section is calculated using Equation 2.

In Figure 1a, Phase 2 forms a bottleneck area. First, the relationship between the traffic volume of the incident section Q’ in phase one and the capacity of the bottleneck section ca should be assessed. If Q’ exceeds ca, based on gap theory, vehicles in the affected lane will merge into adjacent normal lanes. Consequently, some obstructed vehicles were unable to reach the stop line during the next signal cycle. If Q’ does not exceed ca, the entire flow from phase one can reach the stop line at the approach lane. The number of vehicles waiting to enter the approach lane in the subsequent signal cycle is defined by Equations 3 and 4. This traffic volume serves as the core parameter for the collaborative optimization method, determining and constraining the selection and comparison of different collaborative optimization scenarios.


Incident Occurrence on the Approach Lane
In Figure 1a, stage three represents an urgent incident created by an accident in the approach lane. Because the accident management evacuation process needs to continue for a certain duration, the intersection traffic capacity on the affected approach lane is reduced and, in some cases, lanes may be closed and rendered unusable. Lane closures decrease intersection traffic supply capacity in the short term, thus leading to congestion and increased delays in upstream traffic. In turn, this affects the allocation of resources in the subsequent cycle of the optimization system.
Modeling
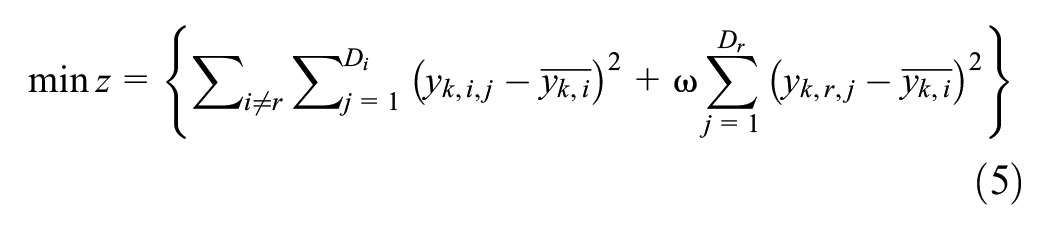
Objective Function
Degree of saturation is an important parameter that fully reflects the supply–demand relationship of traffic flow at intersections and can effectively indicate the congestion status of roads. Research by Li et al. ( 20 ) has shown that the degree of saturation is the most effective criterion for rapidly identifying intersections benefiting from the DLG technology, aiding in the swift adjustment of intersection resources during incidents. Therefore, the objective function for selecting the branch inflow saturation variance of the intersections is minimized during the incident to optimize the lane assignment and signal timing, as shown by Equations 5 and 6. Following the occurrence of an urgent incident, the ideal state aims to dissipate rapidly the impact on the traffic flow at the intersection. This can be achieved by setting weighting coefficients to prioritize resource allocation to the affected intersection during an incident.

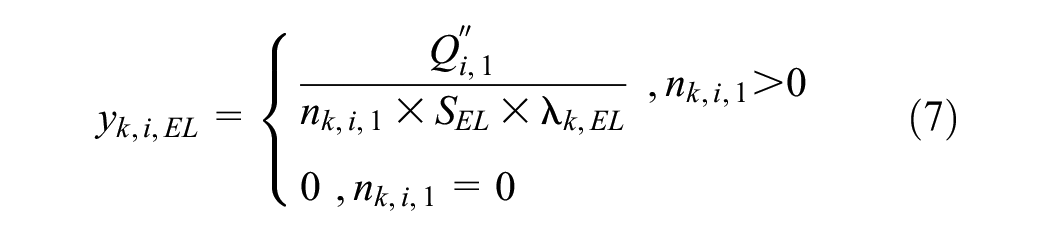
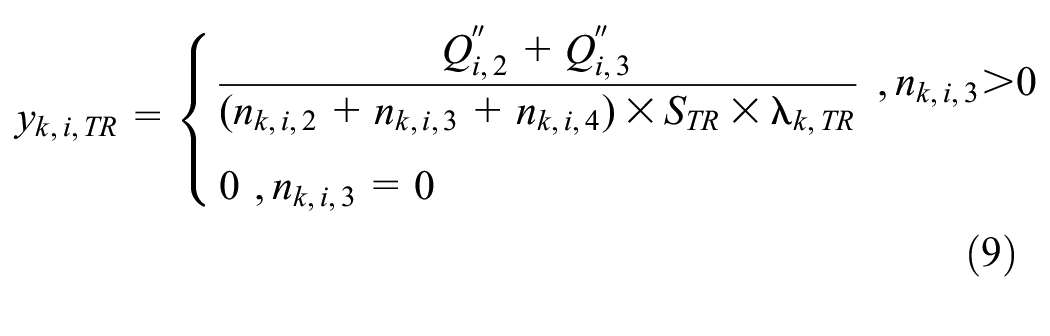
The degree of saturation calculation of various lane groups is expressed by Equations 7 to 10.


Decision Variables
The lane function combination scheme is expressed by Equation 11.

The signal timing matrix is expressed by Equations 12 to 14.


The lane function combination scheme is expressed by Equations 15 and 16.


The green signal ratio scheme is shown by Equations 17 and 18.


Constraints
The number of lanes for various lane functions at each entrance of the accident intersection is given by Equation 19, and the number of shared lanes is given by Equation 20. Otherwise, lanes exist inside entrance conflicts. The sum of all the lanes is expressed by Equation 21.


If the final flow direction in the approach lane is greater than zero, then there must be a lane function for that flow direction. Similarly, if the flow in a certain flow direction is equal to zero, the lane function of the flow direction should be prohibited, as expressed by Equations 22 to 24.


When right-turning vehicles are not controlled by signals, the implementation of dedicated right-turn lanes can significantly enhance movement efficiency. In this context, a threshold value, denoted as γ, is introduced to represent the ratio between the right-turn and straight flows. Only when this ratio exceeds a threshold value can a dedicated right-turn lane be established. Determining the threshold value requires further research; however, for the purposes of this study, a value of 50% was temporarily adopted.
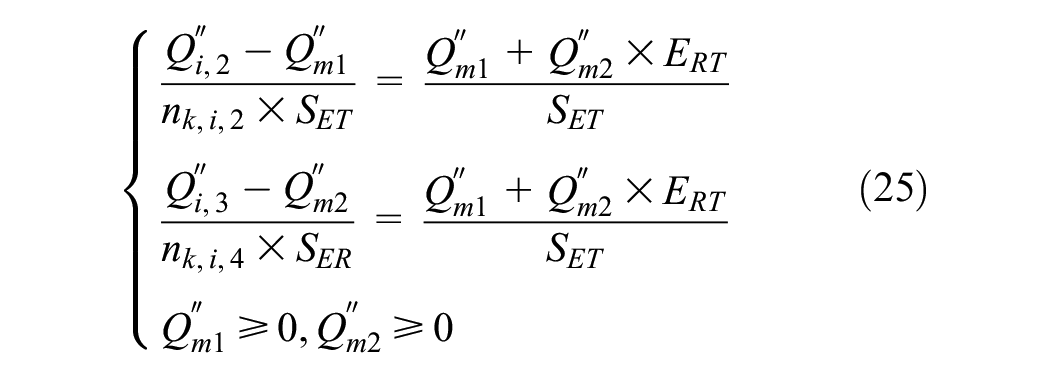
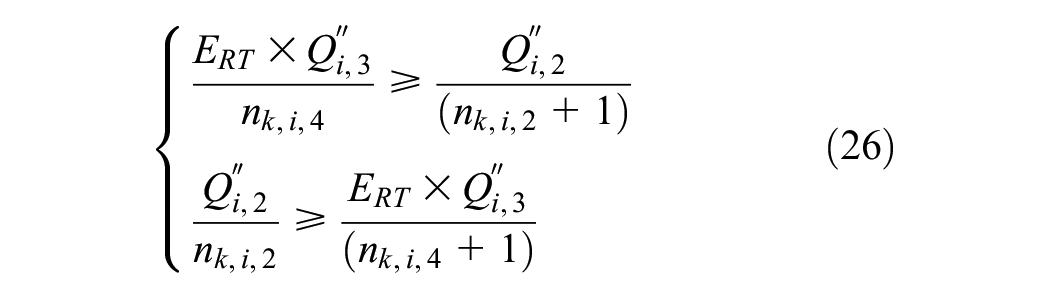
When using shared lanes, if multiple lanes are available for the same traffic flow direction, these lanes should exhibit equal degrees of saturation levels. This requirement must comply with Equations 25 and 26.
Under normal circumstances, the number of lanes in the exit lane should be greater than or equal to the number of lanes for the left-turning, straight, and right-turning movements. The left-turn lane on the left side complies with Equation 27. A straight lane complies with Equation 28. The right-turn lane on the right side complies with Equation 29. Appropriate adjustments to lane configurations may be necessary to ensure the safe and effective management of traffic flow.


The minimum green-light time and cycle can be adjusted according to the traffic flow during different time periods, effectively improving traffic efficiency and alleviating traffic congestion. The constraints of both factors ensure that adjacent traffic flows do not conflict. Equation 30 indicates that the green signal ratio for each phase should be within the range of the minimum green-light and cycle durations. Equation 31 indicates that the sum of green signal ratios for each phase should not exceed the cycle duration.


Model Solving
Collaborative optimization for incident-affected intersections can be described using the above nonlinear programming models. Because the number of approach lanes generally does not exceed 10 and all lane function schemes are limited, an enumeration method is adopted for solving. The model was solved using the following steps:
Step 1: When an urgent incident occurs, the traffic volume for the next signal cycle is calculated based on the incident location and number of affected lanes.
Step 2: Update the traffic demand for the subsequent signal cycle and initialize the system’s input data.
Step 3: Enumerate all the approach lane function
Step 4: Iterate through all
When an accident occurs on a road section, the model calculates the required lane functions for the lanes in the section where the accident has occurred. As the lanes in the accident section are unusable, the calculated lane function count is typically less than the total number of lanes at the intersection at which the accident occurred. The fixed lane functions of the intersection were then combined with the calculated lane functions, ultimately providing the optimal lane function combination for the current intersection.
When an accident occurs at approach lane, a similar approach is adopted, which results in a combination of lane functions with counts less than the total number of lanes at the intersection. However, because an accident at the approach lane leads to the closure of the approach lane, the lane function combination provided by the model is considered the optimal lane function combination for the current intersection. The location of the lane closure was determined based on the location of the accident.
In addition, the model is also applicable to two accidents occurring simultaneously on the road section and approach lane.
Model Benefit Analysis
The geometric configuration of the model benefit analysis is shown in Figure 2, a to
c
. The minimum green-light duration was set to 15 s.
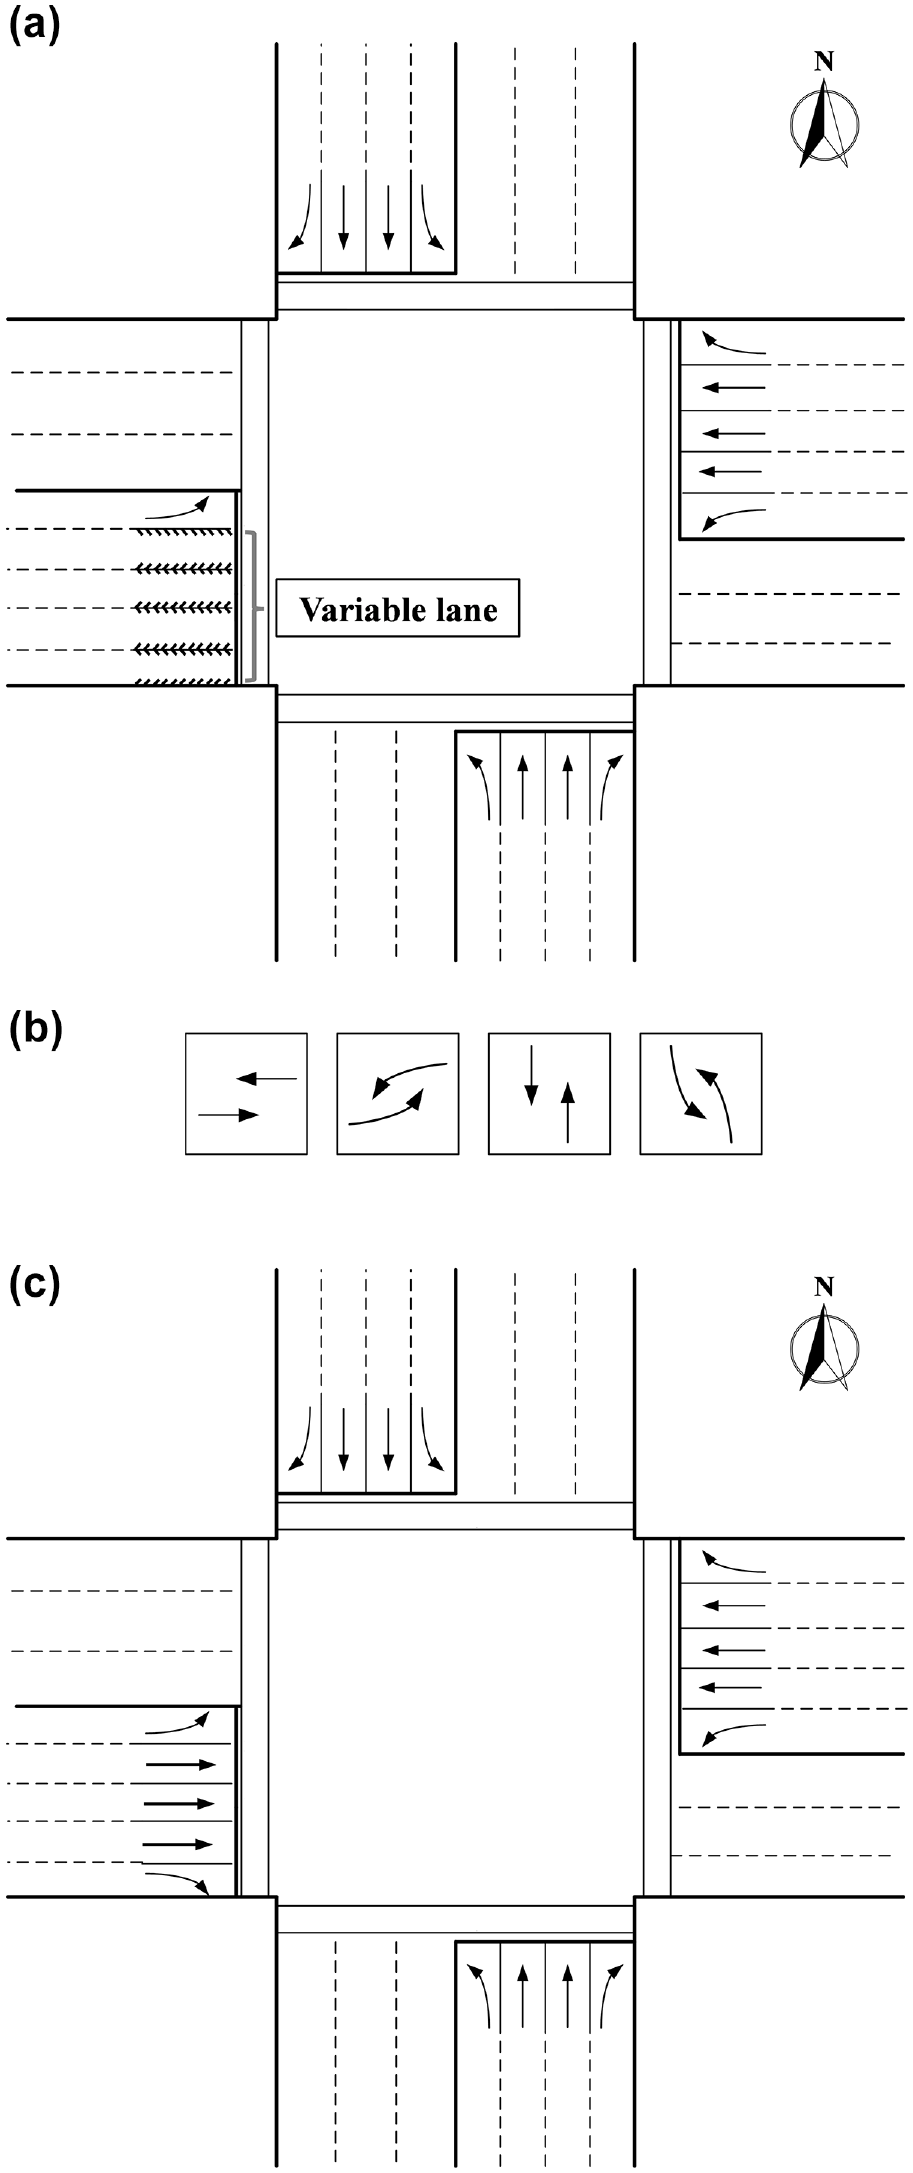
Intersection scenario and flow: (a) intersection geometry for collaborative optimization; (b) signal phase scheme; and (c) intersection geometry for static lane assignment.
In this example, accident occurrence locations were divided into road section and approach lane. The maximum impact of the accident on the number of lanes was set to two. The intersections adopted a simple four-phase signal control with signal cycles of 85 s, 130 s, and 160 s, respectively. The three traffic demand scenarios are presented in Table 2.
Turning Flow in All Directions on the Approach Lane
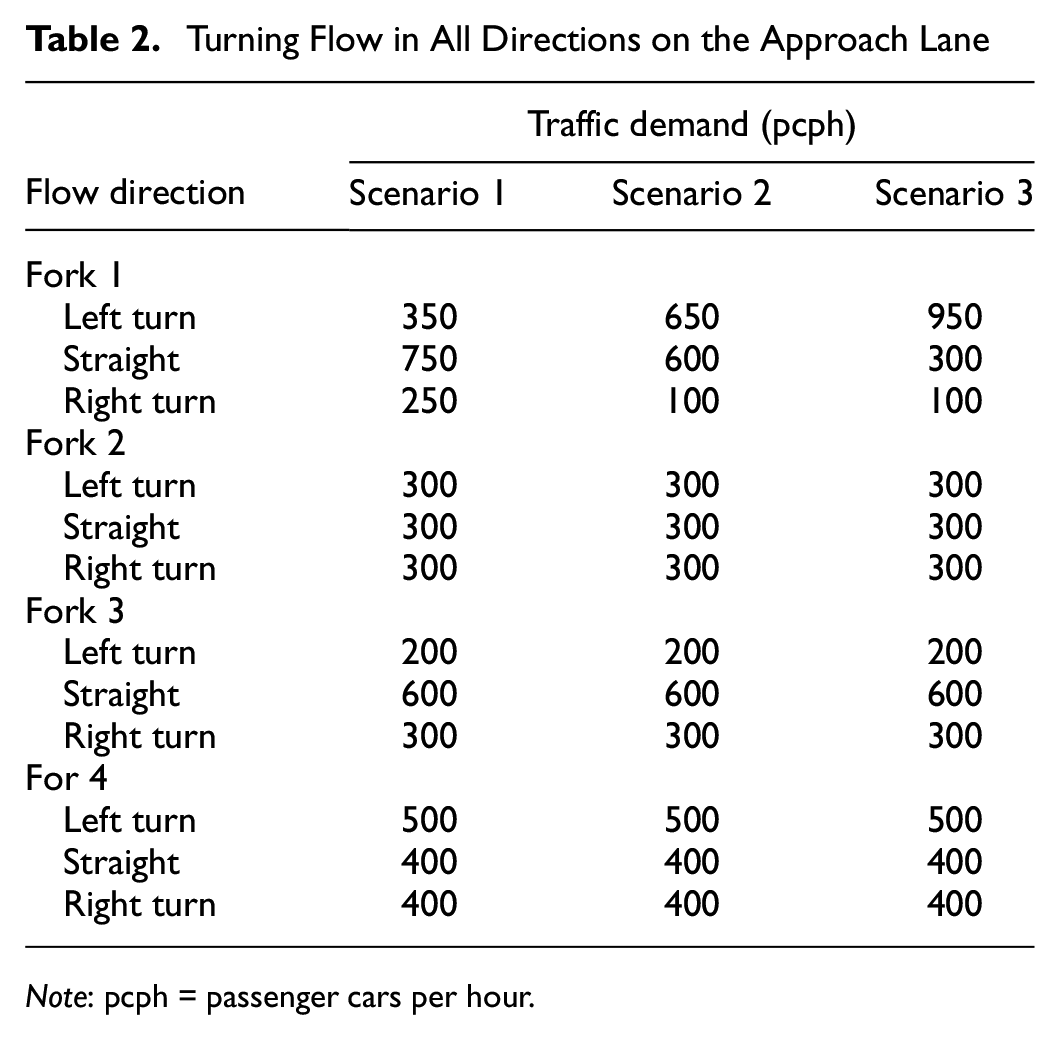
Note: pcph = passenger cars per hour.
The parameters listed above were substituted to perform the experiments in multiple scenarios. The optimal resource configuration in different scenarios (represented by the red solid line) was used to distinguish different optimal lane function combinations, as shown in Figure 3.
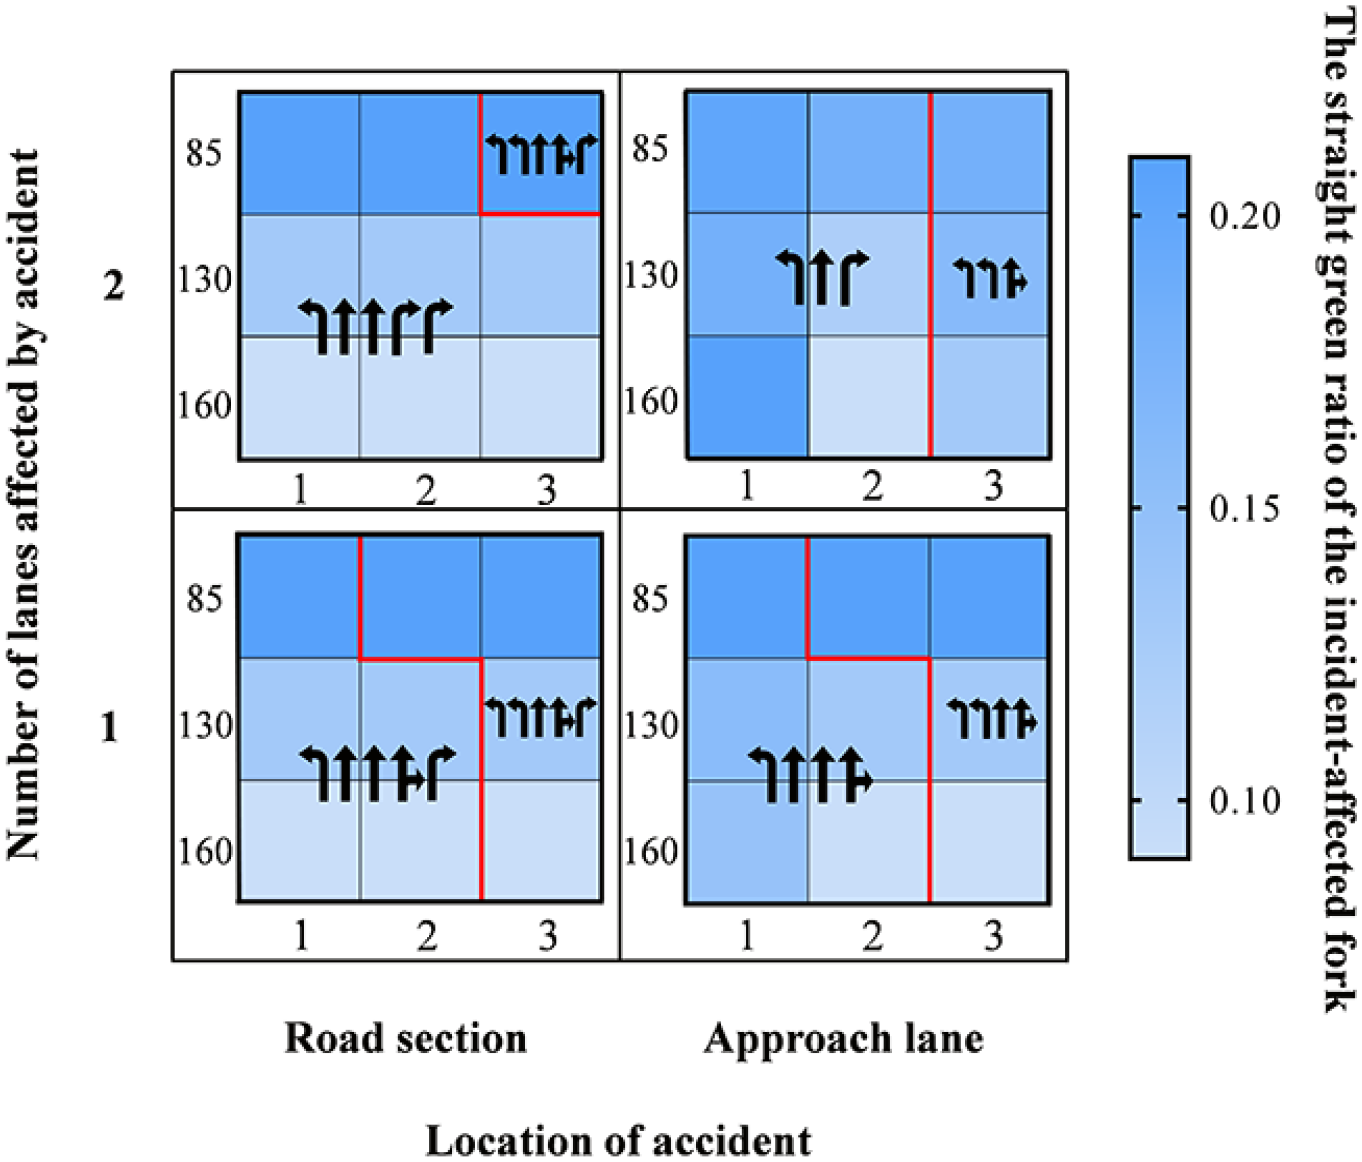
Collaborative resource optimization results of incident-affected fork.
From Figure 3, it can be inferred that for intersection resource allocation, different lane function optimization schemes can be adopted at intersections during incidents based on the incident location and intensity. As the proportion of straight or left-turn traffic increases, the number of straight or left-turn lanes also gradually increases. When the variation in the intersection supply–demand relationship is significant, it is necessary to switch lane functions for adjustments.
With regard to the temporal resource allocation, within different operating conditions and the same lane function interval, the green time ratio for straight traffic increases gradually as the proportion of straight traffic increases. That is, when the variation in the intersection supply–demand relationship is not substantial, only an adjustment of the green time ratio is required. In the first three subfigures, the phenomenon of switching to a variable lane appears with an increase in the signal cycle. This is because the number of vehicles entering the approach lane through the bottleneck area gradually increases as the signal cycle increases, and signal adjustments alone are insufficient to meet the demand.
By substituting
The listings in Table 3 show that the proposed collaborative optimization method, which does not affect the overall efficiency of the entire intersection, reduces the average vehicular delay at accident intersections by varying degrees. This approach helps alleviate quickly the short-term imbalance in traffic demand caused by incidents, especially when there is a significant imbalance in turning movements at approach lanes and a short signal cycle is employed. In the numerical examples, the percentage delay reduction for collaborative optimization relative to signal-only optimization and the manual HCM method were calculated for each case. The collaborative optimization method respectively achieved the average vehicular delay reductions of 8.54% and 16.47% compared with two methods.
Average Vehicular Delays of Different Optimization Methods Following an Accident

Note: HCM = highway capacity method.
As the proportion of left-turning vehicles in the traffic demand increases, the proposed method consistently achieved higher reductions in average vehicular delay compared with the signal-only optimization method, particularly in medium to short signal cycles. This is primarily because the signal-only optimization method consistently maintains three straight lanes, which may not align well with varying traffic demands. As the signal cycle at the intersection increased, the relative reduction in the average vehicular delay by the proposed method decreased compared with that of the signal-only optimization method. This trend was influenced by short signal cycles being more favorable for improving traffic efficiency during urgent incidents. Building on this theoretical foundation, the collaborative optimization method further enhances the level of improvement and reduces the probability of congestion spread that may be triggered by urgent incidents, when compared with the two methods.
To examine the applicability of the model to more real-world scenarios, experiments were conducted using a static lane assignment. In this experiment, the geometric conditions of the static lanes are shown in Figure 2c; in this case, the incident occurred on a specific road section that affected only one lane.
The listings in Table 4 show that the improvement for this method achieved based on static lane assignment is minimal. When comparing the average vehicular delays at different intersections, there were cases in which the average vehicular delay at the intersection affected by the accident was greater than that at the remaining intersections. In comparison with the other two optimization methods, some of the average vehicle delays for this method were higher than those for the HCM method. Therefore, the effectiveness of this collaborative optimization method is closely related to the application of variable lanes.
Average Vehicular Delays of Different Optimization Methods in Static Lane Assignment Cases
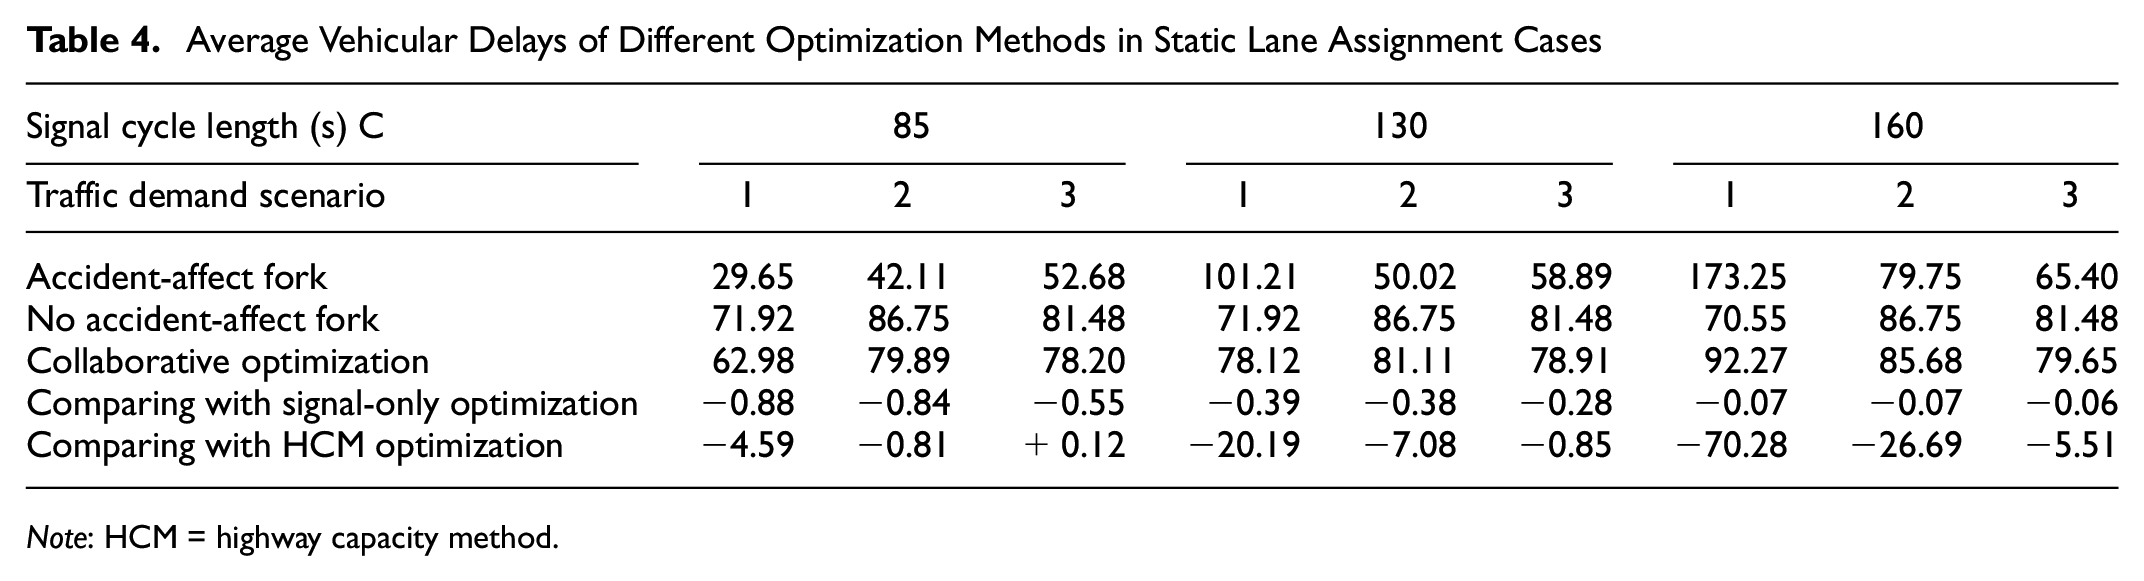
Note: HCM = highway capacity method.
Sensitivity Analysis
In the context of an accident, vehicles choosing to detour in advance reduce the base flow entering the accident section, thereby playing a significant role in alleviating the delays caused by the accident. This study, therefore, examined the performance of the collaborative optimization method under various detour scenarios by considering different detour rates and modes to assess its capability to reduce delays.
For an intersection upstream of the accident site, there are two detour options: not entering the intersection and detouring in advance, and entering the intersection and then detouring. A sensitivity analysis of the detour rates for these two detour options was conducted. Recognizing the potential limitations of applying predetermined detour rates in real scenarios, the range of detour rates in the experiments was set to [0.00, 0.40].
Detour Without Entering an Intersection
The effectiveness of the proposed method in reducing delay levels in different scenarios involving lane reduction, various traffic demand conditions, and different signal cycle lengths was demonstrated in a series of cases. The total number of lanes was set to three, four, and five, and the impacts of accidents on the number of lanes were considered to be 0, 1, and 2, respectively. These combinations resulted in nine distinct scenarios under the geometric conditions of the intersection, as shown in Figure 2a. In Table 2, Scenario 2 was selected as the input for traffic demand, with the accident occurring in the road section. The signal cycles were set to 85, 130, and 160 s. The range of driver detour rates was [0.00, 0.40], and the number of approach lanes at the intersection was equal to the number of lanes on the road section.
As shown in Figure 4, in general, the collaborative optimization method performed better in enhancing the overall traffic efficiency at intersections affected by incidents across the 18 different scenarios. This demonstrates the superior applicability of the method and contributes to the improvement of the disturbance resistance capability of intersections affected by accidents. The average percentage reduction in the average vehicular delay under the different comparison methods shown in Figure 4 was calculated. In the case studies considered here (compared with signal-only optimization), the collaborative optimization method reduced the average vehicular delay by 9.01%, 9.87%, and 10.04% based on the three signal cycles.
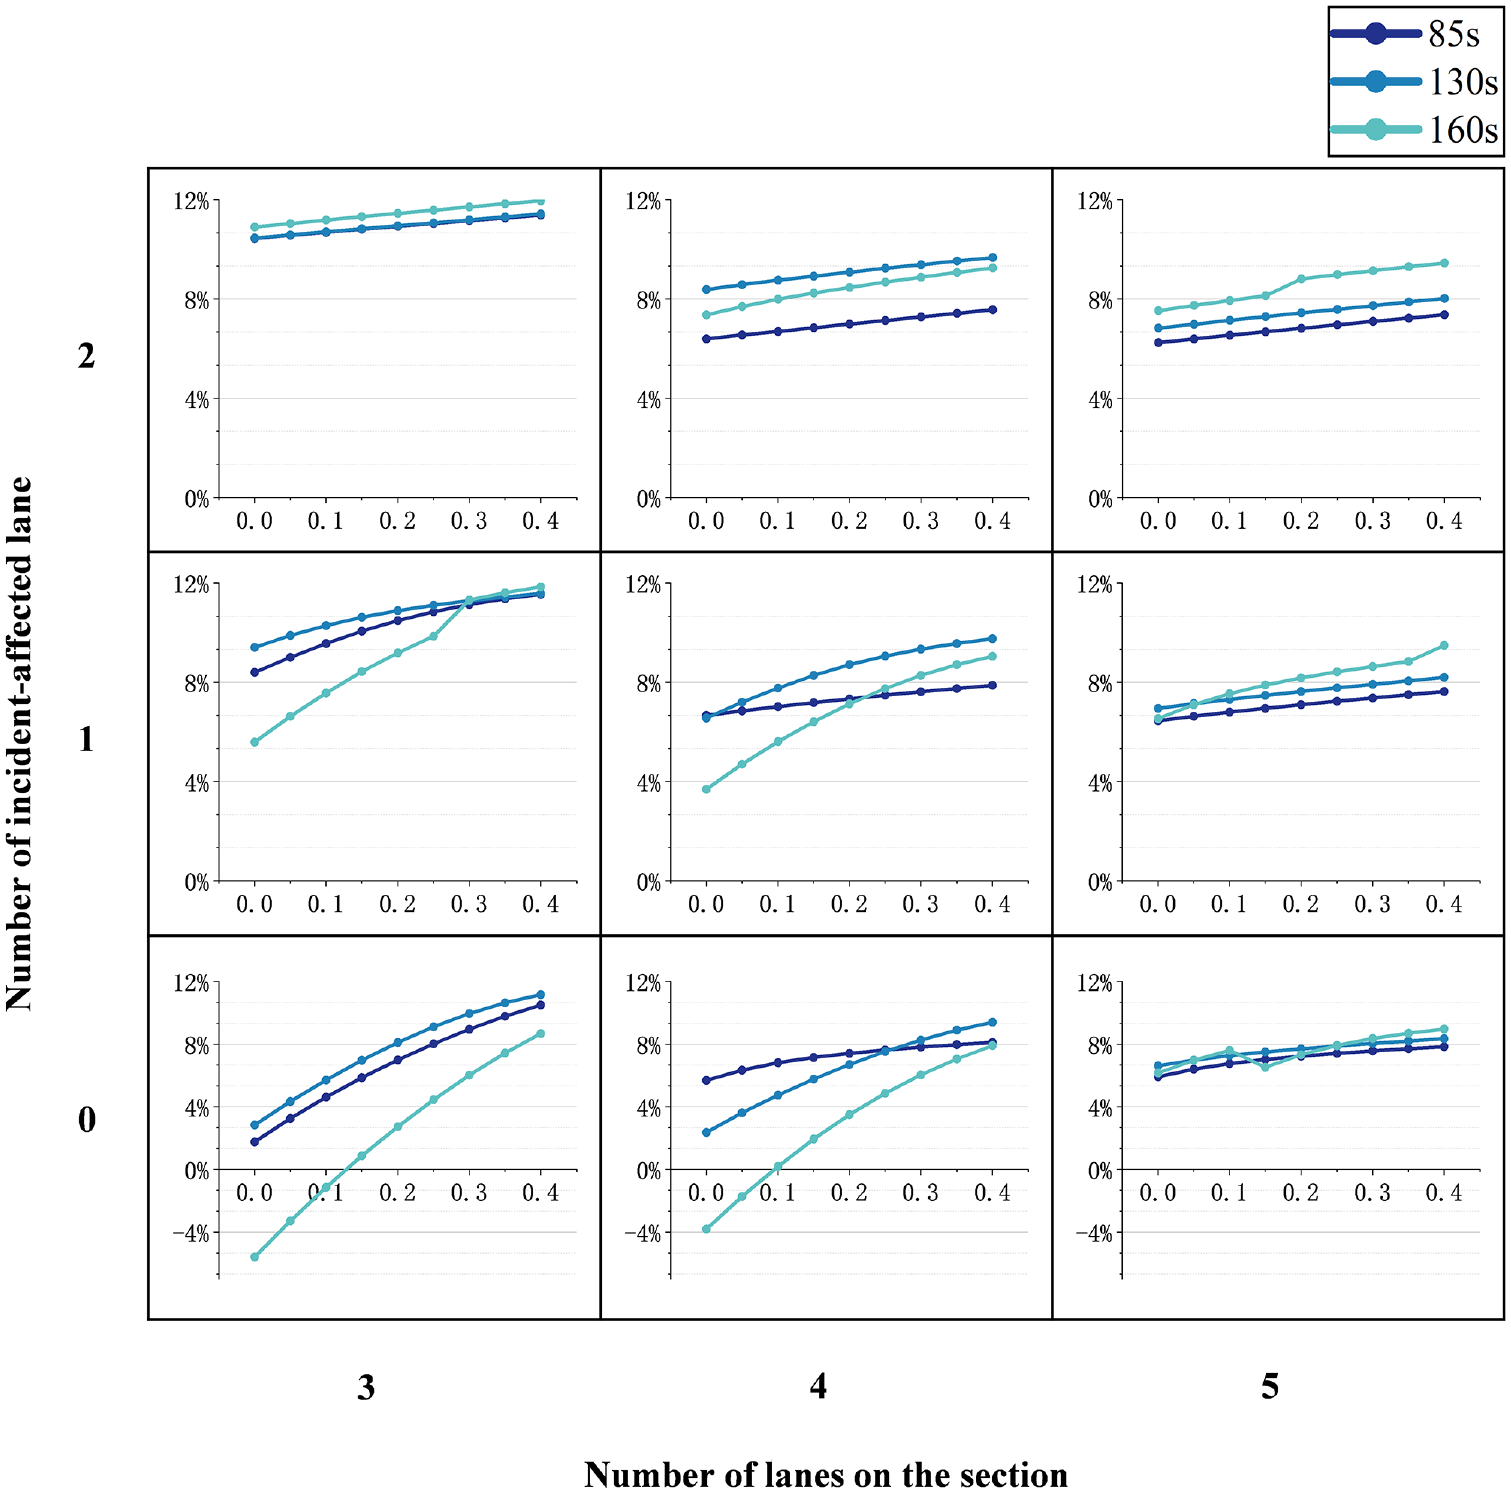
Percentage reduction in the average vehicular delay under different conditions.
Under the same accident-induced lane-reduction conditions, the advantages of the collaborative over the signal-only optimization method were reduced as the number of lanes on the road section across the three signal cycles increased. This trend is attributed to road sections with more lanes experiencing higher vehicular flows in bottleneck areas under equivalent traffic demand and urgent accident conditions. Consequently, the deviation between the traffic demand in the model input of the signal-only optimization method and the actual demand decreased.
For the same total number of lanes on the road section in the case of an accident, the advantages of the collaborative over the signal-only optimization method typically increased as the number of lanes affected by the accident across the three signal cycles increased. However, in some cycles with five lanes, this advantage generally decreased. The former trend was obtained because the signal-only optimization method does not consider the reduction in traffic flow caused by the accident-induced bottleneck, thus resulting in a deviation between the model’s traffic demand input and the actual demand. The input deviation for traffic demand is the primary influencing factor in the signal-only optimization method, and this deviation increases as the number of lanes affected by the accident on the road section increases. The latter trend is attributed to the reduction in the extent of traffic flow caused by accident bottlenecks as the total number of lanes increases.
For intersections affected by accidents, even in scenarios where vehicles do not divert or have a low detour rate (
In addition, the model was applied to normal intersections without incidents, and a sensitivity analysis was conducted. The experiments revealed that the collaborative optimization method consistently outperformed signal-only optimization across three cycles, and thus reduced the average vehicular delay levels by 6.98%, 7.21%, and 4.25%. However, in the case of a low detour rate during the 160-s cycle, this method was not as effective as signal-only optimization. The reason for this discrepancy is that in larger cycle cases with low detour demand, unnecessary lane changes are not required when using variable lanes, and optimizing the green signal ratio alone is sufficient. Therefore, for normal intersections with medium to short cycles, this method has a positive effect on reducing intersection delays. However, these methods may not be suitable for normal intersections with large cycles or low detour rates.
Detour at Intersection
In traffic detour control aimed at mitigating the impact of accidents, the general practice is to prioritize the control of the flow approaching an intersection upstream of the accident. However, not all vehicles choose or are willing to detour. There are also cases in which vehicles ready to enter an intersection upstream of the accident choose to detour, either voluntarily or based on instructions. There are two vehicular detour methods at an intersection upstream of the accident: detour and re-entering the intersection upstream of the accident (detour return), and detour and leaving the road section where the accident occurred to reach the intersection downstream of the accident (detour departure). Different detour methods and strategies may affect the performance of the intersection upstream of the accident. Therefore, a sensitivity analysis was conducted using the models under different detour rates and cycles for various detour strategies.
As shown in Figure 5a, detour return involves left (②), U-turn (③), and right turns (④). Detour departure includes left turn, left turn after U-turn, right turn after U-turn, and right turn, collectively represented as ⑤. Additionally, it was assumed that the detour at the west approach lane of the intersection upstream of the accident follows the detour options, and the detour scenarios for the south and north approach lanes were not considered temporarily.
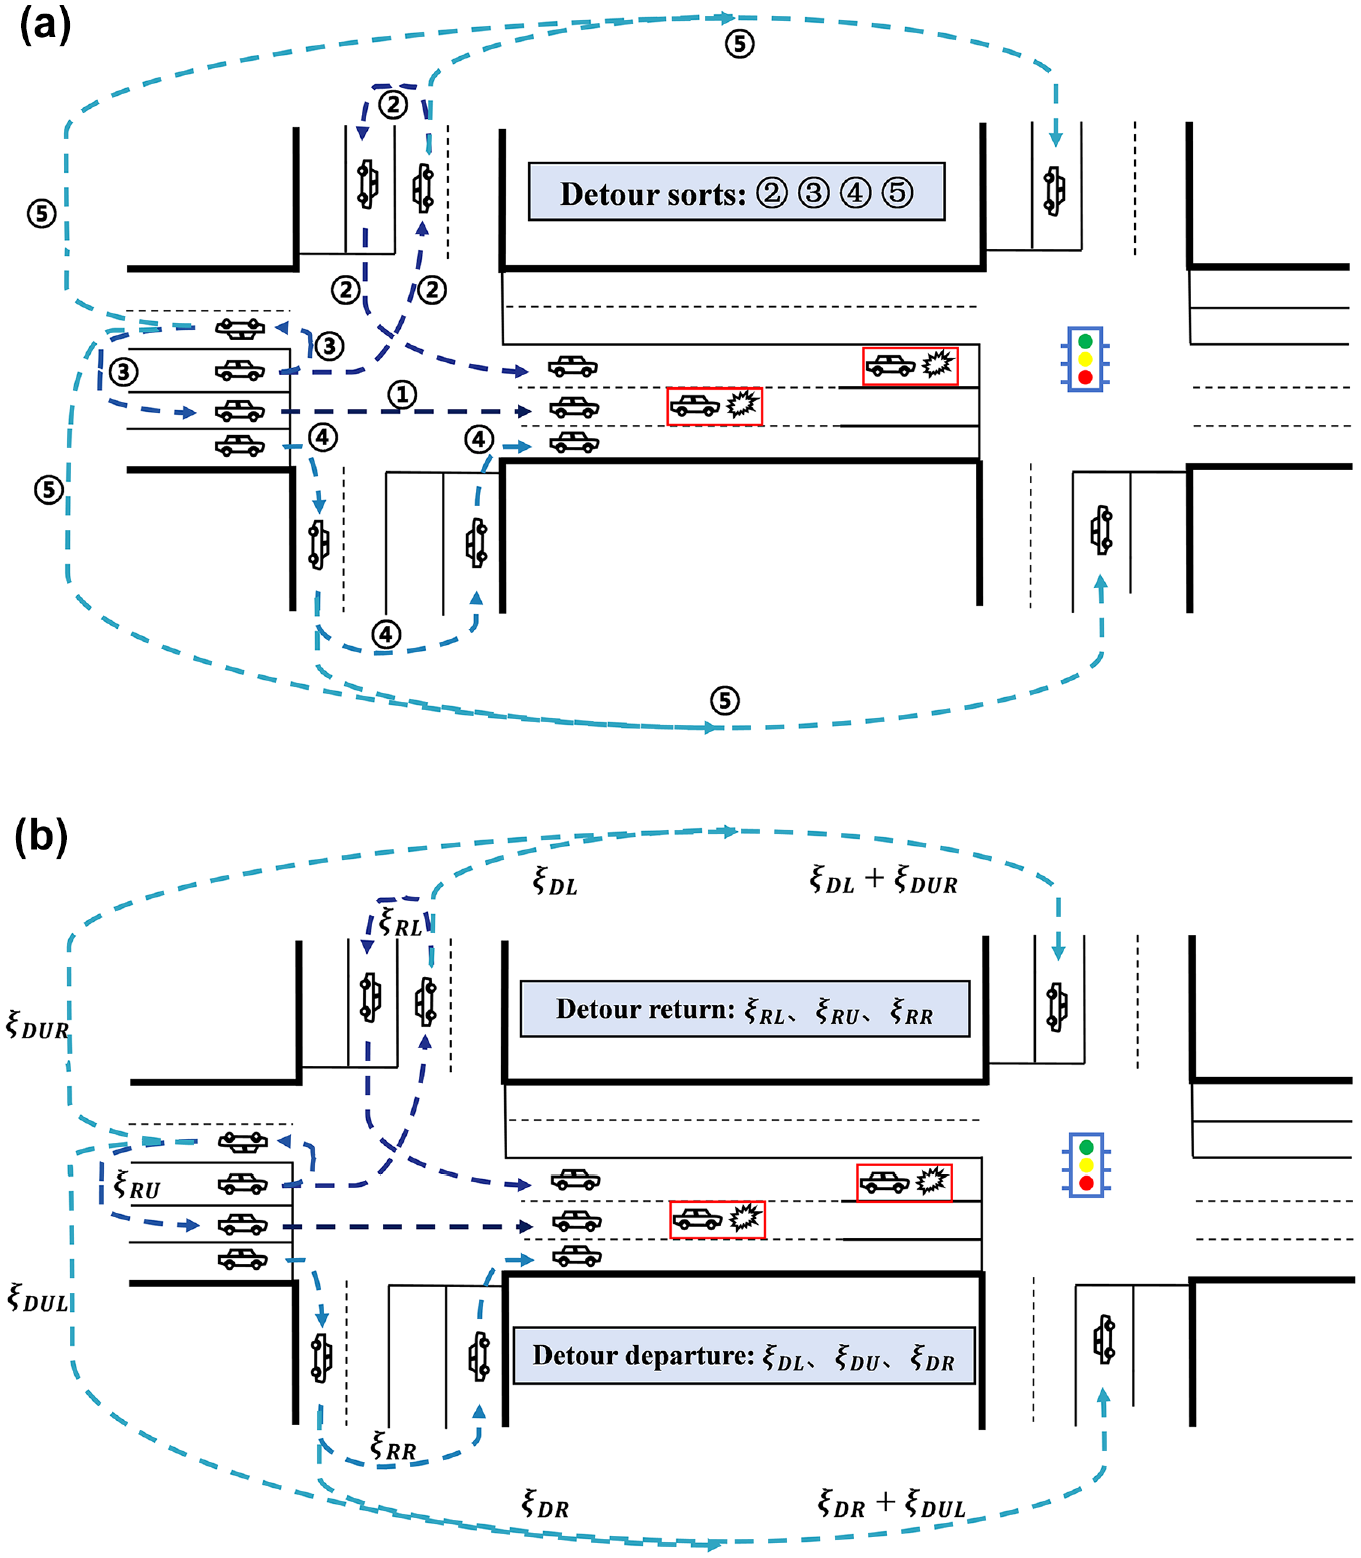
Analysis of detour modes of accident (upstream intersection): (a) detour sorts between upstream and downstream intersections with respect to the accident site; and (b) detour parameters between upstream and downstream intersections with respect to the accident site.
As shown in Figure 5b,


The road geometric conditions are depicted in Figure 5 (scenario 2 from Table 2 served as the input for the traffic demand). The accident occurred on a road section, affected one lane, and the three cycles had durations equal to 85 s, 130 s, and 160 s, respectively (
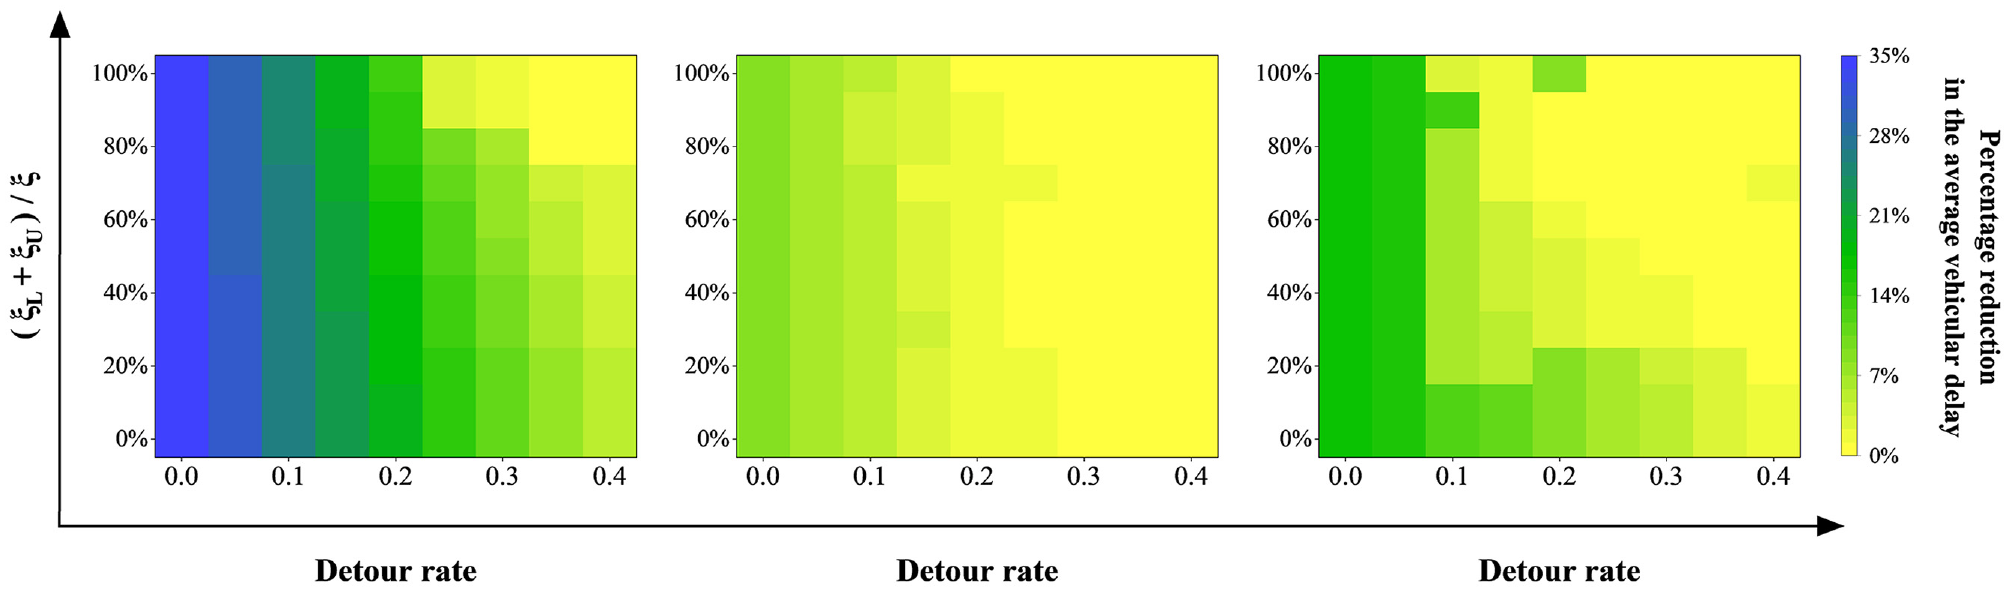
Percentage reduction in the average vehicular delay at different detour rates.
Figure 6 shows that in cases with different detour modes and varying overall detour rates, the collaborative optimization method exhibits varying degrees of improvement compared with signal-only optimization. The average percentage delay reduction for different comparison methods was calculated, yielding the percentage reduction in the average vehicular delay under different circumstances. Across the three cycles, the average reductions in the overall delay levels were 17.24%, 2.96%, and 6.20%, respectively. Comparatively, the situations in which the delay reductions were more pronounced in different cycles were mainly concentrated in scenarios without detours. Therefore, the collaborative optimization approach yielded a more significant reduction in the increased delay caused by early-stage incidents.
When controlling detour rates, the process begins by actively monitoring the detour rates upstream of accidents through the infrastructure such as variable message signs (VMS). Subsequently, collaboration between traffic police or other traffic management personnel and VMS was used. This collaboration, along with the driver’s tendency to follow navigation instructions, guided vehicles into different lanes or directed them to change their travel directions. This approach aimed to alter the proportion of drivers who chose to detour, thereby influencing the detour rate.
In practical applications, it is essential to combine various traffic guidance measures, including VMS, to maintain the detour rate within the desired range considering the current traffic conditions. This was done to improve traffic efficiency at intersections. It must be acknowledged that the precise control effectiveness and accuracy level for detour traffic flows were not within the scope of this study.
Conclusions
This study focused on addressing the short-term mismatch problem in traffic demand structures caused by urgent incidents. Considering the various effects of accidents on the supply and demand of traffic at intersections, an innovative hierarchical control model for variable lane assignments and signal timing was proposed.
The proposed model achieved prioritized resource allocation at accident intersections by considering factors such as location, intensity of the accident, and driver characteristics. This maximized traffic efficiency at accident intersections and reduced the potential risk of congestion spreading. Instead of using the delay as the objective function, the model employed degree of saturation, which is more comprehensive and directly related to the relationship between traffic flow and demand. In numerical analyses, the proposed model, compared with the signal-only optimization method and the HCM methods, successfully reduced the average vehicular delay at accident intersections. The overall delay levels at the intersections respectively decreased by 8.54% and 16.47% following the application of the two methods. In the sensitivity analysis, the impacts of different detour rates and methods in various scenarios on the performance of the model were investigated. As the number of vehicles approaching the upstream intersection is expected to decrease, the diminishing delay effects of the method gradually increase. For vehicles that have already entered the upstream intersection of the event, the method demonstrates a more significant effect in reducing the delay caused by the early stages of the event. Therefore, for real-time response to accidents, collaborative optimization methods can address the urgency of prompt handling when accidents occur and ensure the sustained reduction of overall delay levels after detour.
Overall, the collaborative optimization method demonstrated specific advantages in improving traffic efficiency and reducing safety risks under nonnominal disturbances at signalized intersections. The outcomes provided valuable guidance for the practical application of optimization methods in specific situations. To handle incidents in general urban road traffic, this method, which integrates degree of saturation, collaborative optimization, and sensitivity analysis, outperforms approaches that focus solely on signal optimization and lane allocation. It achieved superior performance in reducing vehicular delays and enhanced traffic efficiency. In the specific context of detour rate control and in conjunction with the use of this method, traffic management centers or Intelligent Transportation Systems can dynamically determine the optimal lane function combinations and signal timing schemes. This allows for real-time control of lane functions and provides an effective solution for traffic management. Traffic practitioners can apply this method and choose an appropriate detour rate range and method based on other network constraints of the intersection. This helps optimize the control strategy in real-world scenarios.
While this study explored the collaborative optimization method and analyzed its coordination with detours, certain limitations need to be acknowledged. First, the assumed nature of traffic data may limit the representativeness of the data set in capturing the most challenging traffic flow conditions under variable lane configurations compared with studies that use real-world data and conduct experiments on road networks. It is advisable to analyze further real-world data and incorporate stochastic analysis to enhance the robustness of the findings. Secondly, this study was based on the analysis of two intersections and their adjacent road sections. Therefore, the applicability of this model to networks as a whole has not been examined. Additional research is required to investigate the performance of the model on a broader network and evaluate its effectiveness in a more comprehensive road network context.
In future research, the project team will aim to address these limitations and expand the application of the collaborative optimization method to various types of urgent incidents. This research will attempt to implement the proposed method in a grid system and explore the collaboration among agents placed at different intersections. The goal is to achieve collaborative optimization of dynamic lane assignments and signal timings in a network traffic system during urgent incidents using VISSIM simulations. This approach provided insights into the dynamics of collaborative traffic management strategies during incidents in a broader and more realistic network setting.
Footnotes
Author Contributions
The authors confirm contribution to the paper as follows: study conception and design: J. Wang, Y. Chen, Y. Feng; data collection: Y. Chen, Y. Feng; analysis and interpretation of results: J. Wang, Y. Chen, Y. Feng; draft manuscript preparation: J. Wang, Y. Chen, Y. Feng, J. Zhao. All authors reviewed the results and approved the final version of the manuscript.
Declaration of Conflicting Interests
The author(s) declared no potential conflicts of interest with respect to the research, authorship, and/or publication of this article.
Funding
The author(s) disclosed receipt of the following financial support for the research, authorship, and/or publication of this article: This work was financially supported by the National Natural Science Foundation of China (grant numbers 52102398 and 52122215), the Science & Technology Commission of Shanghai Municipality (grant number 23692107600) and Shanghai Shuguang Program (grant number 22SG45).
Data Accessibility Statement
The data used to support the findings of the case study are included in the paper.