




Abstract
This paper presents the results and novel findings of generating a simplified version of the prevailing traffic features that existed during a major evacuation. Leveraging the underlying framework provided by the widely used cell transmission model, the desire is to reconstruct the unique characteristics of large congestion patterns that propagate under dense traffic states, where limited attempts at scaling this base model have occurred. The length-based cell-state framework presented can reproduce large spatiotemporal congestion patterns that exist, specifically from large-scale evacuations. To further simplify, the framework considers traffic state heuristics which are calibrated through oblique cumulative count and occupancy curves. As a result of this preprocessing technique, an artifact was found from the use of the cumulative curves under the lens of Newell’s two-phase traffic flow theory where three unique, separate queued regimes were identified within the fundamental diagrams. The methodology re-created a unique large-scale congestion pattern that existed during a past regional evacuation event, Hurricane Irma, the subject of this paper. To test this methodology, a large-scale congested period was analyzed, both with probe vehicle trajectory data and stationary radar detector data. Results demonstrate that traffic re-creation into state-based contours was able to be verified near a 90% level of confidence even at large spatiotemporal extents.
Climate science forecasts an ever-increasing risk of natural hazards, including those that will require evacuations. Although evacuations in a more localized geographic area, such as those in response to flooding and wildfires, will increase in number and severity in the coming years, there are limits to the extent to which the number of evacuees and the distances traveled enable the production of large-scale congestion patterns during the evacuation itself. Despite this, one of the remaining natural hazards that does produce such large-scale traffic dynamics is in the response to hurricanes. These patterns are known to differ from normal operations ( 1 – 5 ) the impacts of which research has attempted to quantify to maintain a reproducible index for characterization between events themselves ( 6 , 7 ). Such research has focused narrowly on understanding the prevailing conditions and traffic dynamics during the evacuation itself, whereas other research has investigated simulations of traffic during evacuation scenarios leading to travel time estimation, expectations of congested corridors, and evacuation time estimates (ETE) ( 8 ).
Traffic simulations can take on three general tiers of analysis: microscopic, mesoscopic, and macroscopic, ranging from vehicle-to-vehicle dynamics at the microscopic level to corridor and network scaled simulations at the macroscopic level ( 9 ), and further models based on both two-phase and three-phase traffic flow theory ( 10 , 11 ). Despite their frequent use for an array of transportation applications, in the context of large-scale evacuations, the underlying process for macroscopic modeling becomes the most realistic approach to be considered. Some of these include the transference of microscopic, vehicle-to-vehicle interactions to those in a corridor, or link within the network ( 12 ) and the performance of these large-scale simulations ( 13 ). For this transition to occur, a generalized methodology to allow vehicles to transfer into large spaces, or cells was initially introduced within the cell transmission model ( 14 , 15 ). This was also extended into single-pipe continuum models ( 16 ). However, these models still maintained their primary purpose of re-creating congestion patterns on relatively short segments of roadways. The underlying assumptions in these models follow the concepts of recursion and continuity, which also hinder their applicability in a macroscopic paradigm.
Motivation
Among natural hazards, hurricanes have the highest propensity to require large-scale evacuations, given their spatial extent, anticipated time of impact, and wide media coverage, which makes a vehicular evacuation possible and most effective ( 8 ). An example of the spatial extent to which hurricane evacuations can produce congested patterns is shown through speed contours with the use of the adaptive smoothing technique ( 10 ) shown in Figure 1 for the Florida Turnpike (SR 91) in Central Florida. This figure shows 36 h of speed data from September 6 to 9, 2017 over a 188.5-mi segment of the northbound facility. Seven million people were reported to have evacuated in advance of this catastrophic event. The two specific regions of study under examination in this paper are located at Bottleneck A in Figure 1, near mile marker (MM) 144.6. Figure 2 zooms in to show a 29.1-mi portion, further broken down into two segments. While numerous evacuation models exist ( 8 ), and some use tailored traffic simulation models for hurricane evacuations, there is a need to produce a more simplified version of existing traffic simulation models, that maintains accuracy even at a very large scale. This paper addresses this gap by producing a length-based cell-state framework, which considers states of traffic at a large spatiotemporal scale so as to simplify the vehicular simulation interactions required to reproduce prevailing dense congestion patterns that propagate during evacuations. This then translates into estimated travel times, and the prospect of reviewing past evacuation vehicular dynamics as the locations of congestion can be drastically different than the locations of recurrent congestion ( 7 ).

Northbound Florida Turnpike speed contours in advance of Hurricane Irma.
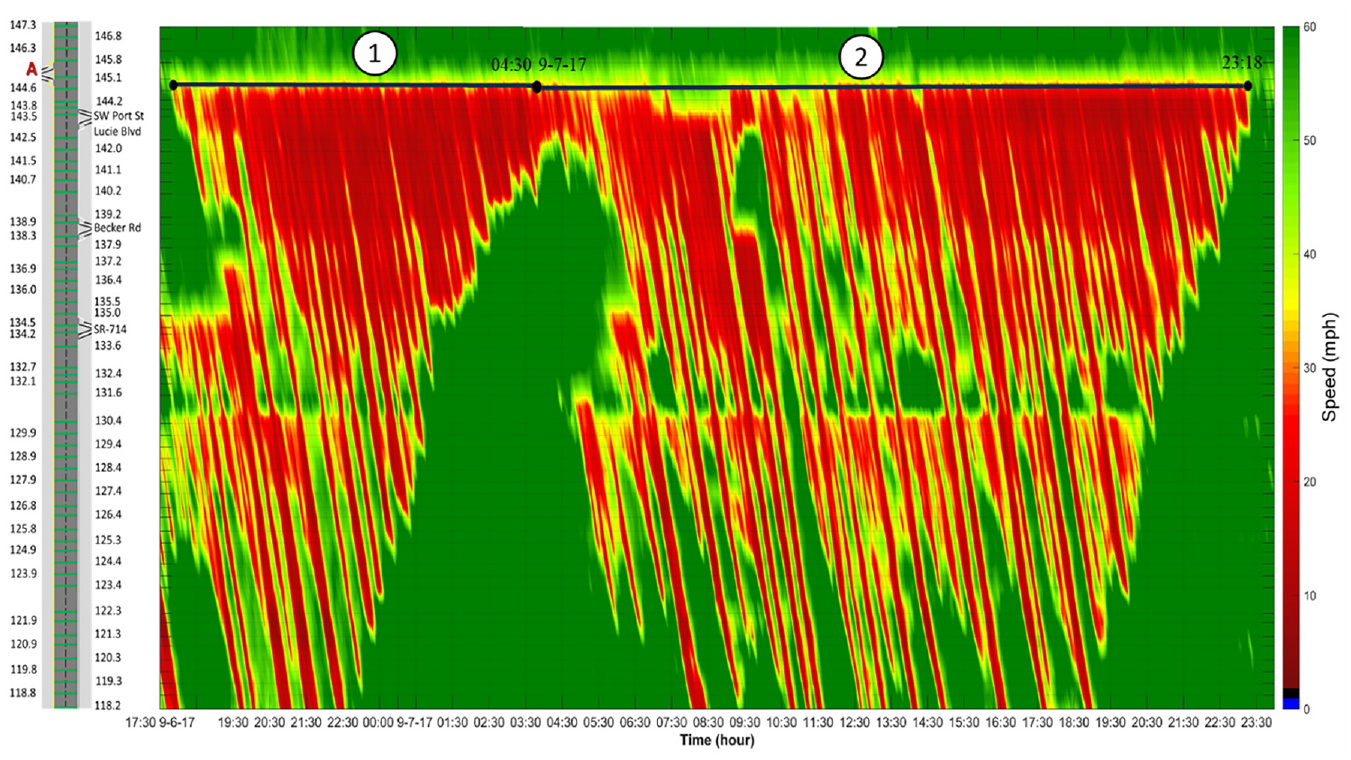
Bottleneck A: Port Saint Lucie Service Plaza.
Contributions: Research Goals and Objectives
The objectives of this paper are to:
identify an artifact produced from Newell’s two-phase traffic flow theory combined with cumulative count and occupancy curves;
establish a variable length-based cell-state framework; and
demonstrate the performance of the proposed framework toward its use in large-scale evacuation traffic simulations.
Methodology: Length-Based Cell-State Model
For the methodology to work, the concept of cell states has a base assumption that the individual cell, for its length and selected time stamps, requires traffic to be homogenous in that cell. To specifically ensure this state correctly displays the prevailing traffic conditions, a series of pre-calibration techniques, producing fundamental diagrams of the facility is conducted. Following this, on the discussion of homogenous sections of traffic; a unique perspective considers the outputs of Daganzo et al. ( 17 ) where long-range platoons of vehicles are classified as being homogenous where a macroscopic Markovian process can translate traffic. The difference, however, is to use specific pre-calibration methods described later to isolate these states into classifiable heuristics. This methodology is then exposed to traffic dynamics during the evacuation for Hurricane Irma, to both identify and then test the states produced from the calibration process.
As traffic states are converted into cells of variable length and time slices, this paper follows the methodologies of the widely known cell transmission model (CTM) ( 14 , 15 ), with the current purpose of specifically reproducing congestion patterns that were exhibited during the evacuation. However, the limited spatial capacity for CTM, based on recursion and continuity requirements, where density drives the state of traffic and if vehicles are lost between cells the prevailing traffic conditions in the next timestep can be under/overestimated, led to other forms of CTM being used to scale the model to larger spatial extents.
Adaptations of the base equations which dictate the CTM include ( 18 ) with the switching mode model and, most recently, toward understanding travel dynamics at a larger scale during evacuations ( 19 ). Despite ( 19 ) developing a methodology for an entire network topology to simulate evacuating traffic, a process to reduce the number of cells required within each evacuation route corridor is generated here. Moreover, simplifications can be made to the base and subsequent alternative corridor-based CTM to allow for larger cell consideration without losing accuracy in the propagation of congestion waves during large-scale congestion patterns. As such, this paper aims to investigate the reproducibility of large-scale congestion patterns that form on freeway facilities with a view to determining the dynamic and variable cell lengths to accurately depict this congestion.
To begin the reconfiguration of length-based cell traffic states, a cumulative oblique technique is used to calibrate fundamental diagrams for the roadway facility, which will then be used as a heuristic to isolate individual states. Cumulative count and occupancy oblique curves have the unique capability to extract traffic states out of data sets, which otherwise might be seen as a common cloud dispersion of data which does not portray true traffic states that maintain themselves for a certain duration over the roadway segment ( 5 , 20–23). To extract the traffic states of stationarity within the congested areas emitted from the bottleneck fronts observed with the radar detector data, a customized algorithm was employed to produce oblique cumulative count and occupancy curves, and subsequently pull near exact traffic states from these curves in a semi-automated fashion ( 24 ).
Calibration of Fundamental Diagrams and Creation of the Multi-State Queuing Regime
Similar to three-phase traffic flow theory ( 11 , 25–27) in which traffic is broken down into three phases (two of which are within the congested regime and are identified from a series of time requirements for state transitions and then speed thresholds, denoted as wide moving jams and synchronized flow), specific heuristics are employed in this paper, using the common traffic flow parameters, volume, and speed. Moreover, as with three phases, multiple states were produced from cumulative count curves from the available radar detectors along the stretches of roadway examined in this paper.
From the standpoint of Newell’s simplified two-phase theory ( 28 ), it was identified through cumulative count curves that three well-defined states existed within the congested areas during the evacuation. It should be noted that this classification of three states, which are considered to be in a queued state, derived from the cumulative count curves. As with the two-phase fundamental diagrams, a notable clustering of traffic occurred within the congested areas, following in a linear fashion from the theoretical jam density to the maximum capacity ( 29 ). However, an artifact was produced out of using two-phase traffic flow theory combined with oblique cumulative curves that made a distinct separation within these congested areas. These generalized areas are shown in Figure 3 with the corresponding empirical data grouped into these regions in Figures 4 and 5. The four classified states of traffic from the length-based cell-state framework are as follows:
•
•
•
•
Figures 4 and 5 demonstrate the corresponding fundamental diagrams and their hysteresis patterns based on separate locations in relation to the front of the bottleneck. Mile marker 144.6 in Figure 4 is the first detector upstream of the bottleneck front which was identified in Staes et al. (
5
). Following this are another two detectors upstream of the bottleneck front, with mile markers 144.2 and 140.2, occurring in Segment 1. The purpose of this figure is to demonstrate the fairly consistent pattern of transitioning between the
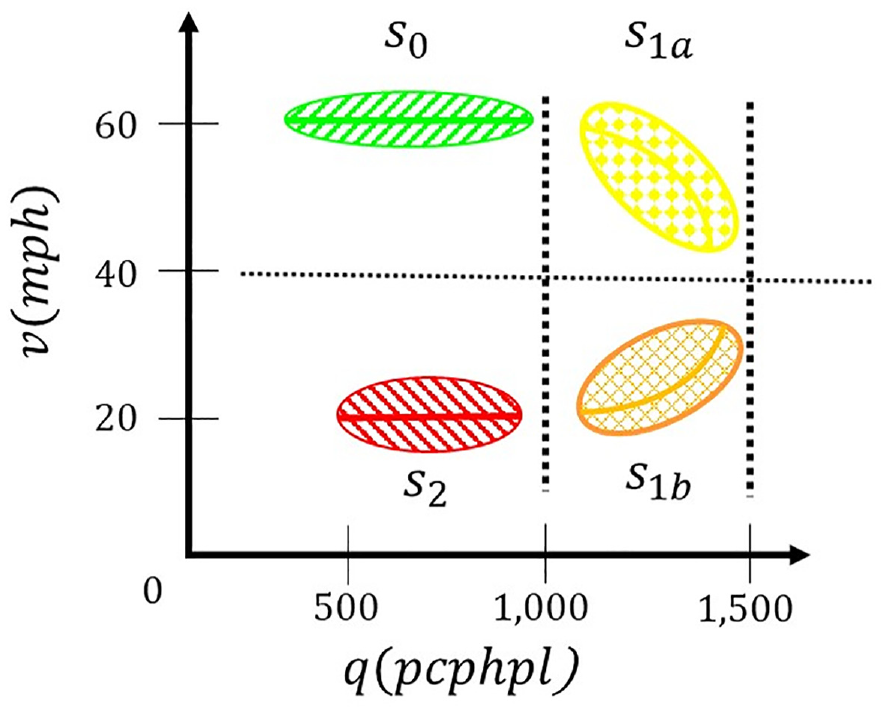
Generalized speed-flow fundamental diagram of the length-based cell-state framework.

State

State
The detectors in Figure 5 are nearly 20 mi upstream of the bottleneck front and are subject to continual jam waves, which can be seen in Figure 2, as the strands of low speed occurring in the mile marker 118.2 to 130.4 range. The hysteresis pattern within the detectors in Figure 5 demonstrates hysteresis between the
Hysteresis Path MM 144.6: Bottleneck A Segment 1

Note: vphpl = vehicles per hour per lane.
Hysteresis Path MM 118.8: Bottleneck A Segment 2

Note: vphpl = vehicles per hour per lane.
The artifact produced is driven by the classification of queued states from cumulative oblique curves: if the cumulative count and occupancy curves are going in different directions, traffic is in a queued state, parallel to moving along the linear line on the congested branch of the triangular fundamental diagram. With this, further inspection went into the classification of how the states interacted, or their hysteresis, which is shown in Figures 6 and 7 to produce such distinct separations of queued states. The general numbering of the states for this paper followed the values extracted from the fundamental diagrams in Figures 4 and 5 that were produced from oblique cumulative count and occupancy curves. Thus, the process behind these three separate states of traffic within the queued regime, including their hysteresis properties, is discussed with two of the oblique cumulative curves that were created from the data to reveal the artifact found from these methods.

Oblique cumulative count and occupancy curves for MM 144.6: Bottleneck A Segment 1.
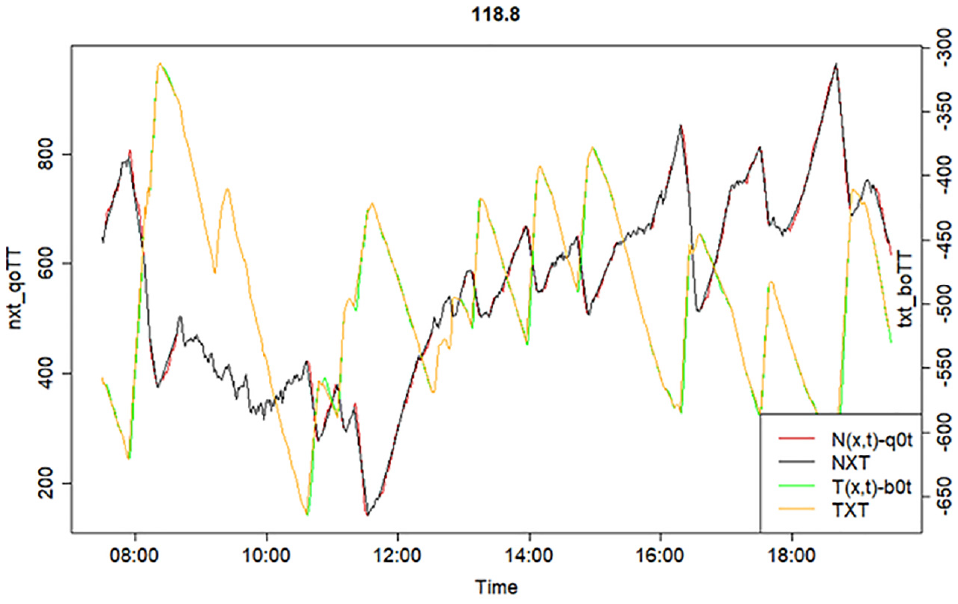
Oblique cumulative count and occupancy curves for MM 118.8: Bottleneck A Segment 2.
Example Hysteresis Between States
and
To demonstrate the difference in hysteresis based on the type of queue interfaces, we observe the difference in cumulative count curves and the subsequent translation in the segmented fluctuations in traffic state from the diagrams. We also provide Table 1 to show the individual traffic states and their transitions, which depicts the three states of traffic that are in a queued state by definition from two-phase traffic flow theory ( 28 ). It has been tested on numerous different locations within the same congestion pattern and others on alternative facilities; adjusting the time range of the curves does not remove or alter the results. By splitting the above chart into only a segment that is in the first four hours where the count is increasing and the occupancy is decreasing, the same chart exists if only looking at the 4-h segment.
There are two phenomena occurring within this congestion period at the bottleneck front within Segment 1 that can be seen as an increasing count curve and decreasing occupancy curve. Where there are no sudden changes in the traffic state, however, a prolonged stagnation of traffic in
After a certain time, with enough vehicle accumulation, the traffic state moves into an entire jammed state, occurring near 01:00 in Figure 6, where the cumulative count curve begins to decrease, and the cumulative occupancy curve begins to increase. Looking closely within this later region (
Example State Hysteresis Between Queued State
and
With an understanding of the presence of the queued state
In Figure 6, it is apparent that the locations where a type
Another interesting note is the time difference between each of the state transitions. For instance, when going from
The above depictions of the three states are classified as queued from two phases with the use of triangular fundamental diagrams and oblique cumulative curves; the specific thresholds for these states are extracted from the fundamental diagrams. To be specific, the fundamental diagrams in Figures 4 and 5, are the extracted states from the oblique cumulative count and occupancy curves, where the flow, speed, and occupancy are similar to the outputs in Tables 1 and 2. From visual observations, the flow and speeds for the classifications that will be used later as the state classifications are pulled from these diagrams.
A comment on the time gaps between the designated states observed within Table 2: as the algorithm is searching for specific states that maintain the same traffic features (flow and occupancy) for a minimum amount of time, 5 min in this case, there are instabilities that occur between the states. In the case of a long queue, such as the one analyzed here, the choice for different drivers to choose differing acceleration and deceleration patterns might shed light on the phenomena ( 28 , 31 ), or even be related to individual drivers’ aggressiveness or timidness ( 32 ).
With the demonstration of the pre-calibration methods, and the artifact of two-phase based oblique cumulative count and occupancy curves established, the simplified framework for re-creating these congested traffic patterns is discussed.
Generation of the State Contour
The core concept of this framework is to consider the entire roadway as large cells, with the ability to be variable in both length and width (space and time). To cover the variable time constraint, we use specific cross sections of time
State Classification
To begin this re-creation process, the locations of all the radar detectors would be known and aligned in order, from upstream to downstream, and then the

where
State Contour Matrix
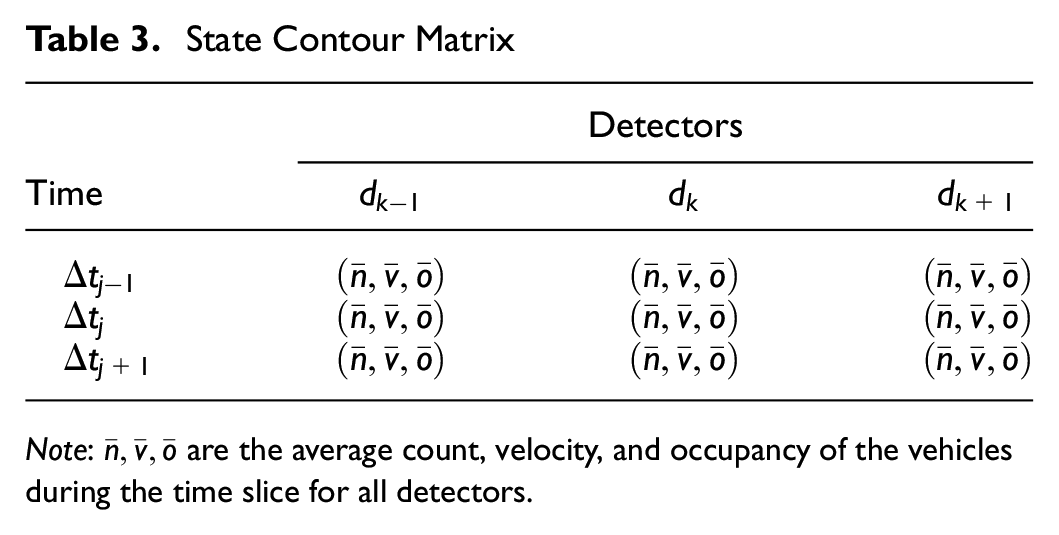
Note:
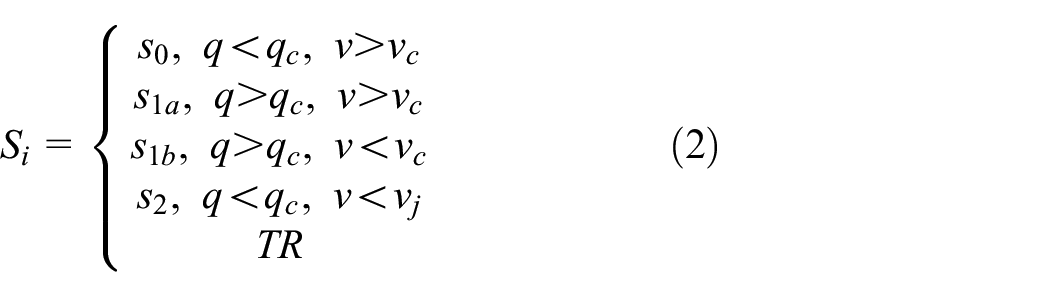
With this matrix created, we then assign the heuristics identified within the fundamental diagrams that were developed from the oblique cumulative count and occupancy curves. The state classification is meant to be a generalizable set of inequalities for the cell to take on when considered in that state. Those ranges of traffic values are demonstrated in Equation 2.
where
TR is considered a transition state where the averaged traffic flow values do not fall into any of the ranges.
An example of this partitioning is shown in Figures 4 and 5 which demonstrate the distinct separation between queued states
Case Study
To test the proposed length-based cell-state framework, we impose the methodology on a location of dense congestion that formed during a previous evacuation, Hurricane Irma, along SR-91 (Florida’s Turnpike). As the intent of this paper is to test the hypothesis of using variable cell lengths (in time and space) to re-create the prevailing traffic conditions that existed, toward the future use of this method on evacuation modeling, the section of road and event that occurred were ideal.
Data
As mentioned, the study segment is on SR-91 during the evacuation for Hurricane Irma, from September 6 to 7, 2017. Data for this event were extracted with the use of the Regional Integrated Transportation Information System (RITIS). The 52 radar detectors polled in 1-min intervals and gave count, speed, and occupancy. Their specific locations are shown in Figure 2. In general, the congestion pattern that was exhibited during the evacuation, specifically at Bottleneck A, occurred between mile markers 110 and 144.6, over the span of two days. This radar detector-based data at specific locations along the corridor was used as inputs to the methodology.
The second set of data used was for verification and was provided by INRIX. It consisted of nearly 17,000 individual vehicle trajectories that traveled through this same segment during the evacuation. These vehicle trajectories required assignment and preprocessing techniques to be able to compare the individual trajectories against the length-based cell-state framework. Figures 8 and 9 display these vehicle trajectories. Figure 9 is specifically for Segment 1 at Bottleneck A.

Bottleneck A: SR-91 INRIX vehicle trajectory data.
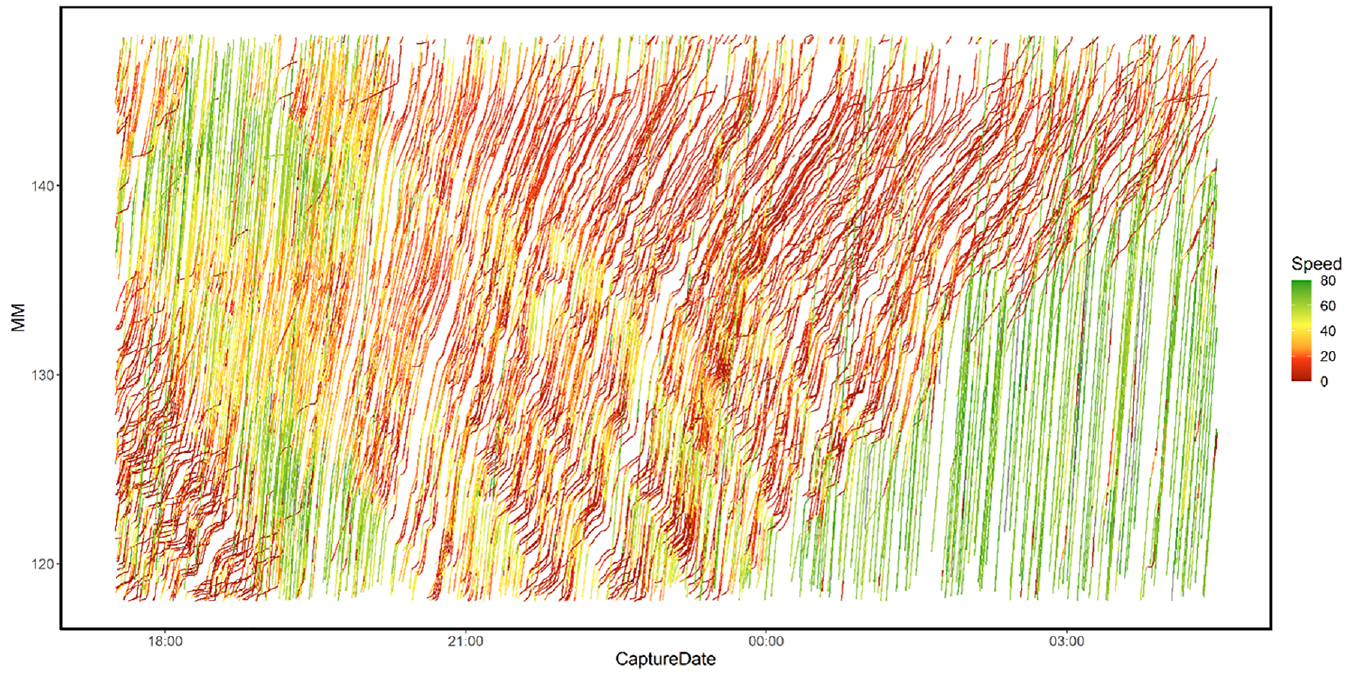
Bottleneck A: SR-91 INRIX vehicle trajectory data for Segment 1.
Results
The first step presented in the methodology isolated the entire congestion pattern into individual states of traffic. The purpose behind this is to demonstrate not only the re-creation capability using the heuristics of pre-calibration from the cumulative count curves and the logic behind re-creating the state-based contours, but also the individual time slices from the state-based contour that were chosen. Figure 10 is the state contour produced from the methodology, with a

State contour SR-91 Segment 1:5 min.
Once the state contours were generated, the next step was to pull trajectories from the probe vehicle data set that intersected the cells to determine how accurate the cell states were in time and space in relation to the extent of the queue faced by the vehicles themselves. While Figure 9 portrays all of the vehicle trajectories within Segment 1, a large quantity of these trajectories either polled at larger intervals than the radar detector data, or only traveled a short distance within the corridor. For this reason, the vehicle trajectory data were filtered to only include trajectories that traveled at least 1 mi and had an average polling interval of less than 1 min. The average polling interval had to be used as the trajectory data did not poll in equal intervals. These values for minimum travel distance and polling hertz might also be an area of future work focused on sensitivity analysis of acceptable trajectory data. From this, Figure 11 was produced. Here, all the trajectories have been filtered to be used in the verification process.
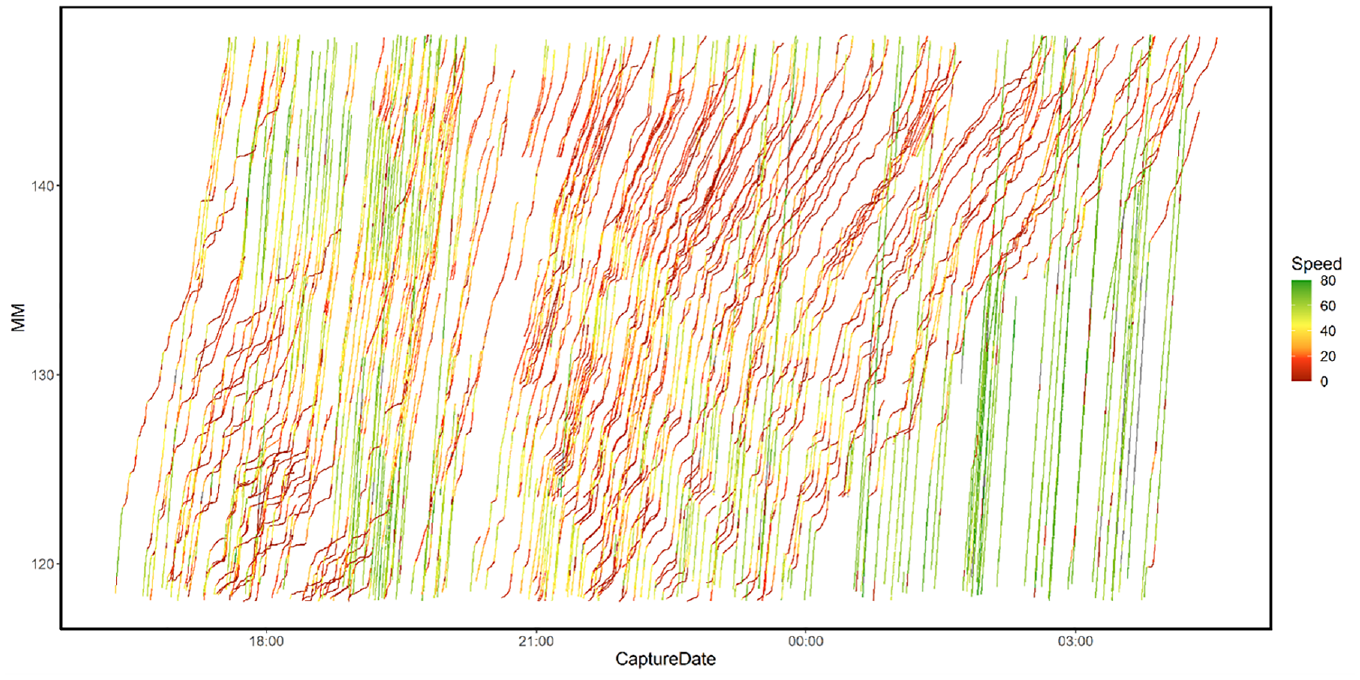
Filtered vehicle trajectories in Segment 1 used for verification.
To compare the results of the length-based cell-state transmission model, an overarching metric was used to compare the state of traffic against all the vehicle trajectory data and follows Equation 3:

where
S is the number of stations for some segment of road where the trajectory data intersected,
s is the
C is the cell number assigned to the detector station that is in a state,
T is the total time of the cross section in question, (20 min in this paper), and
This equation was also adapted to cross-check if a single trajectory matched the state of the cell. The equation was thus edited where
Cell-State Comparisons Versus Probe Vehicle Trajectories
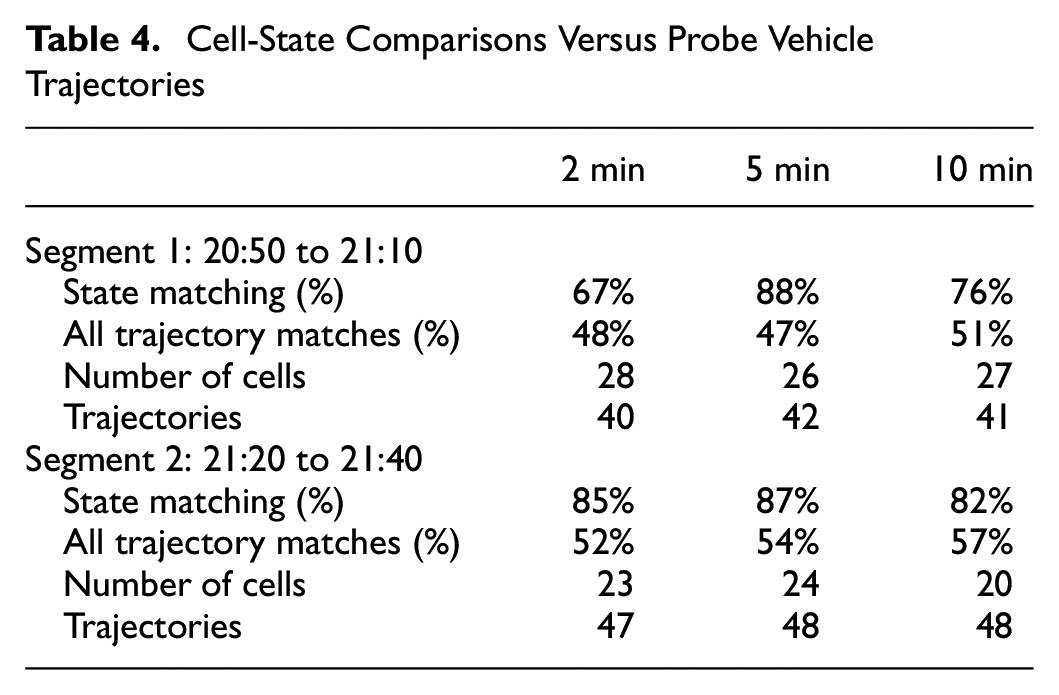
To test the results using Equation 3 and its adaptation, two sections from Segment 1 of Bottleneck A were analyzed over two 20-min (T = 20 min) segments from 20:50 to 21:10 and 21:20 to 21:30. These locations were chosen as there were trajectories that faced jams and the cell states also had several jams as all four states demonstrated. Following this, all three

State contour selected comparison sections: (a) 2-min sections; (b) 5-min sections; and (c) 10-min segments.
Table 4 contains the results of the examination of the length-base cell-state framework against the vehicle trajectory data. It is interesting to note the State Matching (%), operated best with a
Despite the near 50% accuracy compared with the All Trajectory Matches (%), the length-base cell-state framework was able to reach a near 90% accuracy to identify the state of the cell against the trajectory data. The reasoning behind the lower All Trajectory Matches (%) is twofold: it was identified in Paczia et al. ( 33 ) that there is substantial variation between probe vehicle trajectory data sets and static radar detector data. While at the exact location of the detector, both data sets match, the areas between detectors, however, can mismatch, leading to inaccuracies in travel time and the state of traffic. The second point worth mentioning is the size of the cell in time and space when state transitions are propagating through the traffic stream. It is very likely that trajectories entering the bottom of a cell (upstream of the detector location) are experiencing a different state than what is at the exact location of the detector, and this can be translated into the far downstream front as well. Despite these drawbacks, the underlying framework still maintained a reasonable accuracy for all the trajectories and nearly 90% if a single trajectory interacted with the state classified by the cell.
Conclusions
The length-base cell-state framework was formulated and tested against real-world vehicle trajectory data that occurred during the evacuation for Hurricane Irma. The intention of the framework was to re-create prevailing traffic conditions that occurred on large segments of roadway without losing accuracy. This framework was driven by firstly establishing the reduction in traffic features into cells, similar to the widely known CTM, with a view to depicting homogenous traffic states into very large cells, which will reduce the computations required for the eventual integration of this method into evacuation modeling. The framework also investigated a pre-calibration method that demonstrated an artifact from two-phase traffic flow theory and oblique cumulative count and occupancy curves leading to the identification of three isolated congested areas within the congestion regime of the standard triangular fundamental diagram.
Future work using this new length-based cell-state framework will include its use in large-scale evacuation modeling, where the larger cell sizes, denoted by specific
Limitations
As with any new approach or with tangible findings from empirical data there is always a question as to its transference and the requirement for more data surrounding the underlying evidence. To this end, this paper specifically chose the roadway segment in question given the substantial queuing that persisted, and even more so as it occurred during an actual evacuation. The stock macroscopic data produced from the event, extracted from stationary radar detectors, established the core traffic flow variables needed for the analysis to occur. Although this paper focused on this one event, the use of a secondary data source, that is not only generated from a separate entity but is indeed a different type of data set provides for the validation process to be more conclusive in the findings here and reasonable. With this said, in future research and further verification of the findings in this paper, extending beyond the period during evacuations but also within recurrent congestion will be an area of direct interest.
Footnotes
Acknowledgements
The authors would like to thank INRIX and RITIS for access to the vehicle trajectory data and radar detector data respectively. The authors also thank the Federal Highway Administration Dwight David Eisenhower Fellowship Transportation Fellowship Program from which funding was used to conduct this research.
Author Contributions
The authors confirm contribution to the paper as follows: study conception and design: Haizhong Wang and Robert L. Bertini; data collection: Brian M. Staes; analysis and interpretation of results: Brian M. Staes; draft manuscript preparation: Brian M. Staes. All authors reviewed the results and approved the final version of the manuscript.
Declaration of Conflicting Interests
The author(s) declared no potential conflicts of interest with respect to the research, authorship, and/or publication of this article.
Funding
The authors disclosed receipt of the following financial support for the research, authorship, and/or publication of this article: from the Eisenhower Fellowship.
