



Abstract
Concrete curing is a critical stage during construction for volume stability, long-term strength development, and ultimate durability. Poor curing can lead to shrinkage, scaling, and other durability issues. Proper concrete curing maintains sufficient moisture in the concrete and allows continuous hydration. Curing for concrete pavements often involves the application of a membrane-forming curing compound to help minimize moisture evaporation and promote desirable concrete property development. However, assessing the application rate of curing compounds and effectiveness on freshly paved concrete is difficult, as most evaluation methods are performed on hardened concrete and are not applicable or difficult to assess for fresh concrete in the field. This study proposes electrical resistance as a measure to assess the drying behavior of fresh concrete to quantify the effectiveness of curing. The findings of this study demonstrate that resistance is able to distinguish between samples with and without curing compounds and significant differences in drying observed between the surface and relatively shallow depths. In addition, the testing techniques were able to differentiate between the quality and rate of curing compound application and evaluate performance across a variety of environmental conditions. These findings indicate that a resistance-based approach could be a low-cost and non-destructive technique to evaluate the effectiveness of curing compound applications in real-time.
Keywords
Concrete curing is the act of maintaining adequate moisture and temperature in the concrete to maximize the hydration process ( 1 ), and hydration ceases when the relative humidity falls below 80% ( 2 ). While a variety of curing techniques can be used, including wet curing, internal curing, and forced chemical curing, membrane-forming curing compounds (MFCCs) are often the easiest and most cost-effective technique to minimize evaporation for pavements and slabs placed on grade. Concrete curing is crucial to reduce early-age cracking and for the development of desired hardened properties, such as low permeability ( 3 , 4 ). Conversely, poor curing results in premature deterioration in the form of plastic and drying shrinkage cracking, scaling, joint spalling, and freeze–thaw deterioration ( 4 , 5 ).
According to American Concrete Institute (ACI) committee 308, concrete possesses a near-surface cure-affected zone that is strongly related to surface durability and is differentiated from the performance of the interior, bulk concrete. While the cure-affected zone does not have a specifically agreed-on definition, the generally accepted depth is 0.25–0.75 in. (6–19 mm) ( 6 ). As concrete may result in numerous different shapes and volumes, the amount of exposed surface area is quite different between a pavement slab and a foundation. If curing is only a surface effect, it has a minimal impact on the strength of large elements, and data showing loss of strength related to curing is based on small cylinders where the effect is sample-size dependent. For slabs, the effect of curing is observed in the surface layer performance, including abrasion resistance and permeability ( 7 ).
Concrete curing can be classified into initial and final curing ( 1 ). Initial curing is defined as the period from concrete placement through to the completion of surface finishing. During initial curing, concrete bleed water rises as solid materials settle, and subsequently evaporates or is consumed in the hydration of the surface cementitious materials. Therefore, minimizing moisture loss during initial curing is necessary to reduce the loss of water and prevent plastic shrinkage from occurring ( 8 ). Techniques to minimize moisture loss include fogging, wind shades, or the application of surface moisture retardants. Final concrete curing includes the period after final surface finishing has been completed and is important to prevent continued moisture loss and incomplete hydration at the surface ( 7 ). Final concrete curing can be accomplished through the addition of external water through ponding, fogging, or water-retention measures. Ponding is labor-intensive and often not cost-effective ( 9 ). Curing utilizing water-retention techniques includes plastic sheeting or wet burlap or the application of MFCCs. While highly effective when installed correctly, plastic sheeting presents significant drawbacks, such as the inability to install over large areas, securing to minimize ballooning, and surface marking ( 9 , 10 ). The MFCC is a cost-effective method for curing concrete on a large scale because of the ease of application, little supervision required after application, and the ability to sufficiently minimize moisture loss ( 10 , 11 ).
MFCCs are chemical solutions of a wax or resin dissolved in water or other chemical solvents. Once applied to a newly paved concrete pavement surface the solution breaks and the water or solvent evaporates, leaving behind the wax or resin to form a membrane over the surface of the pavement. The membrane seals to retain moisture in the concrete by lowering the evaporation rate and blocking the concrete pores ( 3 ). ASTM C309 ( 12 ) classifies curing compounds into three types based on color and solid constituents and two classes based on the solid chemistry, as shown in Table 1.
Curing Compound Classification (ASTM C309)

MFCCs are easily applied using a hand-held sprayer or curing cart for large surface areas and several factors are considered when applying and evaluating the effectiveness of MFCCs, including ambient conditions, time of application after finishing, application rates, uniformity of application, type of curing compound, and surface texture of the concrete (13–16). Measurement methods for MFCCs include visual inspection, penetration resistance ( 17 ), image analysis, the dielectric constant ( 18 ), compressive strength ( 5 ), abrasion resistance testing ( 10 ), rapid chloride permeability testing ( 14 ), moisture retention ( 5 ), reflectance ( 18 ), relative humidity testing ( 14 ), sorptivity ( 5 ), capillary pressure sensor development ( 19 , 20 ), and degree of hydration ( 5 ). These tests provide useful information related to concrete curing; however, most are only performed on hardened concrete, making them difficult to use in the field or as the basis for adjustments during the early age of concrete. Most methods have a small footprint and do not assess variability across a pavement. The objective of this research was to develop a test method to measure curing effectiveness in real-time during the early age of concrete.
Electrical resistivity has become a powerful and low-cost technique to assess the number and connectivity of pores in the hydrated concrete structure and predict future durability. Resistance is a measure of how easily a current passes through a medium agnostic of geometry or distance, whereas resistivity includes geometry and factors, such as temperature. While related, resistance and resistivity are not directly comparable, which is why the following experimentation is divided into two phases. The initial work utilized the standard Wenner four-pin resistivity probe commonly used for concrete quality control, but with data collected from probes inserted into fresh concrete. The follow-on work developed a test method utilizing electrical resistance as a measure or moisture loss in fresh concrete and quantified the effectiveness of curing, inspired by the Wenner electrical resistivity work. As concrete transitions from a plastic to a solid phase, free moisture in the concrete decreases and resistance increases, as the liquid phase of concrete is a better electrical conductor than the solid phase ( 21 ). As concrete transitions from plastic to solid, hydration products grow and interconnect, increasing density and also increasing resistance ( 5 ). At early ages (<3 days) the influence of drying resistance is much greater than the that of densification. Therefore, measuring the resistance at the surface and at a given depth inside fresh concrete provides insight into how well the application of the curing compound is retaining moisture within the near-surface area and/or whether a lack of curing leads to moisture loss.
Materials and Methodology
The research program was divided into two parts. The first used uncoated nails as probes embedded into two different concrete mixtures (WP-0.40 and WP-0.43) at two depths, 0.50 and 0.25 in. (2.5 and 6.25 mm), with uncured and MFCC-treated samples subjected to a single environmental condition. Data was collected through a standard four-pin Wenner probe resistivity array with a correction factor applied for a flat surface geometry. The Wenner approach was developed for single points in contact with a concrete surface. The device was used for an initial assessment to test the possibility of the approach. After potentially actionable data was collected an updated device was created. The second portion used a single mixture (ER-0.42) and a custom-built two-pin array to evaluate resistance at the surface and the embedded depth of 0.5 in. (12.5 mm) through probes shielded using nylon sleeves to isolate the point of measurement to the cure-affected zone. The probe distance for the two-pin array matched the 1.5 in. (37.5 mm) spacing of the more common Wenner array. Using this arrangement, a voltage was applied through the embedded pins, the current was measured, and the resistance was determined using Ohm’s law. The second portion evaluated concrete cured at two environmental conditions (high and low): the high evaporative condition, 100°F (38°C) and 32% relative humidity, and the lower evaporative condition, 73°F (23°C) and 50% relative humidity. Testing included four curing applications: none (0 ft2/gal [0 m2/L]); 180 ft2/gal (4.5 m2/L) (uniformly and non-uniformly applied); and 400 ft2/gal(10 m2/L) uniformly applied.
Materials, Mixing, and Curing
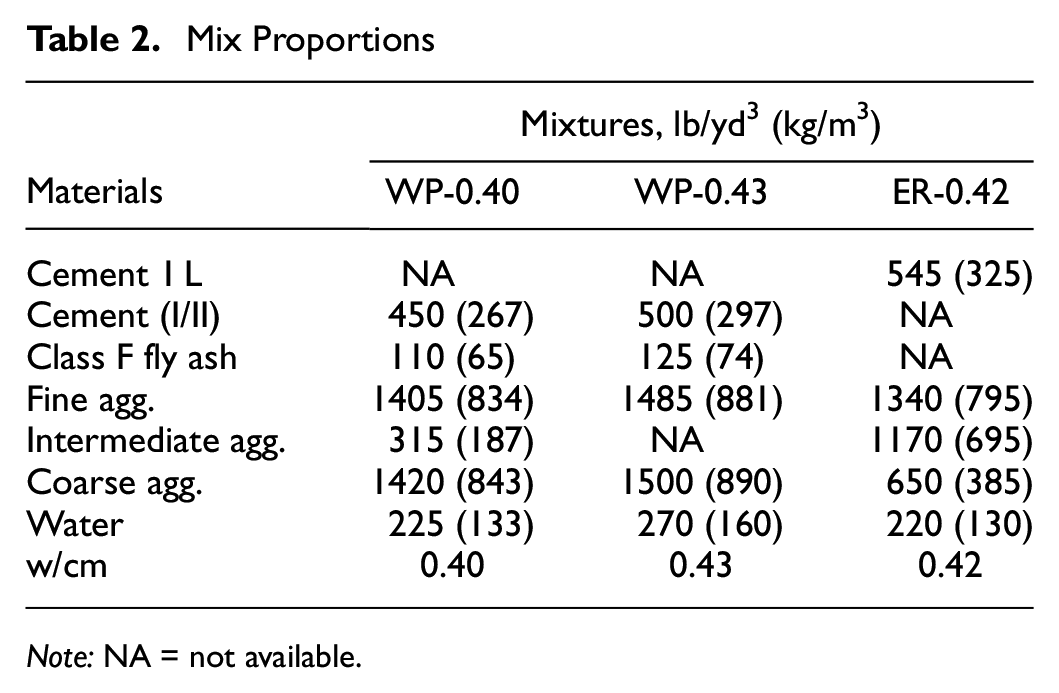
Mixtures were selected to represent common paving mixtures with slump of less than 2 in. (22) and air content between 5% and 6% (Table 2) (23). Mixtures WP-0.40 and WP-0.43 used ASTM C150 ( 24 ) cement meeting both Type I and Type II requirements and ASTM C618 class F fly ash ( 25 ). mixture ER-0.42 used Type 1L cement ( 26 ) containing 12% limestone. All mixtures used ASTM C33 ( 27 ) river sand and limestone intermediate and coarse aggregate. Admixtures included a polycarboxylate water-reducing admixture and an olefin-based air-entraining admixture. The curing compound used for the Wenner tests (WP-0.40 and WP-0.43 mixtures) was a white-pigmented wax meeting ASTM C309 ( 12 ), classified as Type 2, class A. The compound used for the embedded tests (ER-0.42 mixture) was a poly alpha methyl styrene (PAMS)-based product meeting ASTM C309 Type 2B ( 12 ).
Mix Proportions
Note: NA = not available.
After mixing, casting, and surface finishing, the specimens were left in a laboratory condition until bleed water evaporated before application of the MFCC. For the Wenner probe portion of the testing, the curing compound was applied at 200 ft2/gal (5 m2/L) using a brush. For the embedded resistance portion, specimens were cured using a pump sprayer or brush (Figure 1a) with four different application rates:
an uncured reference (Figure 1a);
180 ft2/gal (4.5 m2/L) (uniform) applied using a pump sprayer (Figure 1d);
400 ft2/gal (10 m2/L) (uniform) applied using a brush (Figure 1b);
180 ft2/gal (4.5 m2/L) (non-uniform) applied using a pump sprayer (Figure 1c).
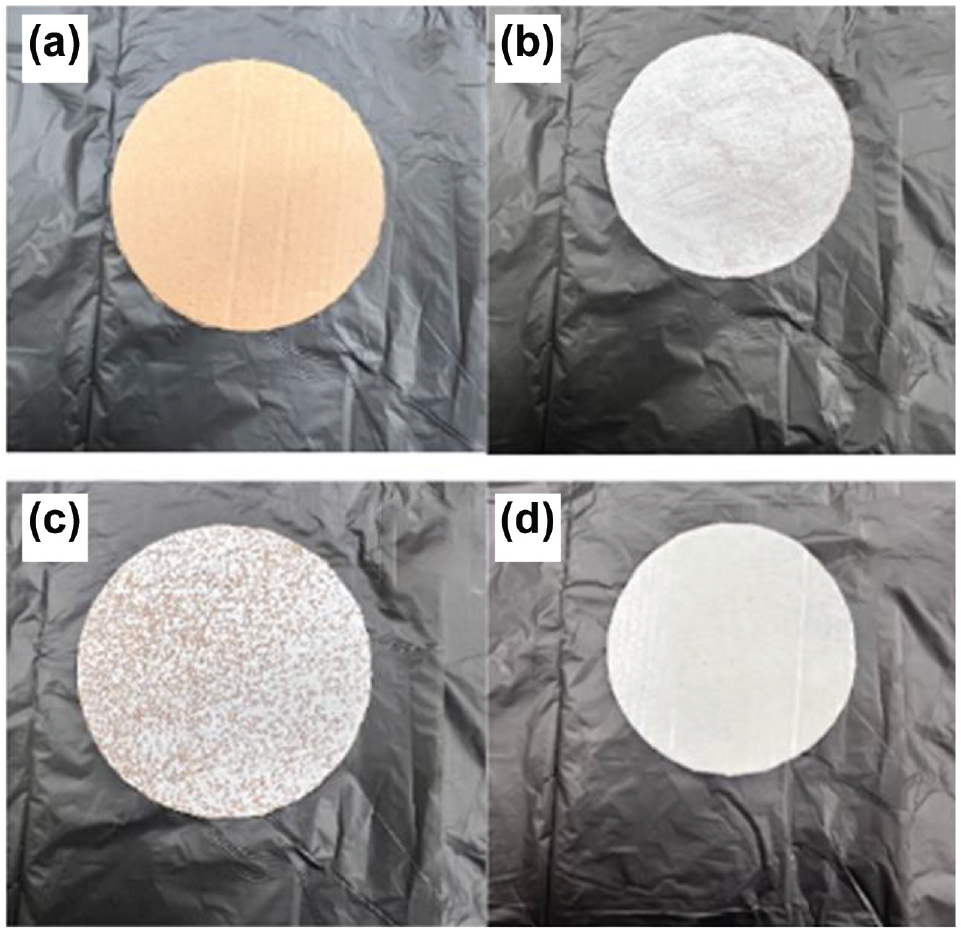
(a) Cardboard with no curing compound. (b) Cardboard with 400 ft2/gal curing compound applied using a brush (400 uniform [U]). (c) Cardboard with non-uniformly applied curing compound at 180 ft2/gal (180 non-uniform). (d) Cardboard with uniformly applied curing compound at 180 ft2/gal (180 U).
Concrete Testing
Wenner Probe Approach
For the first part of this study, 4 in. × 4 in. × 14 in. (100 mm × 100 mm × 350 mm) samples were prepared following the WP- 0.40 and WP-0.43 mixture designs shown in Table 2. Curing compound was applied at a single rate of 200 ft2/gal (5 m2/L) over the cured samples and a box fan was used to blow air over both the cured and uncured samples at a lab temperature of 73°F (23°C) and 50% relative humidity. Using the ACI 308 nomograph, the evaporation rate was estimated at 0.11 lb/ft2/h (0.54 kg/m2/h). The effect of w/cm was evaluated by comparing unshielded probes inserted to 0.5 in. (12.5 mm) between WP-0.40 and WP-0.43 and the effect of probe depth was compared for mixture WP-0.43 using probes inserted and concrete consolidated after probes insertion at either at 0.5 in. (12.5 mm) or 0.25 in. (6.25 mm). Probes were held in place using non-conductive wood (Figure 2a). The test setup showing cured and uncured samples is shown in Figure 2b with the fan blowing length-wise. An air gap was included between the concrete and supporting frame to allow air movement and not prevent drying of the surface. Resistivity was measured manually by connecting the electrodes on the Wenner probe (Figure 2c) to the tops of the nails on the test frame. Resistivity measurements were taken for up to 12 h until the researcher went home. By the next morning, the measurement values exceeded the range of the Wenner probe.

(a) Test setup and (b) pair of samples with and without curing compound, and (c) the commercial Wenner probe device.
Embedded Resistance Approach
The embedded resistance probe used a two-pin arrangement in a non-conductive plastic frame to hold four stainless steel probes, two for each depth (Figure 3a). Two of the probes were just in contact with the surface of the concrete and the others were embedded 0.5 in. (12.5 mm) into the concrete. The sides of the probes were protected using nylon sleeves to ensure that data was collected only from the concrete at the probe tip location. Similar to the previous arrangement, the frame was set 1 in. (25 mm) above the surface to allow the free movement of air at the concrete surface (Figure 3a). A data logger was used to record resistance development with time at 5-min intervals. The complete setup is shown in Figure 3b. An arbitrary cutoff of 160 kΩ/cm was selected as the maximum value for recording resistance based on the range of initial observed results and precision drift of the equipment. Samples for embedded resistance testing were 12 in. × 12 in. × 4 in. (300 mm × 300 mm × 100 mm) with the plastic cutoff cylinder shown in Figure 3b only used here to show the bridge height.

Embedded surface resistance device: (a) non-conductive frame and (b) Resistance device setup on concrete).
Results And Discussion
Wenner Probe Approach
Results for resistivity measured using the four-pin Wenner probe as measured on top of the embedded nails are shown in Figure 4. Resistivity increased with time for all samples, indicating moisture loss in the near-surface region. In all cases, regardless of depth, samples with curing compound (Cured) had lower rates of resistivity increase than the corresponding uncured (Uncured) samples. For the uncured samples, the rate of resistivity gain increased rapidly starting at 2 h after mixing. For the cured samples, resistivity only began to increase at 4 h after mixing.

Wenner probe results.
Resistivity increased to a greater magnitude for the WP-0.40 cured and uncured samples compared to the corresponding WP-0.43 cured and uncured samples, likely because of the lower w/cm and faster pore emptying. A greater fraction of the available moisture may have been lost to hydration and evaporation in the samples with the lower w/cm. Resistivity increased less for the WP-0.43, 0.25 in. (6.25 mm) probe depth samples compared to the corresponding WP-0.40 and other WP-0.43 samples that were tested at the 0.5 in. (12.5 mm) probe depth. The finding of a smaller increase in resistivity at the shallower probe depth was surprising, as it might have been expected that more moisture loss would occur closer to the surface, especially if evaporation plays a role in the increase in resistivity. One possible explanation for this finding is that inserting the nails to a shallower depth did not disturb the fresh concrete surface as much as inserting them to a greater depth, leading to less moisture loss from the area around the nails.
Embedded Resistance Approach
Resistance data for the two-pin embedded resistance array is shown in Figure 5 for the low evaporative conditions, 0.032 lb/ft2/h (0.156 kg/m2/h), and Figure 6 for the high evaporative conditions, 0.158 lb/ft2/h (0.769 kg/m2/h). Consistent with the previous Wenner probe results, resistance increased with time, rapidly increasing after the initial set. Resistance at the 0.5 in. (12.5 mm) level was similar across all conditions, indicating a sufficient depth to differentiate between the cure-affected zone and the interior of the concrete. Time to the 160 kΩ/cm test maximum was reached in about half the time in the hot and dry conditions compared to the lower evaporative rate conditions, indicating good agreement with the anticipated impact on surface drying.

Resistance for low evaporative condition (23°C, 50% relative humidity) with interior = 0.5 in. (12.5 mm) probe depth.
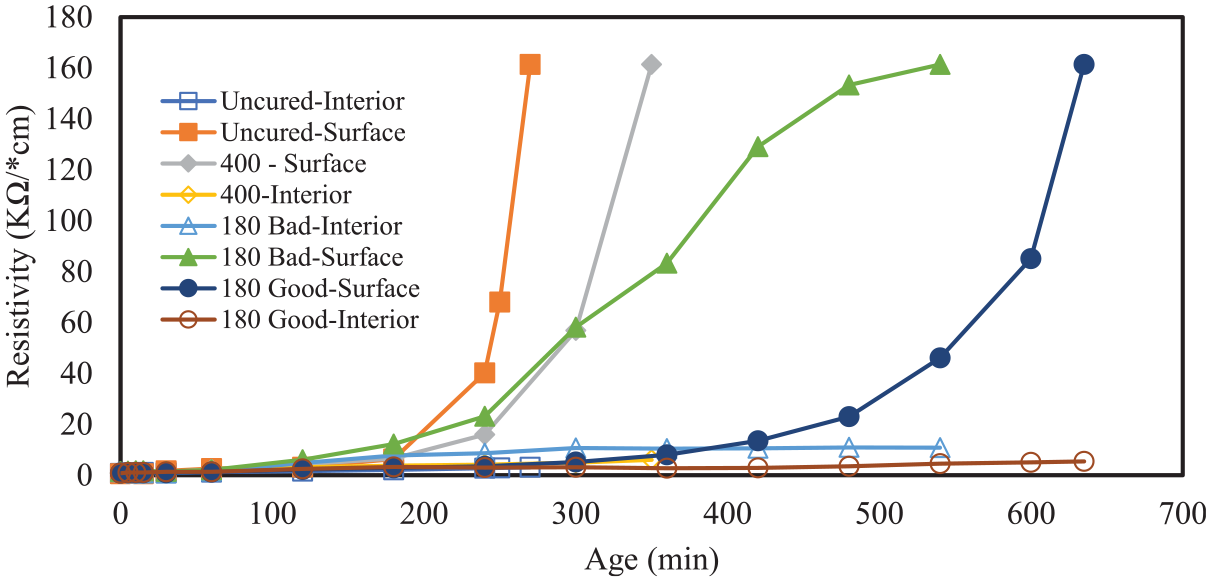
Resistance for high evaporative condition (38°C, 32% relative humidity) with interior = 0.5 in. (12.5 mm) probe depth.
Considering the low evaporation rate results presented in Figure 5, a substantial difference in resistance was observed between the cured and uncured specimens. While visually the specimens with the uniformly applied curing compound either uniformly at the recommendation rate 180 ft2/gal (4.5 m2/L) (180 uniform [U]) or uniformly at half the recommended rate 400 ft2/gal (10 m2/L) (400 U) appeared similar, resistance rose much faster for the 400 U samples. For the lower evaporation rate condition, there was no difference in resistance response between the uniformly applied (180 U) non-uniformly applied (180 non-uniform [NU]) samples at the 180 ft2/gal (4.5 m2/L) rate. For the higher evaporative conditions shown in Figure 6, surface resistance increased much more rapidly for all curing conditions. Like the lower evaporative conditions, samples with half the recommended curing compound (400 U) had a much faster rise in resistance than the appropriately cured specimens (180 U). The importance of uniformly applying the curing compound was more significant for the higher evaporation rate tests, with the non-uniform specimens (180 NU) rising much more quickly than the same rate uniformly applied (180 U).
A comparison between the surface resistance values for uncured and properly cured specimens at both environmental conditions is shown in Figure 7. Uncured samples at the low evaporative conditions had similar performance to samples cured uniformly at 180 ft2/gal (4.5 m2/L) (180 U) under the high evaporative conditions.

Resistance data comparison between the uncured and properly cured specimens from both low and hot evaporative conditions (EC) (high EC refers to the high evaporative condition [38°C, 32% relative humidity] and low EC refers to the low evaporative condition [23°C, 50% relative humidity]).
Conclusions
This paper presented an initial investigation into using resistance to assess the quality of curing compound application on fresh concrete. Two techniques were used, an average measurement through an unshielded probe using a Wenner probe and a comparison of resistance values between a surface and shielded embedded probe. Both techniques were able to distinguish between cured and uncured specimens. Moreover, the embedded resistance probe technique was able to distinguish between the quality and rate of curing compound application, even when specimens were visually indistinguishable. Uniformity of curing compound application was not significant for the lower evaporative conditions but was quite significant for the higher evaporation rate.
These findings suggest that resistance can be a tool for real-time assessment of concrete curing. As resistivity is linked to a variety of other long-term properties, future research may provide additional links to the appropriate timing of curing compound application, sawing timing, and hardened durability properties.
Footnotes
Acknowledgements
Data for portions of this paper were prepared under the on-going research project WHRP 0092-22-03, “Timely and Uniform Application of Curing Materials”, sponsored by Wisconsin Department of Transportation (WisDOT).
Author Contributions
The authors confirm contribution to the paper as follows: study conception and design: J.T. Kevern, D. King, P. Taylor; data collection: E.B. Nkongolo, D. King; analysis and interpretation of results: E.B. Nkongolo, J.T. Kevern, D. King, P. Taylor; draft manuscript preparation: E.B. Nkongolo, D. King, P. Taylor, J.T. Kevern. All authors reviewed the results and approved the final version of the manuscript.
Declaration of Conflicting Interests
The author(s) declared no potential conflicts of interest with respect to the research, authorship, and/or publication of this article.
Funding
The author(s) disclosed receipt of the following financial support for the research, authorship, and/or publication of this article: This works was supported by the Wisconsin Department of Transportation (WisDOT) (WHRP 0092-22-03).

The content of this paper reflects the views of the author, who is responsible for the correct use of brand names, and for the accuracy, analysis, and any inferences drawn from the information or material presented. assumes no liability for its contents or use thereof. This paper does not endorse or approve any commercial product, even though trade names may be cited, does not reflect official views or policies of the Department or, and does not constitute a standard specification or regulation of the Department. Other data was collected at Iowa State University under the direction of the National Concrete Pavement Technology Center.