




Abstract
Weigh-in-motion (WIM) technology is a traffic monitoring technology that highway agencies use to obtain information about the weight, axle loading, and configuration of heavy vehicles moving at operational speed. To ensure high-quality WIM data, the Federal Highway Administration (FHWA) recommends regular calibration of WIM equipment. This study addresses the need to optimize the allocation of the limited resources that agencies have for WIM equipment calibration by developing a procedure for data-driven calibration scheduling. This was accomplished through an analysis of WIM measurement errors from test truck data collected during field performance validation and calibration events and an analysis of monthly changes in truck weight and axle loading characteristics, based on WIM data collected between calibration events. The analysis results were used to draw conclusions on the functional performance of different WIM sites. The study also demonstrates how the newly developed National Cooperative Highway Research Program (NCHRP) WIM Data Quality Assurance Analysis Tool can be used to compute truck weight and axle loading parameters and visualize data analysis results using four case studies: two WIM sites with piezo quartz sensors in asphalt pavements and two WIM sites with bending plate sensors in concrete pavements. This paper provides a practical procedure and recommendations that highway agencies can use to develop data-driven WIM calibration schedules that will ensure consistent high-quality WIM data for sites managed by an agency with the aid of the NCHRP WIM Data Quality Assurance Analysis Tool.
Keywords
Weigh-in-motion (WIM) technology is a traffic monitoring technology capable of collecting vehicle class, weight, speed, axle loading and configuration information as vehicles drive at operational speed ( 1 , 2 ). A WIM system is also capable of determining other parameters related to a vehicle and can be used to store this information in an individual vehicle record (IVR) ( 3 ).
Most state highway agencies collect WIM data for submittal to the Federal Highway Administration (FHWA). Highway agencies also use WIM data for pavement design, research, transportation planning, freight studies, and motor carrier enforcement activities, to name a few examples. Thus, many highway engineering and planning functions rely on accurate WIM data.
Experience has shown that WIM system performance generally deteriorates over time. The extent and speed of the deterioration might vary for each WIM system and WIM site and depends on a combination of factors, such as sensor technology, pavement type, and temperature variation. Several reference sources are available to assist highway agencies in WIM data quality assurance and equipment calibration ( 1 , 3 – 7 ). Recently, the Transportation Research Board’s National Cooperative Highway Research Program (NCHRP) developed a set of practical WIM tools and guidance to help agencies collect WIM data through more appropriate site selection, WIM system selection, installation, calibration, and maintenance. The guidance also includes updated data analysis methods and advanced quality control or quality assurance (QA) procedures ( 8 ).
Research Need
To ensure high-quality WIM data, FHWA recommends annual WIM performance validation (to check measurement errors against tolerances or acceptance criteria) and calibration (to adjust equipment settings to meet acceptance criteria, if necessary, based on validation results) of WIM equipment ( 3 ). In practice, some states do not perform field validations of WIM performance with an adequate number of test truck runs or at the FHWA-recommended calibration frequency, owing to the high expense, a lack of resources, or a lack of trained personnel ( 9 ). Therefore, there is a need for a better understanding of the changes in WIM functional performance over time and for data-driven solutions to optimize the allocation of available WIM calibration resources to ensure high-quality WIM data. Several previous research studies have been conducted to analyze changes in the WIM functional performance characteristics over time ( 7 , 8 , 10 – 14 ). These findings could be instrumental in developing a practical application or procedure to aid highway agencies in effective calibration scheduling.
Study Purpose and Analysis Objective
The purpose of this study was to investigate how WIM data analysis methods, especially those included in the NCHRP WIM Data QA Analysis Tool, can be used to infer changes in WIM functional performance (i.e., changes in measurement accuracy) over time and provide valuable information for scheduling system field validations and calibrations of WIM equipment. In this exploratory analysis, use was made of the WIM data from some of FHWA’s Long-Term Pavement Performance (LTPP) Specific Pavement Study (SPS) test sites.
The findings from this study were used to develop recommendations and practical procedures that the LTPP Program and state agencies can use to develop data-driven schedules for WIM field performance validation and calibration, to optimize the allocation of limited resources while ensuring quality and consistent WIM data.
The purpose of this study was not to provide a comprehensive comparison of WIM site performances or calibration needs based on site conditions or design characteristics, such as sensor type, sensor array, pavement type, or pavement smoothness. Any observations or conclusions about individual WIM site performances for the small sample of sites included in this exploratory study were made for the purpose of evaluating the usefulness of the proposed data analysis methods and procedures for scheduling WIM calibrations. The generic procedures for identifying calibration needs, based on the data analysis methods described in this paper, are not limited by WIM technology or pavement type.
Data Used for Analysis
Data Sources
For almost two decades, the LTPP Program has collected truck weight and axle loading data using WIM systems. The Program also collected data during periodic WIM system functional performance validation and calibration events at these sites, including test truck data to quantify WIM measurement accuracy, precision, and bias. The field validations and calibrations were performed with varying frequency (ranging from a few months to over 2 years) to ensure that seasonal variations in WIM measurement accuracy were addressed.
In this study, the five most recent years of WIM IVRs and test truck data from field WIM validation and calibration events were analyzed, from four LTPP Program sites (two with bending plate sensors in concrete pavements and two with piezo quartz sensors in asphalt pavements) located in different climatic and geographic zones. Table 1 summarizes pertinent information about the sites used in the analysis. This information helped researchers gain details of site characteristics, sensor arrays, and past performance. Figures 1 and 2 show, schematically, the sensor arrays for the sites with piezo quartz and bending plate sensors, respectively.
Weigh-in-Motion Sites Used in the Analysis
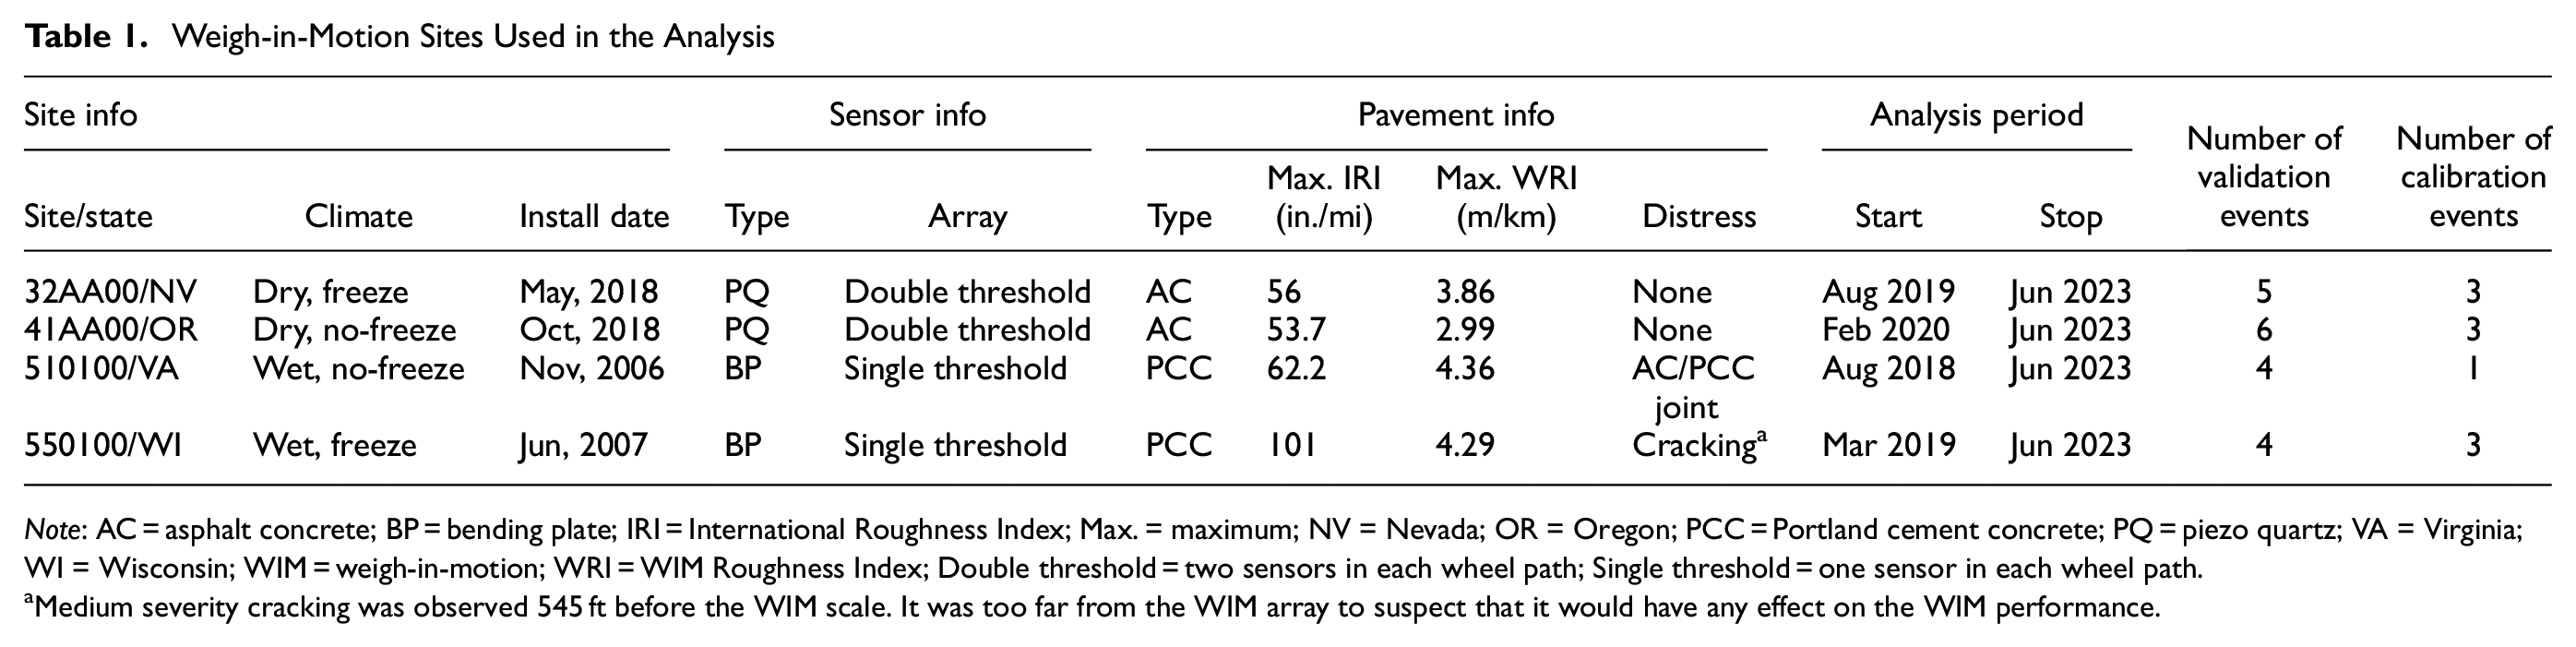
Note: AC = asphalt concrete; BP = bending plate; IRI = International Roughness Index; Max. = maximum; NV = Nevada; OR = Oregon; PCC = Portland cement concrete; PQ = piezo quartz; VA = Virginia; WI = Wisconsin; WIM = weigh-in-motion; WRI = WIM Roughness Index; Double threshold = two sensors in each wheel path; Single threshold = one sensor in each wheel path.
Medium severity cracking was observed 545 ft before the WIM scale. It was too far from the WIM array to suspect that it would have any effect on the WIM performance.
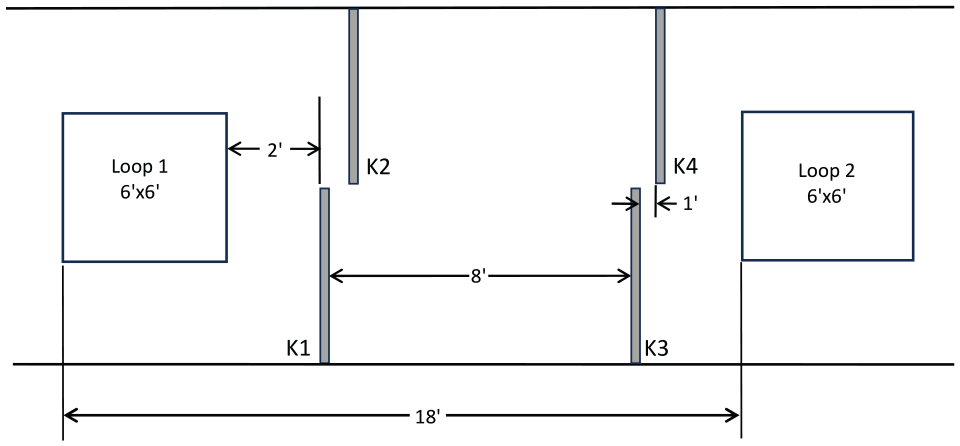
Sensor array for site with piezo quartz sensors.
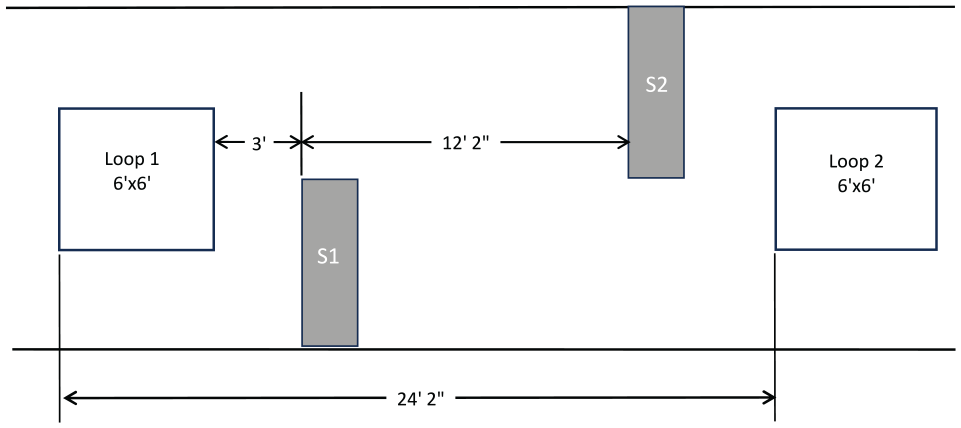
Sensor array for site with bending plate sensors.
Computed Parameters Used in Analysis
Monthly Summary Statistics Based on WIM IVRs
The WIM data for the analysis were obtained from the LTPP in 2016 FHWA Traffic Monitoring Guide (TMG) W format and processed by the NCHRP WIM Data QA Analysis Tool (referred to here as the NCHRP Tool) to compute monthly truck weight and axle loading analysis parameters for each site and each month included in the analysis period. Validated data sets (VDSs) were created for each site after each successful calibration event using data collected for the month immediately after calibration.
Monthly summary statistics were selected in lieu of day-of-week or weekly summary statistics to mitigate the high variability of computed average values (owing to small sample sizes as well as transient day-to-day or week-to-week changes in local economic activities, as compared with monthly samples) that were resulting in false triggers for calibration and preventing conclusive observations of calibration needs, and to provide a means for comparing results between sites with different daily volumes of FHWA Class 9 trucks.
Figure 3 provides an example of the monthly summary statistics table generated by the NCHRP Tool. The parameters in the “Current” column were computed for each month with WIM data. The parameters in the “Validated” column were computed using the VDS from the most recent calibration event. “Start Date” and “End Date” provide references to the monthly period included in the comparison analysis. The dates in the “Validated” column correspond to the 1-month period immediately after the last successful calibration or validation event (starts on the day after the event). The dates in the “Current” column correspond to the calendar month being analyzed. Figure 3 also shows the differences between the “Current” and “Validated” parameters in the “%Diff” column and graphical icons in the “Flags” column that indicate whether these differences were significant.

Example of summary statistics tables from National Cooperative Highway Research Program (NCHRP) Tool.
Test Data from WIM Field Validation and Calibration Events
The field test data from WIM functional performance validation and calibration events included results of test truck runs (40 runs per sample). Test truck data were used to compute WIM measurement errors associated with the test trucks, including gross vehicle weight (GVW) and axle loading errors for each individual test truck pass (expressed in percentiles). These errors were used to compute the mean error X (measurement bias), standard deviation of error σ, margin of error t × σ (measurement precision, where t is a t-statistic value from the statistical table used in confidence interval (CI) determination for small samples), 95% CI of error (X ± t × σ), and total error (defined in this paper as the absolute value of the mean error plus the margin of error for the 95% confidence, |X| + t × σ). These values were used to characterize WIM measurement accuracy with respect to test trucks (i.e., statistical population consisting of test truck runs).
Each field test included at least one WIM performance validation event (if no calibration was required) and up to two calibration events to bring WIM performance characteristics within LTPP specification tolerances, followed by another performance validation testing event. Table 2 summarizes the functional performance requirements for LTPP WIM systems. This study was focused on weight parameters only.
Long-Term Pavement Performance Weigh-in-Motion Functional Performance Requirements
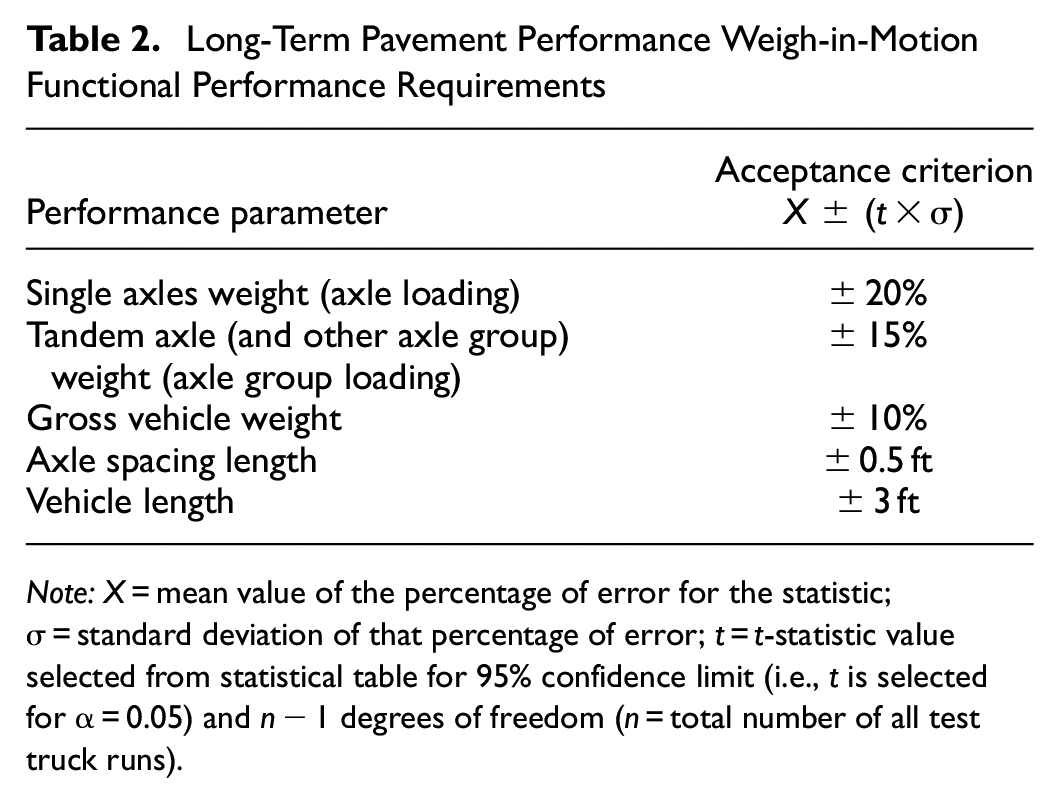
Note: X = mean value of the percentage of error for the statistic; σ = standard deviation of that percentage of error; t = t-statistic value selected from statistical table for 95% confidence limit (i.e., t is selected for α = 0.05) and n − 1 degrees of freedom (n = total number of all test truck runs).
Methods
The data analysis methods and procedures that were used to conduct the research are described next.
Analysis of Changes in WIM Functional Performance Characteristics Using Field Data Collected at WIM Sites before and after Calibrations
The purpose of this analysis is to compare WIM performance parameters characterizing measurement precision and bias before and after each calibration event. The following analysis procedure was used.
1) Obtain the WIM data from test truck passes for each WIM and calibration event (40 test truck runs [includes two test trucks, 20 runs each at various speeds] before calibration and 40 runs after calibration adjustments are made to the system [two test trucks, 20 runs each at various speeds]). Pre- and post-calibration WIM performance validation data were collected during field site calibrations using the LTPP WIM performance validation protocol ( 4 ).
2) Compute the mean GVW and axle load measurement errors, standard deviation of errors, margin of error, and 95% CI of error to characterize errors associated with the test truck population.
3) Compare WIM measurement accuracy, characterized by precision (margin of error for the 95% CI) and bias (mean error) before and after calibration for single axle, tandem axle, and GVW weight parameters listed in Table 2, based on test truck data for each validation event (before and after calibration). These values will characterize WIM measurement accuracy with respect to the test trucks.
4) Draw conclusions about changes in WIM functional performance characteristics over time based on test truck data.
Analysis of Changes in Truck Weight and Axle Loading Summary Statistics over Time Based on WIM Data for FHWA Class 9 Vehicles and Comparison with WIM Functional Performance Characteristics
1) Use WIM IVRs and the NCHRP Tool to compute truck weight and axle load (referred to as axle weight in this paper) parameters for Class 9 (3S2) trucks for each month included in the data analysis period for each analysis site.
2) Analyze changes in truck weight and axle loads over time for each WIM site that is included in the analysis. Compare and quantify changes in average weights over time. Relate the percentage changes (i.e., changes expressed in percentile form) in monthly average weights and loads with computed pre- and post-calibration weight measurement bias values from the test truck data.
3) Draw conclusions for the following research questions. Can the changes in the monthly average GVW and axle loading be effectively used as a proxy for WIM performance monitoring and scheduling of field WIM system functional performance validations and calibrations? Can the trends describing changes over time in monthly average weights and axle loading (GVW, single axle, tandem axle, etc.) be effectively used to identify calibration needs? Does calibration timing affect WIM system performance (size of WIM measurement error) between calibrations?
Develop Practical Procedure to Help Highway Agencies Develop WIM Calibration Schedules Using the NCHRP Tool
If warranted by the analysis results, develop a practical procedure describing how to:
Develop a data-driven WIM equipment calibration schedule for individual WIM sites, using the NCHRP Tool, that optimizes the allocation of limited resources.
Monitor changes in truck weight and axle loading statistics using the NCHRP Tool to infer changes in WIM functional performance characteristics over time and identify WIM sites requiring out-of-cycle calibration.
Results
Analysis 1: Observation of Changes in WIM Functional Performance Characteristics over Time
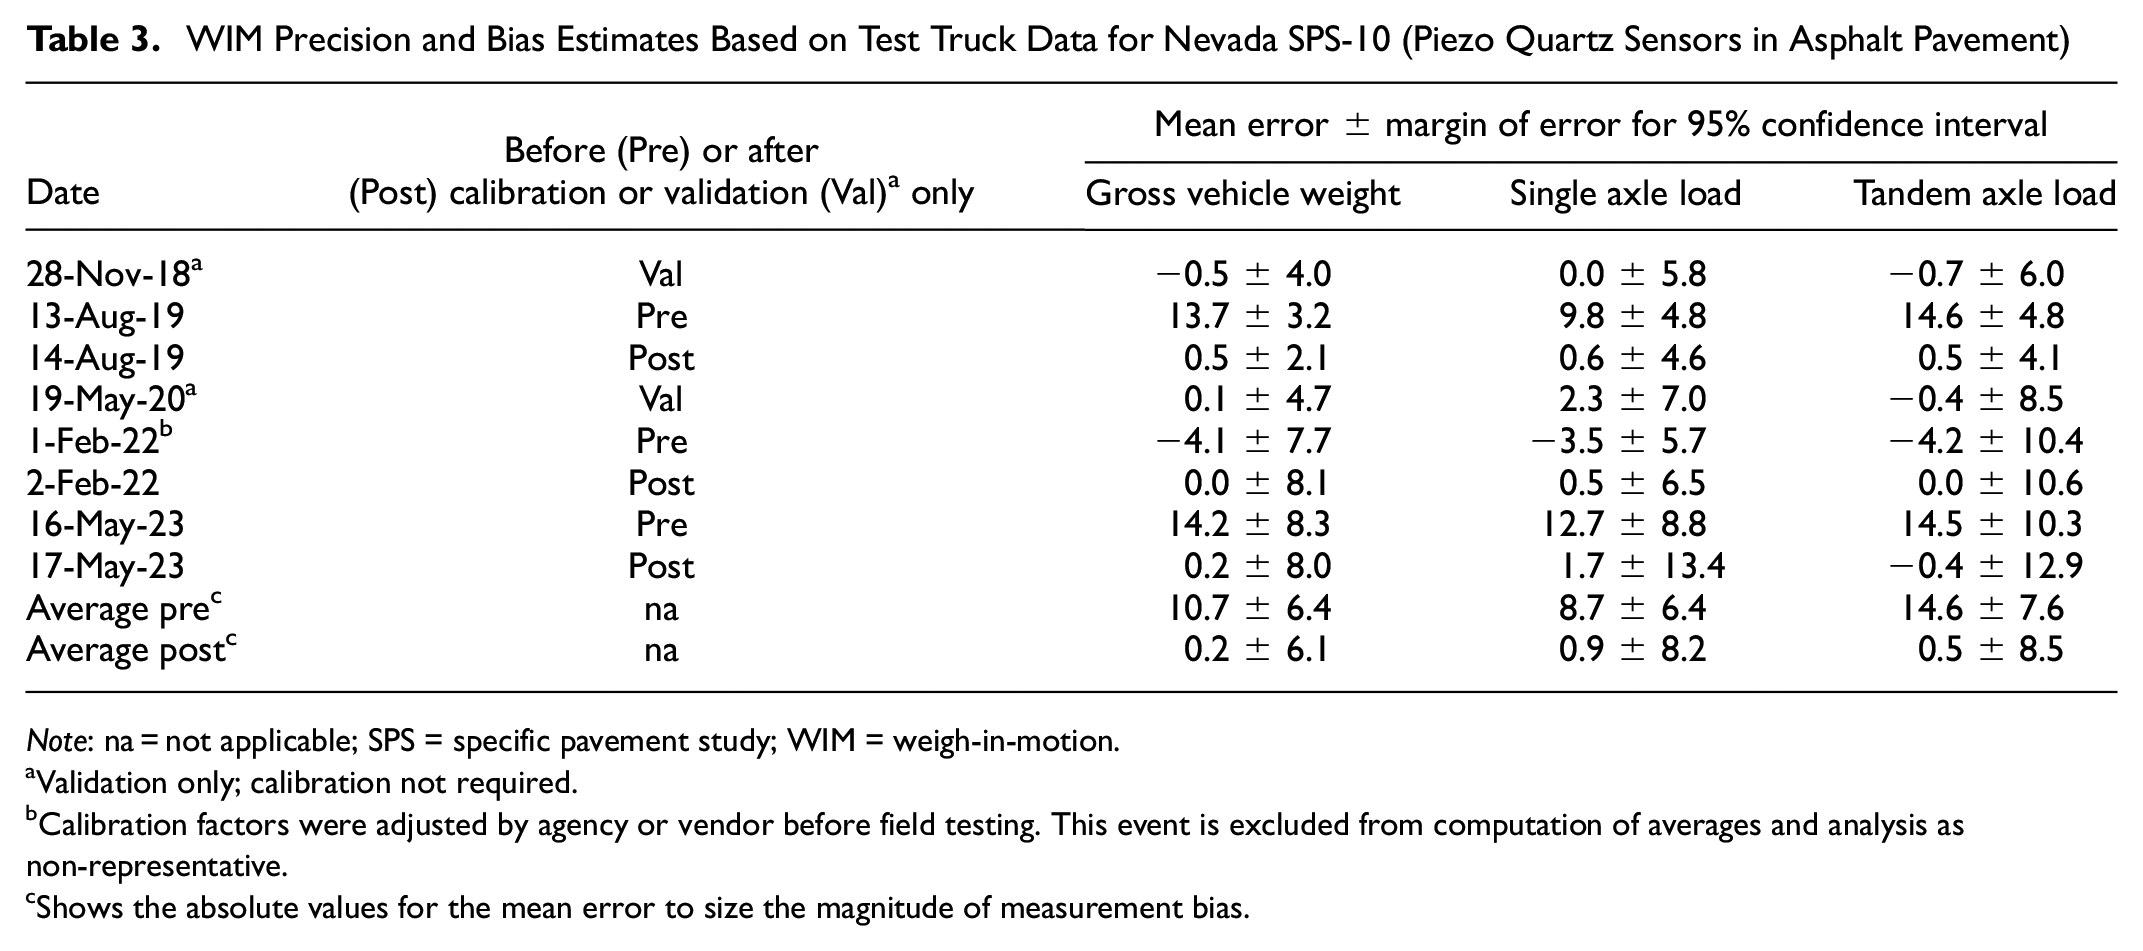
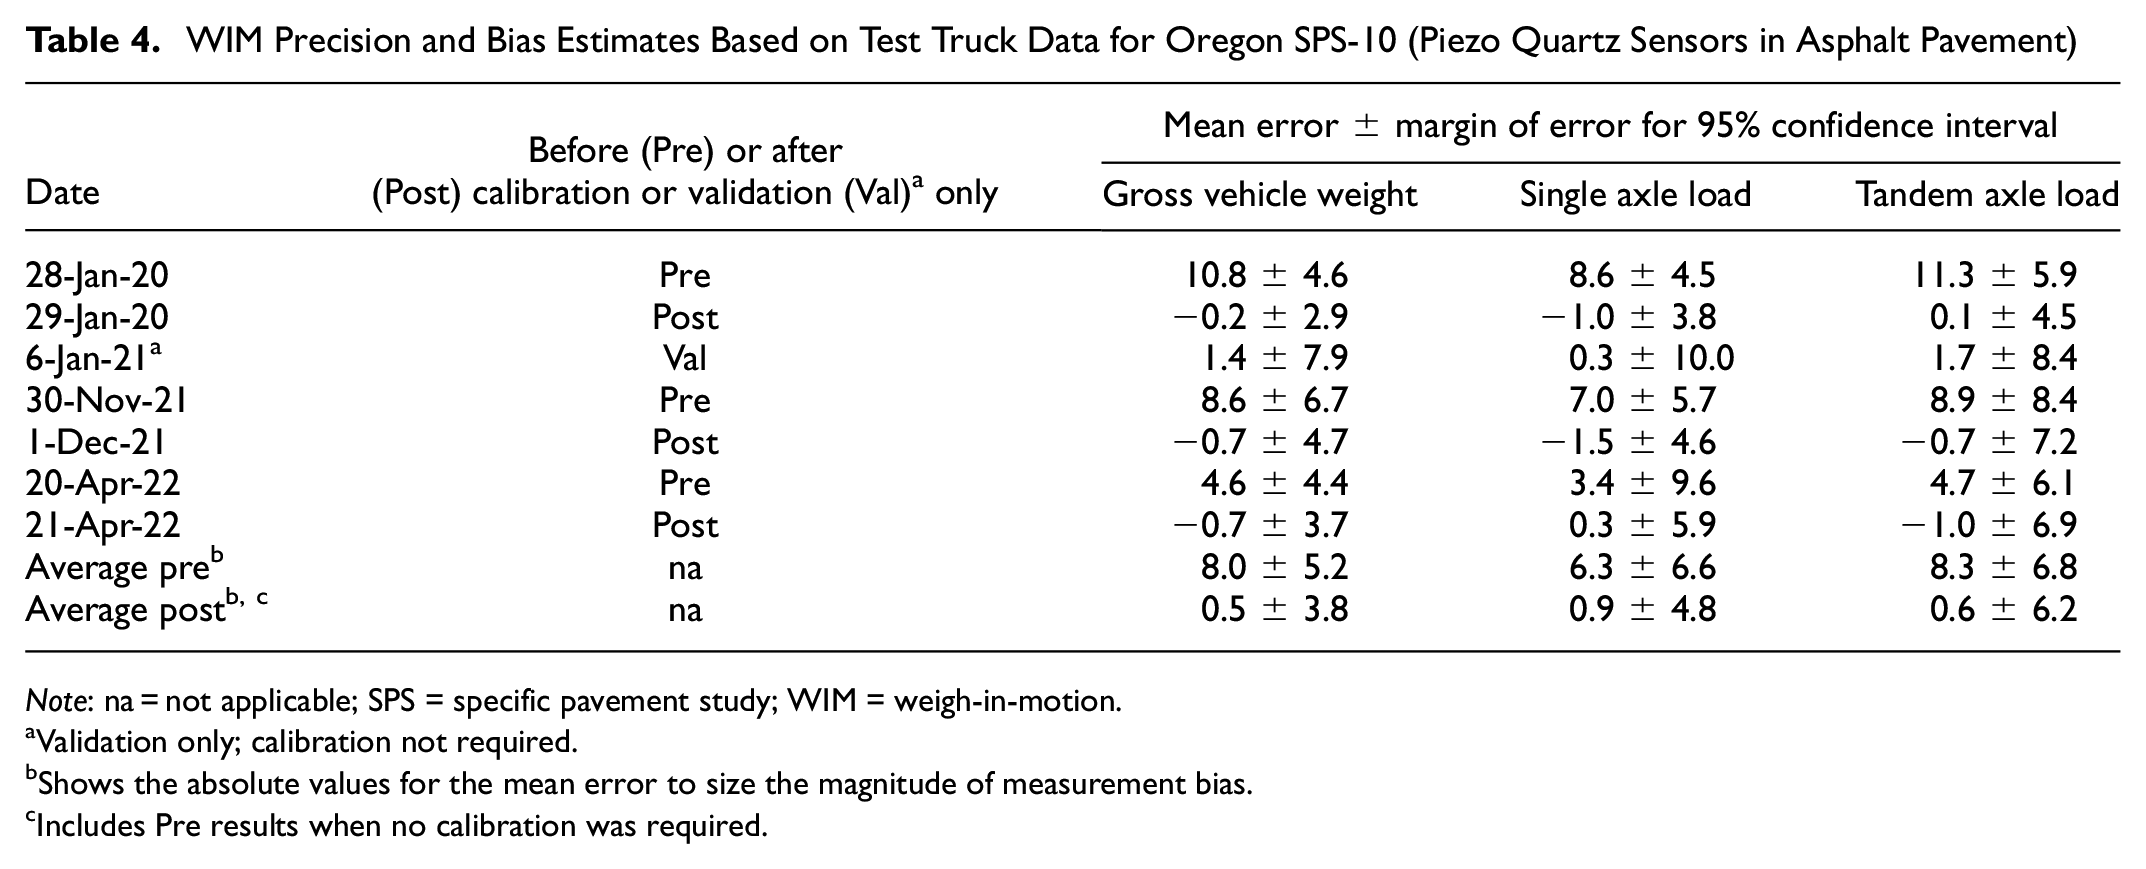
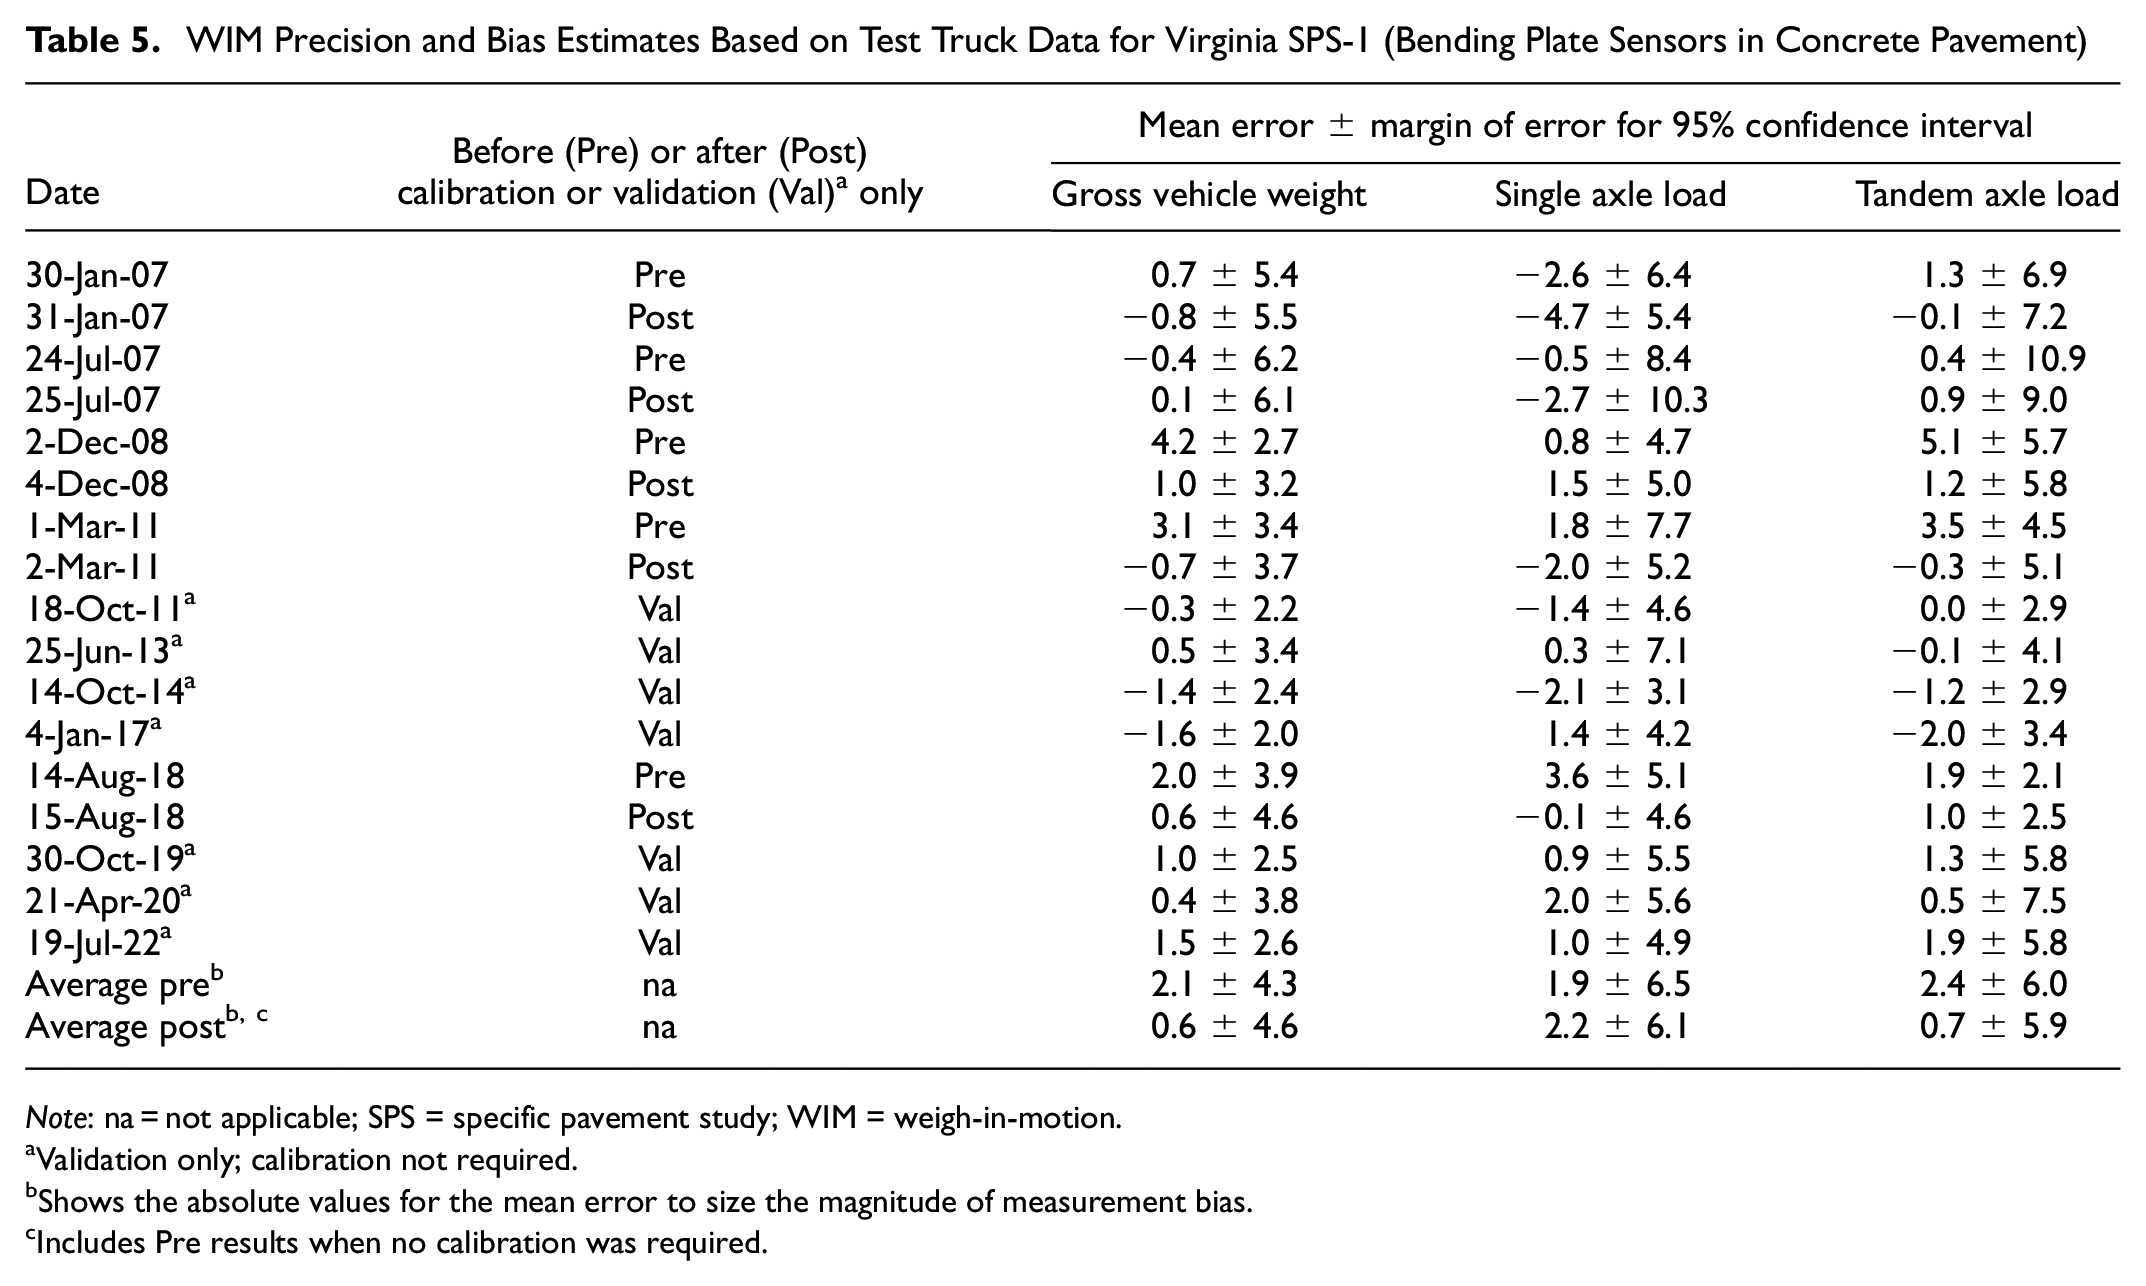
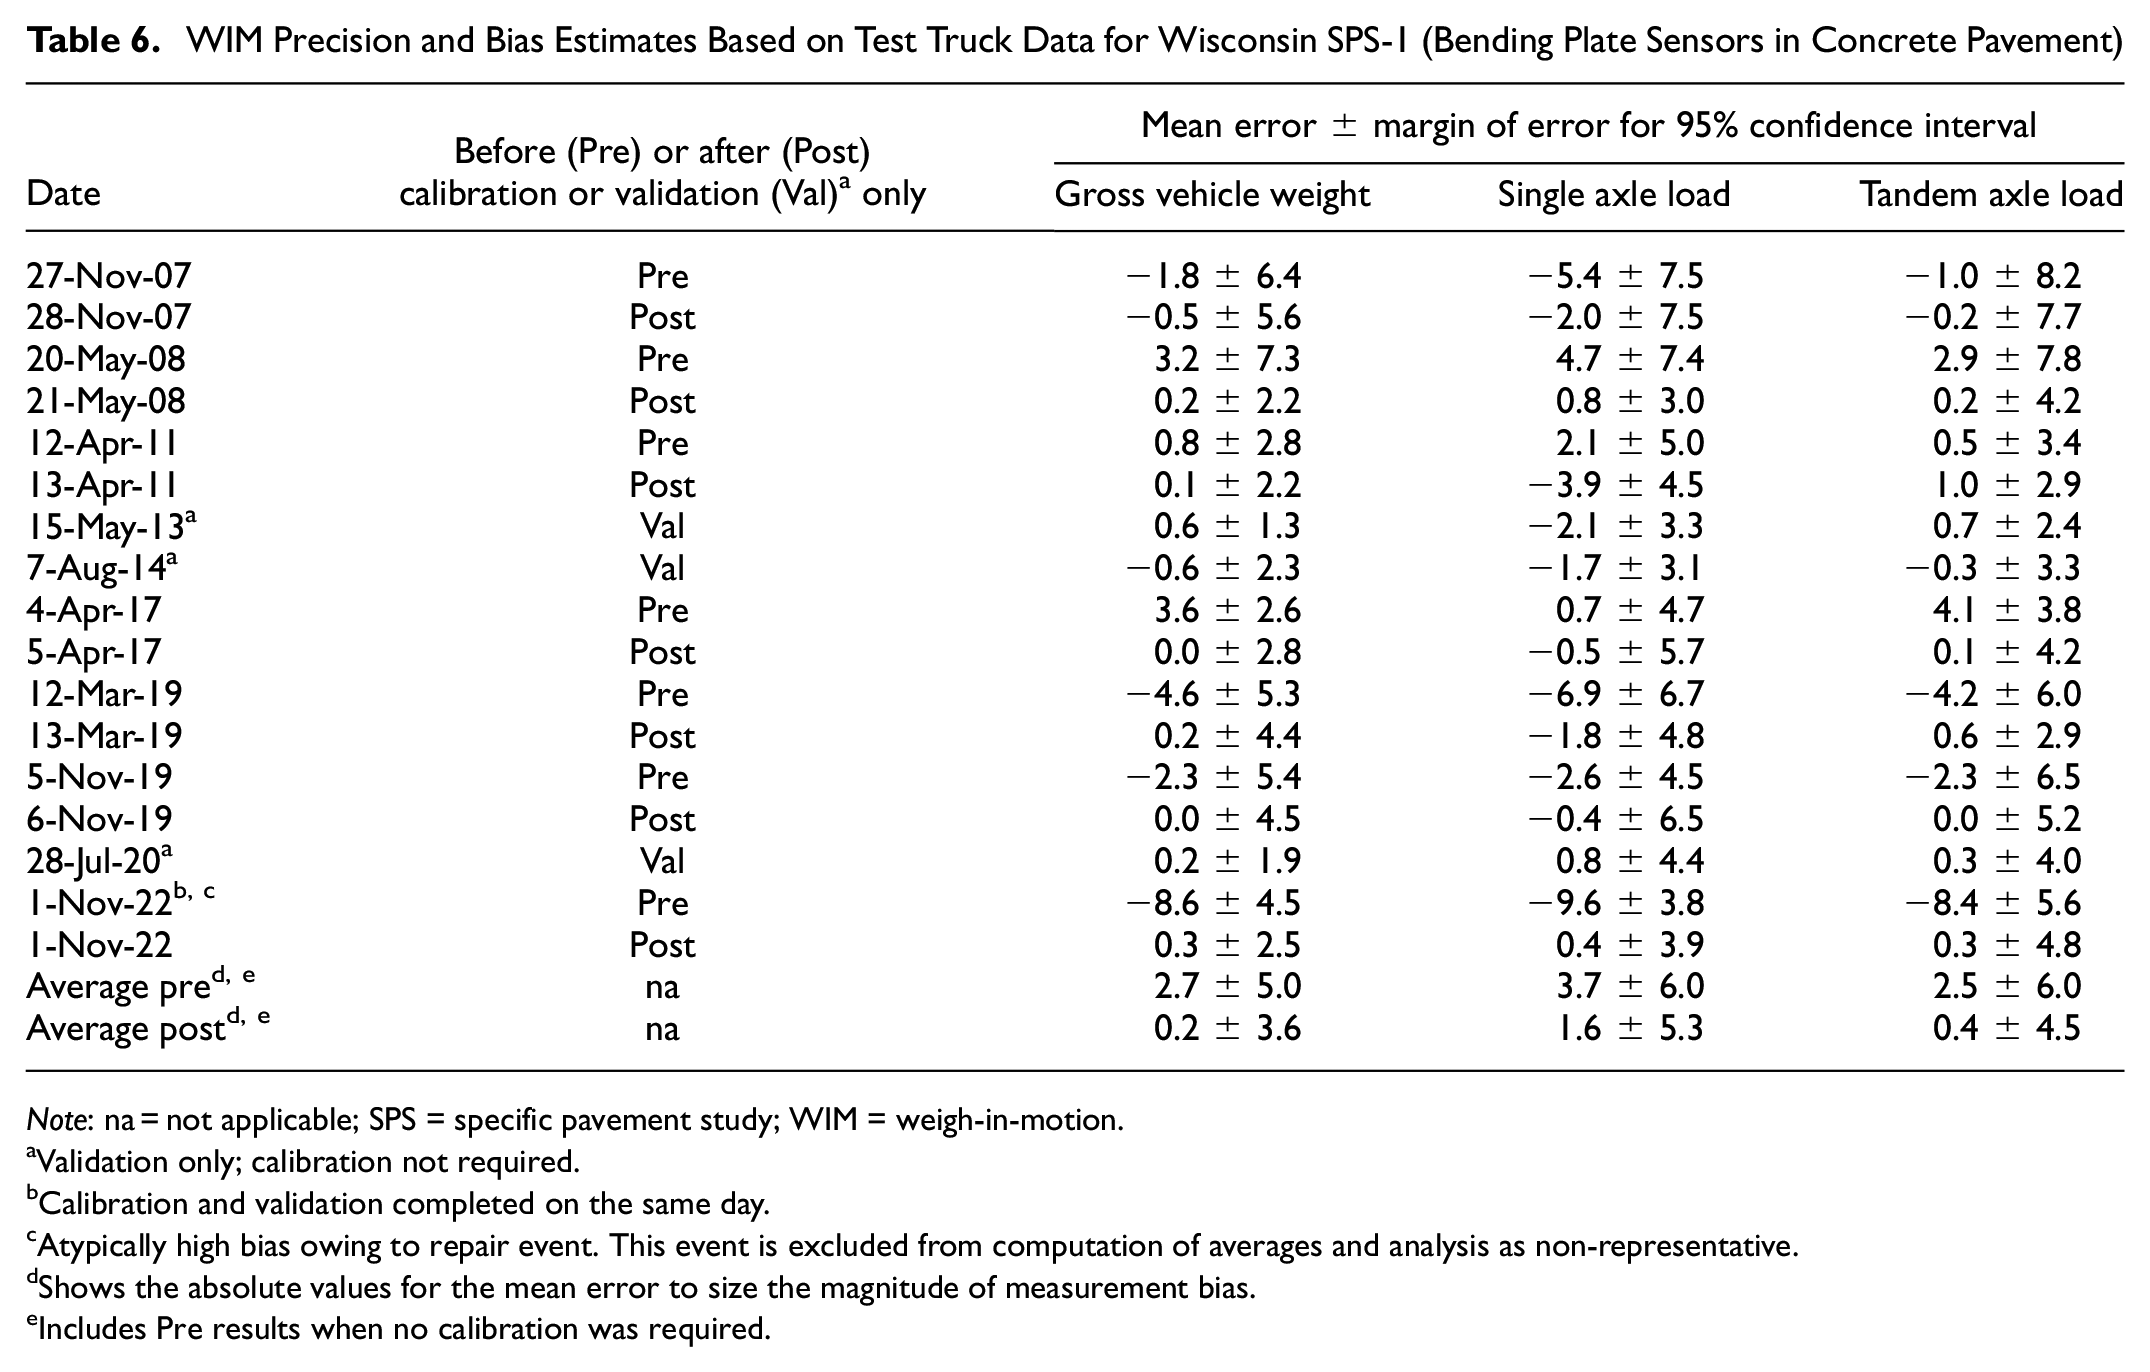
The field data collected at the WIM sites before and after calibration provide important snapshots of WIM functional performance over time. For the four sites included in the analysis, the LTPP Program conducts scheduled field WIM performance validation using test trucks to determine equipment calibration needs. The WIM data from calibration test truck runs and the reference static weight data obtained from the certified static scales are used to compute the estimates of WIM measurement precision and bias. The bias estimates are represented by the mean measurement error and the precision estimates are represented by the margin of error for the 95% CI in Tables 3 to 6. All errors are expressed as percentages. For each field event, an initial WIM functional performance validation is conducted before calibration (Pre). For those events when calibration is deemed necessary, a WIM functional performance validation is repeated after calibration (Post). The values computed after calibration (Post) provide a snapshot of the best achievable performance characteristics for the site, while the values computed before calibration (Pre or Val only) provide a snapshot of the long-term WIM performance characteristics.
WIM Precision and Bias Estimates Based on Test Truck Data for Nevada SPS-10 (Piezo Quartz Sensors in Asphalt Pavement)
Note: na = not applicable; SPS = specific pavement study; WIM = weigh-in-motion.
Validation only; calibration not required.
Calibration factors were adjusted by agency or vendor before field testing. This event is excluded from computation of averages and analysis as non-representative.
Shows the absolute values for the mean error to size the magnitude of measurement bias.
WIM Precision and Bias Estimates Based on Test Truck Data for Oregon SPS-10 (Piezo Quartz Sensors in Asphalt Pavement)
Note: na = not applicable; SPS = specific pavement study; WIM = weigh-in-motion.
Validation only; calibration not required.
Shows the absolute values for the mean error to size the magnitude of measurement bias.
Includes Pre results when no calibration was required.
WIM Precision and Bias Estimates Based on Test Truck Data for Virginia SPS-1 (Bending Plate Sensors in Concrete Pavement)
Note: na = not applicable; SPS = specific pavement study; WIM = weigh-in-motion.
Validation only; calibration not required.
Shows the absolute values for the mean error to size the magnitude of measurement bias.
Includes Pre results when no calibration was required.
WIM Precision and Bias Estimates Based on Test Truck Data for Wisconsin SPS-1 (Bending Plate Sensors in Concrete Pavement)
Note: na = not applicable; SPS = specific pavement study; WIM = weigh-in-motion.
Validation only; calibration not required.
Calibration and validation completed on the same day.
Atypically high bias owing to repair event. This event is excluded from computation of averages and analysis as non-representative.
Shows the absolute values for the mean error to size the magnitude of measurement bias.
Includes Pre results when no calibration was required.
The results presented in Tables 3 to 6 led to the following observations.
Measurement bias. Of the four analysis sites, the sites with piezo quartz sensors in asphalt pavement show higher frequency of drifting out of calibration and developing higher measurement bias over time, compared with sites with bending plate sensors in concrete pavement. For the sites with bending plate sensors, the average GVW bias before calibration was 2.4 and for the sites with piezo quartz sensors, the average GVW bias before calibration was 9.3.
Measurement variability. Of the four analysis sites, the sites with piezo quartz sensors in asphalt pavement and the sites with bending plate sensors in concrete pavement showed similar measurement precision (measurement variability) over time, well within the LTPP WIM functional performance requirements listed in Table 2.
Performance after routine calibration. Since installation, each WIM site was able to meet all LTPP WIM functional performance parameter requirements (see Table 2) after each calibration event.
Performance between calibrations. Between routine calibrations, only one site (VA SPS-1 site, with bending plate sensors in concrete pavement) was able to consistently meet LTPP WIM functional performance parameter requirements for overall error (mean error ± the margin of error for the 95% confidence) for GVW, single axle, and axle group, closely followed by the WI SPS-1 site. Neither of the two piezo quartz sensor sites was able to consistently maintain a mean GVW error under the 2% LTPP target value between routine calibrations over its service life.
Calibration frequency. For the sites included in the analysis, calibration frequency was largely driven by a predetermined schedule, with the goal of covering different calendar seasons and keeping the calibration frequency close to an annual schedule for sites with piezo quartz sensors in asphalt pavement and 18 months for sites with bending plate sensors in concrete pavement.
Calibration importance. These observations demonstrate the need for regular WIM performance validations and routine calibrations. The history of the site-specific WIM performance validation and calibration events can help to determine the best time to calibrate a site and how often.
Calibration benefits. For all four analysis sites, calibration was effective in minimizing measurement bias (mean error). The average GVW bias for all sites before calibration was 5.9 and the average GVW bias after calibration was 0.4. Since calibration involved using a WIM system that allows minimization of the mean error at several speed points, the overall spread of error, that is, the measurement variability (expressed by margin of error) was also reduced as a result of bringing weight measurements at the high and low ends of the operational speed spectrum (where the highest bias is typically observed) closer to the reference values. The calibration protocol followed the LTPP requirement to minimize measurement error for each speed range (low, medium, and high).
Similarities. All WIM sites included in the analysis met the performance parameter requirements of the American Society for Testing and Materials (ASTM) specification for Type I systems following calibration.
Differences. Among the four analysis sites, the sites with piezo quartz sensors in asphalt pavement required more closely spaced calibration events. Thus, annual performance validation and calibration are important for these sites. This finding further supports FHWA TMG recommendation for annual calibration of WIM equipment. The sites with bending plate sensors in concrete pavement included in the analysis went without calibration for longer time intervals. For the Virginia site, the longest interval without needing calibration adjustment was 7 years and for the Wisconsin site the longest interval without needing calibration adjustment was 6 years.
Best and worst performing sites. Of the four analysis sites, the single-threshold, staggered, bending plate VA SPS-1 site showed the best and most consistent performance. This site continues to provide research-quality WIM data after 15 years. The NV SPS-10 site with the double-threshold staggered piezo quartz sensor array showed the worst performance, with average GVW bias between calibrations of 10.7. This site has been in service for 4.5 years. However, the performance of NV SPS-10 site significantly improves after each calibration event; with frequent calibrations, the site can provide research-quality data.
Functional requirements. Values presented in Tables 3 to 6 show that both the measurement bias (characterized by the mean error) and measurement variability or precision (characterized by the margin of error) contribute significantly to the overall WIM measurement errors (characterized by the full 95% CI = mean error ± margin of error for the 95% CI).
These observations are limited to the four WIM sites (two sites with piezo quartz sensors in asphalt pavement and two sites with bending plate sensors in concrete pavement) discussed in this paper and do not represent a comprehensive comparison of functional performance and calibration needs of different WIM sites based on site characteristics and site design elements. Rather, observations and conclusions about individual site performances and calibration needs were used in the study to evaluate the usefulness of the proposed data analysis methods and procedures.
Analysis 2: Observation of Changes in Monthly Average GVW and Axle Loading over Time and Correlation with Changes in WIM Functional Performance
The WIM IVR data collected at the analysis sites between 2019 and 2023 were extracted and used to compute the monthly average GVW, front (single) axle loads, and tandem axle loads for Class 9 trucks in the 3S2 configuration using the NCHRP Tool. In addition, monthly average tandem axle loads for loaded and unloaded (or partially loaded) FHWA Class 9 trucks in the 3S2 configuration (corresponding to GVW > 62,000 lb and GVW < 62,000 lb, respectively) were analyzed. The changes in monthly percentages of overloaded Class 9 trucks were also included in the analysis. The changes over time in monthly average GVW and axle loads between WIM calibrations were observed and compared with the WIM measurement bias values computed before and after each calibration event using the NCHRP Tool.
The percentage changes in the monthly average truck weight and axle load parameters over time were computed and analyzed for the following parameters:
average GVW;
average front axle load (F/A);
average tandem axle load (tandem);
average tandem axle load for loaded trucks (loaded tandem);
average tandem axle load for unloaded trucks (unloaded tandem);
average percentage of overloaded trucks (overweights).
Trend plots were constructed to visualize percentage changes over time in the computed parameters, as shown in Figures 4 to 7 for the four analysis sites. Horizontal red dashed lines were added to the plots to identify changes exceeding ±5%. The 5% thresholds were selected based on practical experience and roughly correspond to 5% measurement bias, which is used as a calibration decision trigger ( 7 , 8 ). Vertical lines were added to the plots, using a solid blue line to identify each calibration event and a dotted blue line to identify each validation-only event (no calibration required). For the Nevada SPS-10 site, adjustments were made to the compensation factors by the agency before the May 20, 2020, validation visit; consequently, no calibration was required. For the Virginia site, the sudden change in the performance values after June 2022 can be attributed to a deterioration of an asphalt to Portland cement concrete (PCC) pavement transition located 330 ft before the WIM array that most probably caused vertical truck dynamics. The analysis of the percentage changes in the average truck weight and axle load parameters led to the observations summarized in the following sections.
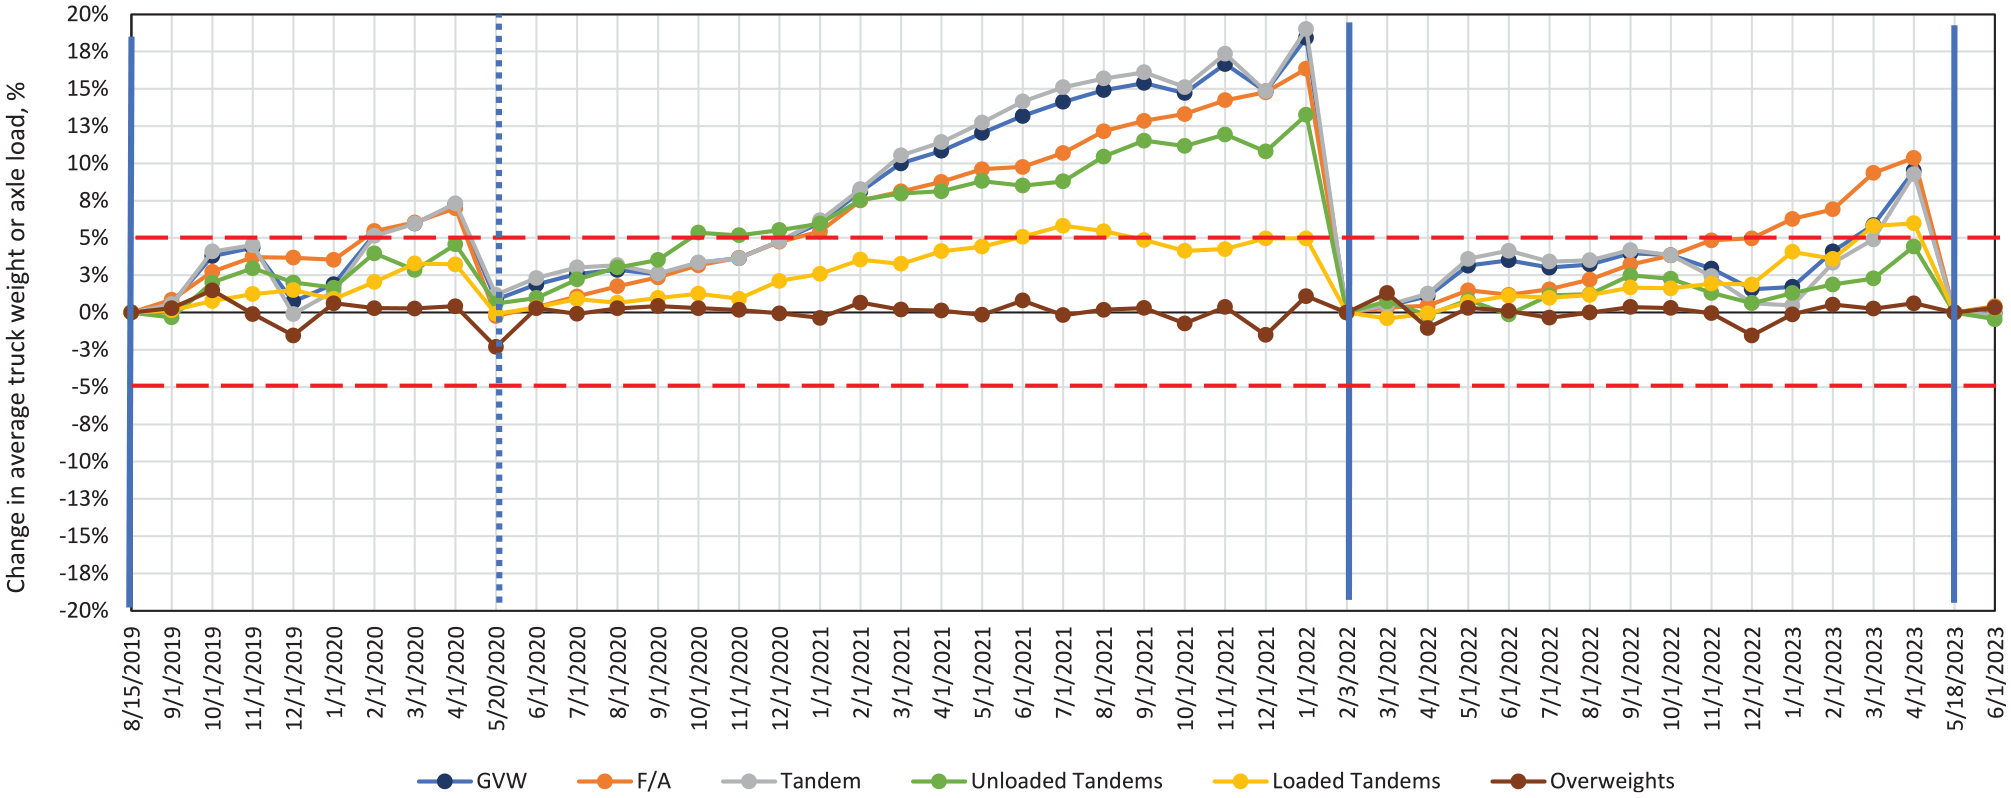
Changes in monthly average truck weight and axle loading parameters for NV SPS-10 WIM site.
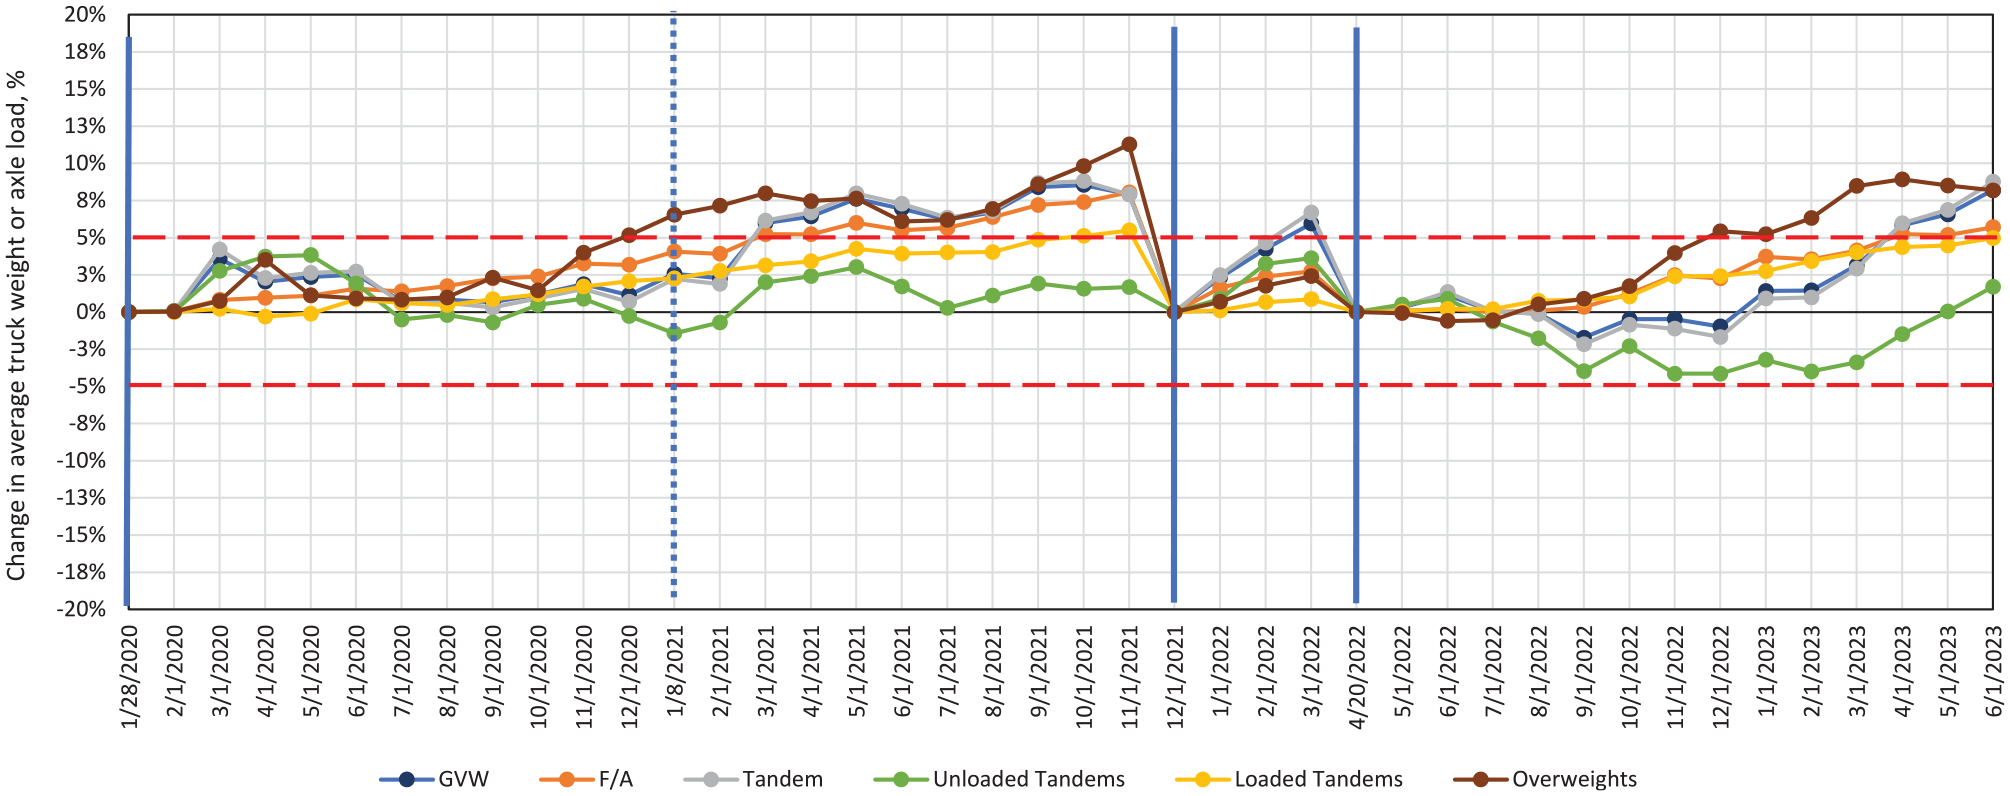
Changes in monthly average truck weight and axle loading parameters for OR SPS-10 WIM site.
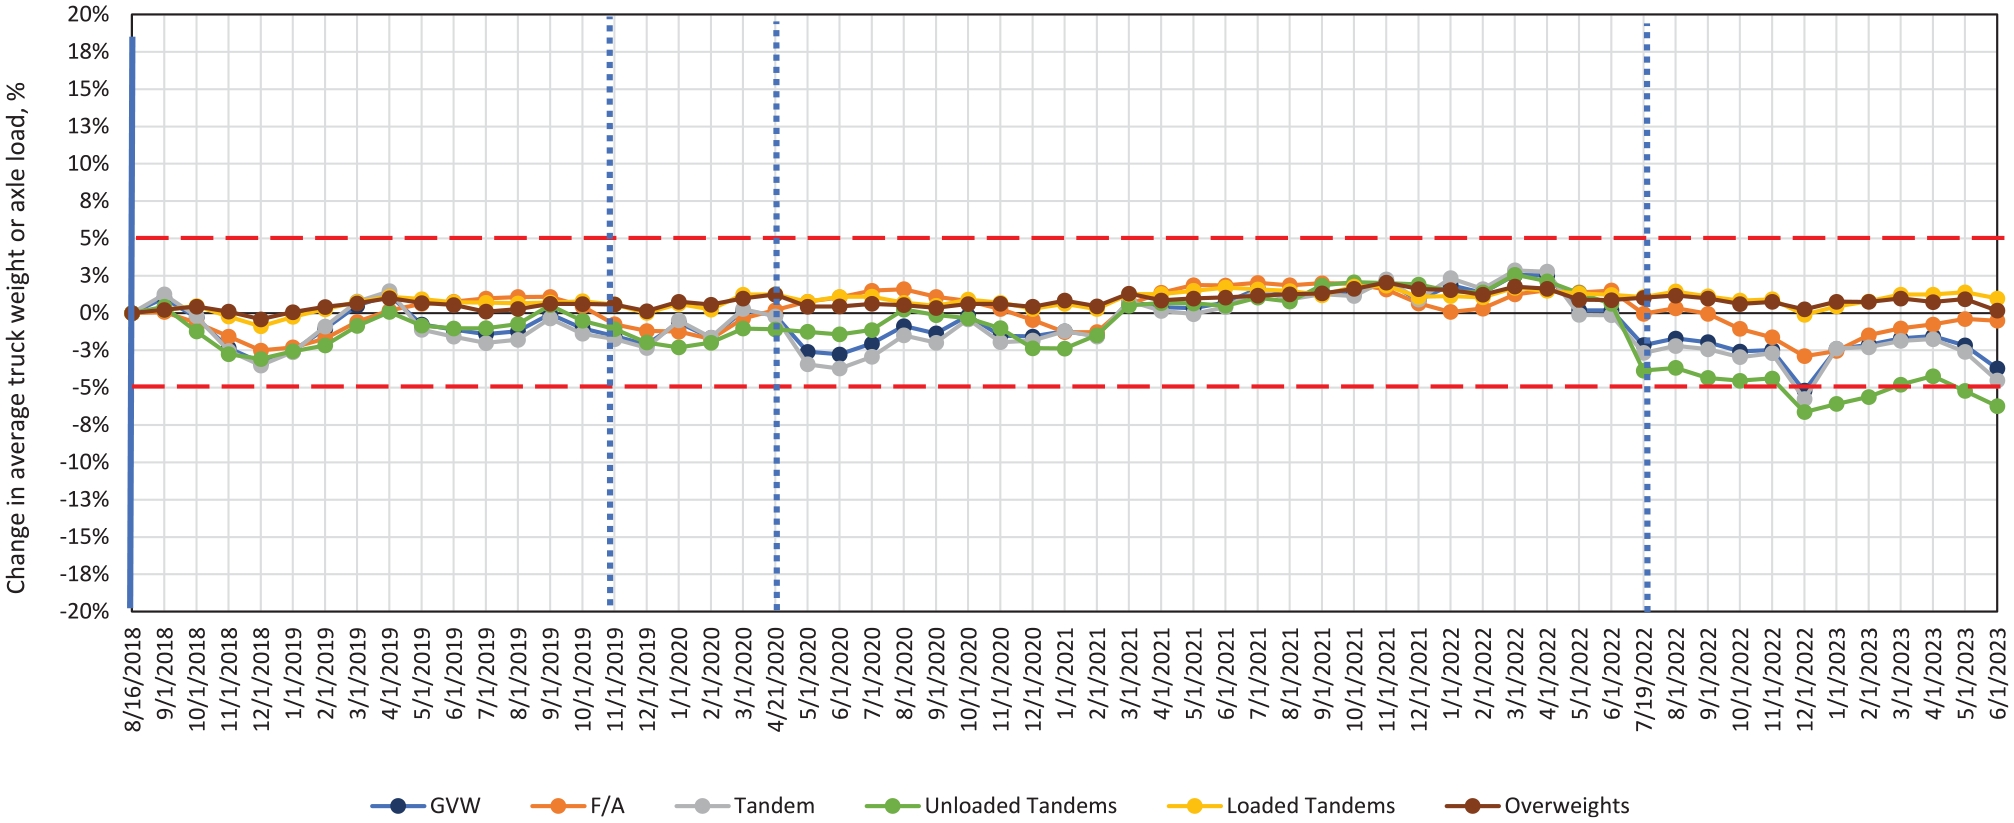
Changes in monthly average truck weight and axle loading parameters for VA SPS-1 WIM site.
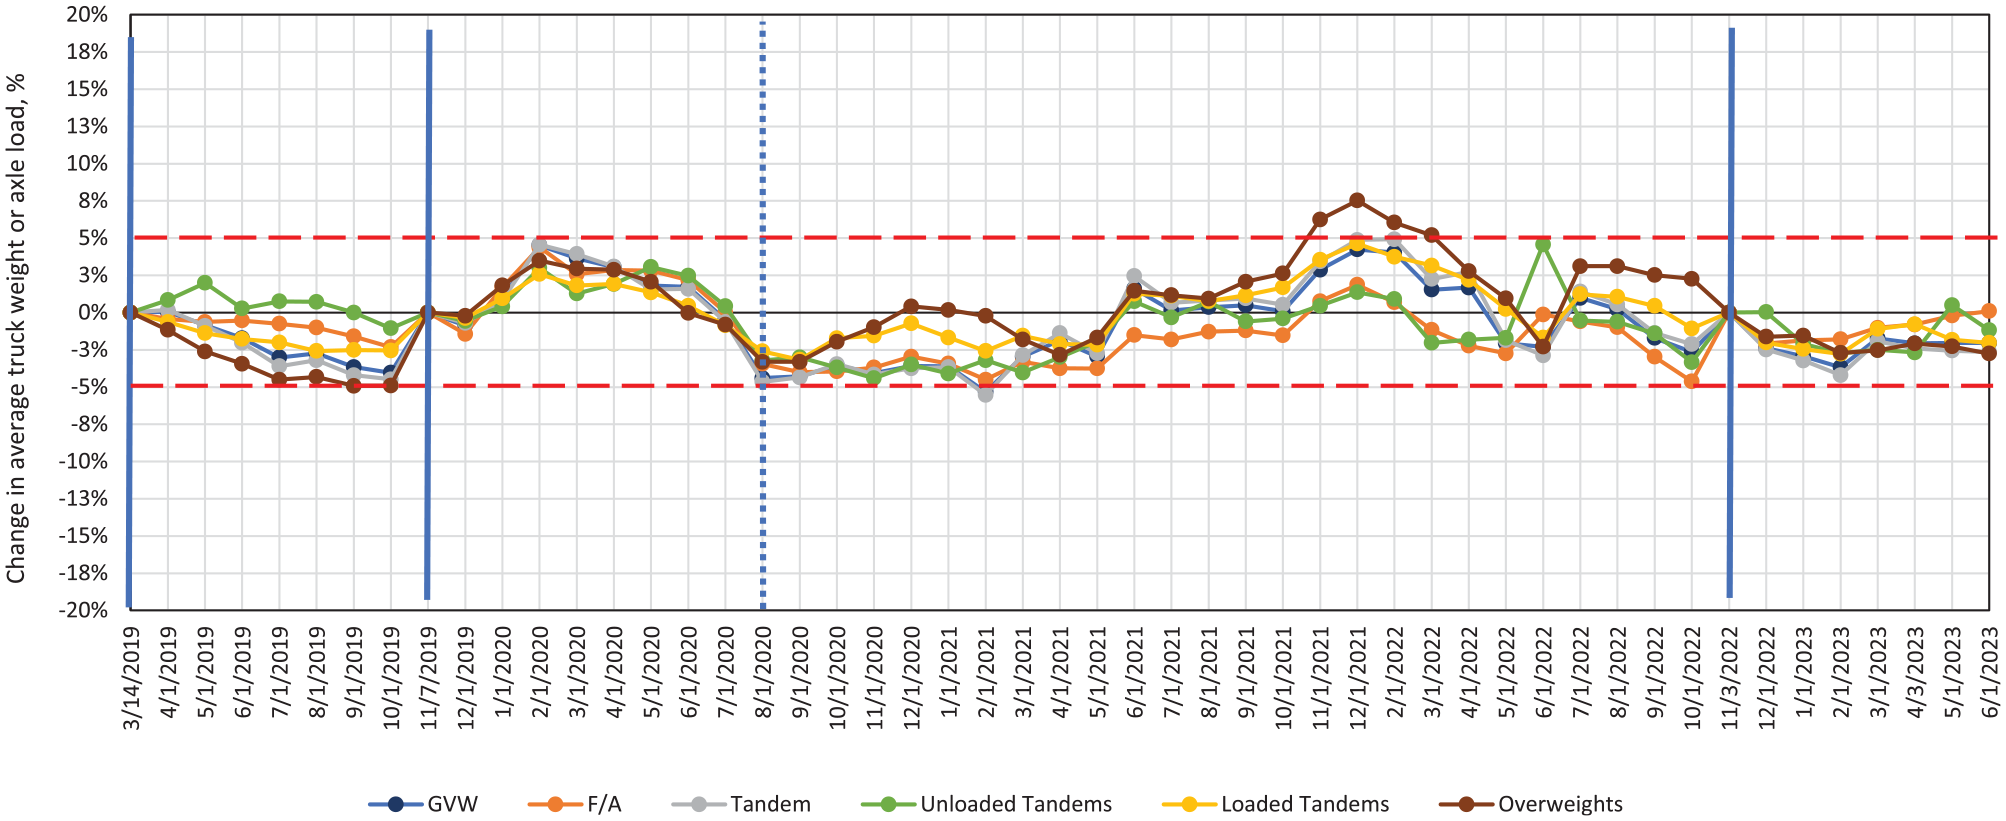
Changes in monthly average truck weight and axle loading parameters for WI SPS-1 WIM site.
For each field WIM performance validation event, the results reported in the WIM calibration needs analysis section (page 2 of the WIM Data Comparison Analysis Report produced by the NCHRP Tool) were compared with the field findings on WIM calibration needs. An example of a WIM calibration needs analysis section from the WIM Data Comparison Analysis Report is shown in Figure 8.

Example of calibration needs analysis section from the WIM Data Comparison Analysis Report for NV SPS-10 WIM site.
The data analysis findings for each site are summarized next.
Observations for NV SPS-10 WIM Site with Double-Threshold Piezo Quartz Sensor Array Installed in Asphalt Pavement
This site drifts toward overestimation of truck weight and axle loads (positive bias) over time. The computed average monthly truck weight and axle loading parameters exceeded the ±5% range for the validated data set parameters before the three calibration events, indicating calibration need.
Based on the analysis of the changes in average truck weight and axle loading, it took the site 6, 9, and 11 months after calibration to reach the ±5% threshold. The number of months to reach the threshold has increased over time.
The NCHRP Tool indicated calibration need before each field validation visit that required calibration. Field testing has confirmed that, before each calibration, all functional performance parameters exhibited measurement bias exceeding 5%.
Both the field test truck data and the data analysis result indicate that this piezo quartz WIM site requires annual calibration.
Regular monitoring of changes in monthly truck weight and axle loading parameters is highly beneficial for this site, to determine whether annual calibration schedule needs to be accelerated, owing to large deviations in monthly average truck weight and axle loading parameters.
Observations for OR SPS-10 WIM Site with Double-Threshold Piezo Quartz Sensor Array Installed in Asphalt Pavement
This site tends to drift toward overestimation of truck weight and axle loads (positive bias) over time. The computed average monthly truck weight and axle loading parameters exceeded the ±5% range for the validated data set parameters before the three calibration events, indicating calibration need.
Based on the analysis of the changes in the average truck weight and axle loading, it took the site 13, 3, and 13 months to reach the 5% threshold difference in truck or axle weights after calibration.
The NCHRP Tool indicated calibration need for this site for each field validation visit that required calibration. Field testing has confirmed that before calibration, most functional performance parameters exhibited measurement bias exceeding 5%.
Both the field test truck data and the data analysis result indicate that this piezo quartz WIM site requires annual calibration.
Regular monitoring of changes in monthly average truck weight and axle loading parameters is highly beneficial for this site to determine whether annual calibration schedule needs to be accelerated, owing to large deviations in monthly average truck weight and axle loading parameters.
Observations for VA SPS-1 WIM Site with Single-Threshold Bending Plate Sensor Array Installed in Concrete Pavement
During the analysis period from August 2018 to June 2023, all average monthly truck weight and axle loading parameters computed from WIM data were within the ±5% threshold for the validated data set parameters and the changes in the average truck weight and axle loading did not reach the 5% threshold, indicating no calibration need.
The NCHRP Tool did not indicate calibration need for this site during the analysis period. Field testing has confirmed that no functional performance parameters exhibited measurement bias exceeding 5% and no calibration was required.
Both the field test truck data and the data analysis results indicate that this bending plate WIM site does not require annual calibration. Longer periods between calibration events are acceptable if WIM data are monitored and analyzed monthly for changes in truck weight and axle loading parameters.
Observations for WI SPS-1 WIM Site with Single-Threshold Bending Plate Sensor Array Installed in Concrete Pavement
During the analysis period from August 2019 to June 2023, the monthly average truck weight and axle loading parameters computed from WIM data were mostly within the ±5% threshold for the validated data set parameters, indicating no calibration need, with two exceptions. The first exception was observed during the month preceding the 2019 calibration event. The second was during the 4 months in the winter of 2022, when the percentage of overloaded trucks increased over 5%. However, the changes in other parameters were within the 5% threshold and did not provide a strong support for calibration. The changes in monthly average weights and axle loads did not predict the 2022 calibration event, owing to replacement of one of the bending plate WIM sensors.
The NCHRP Tool indicated a calibration need for the March 2019 event. Field testing has shown that only the steering axle weight exhibited measurement bias exceeding the 5% threshold.
Both the field test truck data and the WIM data analysis result indicate that this bending plate WIM site does not require annual calibration. Longer periods between calibration events are acceptable if WIM data are monitored and analyzed monthly for changes in truck weight and axle loading parameters.
Truck Weight and Axle Loading Consistency over Time
Table 7 summarizes what percentage of monthly periods had monthly average truck weight and axle loading parameters exceeding the ±5% change from the validated average values. This table can be used to make inferences about consistency in weight measurements between calibrations. It is clear from the table that sites with bending plate sensors in concrete pavement exhibited much better truck weight and axle loading consistency over time. In addition, based on average bias and calibration intervals, the sites with piezo quartz sensors in asphalt pavement can be expected to drift beyond the 2% LTPP bias threshold for calibration after 4 months. In comparison, the sites with bending plate sensors in concrete pavement can be expected to drift beyond the 2% LTPP threshold for calibration after 27 months.
Percentage of monthly periods exceeding the ±5% change from the validated average

Discussion
The following answers to the research questions and additional conclusions were obtained.
Based on test truck data from field WIM performance validations, all four analysis sites showed changes in WIM functional performance characteristics over time. The sites with piezo quartz sensors in asphalt pavement showed more significant changes occurring earlier after calibration than the sites with bending plate sensors in concrete pavement. This observation supports the need for regular equipment calibration and indicates that different WIM sensors have different calibration needs and that local site conditions, including pavement type, could further contribute to variability in calibration needs.
Data analysis of changes in monthly average truck weight and axle loading parameters computed based on WIM IVRs for FHWA Class 9 trucks has shown that these parameters, as a group, can be effectively used to monitor WIM performance between field validation visits and serve as trigger points for calibration scheduling.
The use of any single monthly weight or loading parameter was less effective than the use of a combination of parameters, including GVW, front axle loading, tandem axle loading for loaded and unloaded trucks, and percentage of overweight trucks. This is because a single parameter might be affected by factors other than WIM calibration drift, such as seasonal changes in a proportion of loaded and empty trucks on the road, seasonal changes in truck payload, or a non-linear relation between front axle and tandem axle load error, owing to dynamic loading effects.
Changes in the monthly average weight and axle loading statistics, obtained using the NCHRP Tool algorithm to identify calibration needs, were effective at predicting calibration needs, which were confirmed by the results of field WIM performance validation. Therefore, the NCHRP Tool can be effectively used to schedule field WIM system functional performance verification and calibration visits.
The trend plots describing changes in the monthly average weights and axle loading (GVW, single axle, tandem axle, etc.) over time can serve as an effective aid in determining WIM calibration needs and help in understanding seasonal changes in truck weight and axle loading.
The analysis results show that periodic WIM data analysis, including comparison of monthly truck weight and axle loading summary statistics between the current and VDSs and the analysis of changes over time in truck weight and axle loading parameters for Class 9 trucks, has proven useful in identifying changes in the functional performance of WIM equipment. The analysis helps to understand whether traffic characteristics remain stable or change intermittently, seasonally, or gradually over time. Therefore, the NCHRP Tool can be used to identify WIM calibration needs using a procedure presented in the next section.
Practical Procedure for Data-Driven WIM Calibration Scheduling
WIM vendors typically provide recommendations about calibration scheduling. FHWA recommends annual calibration of WIM systems. While some generalizations about WIM calibration needs and calibration frequency can be made based on the sensor type and array, current practice shows that site-specific factors (road condition, pavement type, climate, sensor age, and construction quality) can play a significant role. Thus, to optimize allocation of the limited funds available for WIM equipment calibration, it is important to understand the behavior of individual WIM sites and use this knowledge to develop calibration schedules that ensure consistency in WIM data quality over time. The following procedure shows how a WIM calibration schedule can be optimized using the NCHRP WIM Data QA Analysis Tool. This tool can be requested from FHWA’s LTPP Customer Support Service Center (email:
For a new WIM site with less than 1 year of WIM data available:
Draw up a calibration schedule based on the calibration frequency recommended by the WIM equipment manufacturer.
If no recommendations are provided by the WIM equipment manufacturer, use FHWA’s recommendation for annual calibration.
For an existing WIM site that has WIM data reported for at least 1 year:
Each month, use the NCHRP Tool to upload WIM data and compute monthly truck weight and axle loading statistics. The recommended parameters include the following statistics for FHWA Class 9 trucks: average GVW; average F/A; average tandem axle load (tandem); average tandem axle load for loaded trucks (loaded tandem); average tandem axle load for unloaded trucks (unloaded tandem); average percentage of overloaded trucks (overweights).
Analyze changes in monthly truck weight and axle loading statistics using the NCHRP Tool for all the available months with WIM data.
Use the comparison analysis and trend analysis reports generated by the tool, and the Calibration Needs Analysis Based on Class 9 Vehicle Weights section of the tool’s user guide to understand whether changes in monthly truck weight and axle loading statistics represent seasonal fluctuations or continuous gradual changes over time.
Assess the size of the changes in truck weight and axle loading indicated in the monthly summary statistics and the estimated measurement bias values provided by the tool to determine the number of months after which the equipment is expected to reach the user-defined acceptable limit (the NCHRP Tool default value is 5%).
Use trend analysis report plots to determine whether changes in the monthly truck weight and axle loading statistics represent seasonal fluctuations or a gradual change.
If fluctuations are seasonal or semi-annual and are not driven by periodically lifted or imposed truck weight or axle load restrictions, determine the significance of the observed fluctuations. If the NCHRP Tool predicts seasonal or semi-annual bias values greater than the agency acceptable value, then seasonal or semi-annual calibrations may be necessary for the site. Determine the calibration season that would result in the least WIM error over the year and whether the seasonal changes are large enough to warrant seasonal or semi-annual calibration for the site.
If the changes are gradual, determine the number of months from a previous calibration until the month in which the GVW bias value predicted by the NCHRP Tool is greater than the agency’s acceptable value. Determine whether the predicted bias continues to be above the acceptable value in the succeeding months. If so, use the number of months between the previous calibration and the month when GVW bias crosses the acceptable value as a recommended calibration frequency for the site.
In the case of a sudden, stark change in the performance of a WIM system and before a re-calibration, always perform an on-site visual inspection of the WIM sensor installation and the surrounding pavement to determine possible sensor mount or pavement deficiencies.
For all WIM sites:
Each month, upload WIM data in the 2016 FHWA TMG W format and conduct a calibration needs analysis based on Class 9 vehicle weights, using the NCHRP Tool and WIM data files.
Compare the WIM measurement bias values predicted by the tool for GVW with the acceptable bias criterion established by the agency. If no agency-specific value is available, use the default 5% GVW bias as a criterion.
If the WIM measurement bias value for GVW predicted by the tool is above the acceptable bias criterion for two consecutive months, perform remote diagnostics of WIM equipment operational parameters. If the equipment is in working order, schedule out-of-cycle WIM site calibration, preferably within the following month.
Conclusions and Recommendations
The study highlights the importance of regular (at least monthly) remote monitoring of WIM performance between calibration events. The changes in truck weight and axle loading parameters have a high correlation with the WIM measurement bias and, thus, can be used to identify calibration needs.
The NCHRP Tool can be used to monitor WIM equipment performance, and to schedule WIM calibration using the procedures presented in this paper. These procedures can be beneficial to highway agencies involved in WIM data collection and the calibration of WIM equipment.
This study also contributes to a better understanding of changes in WIM performance over time for sites with piezo quartz sensors installed in asphalt pavement and bending plate sensors installed in concrete pavement. However, the observations presented in this paper are limited to the four WIM sites included in the analysis. Specifically, there were no tests to compare piezo quartz WIM sites with the bending plate WIM sites, where all sites were installed in PCC. Therefore, this exploratory study could be expanded to cover additional WIM sites and through the design of experiments to evaluate several contributing factors, such as sensor type, sensor array, pavement type, pavement smoothness, and pavement temperature. The additional data could also be used to further enhance the NCHRP model for predicting WIM measurement bias.
The goal of the procedures presented in this paper is to help agencies to optimize the allocation of limited resources, while ensuring the quality and consistency of WIM data. The scope of the exploratory research presented in this paper did not include an analysis of the extent of the available resources or the estimated costs associated with the installation and operation of various WIM systems. Future research is recommended to explore economic analysis to support the optimum WIM system selection, including the feasibility of replacing asphalt pavement with concrete segments and adopting bending plate sensors.
Footnotes
Acknowledgements
The authors thank the LTPP Program for providing data to support this study. The authors also thank NCHRP for allowing them to test the NCHRP WIM Data Quality Assurance Tool using data from the LTPP WIM sites.
Author Contributions
The authors confirm contribution to the paper as follows: study conception and design: Olga Selezneva, Dean Wolf, Deborah Walker; data collection: Dean Wolf, Deborah Walker; analysis and interpretation of results: Olga Selezneva, Dean Wolf.; draft manuscript preparation: Olga Selezneva, Dean Wolf. All authors reviewed the results and approved the final version of the manuscript.
Declaration of Conflicting Interests
The author(s) declared no potential conflicts of interest with respect to the research, authorship, and/or publication of this article.
Funding
The author(s) disclosed receipt of the following financial support for the research, authorship, and/or publication of this article: The author(s) received financial support from the FHWA for the initial exploratory research leading to the development of this article. The author(s) received no financial support for the additional effort for the development of this article, authorship, and/or publication of this article.
