



Abstract
With the development of conditionally automated driving, drivers will be allowed to perform non-driving-related tasks. Under such circumstances, continuous monitoring of driver cognitive load will play an increasingly important role in ensuring that drivers have sufficient mental resources to take over control of the vehicle should the driving automation fail. However, estimation of cognitive load is challenging because of the difficulties in identifying high-level feature representation and accounting for interindividual differences. Physiological measures are believed to be promising candidates for cognitive load estimation in partially automated vehicles. However, current estimation methods are mainly based on the manual feature extraction of time- or frequency-domain indicators from physiological signals, which may not adapt to dynamic driving conditions. With the development of deep learning, the neural network has shown good performance in automatically capturing high-level features from input data. Inspired by this, we adopted a novel approach to classify driver cognitive load based on electrocardiogram (ECG) spectrograms, in which the driver’s ECG signal was collected and transformed into a 2D spectrogram by a short-time Fourier transform. A squeeze-and-excitation network-based deep-learning framework that can capture high-level features and pays more attention to the cognition-related features of the spectrogram was proposed for classification. Experiments on a publicly available dataset demonstrated that our model achieved an accuracy of 96.76% in differentiating two levels of cognitive load for a within-subject evaluation and 71.50% accuracy with an across-subjects evaluation. The results demonstrated the feasibility of detecting drivers’ cognitive load through deep learning using ECG spectrogram alone.
The development of autonomous driving technology has made it possible for vehicles with conditionally automated driving systems (i.e., SAE Level 3 [ 1 ]) or higher to enter the consumer market within the foreseeable future. According to the latest McKinsey & Company forecast, 4% of newly sold vehicles are expected to be equipped with an L3-level conditionally automated driving system by 2030, and by 2035 this number may have increased to 14% ( 2 ). No doubt conditionally automated driving can create huge value for drivers and society. With conditional automation, vehicles can control the speed and direction by themselves, and monitor the surrounding traffic environment on roads with good traffic conditions. This allows drivers to shift their attention away from the driving tasks to nondriving tasks and make better use of their commute time. However, L3 automation is not fully autonomous and drivers may still need to take over control of the vehicle when necessary ( 3 ). Drivers’ performance in regaining control of their vehicles can be affected by several factors and the cognitive load of drivers is one of them.
Cognitive load is defined as “a multidimensional construct representing the load that is imposed on the cognitive system while performing a particular task” (4). Previous research found that high cognitive load among drivers can impair their capability to anticipate hazards in nonautomated vehicles ( 5 ). With driving automation, cognitive load has been found to impair the takeover performance ( 6 ). Previous research claimed that although driving automation can reduce drivers’ perceived cognitive load, it can cause higher cognitive load, given that drivers may still need to monitor not just the traffic, but also driving automation states ( 7 ). What is alarming is that drivers are more willing to engage in non-driving-related tasks (NDRTs) with driving automation, which may further occupy their cognitive resources, leading to high cognitive load. For example, a survey study found that about 45% of U.S. drivers and 32% of UK drivers are willing to engage in secondary tasks in autonomous vehicles that require higher cognitive demand ( 8 ). Given the detrimental effects of high cognitive load in conditionally automated vehicles and drivers’ willingness to engage in NDRTs, it will be necessary to continuously monitor the driver’s cognitive load and take actions to ensure drivers’ remaining cognitive resources are within a reasonable range to guarantee driving safety in such vehicles.
In the last few years, several algorithms have been proposed to estimate drivers’ cognitive load in nonautomated vehicles. Most of these previous works utilized three types of measure, that is, driving performance (e.g., Solovey et al. [ 9 ] and Rahman et al. [ 10 ]), eye-tracking (e.g., Rahman et al. [ 11 ], Liu et al. [ 12 ], and Li and Busso [ 13 ]), and physiological (e.g., Solovey et al. [ 9 ], Rahman et al. [ 10 ], and Meteier et al. [ 14 ]). In recent years, deep learning has also been applied to estimate driver cognitive load. For example, Angkan et al. extracted 21 features from electroencephalogram (EEG), electrodermal activity (EDA), and eye movement data, and utilized Visual Geometry Group (VGG) Net ( 15 ) and Residual Network (ResNet) ( 16 ) networks to train a cognitive load classification model ( 17 ). Rahman et al. presented a vision-based method to extract useful features from the driver’s eye movement based on domain knowledge, and achieved an accuracy of 91% through the convolutional neural network (CNN) ( 11 ). Liang Y. et al. proposed an attention neural network with decision-level fusion to learn features from EEG, eye movements, and vehicle states for classification ( 18 ). Table 1 summarizes previous research on driver cognitive load estimation in nonautomated vehicles.
Research on Cognitive Load Estimation in Drivers
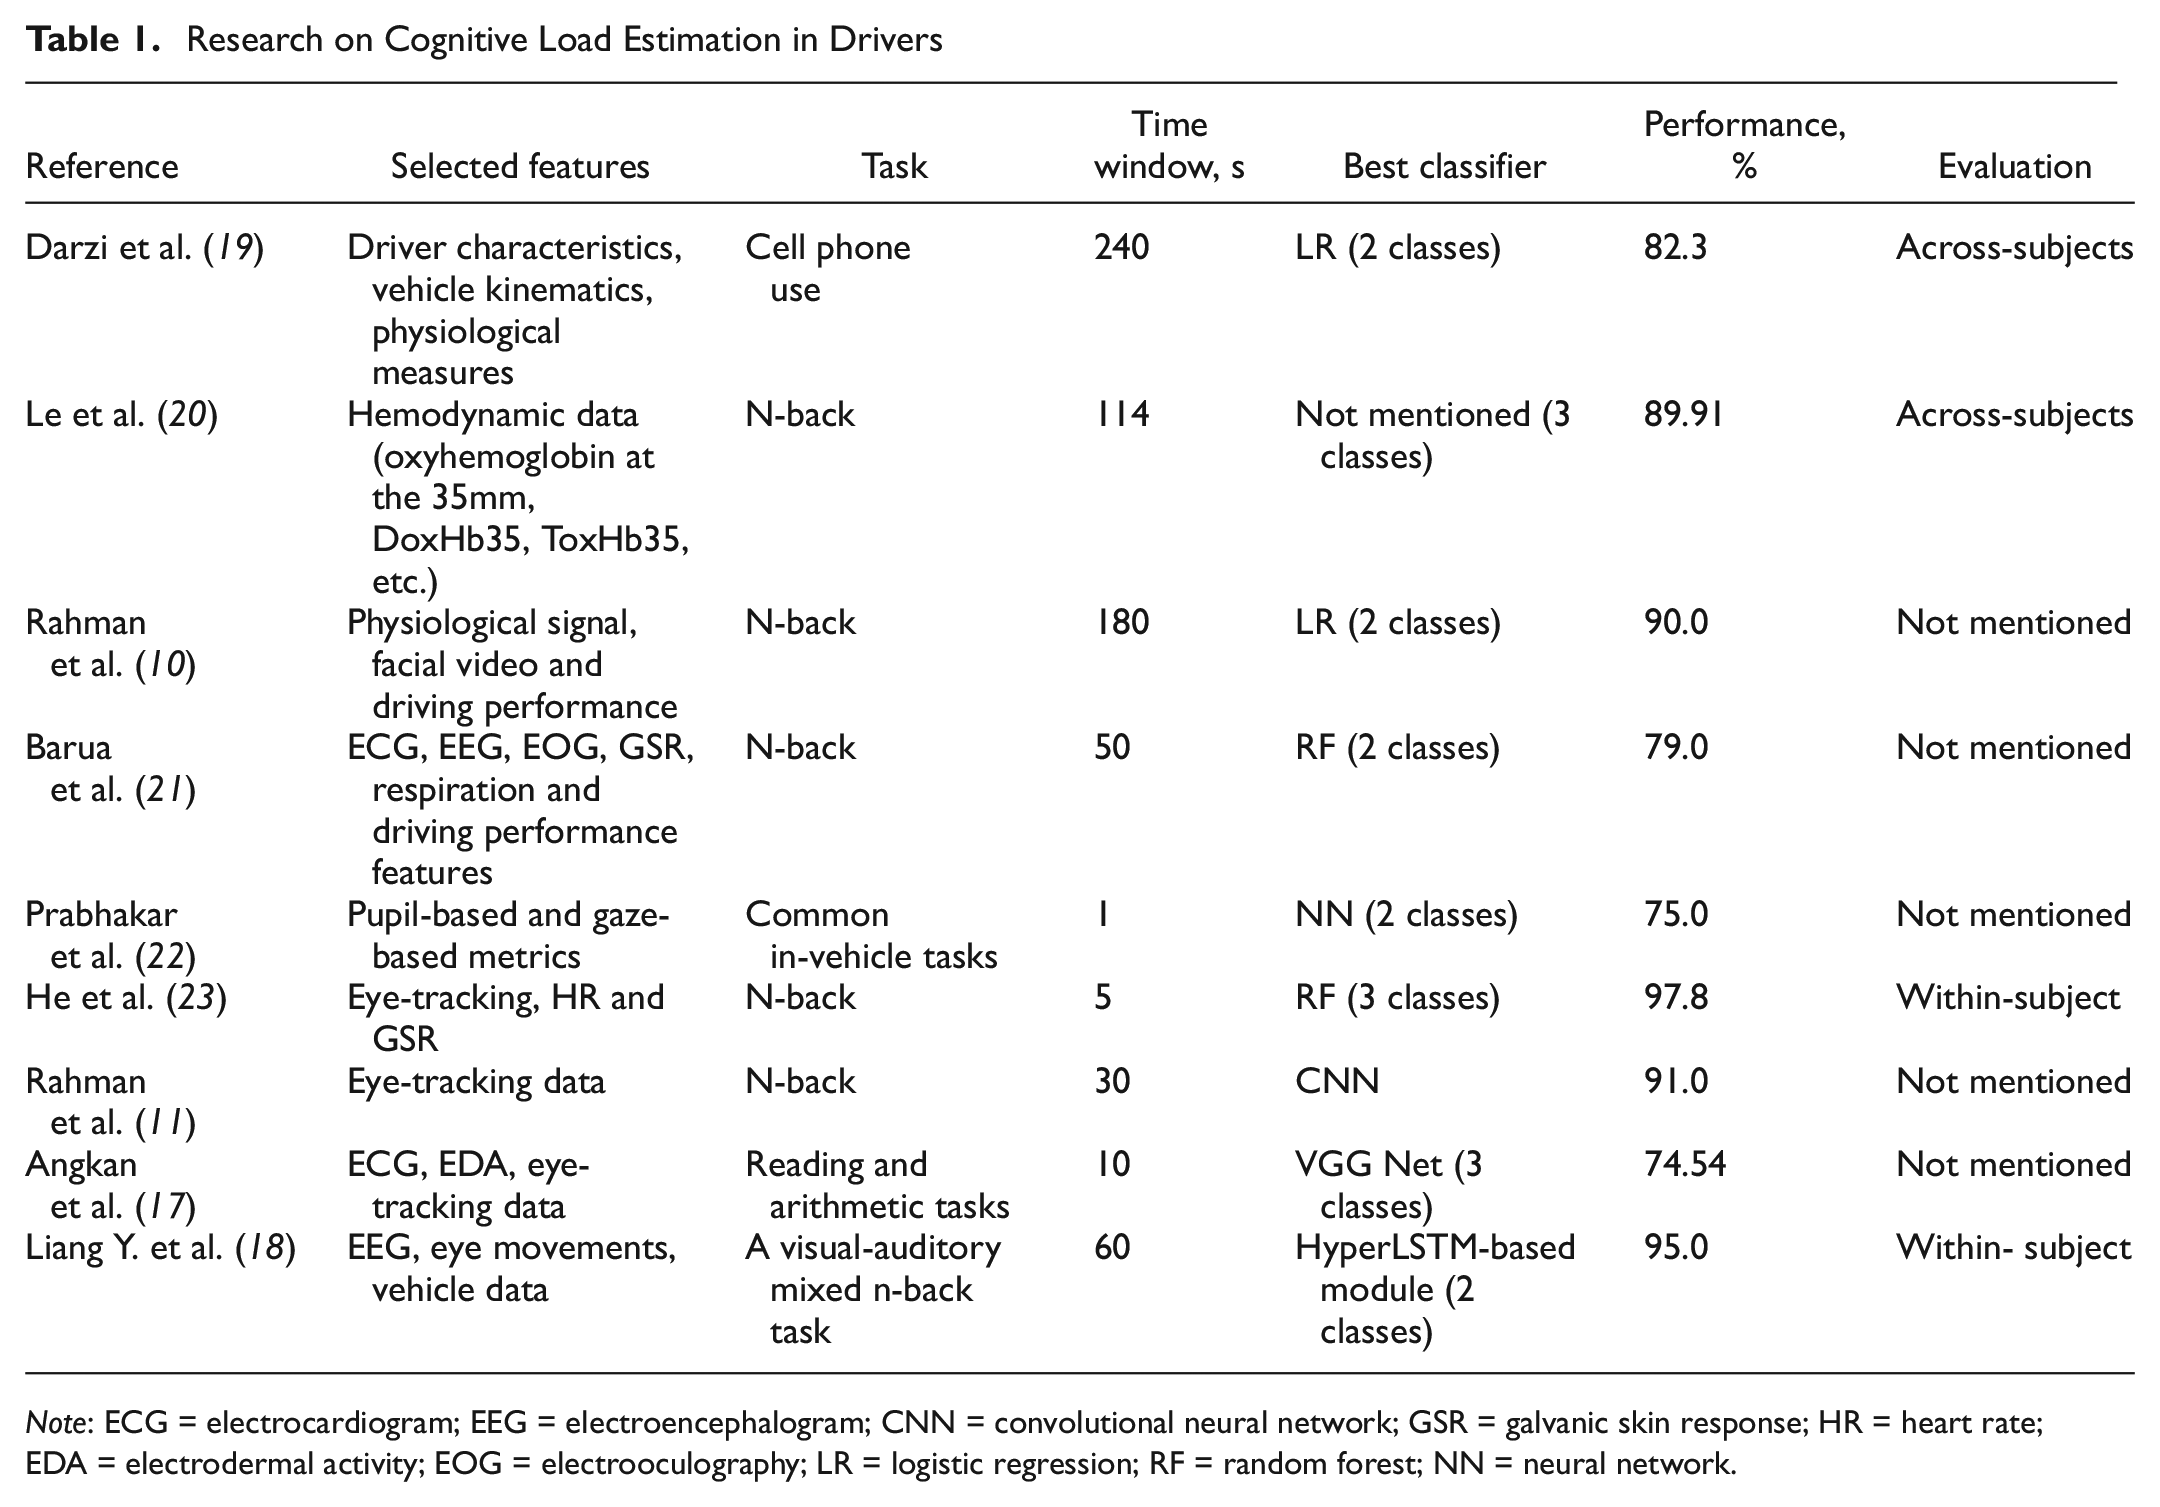
Note: ECG = electrocardiogram; EEG = electroencephalogram; CNN = convolutional neural network; GSR = galvanic skin response; HR = heart rate; EDA = electrodermal activity; EOG = electrooculography; LR = logistic regression; RF = random forest; NN = neural network.
Although driving performance data have been widely adopted in cognitive load detection in nonautomated vehicles ( 24 , 25 ), they are unavailable in conditionally automated driving as, most of the time, the driver is not controlling the vehicle. Similarly, because drivers might engage in NDRTs, the eye-tracking measures that were found to be effective in nonautomated vehicles could also become invalid in conditionally automated vehicles. Thus, physiological measures would seem to be a more promising option for real-time cognitive estimation in vehicles with driving automation. Previous studies have found that various indicators extracted from physiological signals are highly related to cognitive load in drivers. For example, heart rate (HR) and HR variability (HRV) extracted from electrocardiogram (ECG) signals are closely related to the activity of the autonomic nervous system, and thus can explain certain mental states of individuals such as fatigue and cognition ( 26 ). In addition to ECG signals, other indicators extracted from EEG, galvanic skin response, and respiration are also sensitive to changes in driver cognitive load ( 27 , 28 ).
However, it is worth mentioning that, although previous research has developed a variety of algorithms to differentiate cognitive load based on physiological measures, to the best of our knowledge, all of them relied on handcrafted feature extraction and feature selection, which is time-consuming and may lead to a loss of information, as feature extraction and selection are processes of information reduction. For example, researchers ( 10 , 14 , 29 ) extracted SDNN (the standard deviation of normal-to-normal [NN] intervals) and pNN50 (the percentage of adjacent NN intervals differing by more than 50 ms) from HRV as indicators to predict cognitive load. These features can be categorized as low level, which may or may not be sufficiently discriminative to differentiate driver cognitive states. In contrast, the features that are automatically learned from deep-learning models, high-level features, can keep more information compared with low-level features ( 30 , 31 ). For example, very rich information can be extracted from ECG data. Even for HRV alone, tens of features can be extracted from both time and frequency domains ( 32 ). Typically, only a few features are selected and fed into machine learning models, based on domain knowledge or data-driven selection (e.g., principle component analysis [ 33 ]). However, information might be lost in the process. With deep learning, it is possible to realize automatic feature selection and reduce information loss in the process of extracting handcrafted low-level features.
Thus, in this work, we evaluated the feasibility of estimating drivers’ cognitive load using an ECG spectrogram instead of handcrafted features. We chose the ECG as the sole measure because vehicle manufacturers are already considering deploying ECG sensors on steering wheels ( 34 ). Further, the spectrogram of the ECG (instead of the ECG signal in the time domain) was selected because a lot of ECG features are in the frequency domain. The performance of several deep-learning algorithms was compared when spectrogram versus handcrafted features were used as inputs. In addition to the classical deep-learning models, we also designed a new model—SE-ECG Net—which uses a convolution module and an attention layer, the squeeze-and-excitation network (SENet [ 35 ]), to automatically learn high-level features from ECG-based spectrograms to estimate drivers’ cognitive load.
The major contributions of this paper are summarized as follows. First, in contrast to previous studies that emphasize data fusion ( 23 ) and handcrafted feature extraction, we used a single, practical measure that would be feasible in vehicles to estimate driver cognitive load. To explore the cognitive-load-related information in the ECG, we creatively transferred the ECG signals into spectrograms and designed a SENet-based deep neural network to keep high-level features in the image-like spectrograms. Given that the ECG sensor has the potential to be integrated into the steering wheel, the algorithms developed in this study have the potential to be deployed in mass-produced vehicles. Further, to the best of our knowledge, this is among the first works (in addition to Meteier et al. [14, 29]) to focus on driver cognitive load estimation in SAE Level 3 vehicles.
Classification Task and Signal Preprocessing
Dataset and Classification Task
Two datasets were used in this study. The first one (Dataset 1) is a publicly available dataset compiled by Meteier et al. ( 36 ). In this dataset, 90 subjects (mean age: 24.2, standard deviation: 6.0 years, 40 males, 49 females, and 1 other) completed conditionally automated driving (defined as SAE Level 3 by the authors). Half of the participants were asked to perform a verbal-cognitive task, which required them to count backward from 3,645 in steps of 2 throughout the drive—they were assumed to be under high cognitive load; the other half of the participants only undertook the driving task, that is, low cognitive load. The driving session for each participant lasted 20 min, and three physiological signals including ECG, EDA, and respiration were collected during the period, with a sampling frequency of 1,000 Hz, leading to 120,000 samples (20 min × 60 s × 1000 Hz) per physiological signal channel for each participant. The experiment was conducted in a fixed-base driving simulator and all physiological data were collected using the sensors by BioPac. After the experiments, the NASA-Task Load Index ratings for the drive were collected. Then, statistical analysis was conducted to verify the induced high cognitive load in drivers. As a result, data from 87 subjects were deemed valid in the dataset. More details about the data can be found in the study by Meteier et al. ( 36 ). Our study task was to develop deep-learning models to estimate driver cognitive load (i.e., high- versus low level) based on the dataset using ECG measures alone.
To further verify the generalizability of our proposed method, we evaluated our models using an unpublished dataset collected by our team. In this dataset, 42 participants (21 males and 21 females) were recruited for a conditionally automated driving study. Each participant was required to perform or not perform a 2-min verbal 2-back cognitive task three times while driving with SAE Level 3 automation. The ECG data were collected using a three-lead ECG sensor at 100 Hz frequency, leading to a 252-min drive for each task level, totaling 1,512,000 samples (6 min × 60 s × 100 Hz × 42 participants). This dataset will be made publicly available when fully prepared (Dataset 2).
Signal Preprocessing
As stated in the introduction to this article, although the datasets contained multiple physiological measures, we selected only the ECG measure. As shown in Figure 1, four signal preprocessing procedures were conducted for the ECG signal, that is, down sampling, denoising, R-peak detection, and segmentation.

ECG signal process.
We first down-sampled the original 1,000 Hz sampling frequency to 360 Hz to reduce the computational load of the algorithm and make real-time cognitive load detection possible. Given that ECG signals are easily affected by different types of noise, including baseline drift, power frequency interference, and electromyography (EMG) interference, denoising is needed to reduce noise and enhance ECG morphology ( 37 ). Thus, we denoised the signal using the Butterworth filter, followed by powerline filtering ( 38 , 39 ). Specifically, a 0.5-Hz high-pass Butterworth filter was utilized to remove low-frequency noise and baseline drift. Then, powerline filtering was applied to remove noise caused by electrical equipment or nearby power lines. Figure 2 compares an example segment of the ECG signal before and after the denoise procedure. It can be observed that the filtered ECG signal exhibits a smoother waveform and has a lower baseline drift.

(a) ECG raw signal and (b) denoised signal.
Next, R peaks were detected based on the local maxima in the QRS complexes (the ventricular contraction consisting of the Q wave, R wave and S wave) ( 40 ), which are based on the steepness of the absolute gradient of the ECG signal. The R peak is defined as the highest amplitude point in the QRS wave morphology. Detection of the R peak was carried out with the Neurokit Python toolkit ( 41 ).
After detecting the R peak, the filtered ECG signal was segmented into 60-s time windows. We chose this window size because although we did not extract HRV features in our SE-ECG Net, other baseline models relying on HRV features require windows of at least 60 s for reliable HRV measurement ( 42 , 43 ). Specifically, to capture the entire cardiac cycle (including a series of QRS waves), each time window included 30 s of the data in front of a specific R peak and 30 s of the data after that R peak, leading to a total of 21,600 data points (i.e., 60 s × 360 Hz) in a window. The sliding window was set to 10 R-peaks, which means that the position of the next window was 10 R-peaks away from the last window. Figure 3 visualizes our signal segmentation process.
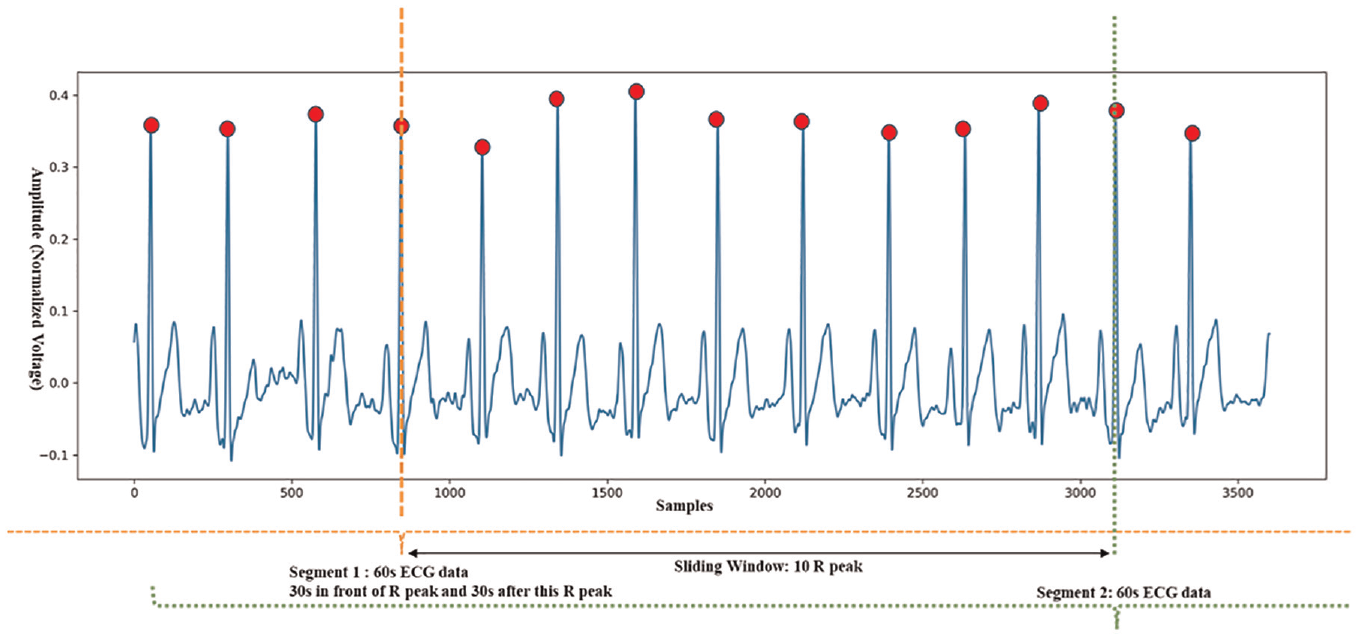
R-peak detection and signal segmentation process.
Generation of ECG Spectrogram
The 60-s ECG segments from signal preprocessing (See Figure 2) were transformed into a spectrogram, which is a visual representation of the signal frequency spectrum in a time window. Specifically, given the 60-s ECG segment, the data were split into short frames (each frame was 350 ms) with Hamming windows. Then, we calculated the power spectrum from each frame by using a short-time Fourier transform to produce a spectrogram. The horizontal axis of the spectrogram represents time, and the vertical axis represents frequency. Thus, the spectrogram contains information on how the frequency content of the ECG signal changes over time. Figure 4 presents the time-domain (left) and spectrograms (right) of the filtered ECG signals under high and low cognitive load in Figure 4a and Figure 4b, respectively.

ECG signal and spectrogram of (a) drivers under high cognitive load and (b) drivers under low cognitive load.
Extraction of Handcrafted ECG Features
For handcrafted HRV features, a window needs to be long enough for feature extraction. Given that a 1-min time window, as a minimum, is recommended for reliable HRV feature extraction ( 42 , 43 ), in our study, 70 ECG features were extracted from the time-, frequency-, and nonlinear domains using a 60-s time window in the signal (See Table 2).
Handcrafted HRV Features Extracted from ECG Signal

Note: HRV = heart rate variability; ECG = electrocardiogram.
All handcrafted features were extracted using the Neurokit Python toolkit ( 41 ). Please check the official website for definitions of the abbreviations and explanations of each indicator. https://neuropsychology.github.io/NeuroKit/.
Candidate Models
SE-ECG Net
A schematic demonstration of our proposed SE-ECG Net for the classification of driver cognitive load is presented in Figure 5. The developed SE-ECG Net is mainly comprised of two modules, that is, the convolution module and the SE-inception module. Then, a fully connected layer (FC layer) and a SoftMax layer were used to generate the output (i.e., estimation of the driver’s cognitive load level) ( 44 ).

Framework of SE-ECG Net.
Specifically, three convolutional layers and three max-pooling layers of the convolution module were utilized to extract local features from the spectrogram. Given that not all frame-level features from the ECG spectrogram contribute equally to the classification of cognitive load, a channel attention mechanism, the SE-inspection module ( 35 ), was added to the architecture, which demonstrated significant advantages in image recognition tasks by learning the importance weights of each channel, enhancing, or reducing their contribution to the classification. SE-inception can automatically assign more weight to important features. Thus, the SE-ECG Net can automatically learn high-level feature representations from the spectrogram for cognitive load classification.
Figure 6 shows the structural details of an SE-inception module. The different-colored squares in the figure demonstrate that SE-inception automatically learned the weight information of the different channels of the input spectrogram. Given the input ECG spectrogram (H × W × C), the CNN modules mapped the ECG spectrogram into
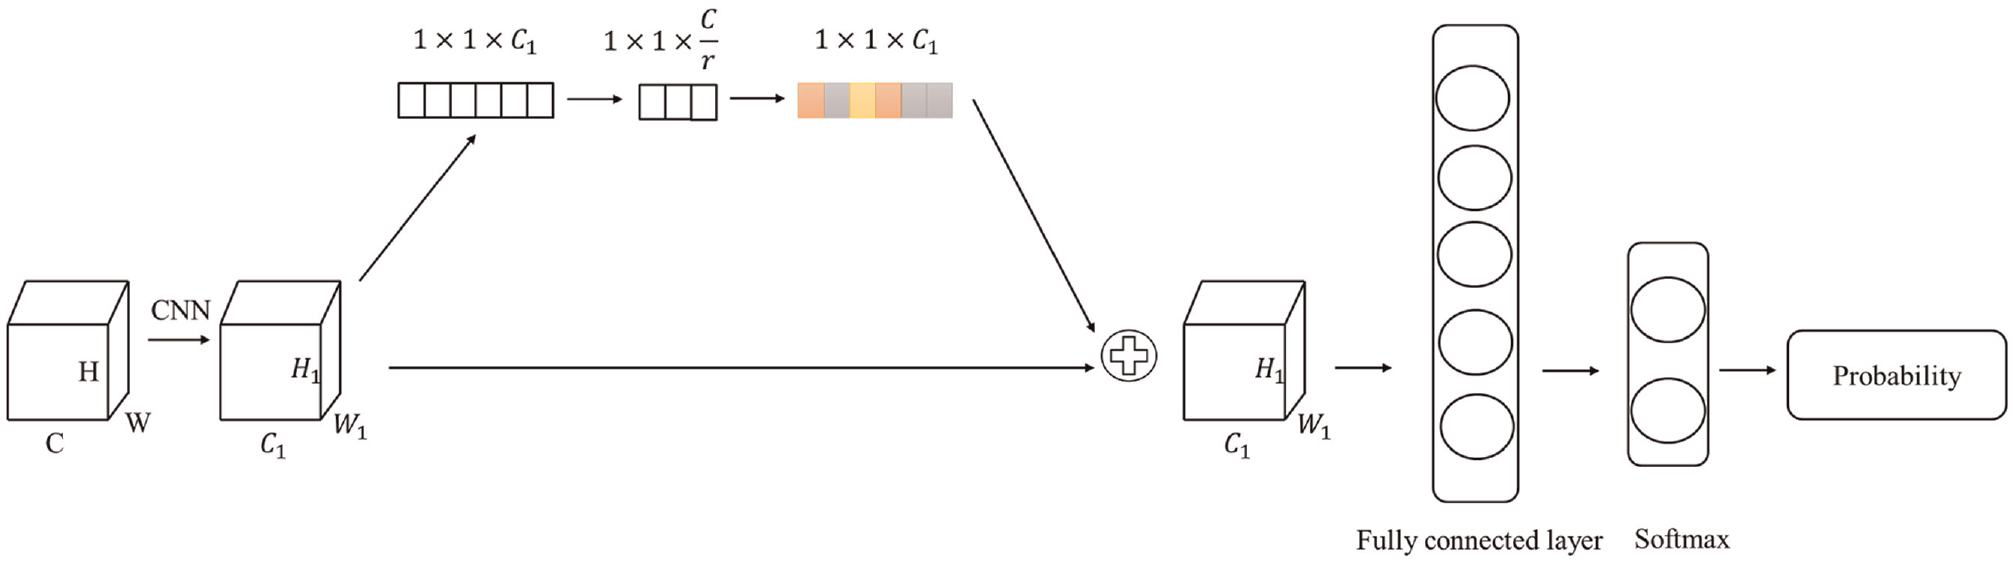
Structural details of SE-inception module.
Other Deep-Learning Models
To better evaluate the potential of estimating drivers’ cognitive load with ECG-based spectrograms, we selected two classic network structures as baselines, including the VGG Net (Figure 7a), and the ResNet (Figure 7b). The VGG Net was selected as it can capture complex spatial structures, whereas the ResNet was selected as it can mitigate the vanishing gradient problem through residual connections ( 16 ). Further, a SE-ECG Net without SENet was compared with our proposed SE-ECG Net to show the contribution of SENet to model performance. It should be noted that when a SENet is removed, the SE-ECG Net is reduced to a CNN.

Structure of (a) VGG Net and (b) ResNet. VGG Net adopts a series of stacked convolutional and pooling layers to effectively extract features from images. ResNet alleviates the vanishing gradient problem using a residual structure (Block1 and Block2).
To evaluate the performance of the spectrograms, all models were trained and tested twice, once with ECG spectrograms as inputs (i.e., spectrogram-based models) and once with handcrafted features as inputs (i.e., feature-based models). Since the shape of the spectrogram was two-dimensional (2D) and the handcrafted features were one-dimensional (1D), the 2D convolution module (Conv2D) and the 1D convolution module (Conv1D) were used, when the models were trained on different inputs, respectively.
Experiment Setup
All models were trained and tested using both within-subject and across-subjects data partitions. Considering that K-fold cross-validation has the advantages of avoiding bias, overfitting, and ensuring the reliability and accuracy of experimental results, a 10-fold cross-validation was employed. Specifically, for a within-subject data partition, the ECG spectrograms computed from all subjects were combined. Then, the dataset was divided into 10 continuous equal parts, using 9 parts for training and 1 part for testing. This procedure was repeated 10 times with each part used once for testing. For the across-subjects data partition, the data from eight or nine participants were used for testing, and the remaining 79 or 78 participants were used for training. Again, the data from each participant were used for testing once in the 10-fold cross-validation.
All deep-learning models were implemented with the PyTorch toolkit, and the parameters of the model were optimized by minimizing the cross-entropy loss, with a minibatch of 32 samples. The initial learning rate was set to 0.001 and became 0.0001 after five epochs to prevent overfitting. The optimizer was Adam ( 45 ). All model training and testing processes were conducted on an NVIDIA GeForce RTX 2080 Ti.
Results
To illustrate the feasibility of using a spectrogram for drivers’ cognitive estimation, we first compared our spectrogram-based models with the feature-based models. Then, we compared our proposed SE-ECG Net with other deep-learning baseline models on spectrograms. Lastly, to verify the generalization of our proposed method, the SENet was retrained and evaluated on a second dataset (i.e., Dataset 2).
As shown in Table 3 and Figure 8, the comparison between the spectrogram- and feature-based models showed that the process of generating handcrafted features could result in information loss. Specifically, for the within-subject experiments, the spectrogram-based methods achieved 96.76% and 91.97% on the two datasets, respectively. For the across-subjects experiments, although the accuracy of all models dropped, the spectrogram-based models still exhibited a superior performance to the models based on handcrafted ECG features. We assumed that the spectrogram-based models were able to keep more individual-independent information compared with models based on handcrafted features. These experiments showed the advantages of the spectrogram for drivers’ cognitive estimation.
Model Results

Note: The bolded text highlights the models that achieved the highest accuracy.
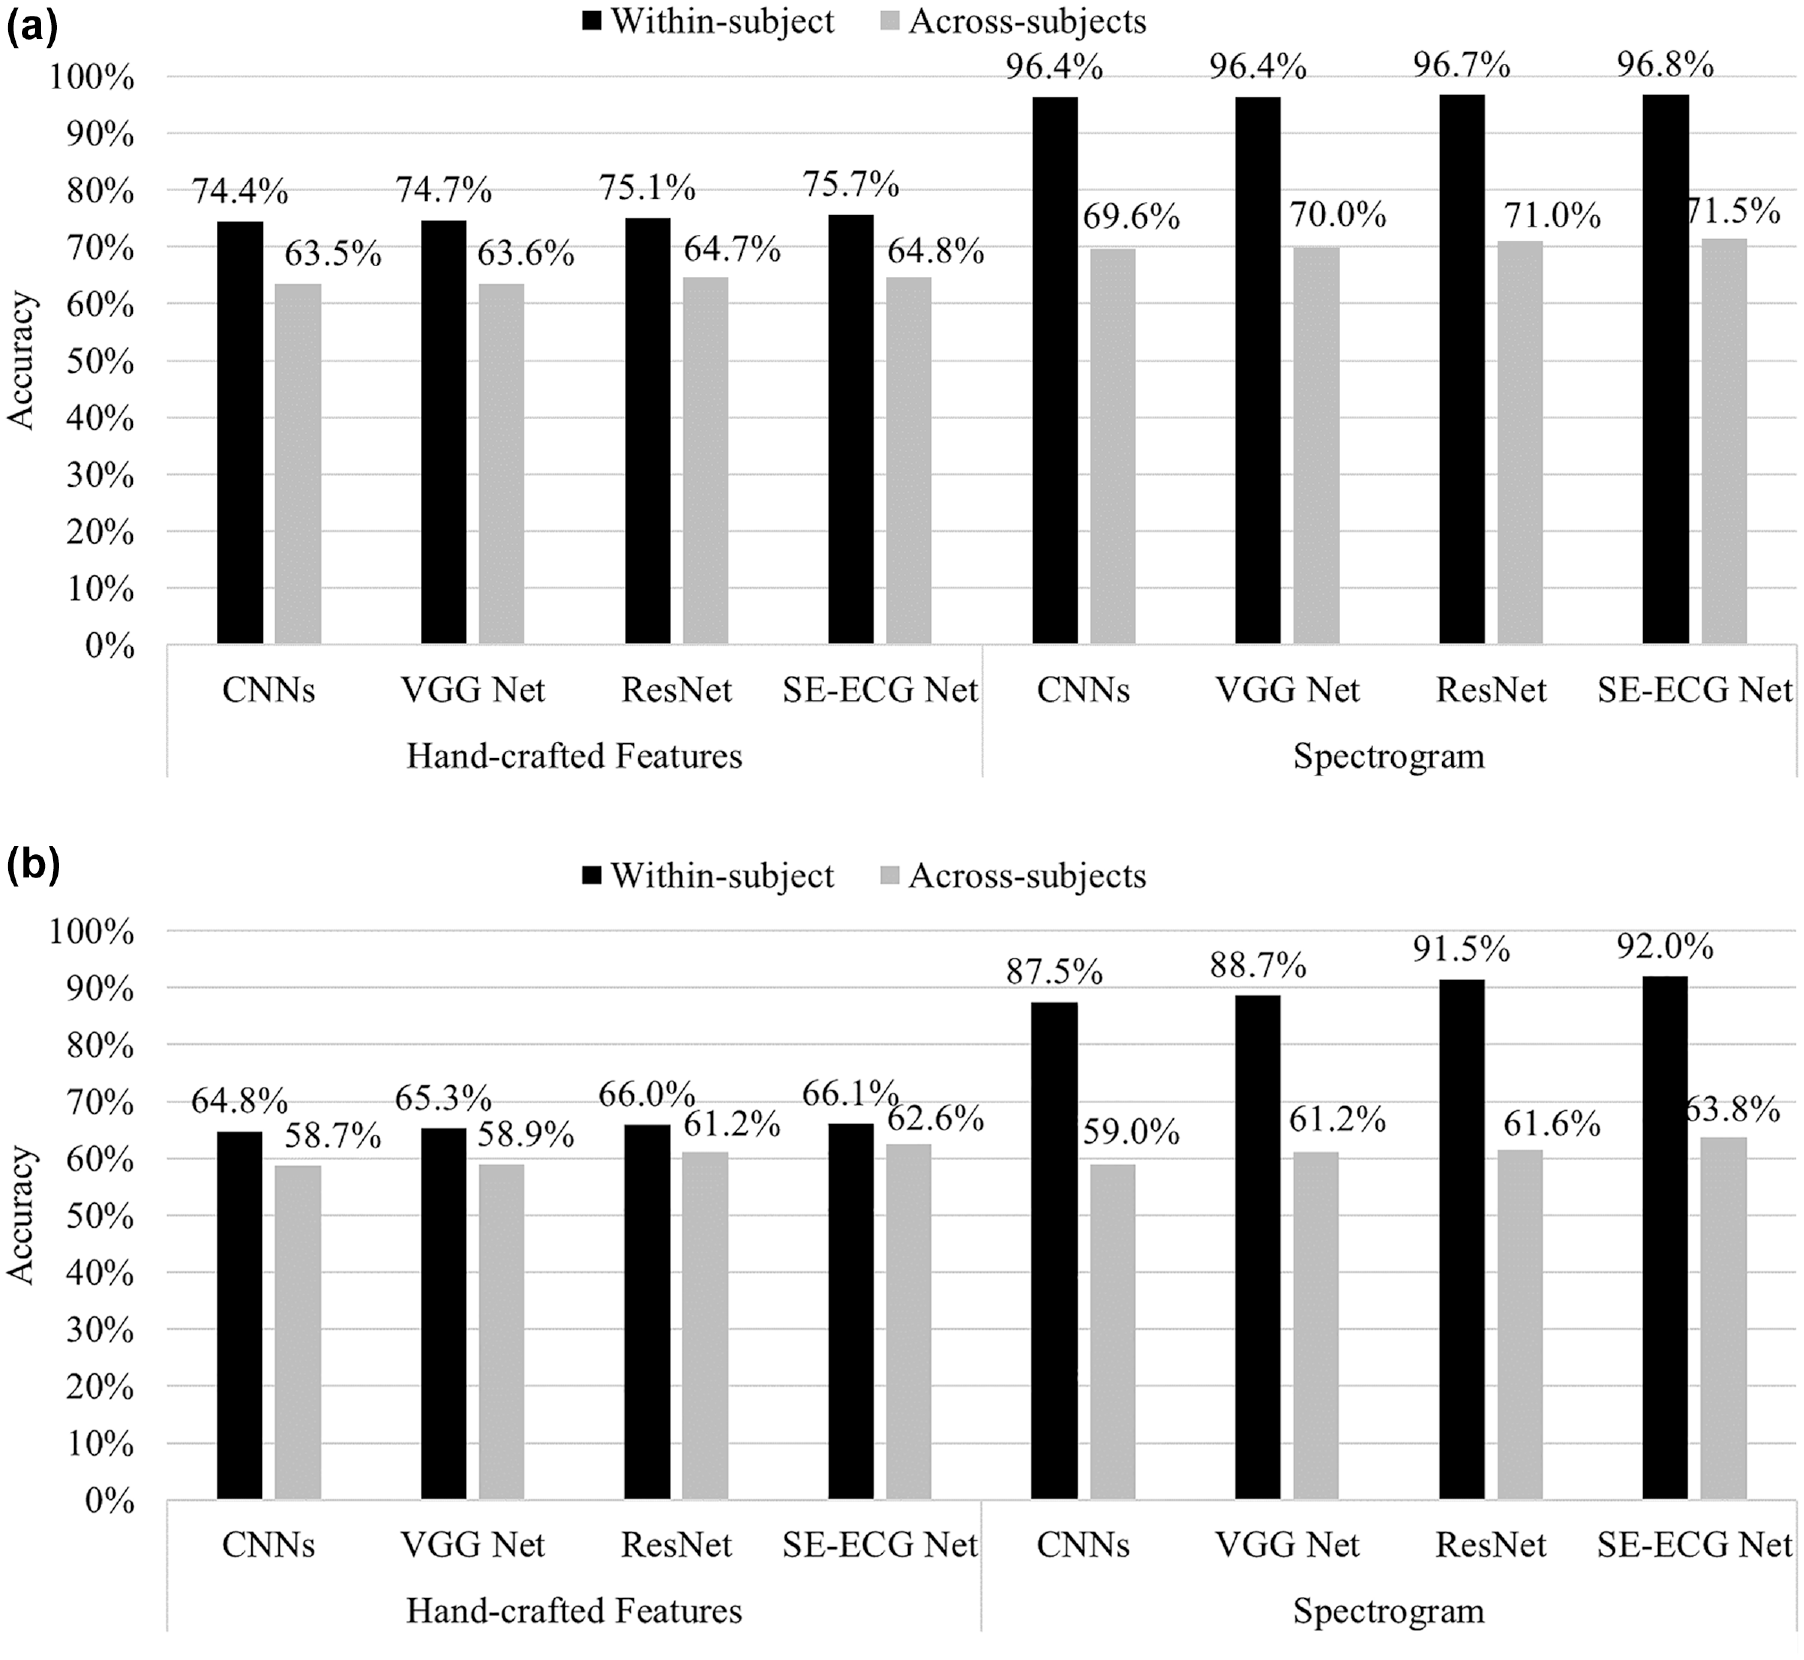
Accuracy of models with different data partitions: (a) Dataset 1 and (b) Dataset 2.
Table 3 and Figure 8 further demonstrate the superior performance of SE-ECG Net when compared with other deep-learning neural networks and the CNNs (i.e., SE-ECG Net without SE-inception module). Specifically, the SE-ECG Net achieved high accuracies on two datasets with both within-subject and across-subjects data partitions, exceeding the performance of CNNs, VGG Net, and ResNet. This indicates that learning the importance weights of the features by the SE-inception module increased model performance.
Finally, it should be noted that compared with within-subject experiments, the accuracy of all classifiers dropped significantly with an across-subjects data partition, indicating that the deep-learning neural networks in our study may still not be able to fully learn individual-independent features from ECG-based spectrograms.
To further compare the performance of the spectrogram-based methods, confusion matrices are provided in Figure 9. In general, the models performed better in identifying low workload versus high workload (3 out of 32 cases), potentially because of the ceiling effect of the ECG signals during high cognitive load ( 46 ). This trend was more obvious in the within-subject data partition compared with the across-subjects data partition; and clearer in the spectrogram- than the feature-based models. Thus, future research might consider fine-tuning the model structures to strengthen performance based on the requirements of the task.

Confusion matrices of models: (a) Dataset 1 and (b) Dataset 2.
Discussion
In this study, we proposed a novel approach to assess driver cognitive load using ECG spectrograms. To this end, we designed an SE-ECG Net architecture to automatically identify high-level features in spectrograms and estimate the cognitive load in drivers. Experimental results showed that the ECG spectrogram performed better than machine learning models that relied on handcrafted features extracted from ECG signals when both within-subject and across-subjects data partitions were used. At the same time, the comparison experiment showed that the SENet module contributed to estimation accuracy: increasing estimation accuracy when both within-subject and across-subjects data partitions were used.
Although handcrafted features can be designed to capture specific characteristics of the data (e.g., the time interval between two consecutive R waves in the ECG will become narrower when there is high cognitive load), extracting and selecting handcrafted features can lead to a loss of information. In contrast, deep-learning models can perform nonlinear transformations on the input spectrogram. When reaching the final layer of the network, the input can be transformed into a high-level feature representation that is well-suited for the classification of cognitive load; this explains the good performance of the deep-learning models: the CNNs, VGG Net, ResNet, and SE-ECG Net. On the other hand, the superior performance of SE-ECG Net as compared to other deep-learning baseline models can be explained by the capability of the SE-inception module to pay more attention to cognition-related features in the spectrogram. However, it should be noted that, from the within-subject data partition to the across-subjects data partition, model performance still dropped significantly, although the performance of the spectrogram-based deep-learning models was still better than the models that relied on handcrafted features. This might be because the deep-learning models used in our study were still not able to capture all individual-independent features of high cognitive load.
Overall, our proposed method could be practical and valuable for real-world applications as it can utilize ECG data alone to detect high cognitive load among drivers, which can be measured using steering-wheel-integrated sensors. From a practical perspective, collecting eye-tracking data that are accurate enough for driver state detection can be expensive and unreliable (e.g., owing to complex lighting conditions and eye occlusion by sunglasses or hair) whereas collection of other physiological signals such as EEG and respiration are intrusive. A single physiological signal was believed to contain too little information for accurate driver state estimation. The results of our study indicated that a single signal, such as ECG, could contain more information in high-level features, and satisfactory models might be built using only a few physiological signals if the information in the signals can be fully exploited. However, some practical issues need to be considered before the actual deployment of ECG sensors in vehicles, such as noise reduction and sensor reliability. For both datasets used, the ECG signals were collected in laboratories and, thus, were relatively clean compared with ECG signals collected using wearable sensors or embedded sensors in actual vehicles. Therefore, future data cleaning and noise filtering techniques might need to be developed before the algorithms can be deployed in smart cabins. In addition, auto manufacturers also need to consider the reliability of the ECG sensor to ensure a stable and reliable performance over an extended period. For example, if the sensors are embedded in the steering wheel, similar to that planned by Toyota ( 34 ), ensuring that drivers can continuously hold the steering wheel is a prerequisite of the ECG-based models. Therefore, future work may also need to consider model switching or fusion when different signals are available.
As far as we know, this is one of the first works to use a spectrogram for driver cognitive load estimation. Despite promising results, our study still has some limitations. First, the dataset utilized in this research was limited to a fixed simulator, which might not have fully replicated real-world driving conditions. Thus, the performance of the models in estimating the cognitive load imposed by different cognitive tasks, especially real in-vehicle tasks, should be further explored. Future research could also benefit from the inclusion of data collected in actual driving environments to further validate the findings. Further, as yet, the spectrogram-based method is not able to handle heterogeneity between individuals. The performance of the proposed model dropped significantly with an across-subjects data partition. Future studies may need to consider other approaches such as data fusion ( 47 ), pretraining, and domain generalization to improve model performance in estimating the cognitive load levels across subjects. For example, Saadatnejad et al. proposed that two sets of ECG data can be used, that is, local ECG data collected from each individual, which reflects their unique characteristics and individual differences, and global ECG data collected from a large population, which can be used for comparison and analysis to better understand the commonalities and differences of ECG signals ( 48 ). Therefore, global physiological data could be used for pretraining and local physiological data could be used to customize the models to improve the accuracy of cognitive load estimation. Future research should explore this approach when a larger physiological dataset becomes available. In the computer vision domain ( 49 ), domain generalization has demonstrated its advantages in solving generalization capabilities, but it has not been explored in the field of cognitive load estimation.
Conclusions
In this study, a 2D spectrogram was first extracted from the ECG signal and the superior performance of this approach was validated on a novel SE-ECG Net and two classical deep-learning benchmark models (i.e., VGG Net and ResNet). Experiments on a publicly available dataset (i.e., Dataset 1) achieved an accuracy of 96.76% in the within-subject evaluation and 71.50% in the across-subjects evaluation. The results highlighted the superiority of the spectrogram-based approach compared with the approaches based on handcrafted features for driver high cognitive load detection in SAE Level 3 vehicles. This success can be attributed to the implementation of deep learning with attention mechanisms and using an ECG spectrogram as input. Therefore, the findings demonstrate the feasibility of utilizing these techniques for cognitive load detection in drivers based on a few—or even single—measurable physiological signals, which could facilitate the application of nonintrusive physiological sensors to improve the safety of SAE Level 3 vehicles, potentially alleviating the privacy concerns related to driver monitoring systems when computer vision-based approaches are adopted.
Footnotes
Author Contributions
The authors confirm contribution to the paper as follows: study conception and design: W. Shi, Z. Wang; data collection: W. Shi, A. Wang; analysis and interpretation of results: W. Shi, Z. Wang, A. Wang, D. He; draft manuscript preparation: W. Shi, Z. Wang, A. Wang, D. He. All authors reviewed the results and approved the final version of the manuscript.
Declaration of Conflicting Interests
The authors declared no potential conflicts of interest with respect to the research, authorship, and/or publication of this article.
Funding
The authors disclosed receipt of the following financial support for the research, authorship, and/or publication of this article: This work was supported by the Natural Science Foundation of Guangdong Province of China (2024A1515010392), and partially by the National Natural Science Foundation of China (grant no. 52202425), the Project of Hetao Shenzhen-Hong Kong Science and Technology Innovation Cooperation Zone (HZQB-KCZYB-2020083), and the Guangzhou Science and Technology Program City-University Joint Funding Project (No. 2023A03J0001).
