
Abstract
We combined established psychological measures with techniques in machine learning to measure changes in gender stereotypes over the course of the 20th century as expressed in large-scale historical natural language data. Although our analysis replicated robust gender biases previously documented in the literature, we found that the strength of these biases has diminished over time. This appears to be driven by changes in gender biases for stereotypically feminine traits (rather than stereotypically masculine traits) and changes in gender biases for personality-related traits (rather than physical traits). Our results illustrate the dynamic nature of stereotypes and show how recent advances in data science can be used to provide a long-term historical analysis of core psychological variables. In terms of practice, these findings may, albeit cautiously, suggest that women and men can be less constrained by prescriptions of feminine traits. Additional online materials for this article are available on PWQ’s website at 10.1177/0361684320977178
Representation of women and men in the American society has changed considerably over the past century in both social and professional domains. Women’s participation in the work force has steadily increased, reaching 57% in 2018 from just 32% in 1950 (United States [U.S]. Department of Labor, 2018). Women’s educational attainment has followed a similar pattern with more women completing higher education and obtaining advanced degrees in fields such as law and medicine (Okahana & Zhou, 2018). Perhaps parallel to these changes, fewer women are getting married, and those that are do so at a later age compared to any other point in the history of the U.S. (Centers for Disease Control and Prevention, 2017; U.S. Census Bureau, 2019). Moreover, in contrast to a few decades earlier, family life no longer precludes women from the labor force: 58% of married women and 65% of mothers with children under 3 years work full-time outside of the home (U.S Bureau of Labor Statistics, 2018).
Despite these improvements to women’s positions in social and professional life in the U.S., much has also stayed relatively stagnant. Women are still underrepresented in managerial and leadership positions (Warner et al., 2018). They remain the primary caregivers to children, even in dual-earner families, thus creating a “second-shift” responsibility for women (Hochschild & Machung, 2012). Relatedly, women continue to leave the workforce at higher rates than men after having children (Zessoules et al., 2018). Perhaps as importantly, the place of men in society has not changed to the same extent as women. Men still occupy higher status jobs, earn more money than women in these jobs, and are less likely to contribute to childrearing in dual-earner homes (U.S. Bureau of Labor Statistics, 2018).
These changes (or lack thereof) are important because they are likely to inform our expectations about women and men in society, which form the basis of stereotypes we hold about these groups (Ellemers, 2018). An especially influential account of the origin of gender stereotypes is social role theory (Eagly & Wood, 2012; Koenig & Eagly, 2014), which posits that gender stereotypes are the product of people’s observations of women and men in their social roles. Over time, constant and consistent observation of these roles evolves into the ascription of role-congruent traits, forming the basis of stereotypes. For example, observing women in the domestic sphere (cooking or taking care of children) and men in roles outside the home (pursuing a career) turns these behaviors into expectations, culminating in women being stereotypically viewed as communal and men being stereotypically viewed as agentic (Bakan, 1966).
Stereotypes, in turn, matter because they influence perceptions and behavior of both evaluators and targets of stereotyping. In terms of the former, perhaps the most prominent general finding is that people evaluate the performance of men versus women differently and in accordance with stereotypic expectations. For example, a recent field experiment showed that employers recruiting in Science, Technology, Engineering and Mathematics (STEM) fields evaluate a woman with a 4.0 GPA equally as a White man with a 3.75 GPA and place less importance on a prestigious internship when the job candidate is a woman rather than a man (Kessler et al., 2019). Similarly, experimental studies in the lab found that identical resumes elicit different call-back and job offer rates depending on the gender of the applicant (Moss-Racusin et al., 2012). Moreover, people perceive women who act agentically by initiating negotiations as less nice and more demanding and in turn are less willing to work with them compared to women who do not negotiate (Bowles et al., 2007). These effects, unfortunately, are not confined to experiments; publicly available wage data have shown that women make less than men even when they are equallyqualified and are employed in the same type of industry (Buffington et al., 2016).
The detrimental effects of gender stereotypes are not exclusive to women, as men also incur penalties starting from early age for defying stereotypic expectations and behaviors. For example, children evaluate boys who have feminine hairstyles and clothing more harshly than girls with masculine hairstyles and clothing (Blakemore, 2003). These expectations persist in later stages of life as well. In two field studies, Berdahl and Moon (2013) demonstrated that men who chose to actively take on a stereotype-incongruent caregiving role in the family faced more harassment and mistreatment at work than traditional fathers who did not take on this role and compared to men without children. Other research has connected these perceptions to actual life outcomes: Men who took a break from employment or reduced work hours due to family reasons experienced depressed wages over time compared to men who had similar pauses to their employment due to nonfamily reasons (Coltrane et al., 2013). Arguably, these findings are problematic because they have the potential to thwart progress for both women and men. Penalizing men for stereotype-incongruent behaviors such as taking a more active role in childcare has direct consequences for women’s advancement in their careers because this responsibility inevitably falls on them as mothers.
Stereotype-congruent expectations also influence perceptions and behavior of targets of stereotyping, causing them to strategically moderate their behavior to escape backlash. For example, in competitive negotiations, a typically masculine domain, women negotiators make less aggressive offers than men because they expect to be viewed negatively if they behave competitively (Amanatullah & Morris, 2010). More generally, it has been argued that women engage in a range of impression management strategies in competitive contexts, such as hedging (Carli, 1990; Tannen, 1994) and apologizing (Schumann & Ross, 2010) with the aim of escaping potential negative evaluations.
Studying Changes to Stereotypes
The rich body of literature on gender stereotypes reviewed in the above section shows that stereotype-based expectations influence the behavior of both women and men, as targets and as evaluators, resulting in outcomes that impede women’s progress in society. Given such wide-ranging effects of stereotypes, characterizing the nature of stereotype change has been of considerable importance to researchers, as it has the potential to inform theories of social cognition and behavior (Eagly & Steffen, 1984; Prentice & Carranza, 2002; Rudman & Glick, 2001), as well as to explain and eventually reduce gender inequities in social and professional outcomes (Amanatullah & Morris, 2010; Cheryan et al., 2017; Eagly & Karau, 2002; Heilman, 2001; Steele & Aronson, 1995).
The dominant method to study stereotype change has been to ask participants direct questions to measure change. This has been done by having participants imagine the traits women and men have had in the past (Diekman & Eagly, 2000) or by conducting meta-analyses of popular gender stereotype questionnaires and public opinion polls administered at different points in time (Donnelly & Twenge, 2017; Eagly et al., 2019; Haines et al., 2016; Twenge, 1997). This research has predominantly demonstrated that gender stereotypes have been weakening for women despite staying relatively stable for men (Croft et al., 2015). This general finding is not surprising given the evolving nature of social roles for women and men discussed above, which documents considerable change for women with an active role outside of the home, but markedly less change for men. If gender stereotypes are indeed informed by social roles women and men take in society (Koenig & Eagly, 2014), we would expect to see the trend observed in the literature, where stereotypes associated with women would be more dynamic than those associated with men.
What is less clear, however, is the specific nature of the change. To elaborate, Donnelly and Twenge (2017) found that women’s femininity scores on the Bem Sex-Role Inventory (BSRI; Bem, 1974) have significantly decreased, whereas their masculinity scores have remained stable in the past 3 decades. No changes occurred in men’s scores on either dimension. In a recent meta-analysis, Eagly and colleagues (2019) examined U.S. opinion polls conducted on 30,000 adults between 1946 and 2018. They found that perceptions of women’s communality and competence have increased over time, whereas there has been no change to perceptions of agency. This finding is perplexing since one would expect perceptions of agency and competence, two masculine traits, to change in tandem. Furthermore, these findings diverge from how people expect stereotypes will change, as Diekman and Eagly (2000) showed that participants imagine women’s masculinity to increase over time, whereas they expect their femininity to stay constant. Finally, in contrast to these findings depicting stereotype change, Haines and colleagues (2016) documented the durability of gender stereotypes by comparing data collected in 1983 to that collected in 2014. In other words, findings on the exact nature of the change to the content of gender stereotypes have been mixed.
Although existing research has informed our understanding of shifting stereotypes, perhaps one reason for these conflicting findings is that standard empirical techniques in psychology can only provide a limited perspective on historical changes to core psychological variables. Human memory and the capacity for introspection is notoriously fallible (Nisbett & Wilson, 1977; Vazire, 2010), and asking individuals to estimate historical trends may not provide an accurate account of empirical realities (Cronbach & Furby, 1970; Eagly et al., 2019; Fiske & Linville, 1980). Likewise, meta-analysis techniques for uncovering trends can be biased by time-dependent shifts in survey methodology and sample demographics. For example, there has been an increasing reliance on online studies in recent years, with many newer studies using crowd-sourced participant responses, obtained from websites such as Amazon Mechanical Turk (see Paolacci & Chandler, 2014, for a review). The wider participant pool and the increase in anonymity offered to participants in online studies can lead to responses that diverge from those obtained from pen-and-paper questionnaires administered to college students in university laboratories and subsequently confound observed trends. Of course, such techniques can go back only as far as the inception of the scales used to study the phenomenon in question and thus cannot be used to infer gender stereotypes in the distant past.
What is needed, then, is a way to measure gender stereotypes over a long period of time in an objective (in that it does not rely on subjective participant estimates) and consistent (in that it uses the same type of data source for both historical and contemporary estimates) manner. Ideally, such a technique should also be able to capture how stereotypes manifest themselves in naturally occurring settings rather than controlled laboratory environments involving explicit survey prompts. The recent availability of large digitized natural language data sets (Griffiths, 2015; Harlow & Oswald, 2016; Jones, 2017; Kosinski & Behrend, 2017) has made such a technique feasible. Researchers can use natural language data to quantify people’s associations between common words, including words used to describe women and men, and words used to describe various human traits. If the language data being analyzed are historical, then it is also possible to measure the associations that people have had in the past, thereby facilitating an analysis of historical gender stereotypes, as well as changes in these stereotypes over time (see Bhatia et al., 2018; Dehghani et al., 2016; Garten et al., 2018; Holtzman et al., 2011, for applications of this idea to uncovering differences in associations across groups; also see Twenge et al., 2012, for a related approach that measures changes in cultural prominence for men and women using word frequencies, rather than word associations, in historical language data).
The purpose of this study was to measure gender associations in historical language data to infer historical gender stereotypes and to assess changes to these stereotypes over time. In order to do so, we build off the recent successes of Caliskan et al. (2017), Bhatia (2017b), and Garg et al. (2018), who demonstrated that word embedding models—powerful new tools in machine learning and artificial intelligence—can predict gender, ethnic, and racial stereotypes in people. Word embeddings utilize the distribution of words in natural language to derive knowledge representations for those words (see Bhatia et al., 2019; Jones et al., 2015; Lenci, 2018, for reviews). These representations take the form of high-dimensional vectors, with words that occur in similar contexts in language being assigned similar vectors. As word co-occurrence in language reflects how words are associated with each other in the minds of individuals, word embedding models implicitly encode people’s associative relations between words.
Although word embeddings have been primarily developed for artificial intelligence applications (e.g., Turney & Pantel, 2010), their ability to capture the structure of association has also made them useful for predicting human semantic judgment, free association, categorization, priming and recall, and associative judgment in a variety of psychological tasks (e.g., Bhatia, 2017a; Landauer & Dumais, 1997; Mandera et al., 2017). Most recently, word embeddings have been used to study associations for social targets. This work has indicated that word embedding models trained on contemporary news media data predict biases revealed through measures such as the implicit association test (Bhatia, 2017b; Caliskan et al., 2017). This approach has also been extended to examine historical gender and ethnic associations (Garg et al., 2018) to show that word embeddings trained on historical language data track occupational and demographic shifts in the U.S. and can even predict responses observed in human participant studies from the 1970s and 1990s.
We build off the methods introduced in this recent work. Crucially, however, our approach departs from this work because it utilizes scales and measures developed and tested by psychologists and quantifies stereotypes through associations with the traits used in these scales. It can thus be seen as providing an analysis of how gender stereotypes, as operationalized in psychological research, have shifted over time. The use of existing scales is necessary in order to interpret the results obtained through the above methods, in terms of established psychological constructs. The use of existing scales in our analysis also ensures that our results can be compared and combined with the rich literature on gender stereotyping in psychology. Indeed, in our Discussion section, we examine how our findings relate to other tests of stereotype change over time (performed using meta-analyses of surveys). Ultimately, large-scale data sets and powerful new techniques for analyzing these data sets offer an unparalleled opportunity for the study of human psychology. But these methods can only advance psychological research if they are integrated with established measures and constructs. Our study illustrates the feasibility of such a cross-disciplinary integration.
Word Embeddings for Modeling Association
Strength of association is an important judgment cue that is used by individuals to form beliefs, attitudes, and preferences across a number of different psychological domains. For example, people use the degree to which a particular trait (e.g., aggressive) is associated with a given social target (e.g., a male or female politician) in their memories as a cue when evaluating the target. Such associative judgments are automatic, intuitive, and quick and are thus often seen to form the basis of harmful stereotypes such as those shown to be at play in gender-based discrimination (see Evans, 2008; Kahneman, 2003; Sloman, 1996; Smith & DeCoster, 2000; Strack & Deutsch, 2004, for reviews).
Although researchers have been studying association-based judgment for many decades, recent research in cognitive science has begun examining ways in which associations (and resulting judgments) can be modeled within computational cognitive systems. The goal in this work is to equip computational models with the underlying memories and knowledge representations necessary to predict associations, and resulting judgments, with a high degree of accuracy (Griffiths et al., 2007; Jones & Mewhort, 2007; Landauer & Dumais, 1997; Mandera et al., 2017). Progress toward this goal has benefited from a well-known insight in linguistics: Natural language use reflects the associations that people have in their minds. Thus, measuring the co-occurrence patterns between words in large-scale language data can help proxy word associations and predict people’s responses and behaviors in a wide range of naturalistic judgment tasks (Firth, 1957; Harris, 1954).
There are many ways to measure and represent co-occurrence relations in language. One technique that has been shown to closely capture human associations involves word embeddings (Mikolov et al., 2013; Pennington et al., 2014; see Bhatia et al., 2019; Jones et al., 2015; Lenci, 2018, for reviews). Word embedding models (also known as word vector models or semantic space models) use co-occurrence relations in large-scale natural language data to derive a latent semantic space, with each word represented as a point (or vector) in the space. In a manner similar to factor analysis for survey responses, dimensions in the semantic space capture the structure of word covariance in language, so that words that are given similar vector representations in the space are words that frequently co-occur in the same contexts and are thus associated in peoples’ minds. Although many different algorithms exist for generating word embeddings, each differing in terms of its technical assumptions and implementation, all of them assign word vectors based on word co-occurrence relations. Figure 1 shows three hypothetical word embedding models that use two-dimensional spaces to represent a number of words. The distances of the points corresponding to words in Panel A predict that man is more associated with aggressive and woman is more associated with affectionate. In Panels B and C, there are no differences between man and woman in associations with affectionate, though man is still more associated with aggressive relative to woman.

Hypothetical embedding spaces with representations for a stereotypically masculine trait (aggressive), a word traditionally used in relation to men (man), a stereotypically feminine trait (affectionate), and a word traditionally used in relation to women (woman).
Note. Distances between these words are indicated using the dashed lines and circled numbers and are used to compute the embedding bias for the trait word in that space. The positions of the words in the space can change over time, resulting in changes to the embedding bias. In Panel A, we depict a hypothetical 1910 space, which has an embedding bias associating aggressive with man and affectionate with woman. In Panels B and C, we depict changes to this space, which generate a reduced bias for affectionate but not aggressive. Note that these changes could be due to either a change in the position of affectionate in the space (as in Panel B) or a change in the position of man and woman in the space (as in Panel C).
Researchers have evaluated the predictive power of word embedding models in a number of different ways. Most commonly, word embeddings are used to predict people’s judgments of the similarities or the relatedness of words. Memory research also uses associations generated by word embeddings to predict priming effects, lexical access, list recall, free association, and semantic memory search (Healey & Kahana, 2016; Hills et al., 2012; Jones et al., 2006; Levy et al., 2015; Mandera et al., 2017; Pereira et al., 2016). In all of these domains, word embeddings have been shown to be good models of human judgment, with the best performing models capturing the majority of the variance in people’s responses. For example, the similarity of the word embeddings for two words (e.g., table and chair) is a good measure of how related people think those words are, as well as how strongly one word can cue the second word in memory.
Most relevant to this study is the application of word embeddings to the study of high-level judgment. Researchers have shown that word embeddings can also be used to model the associative heuristics at play in probability judgment, forecasting, risk perception, and preferential decision making (Bhatia, 2017a, 2019a, 2019b; Bhatia & Stewart, 2018; Bhatia & Walasek, 2019). Thus, for example, the probability that people assign to a particular event (e.g., earthquake) happening in a particular country (e.g., Japan) can be accurately predicted by the proximity between the vectors for the event and the country in word embedding models.
Association is also at play in social judgment. In this context, researchers have shown that word embedding models encode many of the stereotypes and prejudices documented in human participants using the implicit association test (IAT; Bhatia, 2017b; Caliskan et al., 2017). For example, using stimuli from the gender-career IAT, Bhatia (2017b) finds that the vectors for names traditionally given to men (e.g., John) are closer to the vectors for career-related words (e.g., office) than are vectors for names traditionally given to women (e.g., Julia). In contrast, these names are closer to the vectors for family-related words (e.g., children). For this reason, word embedding models are able to predict aggregate scores on many IAT tasks (Caliskan et al., 2017). In fact, the properties of word embedding models that are necessary to represent social information are also responsible for social biases (Bhatia, 2017b), with word embedding models that are best able to encode social categories being the models with the strongest stereotypes and prejudices.
It is useful to note that the word embedding models used in the above tests are trained on contemporary English language data. For example, Bhatia (2017b) used contemporary newspapers (e.g., the New York Times) in his analysis, whereas Caliskan et al. (2017) used a combination of Wikipedia data and newspapers. This is precisely why these models are able to predict the responses of people living in contemporary U.S. However, the fact that language data implicitly contain the associations of the people who generate and read that data implies that training embedding models on different types of language data can allow us to infer the associations that would be possessed by groups of people differentially exposed to—or responsible for producing—that data. Drawing on this insight, recent applications of word embedding models have attempted to study differences in social, political, and moral associations pertaining to media bias and political ideology. For example, Bhatia et al. (2018) used word embeddings derived from different media sources to examine the differences in the underlying associations that people had for Hillary Clinton and Donald Trump leading up to the 2016 U.S. election. Holtzman et al. (2011) and Li et al. (2017) performed a similar analysis to examine ideological differences across various media sources and presidential candidates, respectively. Hopkins (2018) used this method to study how political framing effects of health care policies influence public perceptions of those policies.
The studies cited in the prior paragraph examined differences in associations in different types of language data produced and consumed by different groups of individuals at the same point in time. A similar approach can be used to examine differences in associations in language data produced and consumed by a group of individuals across time. To our knowledge, the only study that has used such an approach to examine social judgment is by Garg et al. (2018), where the authors trained word embeddings on historical language data and used changes in the resulting word associations across time to infer changes in stereotypes in the U.S. over time. This is a particularly powerful idea, as this method allows us to infer the stereotypes and, more generally, associations of subject populations that we could no longer explicitly survey. It also provides a method of tracking changes in attitudes and associations over time, which is not vulnerable to many of the other issues involved in survey research (discussed in more detail above). However, one limitation of Garg et al.’s analysis is the fact that they did not use established psychological scales to test for associative bias. In order for novel techniques from data science and machine learning to contribute to psychology, they need to develop from established scales and measures used by psychologists. This ensures that the conclusions of modern data science research are interpretable in terms of the constructs and empirical findings of extant research.
Studying Changes to Stereotypes With Word Embeddings
We use word embeddings to study changes to gender associations over time, building off the methods introduced by Garg et al. (2018). Crucially, however, our approach departs from this work as it utilizes scales and measures used in psychological research on gender stereotyping and quantifies stereotypes through associations with the traits used in these scales. It can thus be seen as providing an analysis of how gender stereotypes, as operationalized in psychological research, have shifted over time.
We now formally outline our hypotheses derived from the literature reviewed earlier in this article. Specifically, we presented abundant evidence documenting stereotype change (Diekman & Eagly, 2000; Donnelly & Twenge, 2017; Eagly et al., 2019; Twenge, 1997, but also see Haines et al., 2016). Based on this research, our overall prediction was that although gender-based stereotypes still persist, we would observe them to be changing over the course of the past century.
What is perhaps more interesting, however, is the nature of this change. As reviewed earlier, social role theory (Eagly & Wood, 2012; Koenig & Eagly, 2014) posits that as women and men’s observed roles change (e.g., due to the increasing presence of women in the professional sphere or increasing numbers of women choosing to remain childless), stereotypes regarding women and men should also update. We also know that there has been significantly more change in terms of roles occupied by women in society compared to those occupied by men (U.S. Department of Labor, 2018). Based on these findings, we would expect there to be changes to gender stereotypes regarding both feminine and masculine traits. That is, if women are now more represented in roles outside the home, both the femininity and the masculinity of the “typical woman” should update. Note that this proposition of social role theory already has support in prior empirical work. For example, consistent with this prediction, both women’s self-assessment of masculinity (Twenge, 1997) and observers’ assessment of their masculinity, measured in terms of competence, have increased over time (Eagly et al., 2019). Parallel to this, Donnelly and Twenge (2017) show that women’s endorsement of feminine traits has decreased over time.
In this study, we tested this prediction using word embedding models trained on historical natural language data. Before proceeding, we would like to highlight an important limitation of our method. Changes in word embedding representations for men or women could be due to changes in language structure that are not explicitly gender related. For example, a stereotypically feminine trait (e.g., affectionate) may become less likely to be used alongside words depicting women (e.g., woman) not because of a change in stereotypes for women but because of other changes in language structure that make pronouns less likely to be used alongside trait words. To avoid this problem, measurements of stereotype change using word embedding methods examine relative changes in word association for men relative to women (see Garg et al., 2018). Thus, to rigorously test changes in stereotypes, we need to contrast the association of a target trait with words depicting women (e.g., association between affectionate and woman), with the association of the trait and words depicting men (e.g., association between affectionate and man). See Figure 1 for an illustration.
This feature of word embedding models of language implies that testable predictions need to be relative. In other words, we cannot test predictions that certain traits have changed for women but not for men, as is done in prior survey-based empirical work (e.g., Twenge, 1997). In this light, our predictions based on prior empirical findings as well as social role theory are as follows: We would observe changes to stereotypes in our data as a result of changing association of both feminine and masculine traits for women relative to men.
Method
Historical Word Embeddings
Our entire analysis is preregistered and publicly available at https://osf.io/ 2 jp 4 k. The raw vector data used in this analysis are publicly available at http://snap.stanford.edu/historical_embeddings. The code for extracting the vectors, the processed vector data with embedding biases for traits, and the code for our statistical tests are available as an online supplement.
As we explain in our preregistration plan, we adopted both Garg et al.’s (2018) data set and their methods for quantifying stereotypes. Thus, we tested for changing gender stereotypes on word embeddings trained using two complementary algorithms: the continuous bag-of-words (CBOW) and skip-gram algorithms of Mikolov et al. (2013). This approach relies on a neural network that, for the CBOW algorithm, attempts to predict words using other words in immediate context of the target word (typically a 5- or 10-word window around the target word), and for the skip-gram algorithm, attempts to the do the inverse of this, that is, predict the target word from surrounding words. CBOW and skip-gram are complementary techniques that make up for each other’s limitations. In attempting to predict words and contexts in using these techniques, the neural network gradually learns high-dimensional vector representations for the words in the language data. The vector representations are such that words that often co-occur in the same context have similar vectors.
The embeddings in Garg et al. (2018) are trained on the Corpus of Historical American English (COHA), the largest structured corpus of historical English in the U.S. COHA contains over 400 million words of text from the 1800s to the present time period. This text is genre-balanced across decades (so that each decade contains a roughly equal proportion of fiction, news media, spoken, and other type of non-fiction, language data). Garg et al. have released CBOW and skip-gram word embeddings trained on this corpus for each decade between 1900 and 2000. Each word in these decade-specific trained embeddings is specified as a 300-dimensional vector.
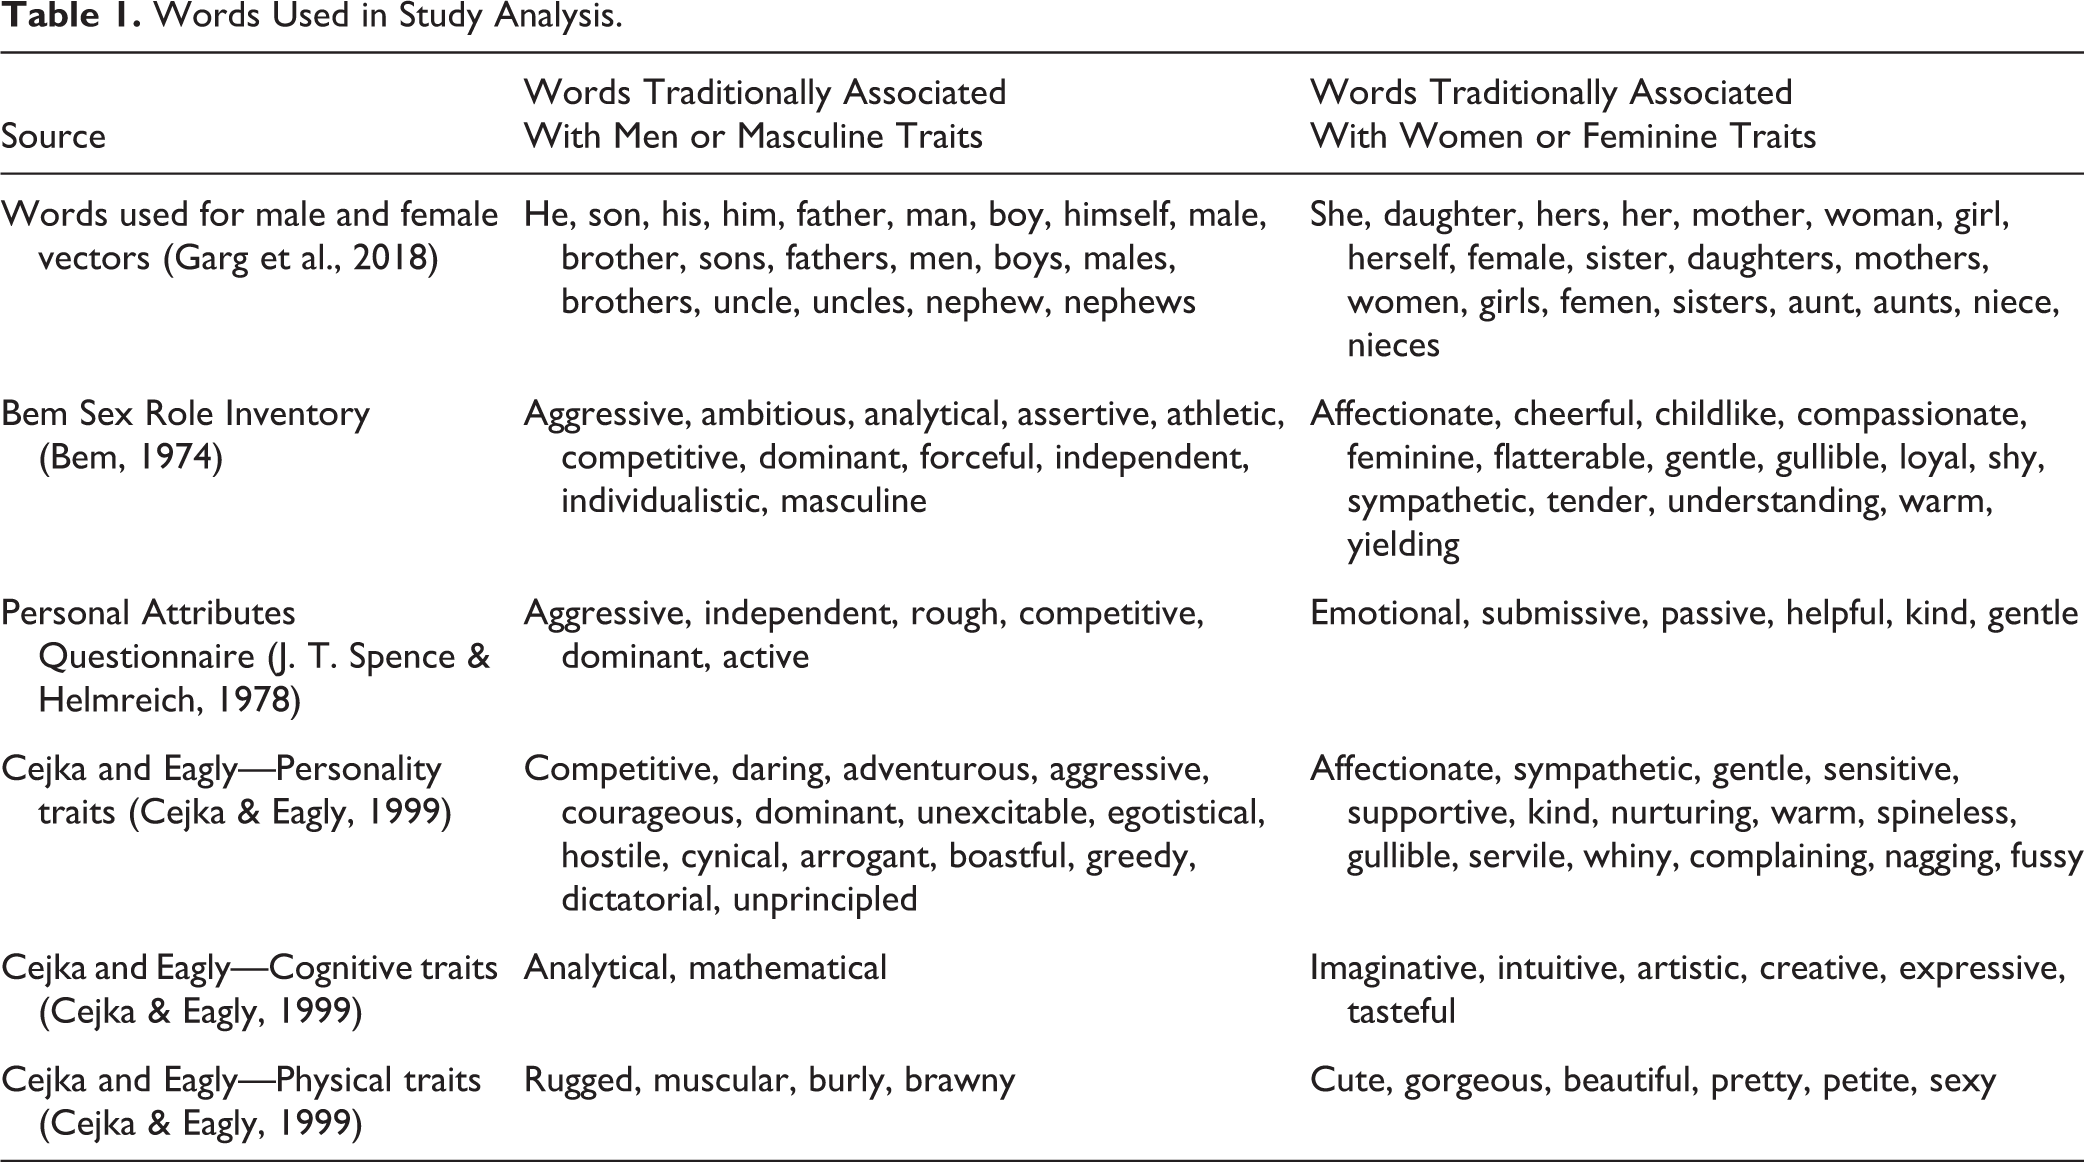
As we discussed earlier, proximity in the word vector space captures the structure of association in human associative judgment (Bhatia, 2017a; Landauer & Dumais, 1997; Mandera et al., 2017), including human social judgment (Bhatia, 2017b; Caliskan et al., 2017). This implies that we can measure associative stereotypes for women and men by examining the relative distances between vectors for words traditionally used in association with women (e.g., her, she, woman, daughter) and words traditionally used in association with men (e.g., he, him, son, man) and vectors for various human traits. Traits whose vectors are disproportionately close to vectors for words associated with men (i.e., traits that are more likely to occur in the same linguistic contexts as these words) can be said to display a male embedding bias. In contrast, traits whose vectors are disproportionately close to vectors for words traditionally used in association with women (i.e., traits that are more likely to occur in the same linguistic contexts as these words) can be said to display a female embedding bias. Changes in associative stereotypes can be quantified by measuring how embedding biases (i.e., how distances in the vector space) vary over time.
Embedding Bias
Again, as specified in our preregistration plan, we also adopted Garg et al.’s (2018) measure of embedding bias. This measure involves taking a set of pronouns and kinship categories traditionally associated with women and men (e.g., he, she, son, daughter) and calculating the average vectors of each of these two sets of words for a given decade, yielding decade-specific male and female vectors (see Table 1). The relative Euclidean distance between the decade-specific male and female vectors and the decade-specific vector for a target trait quantifies the magnitude of the embedding bias for that trait in that decade, with a positive embedding bias corresponding to a stronger association with the male vector in that decade and a negative embedding bias corresponding to a stronger association with the female vector in that decade. We can observe how the embedding bias for the target trait changes as a function of decade to measure its changing associations with men versus women over time.
Words Used in Study Analysis.
More specifically, the algorithm for obtaining such an embedding bias for trait j in decade t is as follows: Obtain vectors for each of the words traditionally associated with men and each of the words traditionally associated with women for decade t. We refer to the vector for the former i as Average the vectors for words associated with men Obtain the vector for trait j in decade t. We refer to this vector as Measure the embedding for trait j in decade t by calculating the difference in Euclidean distance between

Steps 1–4 are repeated for each decade t and each trait j to obtain a decade-specific embedding bias for all traits. A positive value of EBjt corresponds to a stronger association between trait j and the male vector in decade t and indicates that the trait is more associated with men in that decade. A negative value of EB jt corresponds to a stronger association between trait j and the female vector in decade t and indicates that the trait is more associated with women in that decade.
Again, the embedding bias metric uses differences between distances with male and female vectors to avoid confounds having to do with changes in language and culture that are not gender-related. For example, if a given trait became less likely to be used in the context of humans and more likely to be used in the context of inanimate objects, then we would see a drop in its association with words traditionally associated with men, incorrectly suggesting that the trait has become less masculine. It is only by taking the difference in distance between male and female vectors that we can control for these changes.
Figure 1 shows three hypothetical two-dimensional semantic spaces with vector representations for man, woman, aggressive, and affectionate. If man and woman were the only words depicting women and men, we would use the distance from these words to traits like aggressive and affectionate to measure embedding biases for the traits. These spaces would predict that there is a positive embedding bias for aggressive and a negative embedding bias for affectionate in Panel A (i.e., aggressive is more associated with man and affectionate is more associated with woman). In Panels B and C, there is still a positive embedding bias for aggressive, but the embedding bias for affectionate is zero. If the spaces had been built using language data from different decades, we could infer that embedding biases for affectionate changed over time.
Gender Stereotype Scales
Our analysis applied the embedding bias metric to traits from three commonly-used gender stereotype scales and measures in psychology: the BSRI (Bem, 1974), the Personal Attributes Questionnaire (PAQ; J. T. Spence & Helmreich, 1978), and the Cejka and Eagly (CE) gender stereotypical traits scale (Cejka & Eagly, 1999; list obtained from Diekman & Eagly, 2000). Before describing how we calculated the embedding bias in each of these scales, some information about the scales themselves may be useful.
The BSRI is a measure of perceptions of masculinity and femininity. Differently from measures preceding it, the BSRI treats masculinity and femininity as orthogonal constructs. The measure includes 60 personality characteristics and asks participants to assess themselves on a 7-point Likert-type scale ranging from 1 (the personality characteristic is never or almost never true for them) to 7 (the personality characteristic is always or almost always true for them). The BSRI consists of 20 stereotypically feminine traits (e.g., warm, affectionate, compassionate), 20 stereotypically masculine traits (e.g., dominant, independent, assertive), and 20 neutral items (e.g., reliable, moody, jealous). The coefficient αs for the femininity subscale were 0.80 and 0.82, respectively, in the two samples studied, and for the masculinity subscale, it was 0.86 in both samples (Bem, 1974). Test-retest reliability of the scale ranged from 0.76 to 0.94 over a 4-week period (Bem, 1974), which has been replicated in other research spanning a longer time frame (Yanico, 1985). Given the novelty of the proposition that femininity and masculinity are orthogonal constructs, the validity of BSRI has been subject to considerable scrutiny.
The PAQ was developed as a measure of “socially desirable attributes stereotypically considered to differentiate males and females and thus to define the psychological core of masculine and feminine personalities” (J. T. Spence & Helmreich, 1978, p. 3). The 24-item measure contains three subscales: masculinity, femininity, and masculinity-femininity, all of which are measured on a 5-point Likert-type scale with item-specific anchors. For example, for the item “emotional,” the scale ranges from 1 (not at all emotional) to 5 (very emotional), and for the item “independent,” the scale ranges from 1 (not at all independent) to 5 (very independent). Example items from the feminine subscales include “kind” and “devoting oneself to others.” For the masculine subscale, examples include “giving up easily” and “independent.” Finally, examples for the masculine-feminine subscale include “caring about others’ approval” and “excitability in a major crisis.” As with the BSRI, participants are asked to assess themselves on the item. Reliability analyses of the measures have yielded varying results, with Cronbach αs ranging from 0.51 to 0.85 for the masculine and from 0.65 to 0.82 for the feminine subscale (Cota & Fekken, 1988; Heppner, 1995; J. T. Spence & Helmreich, 1978; Yoder et al., 1982). J. T. Spence and Helmreich (1978) reported a reliability of 0.78 for the masculine-feminine subscale.
Our final measure of stereotyping is from Cejka and Eagly’s (1999) work on gender-stereotypic attributions of occupations. Specifically, participants evaluate 56 attributes, organized along six gender-stereotypic dimensions, in terms of how necessary they are for success in certain occupations on a 5-point Likert-type scale (1 = not at all important, 5 = essential). These dimensions, that is, physical, cognitive, and personality, are assessed separately for masculine and feminine versions, thus leading to the six dimensions. Example masculine attribute dimensions include “athletic” for masculine-physical, “mathematical” for masculine-cognitive, and “daring” for masculine-personality. Example female attribute dimensions include “gorgeous” for feminine-physical, “intuitive” for feminine-cognitive, and “sympathetic” for feminine-personality. The attributes were derived from a factor analysis of pretest data, and reliability scores ranged from 0.84 to 0.95 for the six dimensions (Cejka & Eagly, 1999). However, since these attributes were not compiled with the purpose of creating a new scale but rather to test a specific research question, their psychometric properties have not been explored as much as those of the BSRI and PAQ.
We calculated the embedding bias in each decade of the 20th century separately for each trait in each of these three main scales and then evaluated changes in the embedding bias for stereotypically masculine and feminine traits separately for the three scales. As the CE scale has three further subscales pertaining to personality (CE-Per), cognitive (CE-Cog), and physical (CE-Phy) traits, we repeated our analysis separately for each of these subscales. We did this as the subscales decompose the CE scale into specific trait dimensions associated with gender, and an analysis of these associations can provide more nuanced insights regarding changes to gender association over time.
As discussed above, overall, we predicted the embedding bias to persist yet be decreasing over time. We expected this to be due to the changing associations between feminine and masculine traits captured in BSRI, PAQ, and CE and our male and female vectors. Given the CE scale has three subscales, predictions on this scale require further elaboration. We expected to observe the largest shifts to the association between feminine traits and words traditionally associated with men versus women in the personality subscale of CE because past work demonstrates it to be the most associated with social roles (Diekman & Eagly, 2000). We did not expect changes to associations with feminine or masculine traits in the physical subscale since physical characteristics of the two sexes are relatively stable. We were uncertain as to the cognitive subscale, as there is some experimental evidence for changes in gender associations with cognitive traits over time (Diekman & Eagly, 2000) but also evidence suggesting that cognitive traits do not map onto real-world contexts critical to gender roles, such as occupations (Cejka & Eagly, 1999).
For thoroughness, we also attempted this analysis for four commonly-used, gender-based IATs: Career-Family IAT, Power-Weakness IAT, Warm-Cold IAT, and Science-Humanities IAT (obtained from Nosek et al., 2002; Rudman et al., 2001). These tests have frequently been used to study gender stereotypes and prejudice, and although they do not correspond to well-established and validated stereotype scales such as those that are the basis of our main analysis, they nonetheless provide useful insights regarding changes in gender stereotypes over time. We also performed our analysis for various dimensions of person perception (obtained from Goodwin et al., 2014), which are commonly used in the study of social judgment, though not necessarily gender bias. We discuss the method and results for these additional tests in more detail in the supplemental materials. Note that although the stimuli from the IAT captures established stereotypes for women and men, the trait dimensions of person perception do not always map onto gender stereotypes. Nonetheless, examining changes in gender associations for these dimensions is useful for understanding the evolution of gender stereotypes over time.
We also repeated our analysis with an expanded time frame, considering all decades from 1830 to 2010. This was not preregistered but nonetheless is useful for evaluating the robustness of our results. We present the results of this analysis in the supplemental materials.
Results
Aggregate Trends
We began our analysis by considering aggregate trends for the BSRI, PAQ, and CE scales. These trends are displayed at the top of Figure 2. For each scale and for each decade, we calculated the average embedding bias for the stereotypically masculine traits and the average embedding bias for the stereotypically feminine traits and took the difference between the two embedding biases to obtain a single aggregate gender bias metric. More specifically, if TM is the set of stereotypically masculine traits for a scale and TF is the set of stereotypically feminine traits for a scale (and |TM| and |TF| correspond to the size of these sets), then the aggregate gender bias for the scale at time t is given by
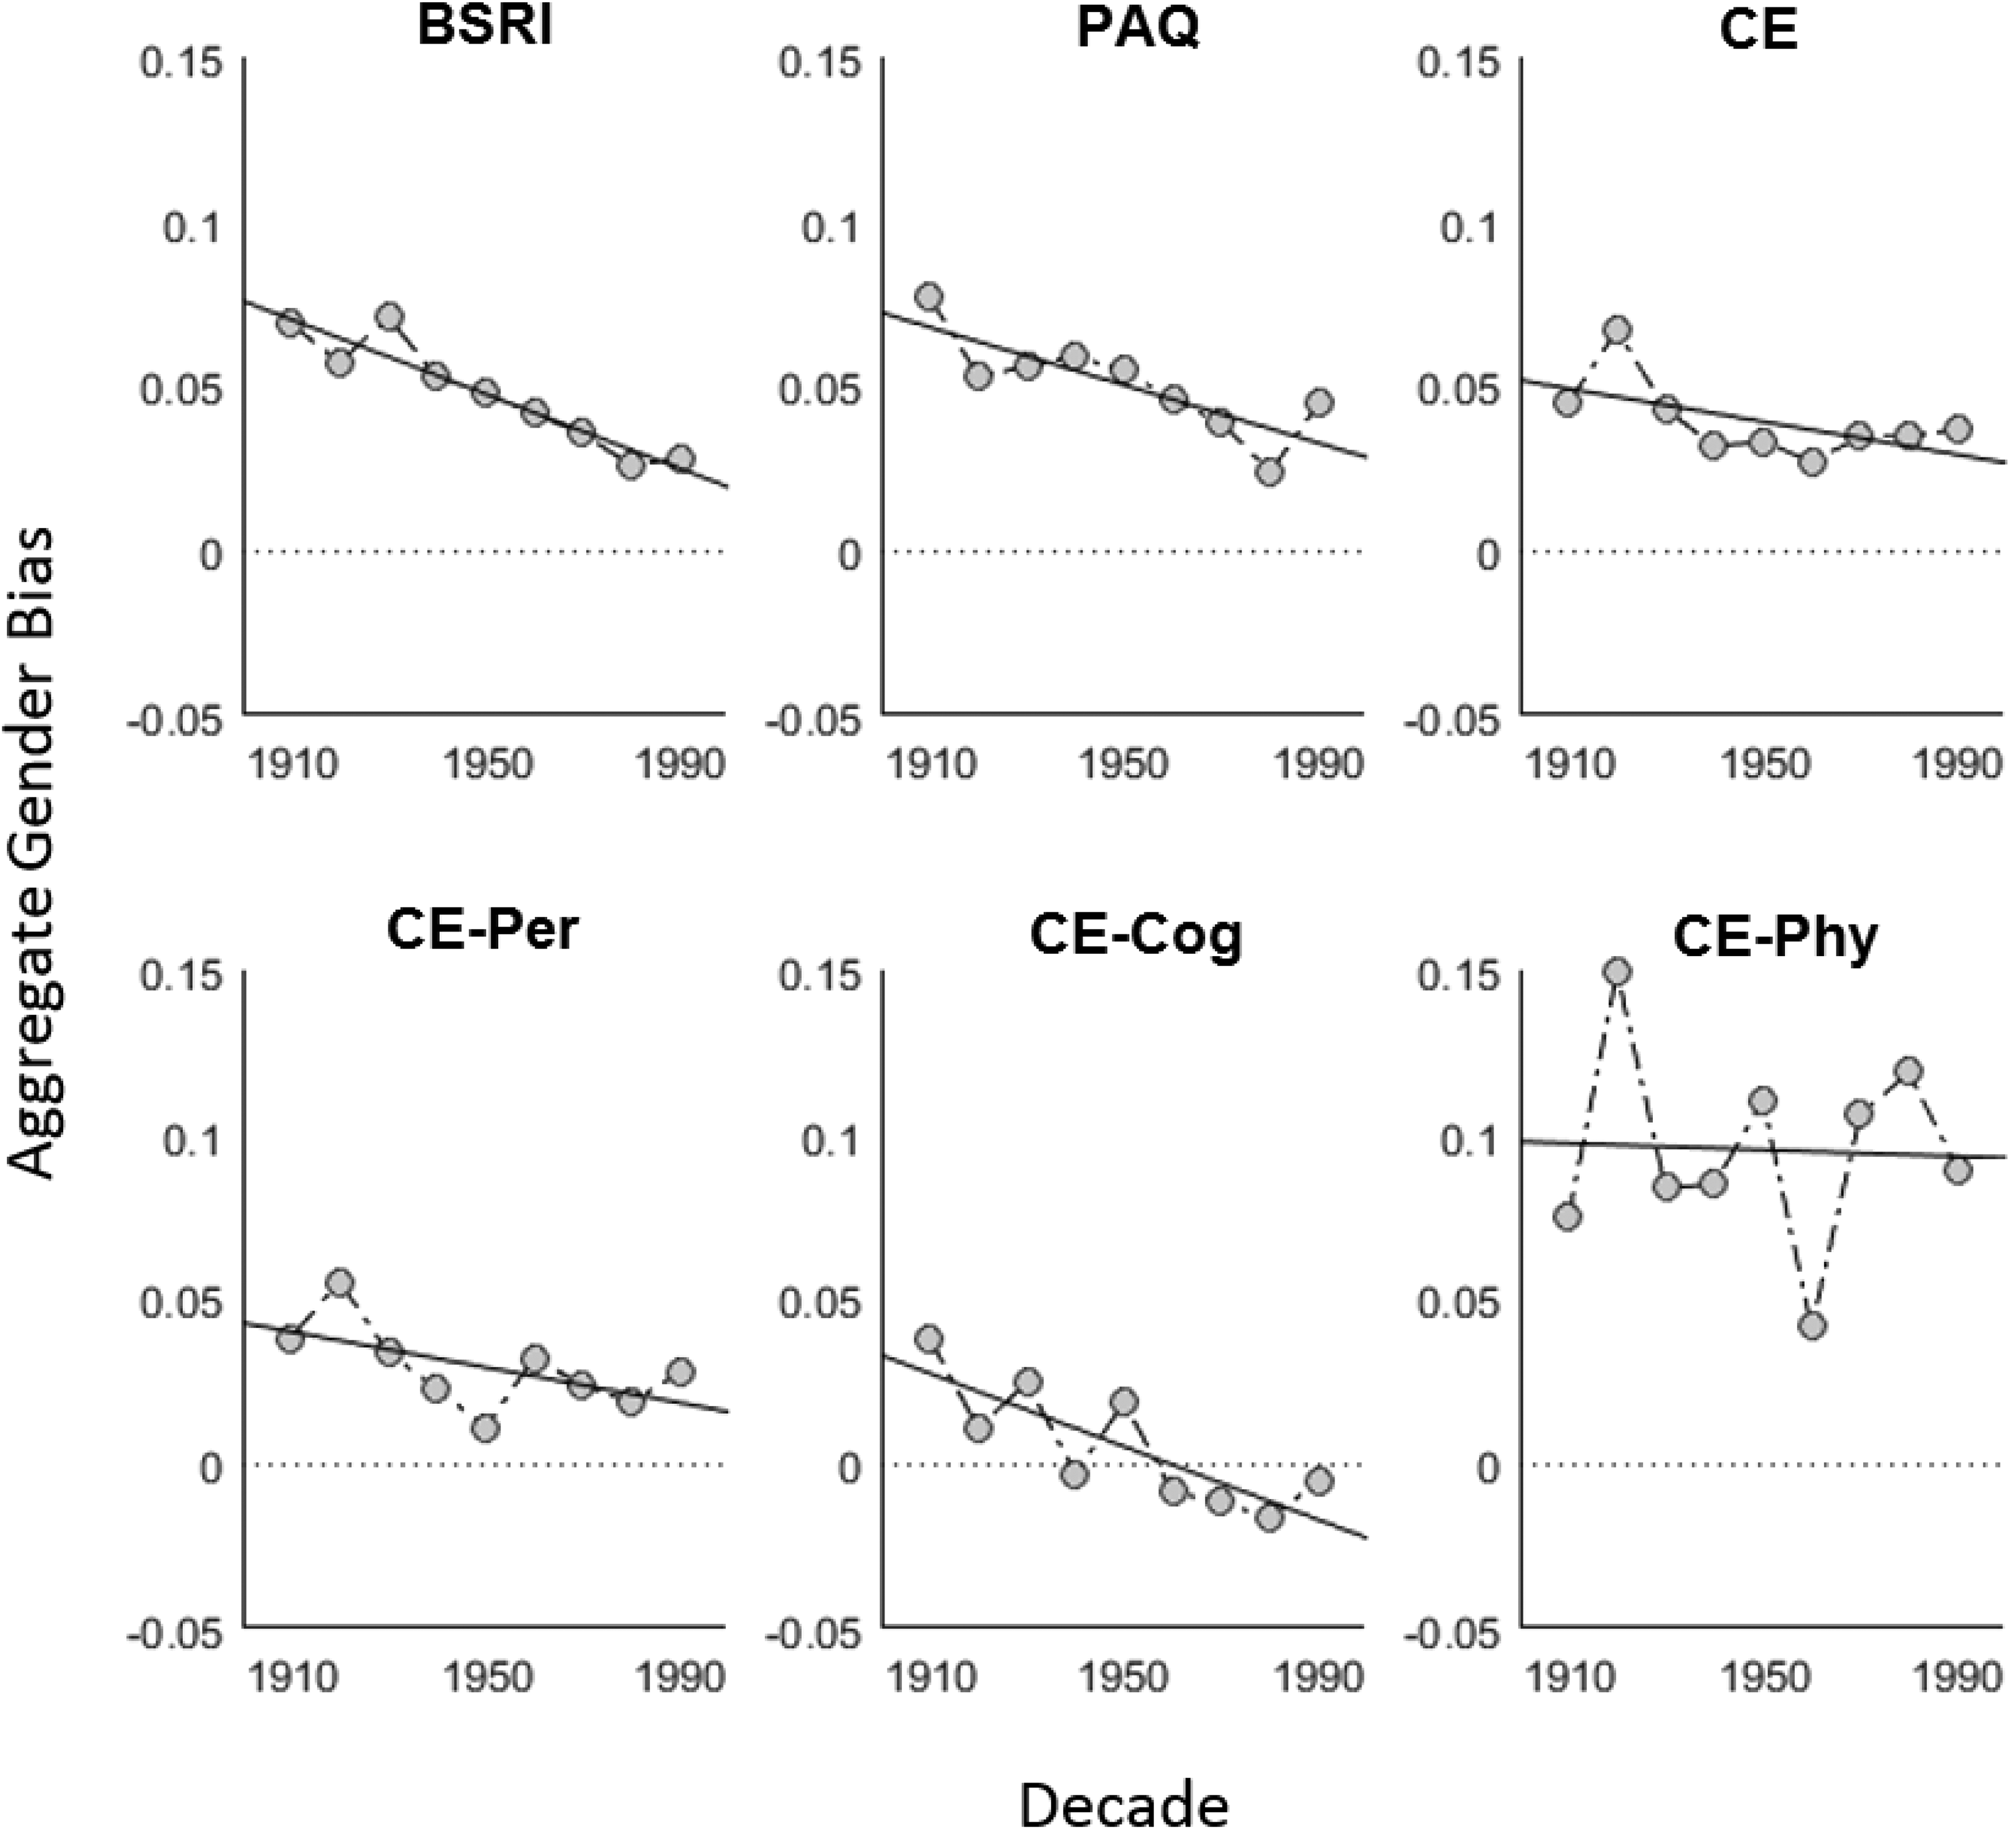
Aggregate time trends for gender stereotype for the Bem Sex Role Inventory, Personal Attributes Questionnaire, the Cejka and Eagly gender stereotypical traits scale (CE), as well as the CE subscales pertaining to personality, cognitive, and physical traits.
Note. The aggregate gender bias metric, shown on the y-axis, corresponds to the difference between the average embedding bias for stereotypically masculine traits and the average embedding bias for stereotypically feminine traits. Positive values on this metric correspond to stereotypes that more strongly associate masculine traits with men (relative to women) than they do feminine traits.
There are two key patterns to note in Figure 2. First, all of the points for the BSRI, PAQ, and CE scales were positive. This shows that there are persistent stereotypes for each of these scales, across decades. Specially, for each of these scales and decades, stereotypically masculine traits had a more positive embedding bias (i.e., were closer to male relative to female vectors) than stereotypically feminine traits. The second key pattern was a negative time trend for the aggregate gender bias for the scales. This shows that these stereotypes are gradually eroding for each of these scales. In other words, the difference in embedding biases for the masculine traits relative to feminine traits is getting smaller (i.e., closer to zero).
We observed some similar patterns for the CE-Per, CE-Phy, and CE-Cog subscales, which are shown at the bottom of Figure 2. Here, again we found persistent stereotypes across decades, although the CE-Cog subscale does not seem to display stereotypes for the most recent decades. Likewise, we found a negative time trend for gender bias for the CE-Cog and CE-Per subscales. This was not the case for the CE-Phy subscale, which appeared to display a persistent gender bias over time.
Time-Independent Biases
The results shown in Figure 2 average the embedding bias for all masculine traits and all feminine traits in each scale we studied in the given decade and thus cannot accommodate trait-level heterogeneity. To allow this type of heterogeneity, and to more rigorously examine these two patterns, we used regression analyses with embedding biases for traits serving as the primary dependent variable. The first set of regression analyses tested whether there were overall biases in the embeddings, independently of the decade in consideration. For these analyses, we considered each trait in each decade as a separate observation and regressed the embedding bias of that trait in that decade on a binary variable corresponding to the gender category of that trait (1 if the trait is part of the set of stereotypically masculine traits in the scale; 0 if it is part of the set of stereotypically feminine traits in the scale). We also included random effects for traits and fixed effects for decade to allow for different traits and different decades to have different overall embedding biases. Prior work has found that results using scales like BSRI are somewhat dependent on the specific set of words used (e.g., J. T. Spence et al., 1975). Formally, this regression model can be written as EB jt = β0 + β1D1 + β2D2…βTDT + βGGj + Rj, where EB jt is the embedding bias for trait j in decade t (as calculated in methods section above), Gj is the gender category of the trait (Gj = 1 if trait is stereotypically masculine 0 otherwise), D1, D2,…DT are decade-level fixed effects (with Dk = 1 if t = k and 0 otherwise), and Rj is a trait-level random effect. A positive effect of gender category on embedding bias (corresponding to a significant positive coefficient of β G in the above regression), despite these controls, indicates that vectors for stereotypically masculine traits have a more positive embedding bias (i.e., are closer to male vectors relative to female vectors) than vectors for stereotypically feminine traits. This would constitute evidence for a time-independent gender bias. Note that a negative effect of gender category on embedding bias, corresponding to a significant negative coefficient of β G in the above regression, would also be evidence for a gender bias, but one that is counter stereotypical. We did not expect to observe this type of bias in our data.
As shown in the outputs of this regression in Table 2, there were significant positive time-independent gender biases for the BSRI (p = .004), PAQ (p < .001), and CE (p = .002) scales. These remained significant after a Bonferroni correction for multiple comparisons, which imposes a significance threshold of .017. We also performed a separate analysis on the CE subscales and observed a significant time-independent gender bias CE-Per (p = .002) and CE-Phy (p = .034). The former remained significant after the Bonferroni correction (with a significance threshold of .017), but the latter did not. We did not observe a gender bias for the CE-Cog scale (p = .512). Thus, the results illustrated in Figure 2 also emerged with more rigorous statistical controls. Overall, there were persistent stereotypes for a number of important scales across decades.
Summary Statistics for Regressions Performed on Gender Stereotype Scales.
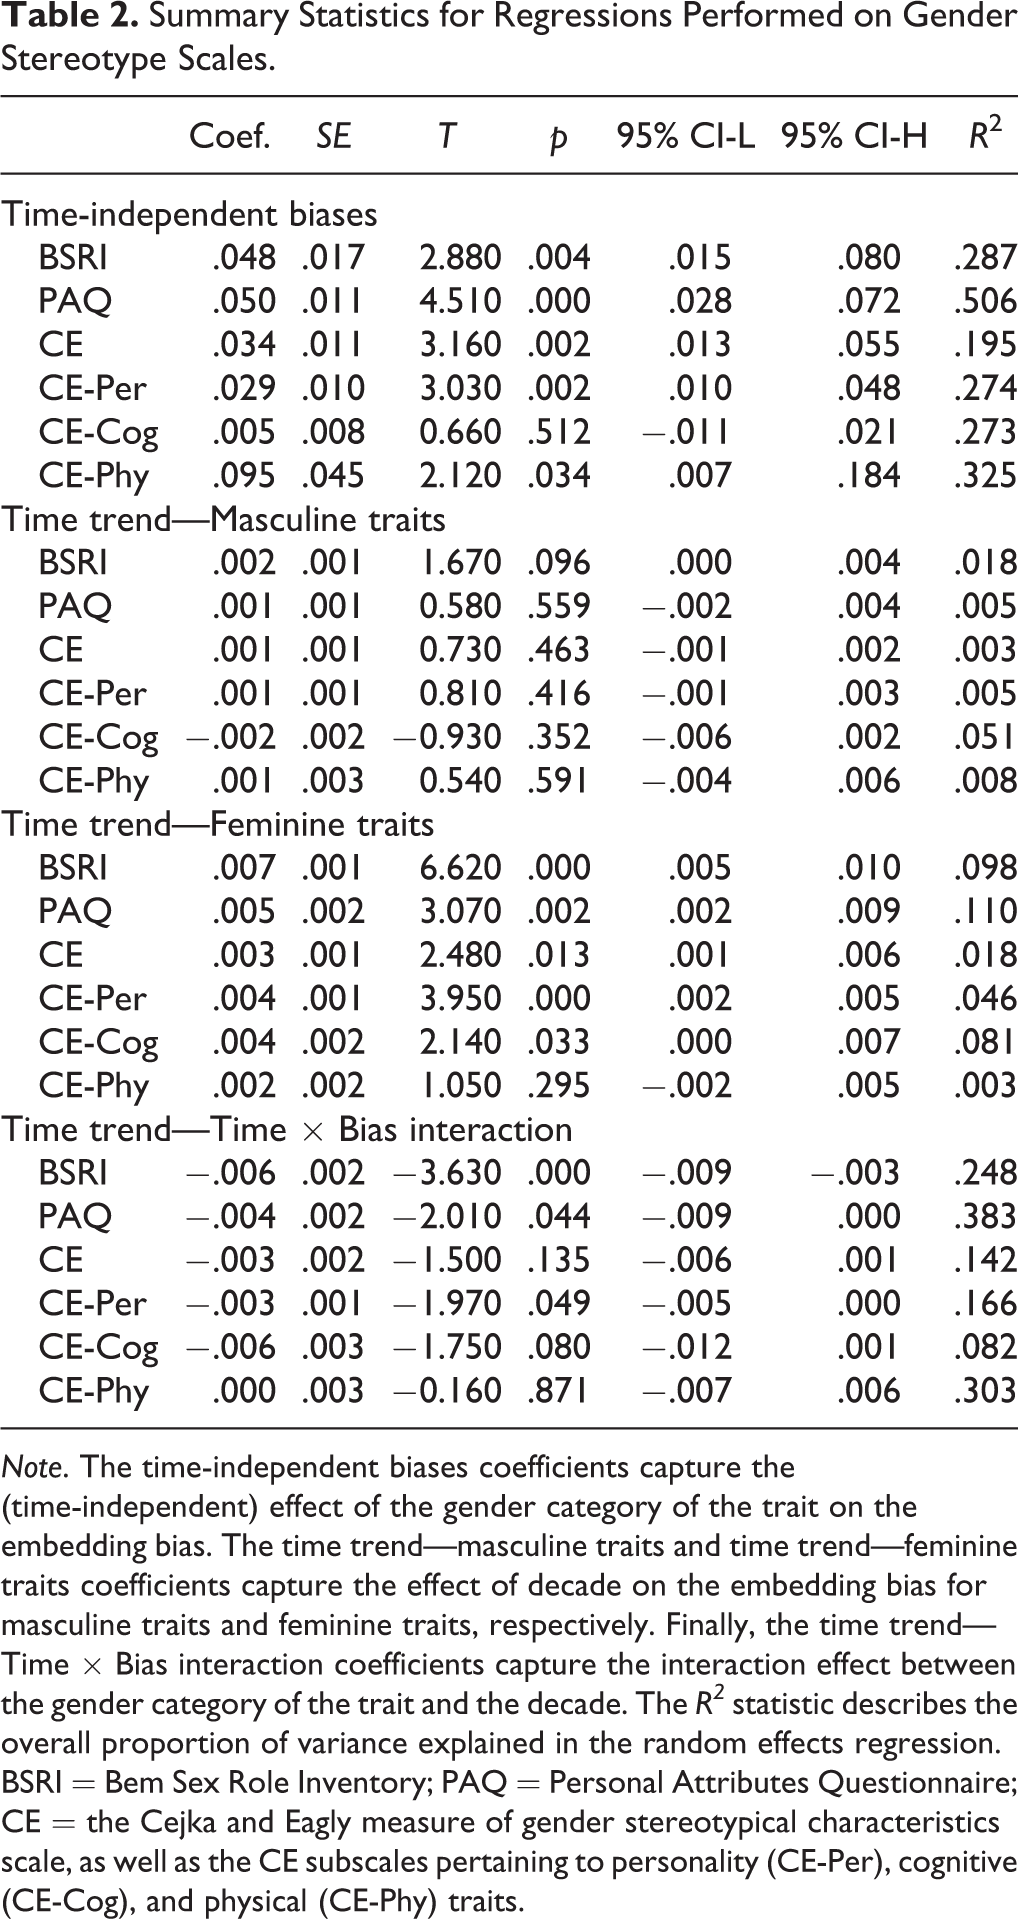
Note. The time-independent biases coefficients capture the (time-independent) effect of the gender category of the trait on the embedding bias. The time trend—masculine traits and time trend—feminine traits coefficients capture the effect of decade on the embedding bias for masculine traits and feminine traits, respectively. Finally, the time trend—Time × Bias interaction coefficients capture the interaction effect between the gender category of the trait and the decade. The R2 statistic describes the overall proportion of variance explained in the random effects regression. BSRI = Bem Sex Role Inventory; PAQ = Personal Attributes Questionnaire; CE = the Cejka and Eagly measure of gender stereotypical characteristics scale, as well as the CE subscales pertaining to personality (CE-Per), cognitive (CE-Cog), and physical (CE-Phy) traits.
Time Trends
Our second set of regression analyses tested whether the embedding biases documented above change over time. For this purpose, we again considered each trait in each decade as a separate observation and regressed the embedding bias of that trait in that decade on a continuous variable ranging from 1 to 9, for the decade. We ran these regressions separately for each of the BSRI, PAQ, and CE scales’ stereotypically masculine traits and stereotypically feminine traits and also permitted random effects on the trait-level, allowing different traits to have different embedding biases, independently of decade. Formally, this regression model can be written as EB jt = β0 + βDDt + Rj, where EB jt is the embedding bias for trait j in decade t, Dt is a continuous variable indicating decade (Dt = 1 if t = 1910s, Dt = 2 if t = 1920s, etc.), and Rj is a trait-level random effect.
The estimated β D coefficients of these regressions for stereotypically masculine traits and stereotypically feminine traits are displayed in Table 2. Table 2 shows that there were no significant time trends for any of the stereotypically masculine traits in the three scales. In contrast, there were time trends for stereotypically feminine traits in all of these scales (pBSRI < .001; pPAQ = .002; pCE = .013). These three remained significant after the Bonferroni correction for multiple comparisons (with a threshold of .017).
We also repeated our analysis for the CE subscales. As above, we found no significant time trends for the masculine traits in the three scales (all p-values > .352). However, once again there were significant time trends for stereotypically feminine traits in the CE-Per and CE-Cog subscales (pCE-Per < .001; pCE-cog = .033), although the CE-Cog did not remain significant after a Bonferroni correction for multiple comparisons (with a threshold of .017). There was no time trend for CE-Phy (p = .295).
For expositional simplicity, Table 2 does not show the intercept (β0 coefficients) for these regressions. These intercepts were negative for feminine traits, corresponding to an embedding bias that more strongly associates feminine traits with words traditionally used in relation to women than words traditionally used in relation to men. As the time trends (β D coefficients) for the feminine traits were significantly positive, these results indicated that the distances between the stereotypically feminine traits and the male versus female vectors diminished as a function of decade. This illustrated a dynamic nature to stereotypes, but one that holds primarily for stereotypically feminine traits.
Despite the null time trend for words traditionally associated with men, the positive trend for words traditionally associated with women suggests that overall gender stereotypes are getting weaker. This can be more rigorously tested using interaction effect regressions, which pool the data for both masculine and feminine traits and capture overall time trends for the stereotypes captured in different scales. Such regressions again consider each trait in each decade as a separate observation and use the embedding bias for the trait in the decade as the dependent variable. The independent variables are the decade (1–9 for the 1910s–1990s), the category of the trait in the scale (1 for stereotypically masculine and 0 for stereotypically feminine), and the interaction between decade and category. Again, this regression permits random effects for traits, thereby allowing for trait-level heterogeneity. Formally, this regression model can be written as EB jt = β0 + βGGj + βDDt + βIGjDt + Rj, where EB jt is the embedding bias for trait j in decade t, Gj is the gender category of the trait (Gj = 1 if trait is stereotypically masculine, 0 otherwise), Dt is a continuous variable indicating decade (Dt = 1 if t = 1910s, Dt = 2 if t = 1920s, etc.), GjDt is the interaction between Gj and Dt, and Rj is a trait-level random effect.
A negative interaction effect, corresponding to a significantly negative value of β I , would indicate that the relative distances between stereotypically masculine traits and male and female vectors and stereotypically feminine traits and male and female vectors are getting smaller. This would correspond to a reduction in gender stereotypes over time. Note that this reduction could be due to changes in associations for feminine traits, changes in associations for masculine traits, or both. However, the results from the time trend regressions outlined above suggested that any observed interaction effect would be due primarily to changes to feminine traits.
As shown in Table 2, we found a significant negative interaction effect for BSRI (p < .001) and PAQ (p = .044), although only the BSRI interaction survived a Bonferroni correction for multiple comparisons (with a threshold of .017). We did not observe an interaction for the main CE scale (p = .135) likely due to the null effect of the CE-Phy subscale (p = .871) and the weak effect of the CE-Cog (p = .080) and CE-Per (p = .049) subscales. The CE-Per subscale did not cross the threshold for significance imposed by the Bonferroni correction (.017). The simple slopes for the interaction effect regressions are shown in Figure 3. These slopes again illustrated the dynamic nature to stereotypes, with stereotypes captured by many different scales getting weaker over time. These slopes also indicated that these stereotypes are changing primarily for feminine traits.

Simple slopes for masculine (dashed lines) and feminine (solid lines) traits in interaction effect regressions for the Bem Sex Role Inventory, Personal Attributes Questionnaire, the Cejka and Eagly gender stereotypical traits scale (CE), as well as the CE subscales pertaining to personality (CE-Per), cognitive (CE-Cog), and physical (CE-Phy) traits.
Additional Tests
Finally, for thoroughness, we also conducted tests using stimuli from a variety of IATs (obtained from Nosek et al., 2002; Rudman et al., 2001) and using a large list of traits with scores on various person perception dimensions (obtained from Goodwin et al., 2014). Detailed results of these tests can be found in Table S1 in our supplemental materials.
Using the first set of regression techniques outlined above, we found time-independent gender biases for the Career-Family IAT (p < .001) and the Power-Weakness IAT (p = .003). These survived a Bonferroni correction for multiple comparisons (with a threshold of .012). We observed no such biases for the Science-Humanities IAT (p = .292) or the Warm-Cold IAT (p = .518).
We also observed a significant time-independent gender bias for Goodwin et al.’s (2014) competence related traits (p = .002), with men being more associated with career, power, and competence and women being more associated with family, weakness, and incompetence. This too remained significant after a Bonferroni correction, which imposes a threshold of .012. We did not find such effects for Goodwin et al.’s warmth (p = .140) or morality (p = .874) traits or for positive/negatively-valenced traits (p = .676).
Using the second set of regression techniques outlined above, we found significant time trends for the Career-Family IAT (p = .006), with the difference in career versus family associations for men versus women diminishing over time. This trend was driven by changes in associations with career words and not family words and survived a Bonferroni correction (with a threshold of .012). There were no significant time trends in the remaining IATs. There were likewise no significant time trends for the Goodwin et al. (2014) trait dimensions.
Additionally, in the preregistration, we specified that our analysis would include only decades from the 20th century. However, the COHA corpus and embeddings released by Garg et al. (2018) extended beyond this time period and covered a period from 1830 to 2010. To establish the robustness of the effects and trends documented in our main text, we thus replicated our analysis on this extended time period. The results are shown in Table S2. As can be seen in this table, we observed significant time-independent gender biases for all our scales except for CE-Cog, which, as in the main text, does not show a gender bias. We also observed a significant Time × Bias interaction, demonstrating a significant time trend for the BSRI, PAQ, CE, and CE-Per scales. These patterns were nearly identical to those documented in the main analysis (Table 2), except that CE did not show a significant time trend effect in the main analysis. The stronger effects documented here are likely the result of a larger data set and thus greater statistical power.
Finally, all the analyses in this article have used the embedding bias metric, which calculates the association of a trait word with male pronouns and categories relative to female pronouns and categories (see Garg et al., 2018). We adopted this metric as it avoids several confounds involving changing language structure (detailed in our Method section). But it may also be interesting to see how trait words have changed with regard to their absolute associations with women and men. We attempted this analysis with feminine traits, as our earlier results show that it is feminine and not masculine traits that see the most stereotype change. For each feminine trait, we separately calculated the association with male pronouns and categories (e.g., he, him, man) and female pronouns and categories (e.g., she, her, woman) for each decade. We then analyzed the aggregate changes in association over time for the traits in each scale.
This analysis revealed inconsistent results across the scales. For the BSRI scale, we found that the change occurred primarily for female vectors in the negative direction (p = .071) and not for male vectors (p = .424). Thus, feminine traits got further from women but did not change their distance to men, implying that they got relatively less distant to men. For the PAQ scale, we found that the change happened in the positive direction for both women and men (p < .01 for both) but was stronger for men. Thus, feminine traits got closer to both male and female vectors but got relatively closer to men. Finally, for the CE scale, we found that the change happened in the negative direction for both men and women (p < .01 for both) but was stronger for women. Thus, feminine traits got further from both male and female vectors but still got relatively closer to men.
Discussion
In this study, we combined techniques in machine learning and large scale corpus analysis, with established psychological scales and measures, to examine changes in gender stereotypes over the past century. First, we documented robust evidence for gender stereotypes, as operationalized by the BSRI (Bem, 1974), PAQ (J. T. Spence & Helmreich, 1978), and CE (Cejka & Eagly, 1999) scales and as measured by word embeddings trained on decade-level language in the COHA. In line with our predictions, we also found these stereotypes to be shifting. However, diverging from our predictions that this shift would be due to changing associations with both masculine and feminine traits, we found changing associations with only the latter. This finding requires elaboration since we would expect to observe changes to associations with masculine traits over time based on social role theory. As reviewed earlier in this article, if it is the case that women are more represented in traditionally masculine domains, we should also expect dynamism in women’s versus men’s associations with masculine traits over time.
That said, there are existing empirical findings that parallel ours, which depart from this prediction. For example, Twenge (1997) and Donnelly and Twenge (2017), in a meta-analysis of papers implementing the BSRI inventory as well as the PAQ, found that differences between men’s and women’s femininity scores have decreased significantly since the 1970s, with no corresponding changes in masculinity scores. Similarly, the extensive work on backlash, which shows that women still incur penalties for engaging in stereotypically masculine behavior, such as negotiating assertively or displaying overt dominance (Amanatullah & Tinsley, 2013; Williams & Tiedens, 2016), also suggests that women’s entry into masculine domains perhaps has not yet caught up with changing perceptions of how much latitude women have in behaving in a masculine manner. It is also possible that the differential change in associations with feminine versus masculine traits may be explained by the way in which women are represented in non-feminine domains. Specifically, although women’s presence outside the home and in the workforce has increased, women are still underrepresented in more masculine contexts in the workforce, such as managerial and leadership positions (Warner et al., 2018). This may mean that while femininity perceptions may be shifting, masculinity perceptions may have stayed more stagnant. Taken together, our findings, combined with other research also showing a dynamic nature to feminine traits (Donnelly & Twenge, 2017), suggest that women perhaps have more latitude to behave in less stereotypically feminine ways but not necessarily in overtly masculine ways.
Our analysis of the Cejka and Eagly (1999) subscales for personality-related, cognition-related, and physicality-related traits also supported our predictions, such that the largest changes in associations emerged for personality traits, with less robust changes for cognitive traits (which failed to reach statistical significance in some of the regression tests). Additionally, although we found a gender bias for physical traits, it appears that the magnitude of this bias, perhaps unsurprisingly given the stability of women and men’s physical characteristics, does not change over time.
We also attempted a preliminary and speculative analysis in which we analyzed changes in associations with feminine traits separately for male and female words. This analysis is vulnerable to several confounds, such as purely linguistic changes in pronoun usage, which is why prior research (like Garg et al., 2018) has examined relative and not absolute associations. As above, our analysis found that feminine traits were getting relatively further from (and less associated with) women than men but that the reason why this was happening varied across scales. For example, in some cases (e.g., the CE scale), absolute distances were increasing for both male and female words, but the changes were stronger for female words, whereas in other cases (e.g., the PAQ scale), absolute differences were decreasing for both male and female words, but the changes were stronger for male words. We do not know how to interpret these diverging results and worry that some of them may be attributable to purely linguistic change. A further analysis of this issue is an important topic for future work.
Finally, for thoroughness, we examined gender differences on a number of existing IATs and person perception dimensions. Although we found gender biases for the Career-Family IAT, the Power-Weakness IAT, and the competence dimension of person perception (with men being more associated with career-related, power-related, and competence-related words and women being more associated with family-related, weakness-related, and incompetence-related words), we did not observe gender differences on the Warm-Cold and Science-Humanities IAT or on warmth and morality person perception dimensions. These findings deserve elaboration. First, there are important individual differences in previously observed associative biases for existing IATs. For example, Rudman et al. (2001) found that only women (and not men) differentially associate women with warmth. If our historical language data disproportionately reflect the attitudes and perceptions of men (as we discuss below), then we would fail to observe embedding biases for the Warm-Cold IAT or the warmth dimension in Goodwin et al.’s (2014) list. Additionally, unlike the BSRI, PAQ, and CE scales, which consist entirely of words describing stereotypical masculine and feminine traits, the items that make up other dimensions of person perception in Goodwin et al.’s list were not selected for their gender context and are thus unlikely to yield robust embedding biases. Finally, our null effect for the Science-Humanities IAT likely reflects the fact that the humanities words used in this test predominantly refer to academic disciplines that were, and still are, largely dominated by men, such as history and philosophy (Schwitzgebel & Jennings, 2017). With such confounding, it is thus unsurprising that this particular test does not map well onto gender associations.
Implications for Methods
The methods used in this article have the potential to make unique contributions to psychological science. First, although surveys and experiments administered in controlled settings are ideal for a plethora of questions of interest to psychologists, we believe novel techniques developed by data scientists, such as embedding models, are distinctly positioned to study trends in psychological variables over time. Such methods can infer stereotypes as far back as the turn of the century, using representative language data, giving them the type of naturalism and broad applicability critical for the question under investigation, which is not feasible using standard empirical methods. Although embedding models have previously been applied to study stereotypes and biases by computer scientists, we show that they can be combined with established psychological measures and scales to rigorously investigate psychological hypotheses. Additionally, these methods are not limited to the study of gender and can be applied to stereotypes for a number of different types of social categories, including race, nationality, and age. Indeed, as these methods are capable of measuring people’s associations, they can also be applied to the historical study of other associative psychological variables, including those relevant to public policy, marketing, political science, economics, and other applied areas of psychology.
The embeddings methodology can also be applied to other types of data. For example, blog posts and social media can be analyzed to track changes to gender stereotypes in the same way as we have done using the COHA. It would certainly be interesting to compare contexts where people feel less compelled to self-censor, such as social media, to contexts that feature an extensive editorial process, such as news outlets or books, which make up much of the COHA corpus. Social media are also more likely than news media to represent the perspectives of marginalized communities, which are likely underrepresented in the COHA data set.
Blog and social media data can also provide a nuanced perspective on contemporary gender stereotypes. Many important political and social changes in today’s world (e.g., Donald Trump presidency, #MeToo) have to do with gender, and it would be interesting to see whether the trends documented in the 20th century have continued over the past 10 years. It is even possible to make bold predictions about the future with the right type of data. Although it is unfortunate that the COHA corpus does not extend beyond 2009, thus making it difficult to accurately predict when gender differences may cease to exist, a current, comprehensive data set using social media data may be able to address this question. Finally, richer types of data sets would allow us to study non-linear trends in stereotypes over time. Such trends do appear to exist in our data. For example, although there is a time trend for the CE measure in the top right of Figure 2, it does appear to level-off after 1960. Richer data sets, such as data sets obtained from contemporary social media data, would offer the statistical power necessary for rigorously examining these non-linear trends.
Examining social media data would also address another limitation of the current study, which is that we cannot test for differences based on author gender. Although past work on gender stereotypes overwhelmingly finds that these stereotypes do not vary by evaluator sex (Eagly et al., 2019; Ellemers, 2018; Prentice & Carranza, 2002), it is still the case that most of the text analyzed in our study was likely written by men and thus is likely to reflect only the stereotypes held by men. Clearly, a study of gender stereotypes needs to appropriately examine beliefs and attitudes held by women. Future work can use the methods employed in this study to examine contemporary text with regard to language used by women and men. For example, one can track language posted on social media by women and men. Another avenue may be to examine industry-specific text. For example, news articles written by male and female journalists can be analyzed for changing stereotype content. Similarly, it may also be possible to replicate our analysis separately on books written by men and by women, though this may not yet be feasible given the amount of data that is necessary for training accurate word embedding models. Finally, we also want to add that the nature of our analysis still makes our results interesting even if they may be partially driven by the gender of the author. That is because natural language and cognition have a bidirectional relation. As such, we can argue language is both a cause and consequence of gender stereotypes. Even if language becomes less stereotyped as a result of increasing representation of women voices, these changes likely influence readers of these texts, including men and the stereotypes they hold of women (and men). We believe this bidirectional link actually makes natural language a good way to track the dynamic nature of the attitudes and stereotypes held by people.
Another contribution of our article to methodology for studying gender stereotypes involves the question of the referent, that is, whether a given scale measures people’s evaluations of themselves or of other people or groups. Existing scales diverge in this regard, and findings on stereotype change likewise vary based on the referent 1 used in the scale. Specifically, research based on the BSRI and PAQ, which use self-referents, finds evidence of stereotype change over time. However, research based on scales with other-referents yields mixed results. For example, Haines and colleagues (2016) used categories from Deaux and Lewis (1984) and found that stereotypes have not changed much over the past 40 years. Diekman and Eagly (2000), asking participants to estimate change, on the other hand, found that people expect stereotypes to change considerably in the next 50 years. Finally, in a recent meta-analysis of U.S. opinion polls utilizing data from over 30,000 adults, Eagly and colleagues (2019) again found evidence for stereotype change with an other-referent question. These mixed findings also illustrate the difficulty of estimating social trends over time and the sensitivity of research findings to the exact question asked. We believe that the method showcased in this article can offer a novel approach to addressing these issues. Our data are similar to an other-referent question, as the text we used for our analysis is not autobiographical in nature and thus parallels Eagly et al.’s (2019) findings that stereotype change emerges even with other-referents. However, our method lends itself well to examining the question of self versus other referent in more detail. For example, we could measure associations with traits relevant to gender, as we have done in the current study, using self-descriptions in online profiles, such as personal websites or blog posts. This would allow us to test whether women and men describe themselves using gendered traits. We could further explore predictors of gender-stereotypical language. Perhaps women describe themselves in stereotype-congruent ways in domains where masculine traits are valued because they may be aware that their presence in these contexts alone could elicit backlash (Amanatullah & Morris, 2010). In this way, self-description along feminine traits can offer a hedging strategy (Carli, 1990).
Practice Implications
Stereotype-based expectations influence the behavior of targets of stereotyping, leading to considerable impact on life outcomes across a variety of domains. That being said, there is also ample evidence that gender stereotypes are changing, especially for women. The findings of this study also offer a cautiously optimistic view on gender stereotypes, documenting their dynamic nature, especially in terms of associations with feminine traits, over the course of the past century. The cautious implication of our findings, combined with other work showing a similarly dynamic nature to women’s associations with feminine traits (Donnely & Twenge, 2017), is that women may have more latitude to behave in less feminine ways, though the reverse for associations with masculine traits is not true. Although this may be disappointing to some as higher tolerance for women’s masculinity should make it easier for women to succeed in traditionally masculine domains, we take an optimistic view of our findings. For example, expectations of traditionally feminine, other-oriented behavior, such as being asked to perform non-promotable tasks, has also held back women’s ascent at work (Babcock et al., 2017). A reduction in such expectations can potentially provide women with mental and logistical resources to expand their presence in various domains of life.
Ultimately, capturing changing stereotypes in a manner that is naturalistic and widely-applicable is critical because stereotypes are not just “pictures in our heads” (Lippmann, 1922); they translate into role expectations that can influence behavior and, subsequently, outcomes in many domains of life. For example, stereotype threat has been shown to negatively influence academic achievement of women in domains where women have traditionally underperformed compared to men, such as math (S. J. Spencer et al., 1999). Moreover, gender-based role incongruence has been argued to impede women’s ascension to leadership roles (Eagly & Karau, 2002) as the masculine behaviors required to rise to these positions elicit backlash when exhibited by women. Similar outcomes have been observed for women who negotiate assertively as well (Amanatullah & Morris, 2010; Bowles et al., 2007). If stereotypes inform expectations, which can subsequently have an impact on important life outcomes, it becomes crucial to track stereotype change in the most realistic and accurate manner. We believe methods such as those used in the current research have the power to track stereotype change in a manner suited to its dynamic nature.
Conclusion
People’s beliefs, attitudes, and perceptions are continually changing. These changes are reflected in the associative structure of language. In this article, we showcase the power of word embedding-based computational techniques, which derive representations for natural objects and concepts using linguistic associations, for capturing changes in associative gender stereotypes over long periods of time. Although there is considerable enthusiasm currently for using word embeddings and other big data methods in psychological science (Griffiths, 2015; Harlow & Oswald, 2016; Jones, 2017; Kosinski & Behrend, 2017), it is our opinion that in order for these methods to truly extend our field, they need to build on prior work not only in terms of the research questions they ask but also in terms of the measures that they use. Our method of analyzing word embeddings with well-known gender stereotype scales illustrates this integrative approach, and we look forward to research that combines new computational methods and data sources with established psychological measures and scales, to provide a quantitative historical analysis of core psychological variables.
Footnotes
Acknowledgment
The authors thank Amnah Ameen for useful feedback on this article.
Declaration of Conflicting Interests
The author(s) declared no potential conflicts of interest with respect to the research, authorship, and/or publication of this article.
Funding
The author(s) disclosed receipt of the following financial support for the research, authorship, and/or publication of this article: Funding for Sudeep Bhatia was received from the National Science Foundation grant SES-1626825.
Note
References
Supplementary Material
Please find the following supplemental material available below.
For Open Access articles published under a Creative Commons License, all supplemental material carries the same license as the article it is associated with.
For non-Open Access articles published, all supplemental material carries a non-exclusive license, and permission requests for re-use of supplemental material or any part of supplemental material shall be sent directly to the copyright owner as specified in the copyright notice associated with the article.