
Abstract
This article focuses on the problem of population aging in the municipality of Bela Palanka typical for the most prominent demographic problems in the territory of the Republic of Serbia and characteristically marked by an unfavorable age structure. The authors tried to determine both spatial and temporal dimensions of the population aging process of the aforementioned municipality.
Introduction
The last decades of the twentieth century and the beginning of the twenty-first century have revealed the signs of conspicuous changes in the world population. The changes in the population age structure and the process of demographic aging are recognized as one of the major problems to challenge the world population in the twenty-first century. This issue has become the sphere of interest of numerous scientists and researchers of different expertise: economists, sociologists, gerontologists, demographers, and geographers. 1 This is the reason why each science defines the process of aging in its own, scientifically justified way. Gerontology recognizes chronological and biological aging. 2 Geographers and demographers define the process of aging in a certain territory as an increase in the percentage of older population, an increase in average population age, the aging index, and so on. It is a fact, as agreed by all the scientists and researchers, that the problem of population aging is a challenge that the entire contemporary society will be confronted with, without any exception. The problems caused by this phenomenon have been detected in almost all countries, regardless of their location or degree of economic development. Yet, the implications of population aging cannot be dealt with instantly or on an ad hoc basis. They require a serious analysis and a long period of research and detection. This fact justifies the need for a scientific treatment of this phenomenon.
The second half of the twentieth century and the early twenty-first century brought significant demographic changes to the Republic of Serbia. The analysis of the data of the 1961 to 2011 censuses reveals that such changes had a negative trend. The entire period is marked by a population decline, population aging, and negative natural population growth. A cumulative effect of all demographic changes pushed the Republic of Serbia to the position of a country with the oldest population in Europe, bringing forth the fact that its population is in the final phase of demographic transition. The population aging was additionally intensified during the last two decades of the twentieth century and the first decade of the twenty-first century. 3 It was recorded that the process of aging was simultaneously taking place in both directions, namely, both from the top of the age pyramid downward (involving an increase of the number of elderly people and extension of the expected life span) and from the pyramid’s base upward (involving a decline of the young population due to the negative population growth). Aside from purely temporal dimension, the process of population aging in the Republic of Serbia also has a pronounced spatial dimension. From the regional point of view, the process of aging is the most intense in eastern Serbia. The municipalities of this geographical region are marked by a considerable percentage of older population aged sixty-five and over. 4 Such age structure has created a series of demographic, economic, and social problems. In this context, the municipality of Bela Palanka especially stands out. Hence, the main objective of this article was to determine the current level of population aging in the territory of the municipality of Bela Palanka.
Territorial Framework of the Research
The Republic of Serbia is located in the central part of the Balkan Peninsula, spreading over 88,361 square kilometer. According to the 2011 Census, Serbia has 7,186,862 inhabitants. From the regional and geographic point of view, the Republic of Serbia is divided into northern, central, southern, western, and eastern Serbia. Pursuant to the 2007 Law on Territorial Organization of the Republic of Serbia, 5 it is divided into 150 municipalities, 23 cities, and the city of Belgrade territory.
The municipality of Bela Palanka, as a territorial framework of this research, is located in the southeastern part of Serbia. Geographically, it spreads over the area of central Ponišavlje in eastern Serbia (Figure 1). It represents a clearly defined administrative area comprising 517 square kilometer. The spatial plan of the Republic of Serbia defines this municipality as part of the functional area of the Pirot District. Aside from Bela Palanka, the Pirot District encompasses the municipalities of Dimitrovgrad, Pirot, and Babušnica. This municipality is characterized by a very specific and complex geographical position. Its territory spreads over several microregional entities. A pronouncedly dispersed layout of settlements is a result of former and recent colonizing and settling processes of this area. The complex settlement processes triggered the formation of a network of settlements spreading over the hypsometric zone between 200 and 750 meters above sea level. The settlements of the municipality of Bela Palanka are very diverse in terms of their morphological and physiognomic characteristics with the prevalence of nucleated, partially nucleated, and dispersed settlements with a higher or smaller number of districts. The settlements in the northern part of the municipality (Miranovac, Vitanovac, Gornji and Donji Rinj, Babin Kal and Gornja, and Donja Glama) are perched on the hillsides of Svrljig Mountains. The settlements in the southwestern part of the municipality (Veta, Glogovac, Toponica, Kosmovac, etc.) are located in the limestone arch of the Crvena Reka, whereas its settlements in the southern and southeastern parts are dispersed in the northern part of the Koritnik Valley as well as on the hillsides of Suva Planina and Šljivovica Peak. 6

Geographical position of settlements in the municipality of Bela Palanka.
Materials and Methods
The beginning of the research was conditioned by the formation of a wide base of quantitative data on the population age structure. The secondary sources used in the research involved the data from the publications of the Statistical Office of the Republic of Serbia. 7–10
In the process of drawing the map of Bela Palanka, the authors used geographical and topographical maps, 11–14 as well as the data obtained from Real Estate Cadastre of the municipality of Bela Palanka which were processed by the computer programs Adobe Illustrator CS3 and Photoshop CS3.
The methodological apparatus included the basic methods used in social sciences and humanities: the analytic–synthetic method, the method of statistical analysis, and comparative method. Another employed method, although specific and rarely used, is the method of scientific field observation. The research included forty-six settlements, involving one town (Bela Palanka), and forty-five villages. The following settlements were visited: Vrgudinac, Dolac, Krupac, Mokra, and Divljana. By observing the social conditions of the mentioned settlements, it was found that they were in a very bad condition regarding revitalization prospects (deserted cultural centers, dysfunctional health centers, a doctor visiting the villages once a week, road and water infrastructure neglected or inexistent, etc.).
A statistical analysis was carried out around three temporal cross sections, using the data on the population age structure based on the censuses from 1961, 1991, and 2011. The basic research hypothesis which was proposed assumed that an intense aging process took place in all municipal settlements. Aside from the main hypothesis, the research also rests on an additional hypothesis. The aim of the additional hypothesis was to examine the effects of the spatial characteristics of the settlements on the population aging process. Actually, it was assumed that the population in the settlements located at a higher sea level is older than the population living in the settlements in the lower hypsometric area.
The core of the research was based on the use of the statistical method developed by Penev. 15 The scientific value of this method has been confirmed by its widespread use by the authors involved in the study of population aging in the municipalities of eastern Serbia. 16 According to the mentioned technique (method), a stage of demographic age was determined for each and every settlement of the researched territory. The method implies the calculations of the share of different age contingents in the total settlement population, calculations of the aging index, and of the average population age (Table 1). Using critical values, the population of each settlement can be classified under one of seven stages of demographic age.
The Criteria for Determining the Stage of Demographic Age.
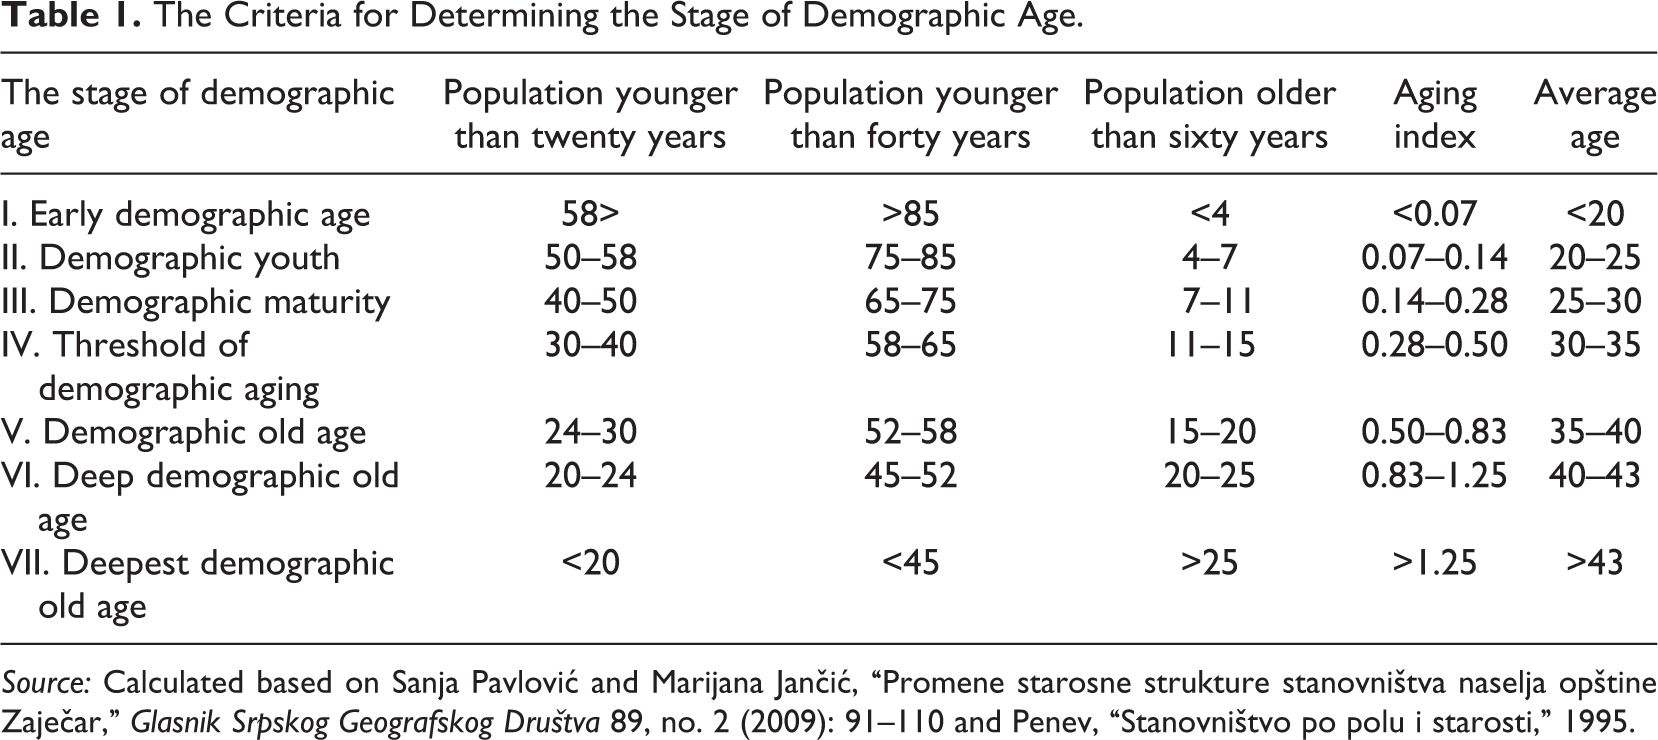
Source: Calculated based on Sanja Pavlović and Marijana Jančić, “Promene starosne strukture stanovništva naselja opštine Zaječar,” Glasnik Srpskog Geografskog Društva 89, no. 2 (2009): 91–110 and Penev, “Stanovništvo po polu i starosti,” 1995.
Changes in Population Age Structure
At the turn of the twenty-first century, the municipality of Bela Palanka was affected by an excruciating process of demographic changes. The said changes were a result of numerous factors, both direct and indirect. Depopulation and the population aging are demographic changes recognized as the biggest threat to the demographic and economic development not only in this area but also in other parts of Serbia. 17 From 1961 to 2011, the number of inhabitants of the municipality of Bela Palanka was in a constant decline. This period brought about a population decline of 12,856 people, which exceeds 50 percent (Table 2). However, great differences are perceived in the population trends in urban and village areas. In 1991, the number of inhabitants in the urban core of Bela Palanka was almost doubled in comparison to the number registered in 1961, while all the other settlements had a huge population decline. The 1991 to 2011 period is marked by a slight population decline in the very center of the town, whereas an intense depopulation process continued in the villages.
Population Trends in the Municipality of Bela Palanka in the Period 1961 to 2011.
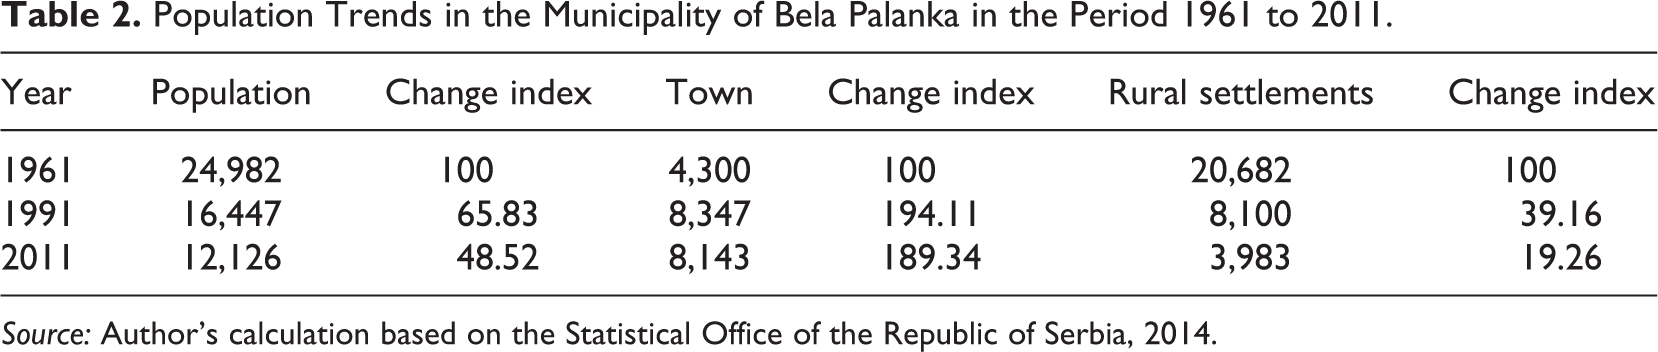
Source: Author’s calculation based on the Statistical Office of the Republic of Serbia, 2014.
The 1961 census points to the fact that the population of the observed area showed the characteristics of the stationary type, whereas the latter census intervals showed the characteristics of an extremely regressive type. The percentage of the young population is constantly declining. The 1961 Census showed that the percentage of the school-age population contingents (up to fifteen years of age) amounted to 26.44 percent. Due to the decline in the population growth and population migration this contingent dropped to 15.97 percent in 1991, while in 2011 it came down to 12.15 percent. Simultaneously, the percentage of older population kept increasing from 8.14 percent recorded in 1961 to 21.24 percent in 1991, while the latest census shows 25.12 percent.
The analysis of the percentage of different age-groups reveals certain anomalies. The overall changes of the youngest age contingents point to the huge differences between the inhabitants of urban and rural areas. During the observed period, the youngest population of the urban core decreased by 174 inhabitants, whereas the total decline of the same age contingent living in rural settlements reached 4,959. However, the relative share portion of this age contingent points to somewhat different trends and to an almost equal decrease of both urban and rural populations. The share portion of this population group in the urban core was 31.05 percent in 1961, while in 2011 it dropped to 14.26 percent. During the same period, the share portion of the youngest population in village settlements decreased from 25.49 percent to 7.83 percent (Table 3). The most endangered villages are Babin Kal, Crnče, Donja Glama, Donji Rinj, Draževo, Gornji Rinj, Gradište, Klenje, Kozja, Kremenica, Leskovik, Miranovac, Miranovačka Kula, Novo Selo, Oreovac, Pajež, Špaj, Toponica, and Vitanovac, which are left with no resident younger than twenty years of age. These are the rural settlements located in the higher hypsometric belts.
The Age Structure of the Population at the Municipal Level in the Period 1961 to 2011.
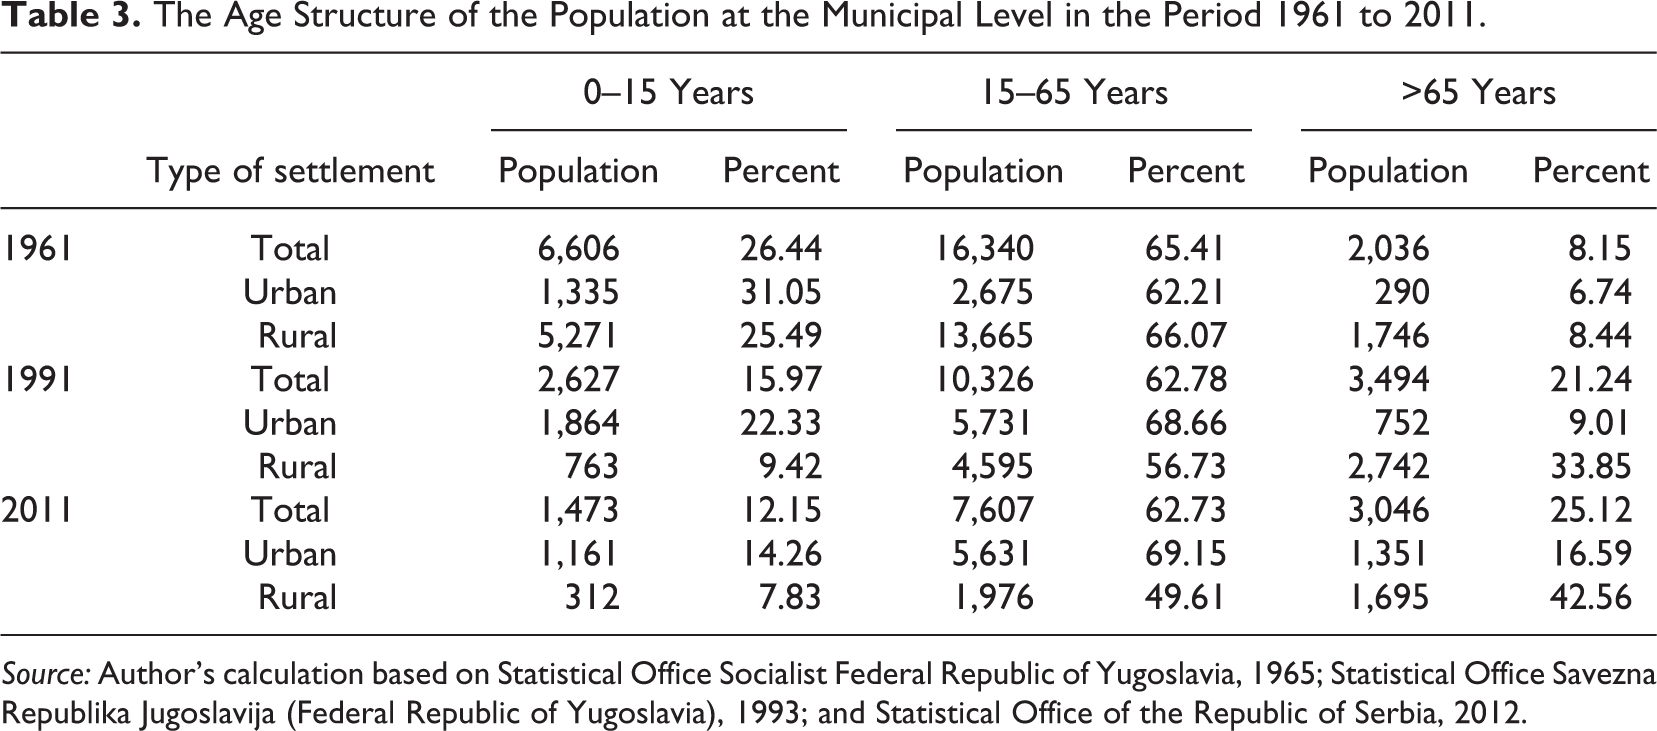
Source: Author’s calculation based on Statistical Office Socialist Federal Republic of Yugoslavia, 1965; Statistical Office Savezna Republika Jugoslavija (Federal Republic of Yugoslavia), 1993; and Statistical Office of the Republic of Serbia, 2012.
The share portion of the elderly population is in constant growth. The biggest changes are recorded in the villages where the percentage of elderly population varied from slightly over 8 percent in 1961 to 42 percent recorded in the latest census.
In order to get a full picture of the population aging process at the municipal level, it is necessary to determine some characteristics of the population. This led to the calculations of the aging index and the average population age which were done both generally at the municipal level and separately for the urban and rural populations. These values point to a constant and very intense process of demographic aging. The aging index at the municipal level showed a constant growth: in 1961 it was 0.37, which is the value considered to be the boundary of demographic aging. In 1991, the aging index was 1.44, while according to the latest census its value reached 1.86. More intense changes in the aging index were recorded in the rural settlements where it ranged from 0.40 in 1961, to 3.66 in 1991, and 4.62 in 2011. The index of aging reached the highest values in the villages of Telovac (25), Kosmovac (22.5), Glogovac (22), and Šljivovik (17). The urban population is marked by slower aging index changes. During the period 1961 to 1991, the aging index followed a trend of rather slow growth from 0.26 to 0.49. The urban population began to age more quickly in the last two decades, and the index of aging increased to 1.16 in 2011 (Table 4).
The Aging Index and the Average Age of the Population of the Municipality Bela Palanka in the Period 1961 to 2011.

Source: Author’s calculations based on the Statistical Office Socialist Federal Republic of Yugoslavia, 1965; Statistical Office Savezna Republika Jugoslavija (Federal Republic of Yugoslavia), 1993; and Statistical Office of the Republic of Serbia, 2012.
The variations in the average population age value followed the trends of the aging index. The same demographic trends were observed in the municipalities of Svrljig 18 and Ražanj. 19 The average population age increased at a faster rate in the villages than among the urban population. In 1961, the average population age in rural settlements was 32.66 years, while the same parameter reached only 26.35 among urban population. The disproportion was even more apparent in 1991, when the average population age in the villages was 51.39, whereas it was 34.51 in the urban area. According to the latest census in the Republic of Serbia, 20 the average age in urban areas is 42 and 55.1 in the villages (Table 4).
The period of the second half of the twentieth century was characterized by the changes which primarily affected rural population. 21 Intense aging in the villages was caused by a low population growth rate, as well as by the migrations from rural to the urban areas. During this period, Bela Palanka and the nearby cities (mainly Niš and Pirot) underwent a powerful industrialization process, which caused a great number of inhabitants to move from villages to the municipal center or the nearby cities. The population concentration in the city nucleus of Bela Palanka was simultaneously followed by a process of demographic emptying of the rural territories. The depopulation process was also followed by the appearance of the so-called old-age households in the villages and further disturbance of already bad age structure. 22
The level of the aging process in each and every settlement can be determined in the most precise way once the stadium of demographic age is determined. By using this approach, one can best observe regional differences in demographic aging as well as the prospects for demographic settlement revitalization. Back in 1961, the population at the municipal level was on the very threshold of demographic aging. The urban population was characterized by demographic maturity, while the rural population had already achieved the demographic old-age stage. As many as ten settlements were in the third stage of demographic aging. As many as twenty-six settlements were on the threshold of demographic aging, while ten more settlements had already entered the stage of demographic old age. The worst demographic image was recorded in the settlement called Dol. Even then the population of this settlement was caught by deep demographic old age. Although very diverse, such population age structure indicated strong polarization processes. The consequences of the polarization process affected not only demographic but also economic flows in the municipality. The urban population maintained a favorable age structure based on high birthrates and population influx from hilly and mountainous backcountry, whereas the rural population had already been declared demographically old. Until 1961, traditional farming seemed to be an interfering factor that prevented the inhabitants’ migration from the villages. In the period that followed, the importance of this factor drastically declined due to the development of education and industrialization, and village–town migrations were significantly intensified. Certain world experiences indicate that the migrant core involves the population aged twenty to forty. 23 As this population is at the optimal reproductive stage of the life cycle, long-term negative effects of their emigration in the area were unavoidable.
The consequences of the intense aging process during the 1961 to 1991 period brought about very negative results. Only one settlement was at the threshold of demographic old age (Bela Palanka), while Vrandol, Crveni Breg, Crvena Reka, and Dolac (settlement) were in the stage of deep old age (the sixth stage). Even at this point, the population of all other settlements entered the last, seventh stage of demographic old age, that is, the deepest demographic old age (Table 5).
Settlements According to the Stage of Demographic Age.
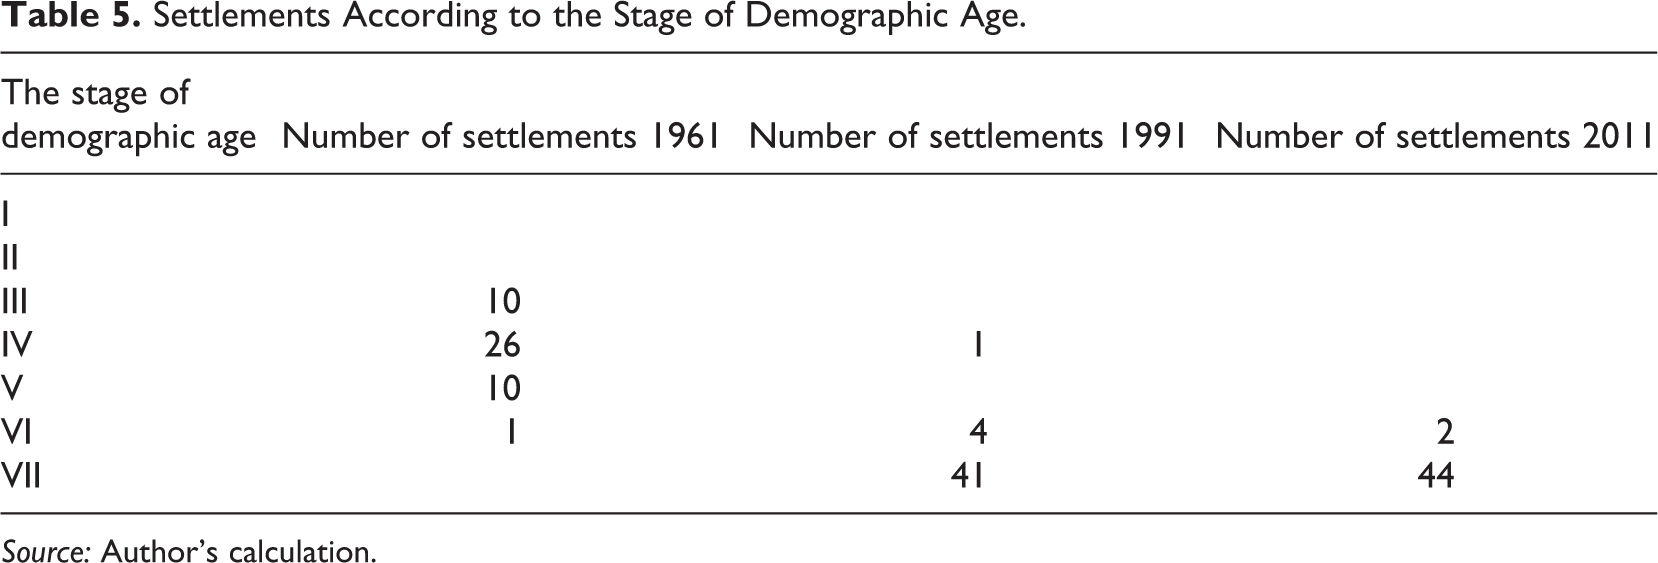
Source: Author’s calculation.
The aging process even during the last observed period was characterized by a negative trend which resulted in the fact that in 2011 as many as forty-four settlements were already in the seventh stage of demographic old age. The demographic picture was only slightly better in the settlements of Bela Palanka and Dolac (village) whose population was in deep demographic old age (the sixth stage). An interesting phenomenon is the village of Dolac, where population “rejuvenation” was observed. This hamlet with only fifty-seven inhabitants managed to improve its demographic picture and to, at least a bit, alleviate the aging process through positive natural and mechanical movements of the population.
In order to examine the additional research hypothesis, the population aging process has been analyzed from the perspective of some spatial and morphological settlement characteristics. The performed analysis according to the hypsometric settlement belt (sea level at which a settlement is located) and the settlement position have confirmed the initial hypothesis (Table 6).
The Hypsometric Distribution of Population.

Source: Author’s calculation.
A strong migration toward the communication lines and the Nišava Valley has been noticed. The population of the settlements located at higher positions aged more quickly during the 1961 to 1991 period, which is also supported by the fact that only the settlements in the lowest area (Bela Palanka, Crvena Reka, Crveni Breg, and Dolac [settlement]) had a somewhat more favorable age structure. During the following period, even the settlements in the lower areas were affected by the aging process, but this process was not as intense as in the settlements located at a higher sea level. The average settlement age is the highest in the following settlements: Miranovac 76.4 years, Gradište 75.3, Kremenica 75.1, Vitanovac 74.8, Draževo 74.6, Babin Kal 74.2, Pajež 74.1, Špaj 73.5, and Klenje 73.2 years. Most of these settlements are located in the highest hypsometric zones.
According to their spatial position, all these settlements can be categorized in three zones:
24
the zone of the municipality center and the Nišava Valley which includes twenty-four settlements, the zone of Suva Planina comprising twelve settlements, and the zone of Svrljig Mountains encompassing ten settlements.
Negative demographic changes are the most prominent in the settlements located in the zone of Svrljig Mountains. The isolation of this area as well as poor traffic links and public services are the primary causes of depopulation and population aging. In 2011, all ten settlements of this area had only three inhabitants younger than twenty years of age. Such demographic situation undoubtedly points to the extinction of these settlements in the near future. The settlements in the zone of Suva Planina are in a slightly better position. Transport accessibility and closeness of the E-80 trunk road were the reasons why demographic problems were the least pronounced in the settlements of the Nišava Valley.
Conclusion
In the period 1961 to 2011, the territory of the municipality of Bela Palanka was marked by extremely negative tendencies of demographic development. The age structure of the municipality had a distinctly regressive structure with a low percentage of the young and a high percentage of the elderly population. The changes in the age structure showed certain regularities during the observed period, so that it is possible to single out two phases in the population development. The first phase refers to the period 1961 to 1991. After a short postwar period of high birthrates (until 1961), followed a thirty-year period of a constant decline in birthrates which started primarily in the rural settlements. This phase was marked by intense processes of industrialization (and urbanization), when village–city migrations started. The urban area imposed itself as a pole of development in which the majority of functions were concentrated, which is the reason why the inhabitants of villages started moving to the municipal center. Simultaneously with industrialization (and urbanization), the villages were affected by the processes of deagrarization and depopulation. All these factors caused changes in the age structures in the villages, where the population aging process was very prominent even back then. Due to the influx of the village population, the population aging process in the city was significantly slower. The second phase refers to the period 1991 to 2011. Until this period, the influx of population to the urban settlement had already been finished to a great extent, so that the intensity of village–city migrations decreased. The birthrates of urban population were extremely low, so intense aging also happened in the town. The aging process of the village population continued, at a slightly slower rate. At the end of this phase, almost all population fell into the category of the deepest demographic old age. The settlements in higher hypsometric zones are particularly endangered, as well as the demographically smallest settlements.
The population development is under a direct influence of natural and mechanical population movement. Low birthrates, extended human life span, but also population migrations are direct causes of the aging process. However, beside these factors, there are many others that caused changes in the age structure. Poor public services and infrastructure, a poor network of school, culture, and health institutions are only some of these.
Together with aging, depopulation is the greatest demographic problem which the municipality of Bela Palanka faces. The number of inhabitants has decreased by 50 percent during the last fifty years. While the population has concentrated in the urban core, the rural settlements are almost completely deserted. How serious this demographic problem is, can be illustrated by the fact that out of forty-six settlements in the territory of the municipality of Bela Palanka, as many as nineteen settlements have no resident younger than twenty, and sixteen more settlements have only ten residents in this age-group.
Big and radical changes in the demographic development of this territory should not be expected in the forthcoming period. The aging process is in a high phase, and it is impossible to stop it completely in all the settlements of the municipality of Bela Palanka. Still, the right measures of a pronatalist policy could slow down the aging process, which would be an initial impulse toward possible revitalization of the settlements.
Footnotes
Declaration of Conflicting Interests
The author(s) declared no potential conflicts of interest with respect to the research, authorship, and/or publication of this article.
Funding
The author(s) disclosed receipt of the following financial support for the research, authorship, and/or publication of this article: This article is a part of the project “Development Programs of Revitalization of Serbia Villages,” No. OI176008, funded by the Ministry of Education, Science, and Technological development of the Republic of Serbia.