
Abstract
We examine different aspects of nuptiality and fertility in the Länder of the Austrian Empire using the Tafeln zur Statistik der Österreichischen Monarchie (Statistical Tables of the Austrian Monarchy). This source, published from 1829 to 1871, contains data on population and natural movement. After discussing its quality, we study marriage and birth rates, and also age at wedding, illegitimacy ratio, and marital fertility. We find meaningful differences between the regions of Empire: low and late nuptiality in some central Länder, which generally have consequences for birth rates. The frequency of illegitimacy and marital fertility rates are also examined for the 15 Länder.
Keywords
Introduction
This study compares several aspects of nuptiality and fertility among the Länder, of the Austrian Empire. To this end, we employ a little-used source, the Tafeln zur Statistik der Österreichischen Monarchie (Statistical Tables of the Austrian Monarchy; hereafter Tafeln). The Tafeln emerged in a period in statistical history marked by recognition of a need for administrative data on the part of numerous European States, and the subsequent formation of specific offices charged with the production of statistical data. As this process was centralized, the same kinds of information were collected across the Empire, enabling comparisons between regions.
According to the census of 1857, about thirty eight million people lived in the Habsburg Empire. This represented about 13% of the population of Europe, making it the second-largest and second-most populous country after Russia (see historical map). 1 The Tafeln therefore offer an overview of key demographic features of a vast European population in the mid-nineteenth century. The macro trends across this immense territory were indubitably generated by a wide variety of micro-level behaviors. Our goal here is to analyze, compare, and explain the different broad trends characterizing the Empire’s different Länder. Given the great size of the Empire, we will not provide a detailed consideration of each Länder, but rather aim to examine major trends, highlighting the most significant differences and similarities. We seek to provide a broad view of the demographic and social dynamics of a large portion Europe’s population in the mid-nineteenth century, which experienced crucial changes precisely during this time period. In particular, we will focus on nuptiality and fertility, endeavoring to interpret the data in light of more general trends in marriage and household structure. Because the Tafeln have not yet been used for such an extensive demographic analysis, we begin with a detailed discussion of this source’s reliability in recording population trends.
Our territory encompasses the imaginary Hajnal line, running from St. Petersburg to Trieste, which theoretically distinguishes between the demographic systems of marriage and fertility in Eastern and Western Europe. Our analyses, however, question this strict division, showing greater complexity and variety of behaviors across different economic and social contexts.
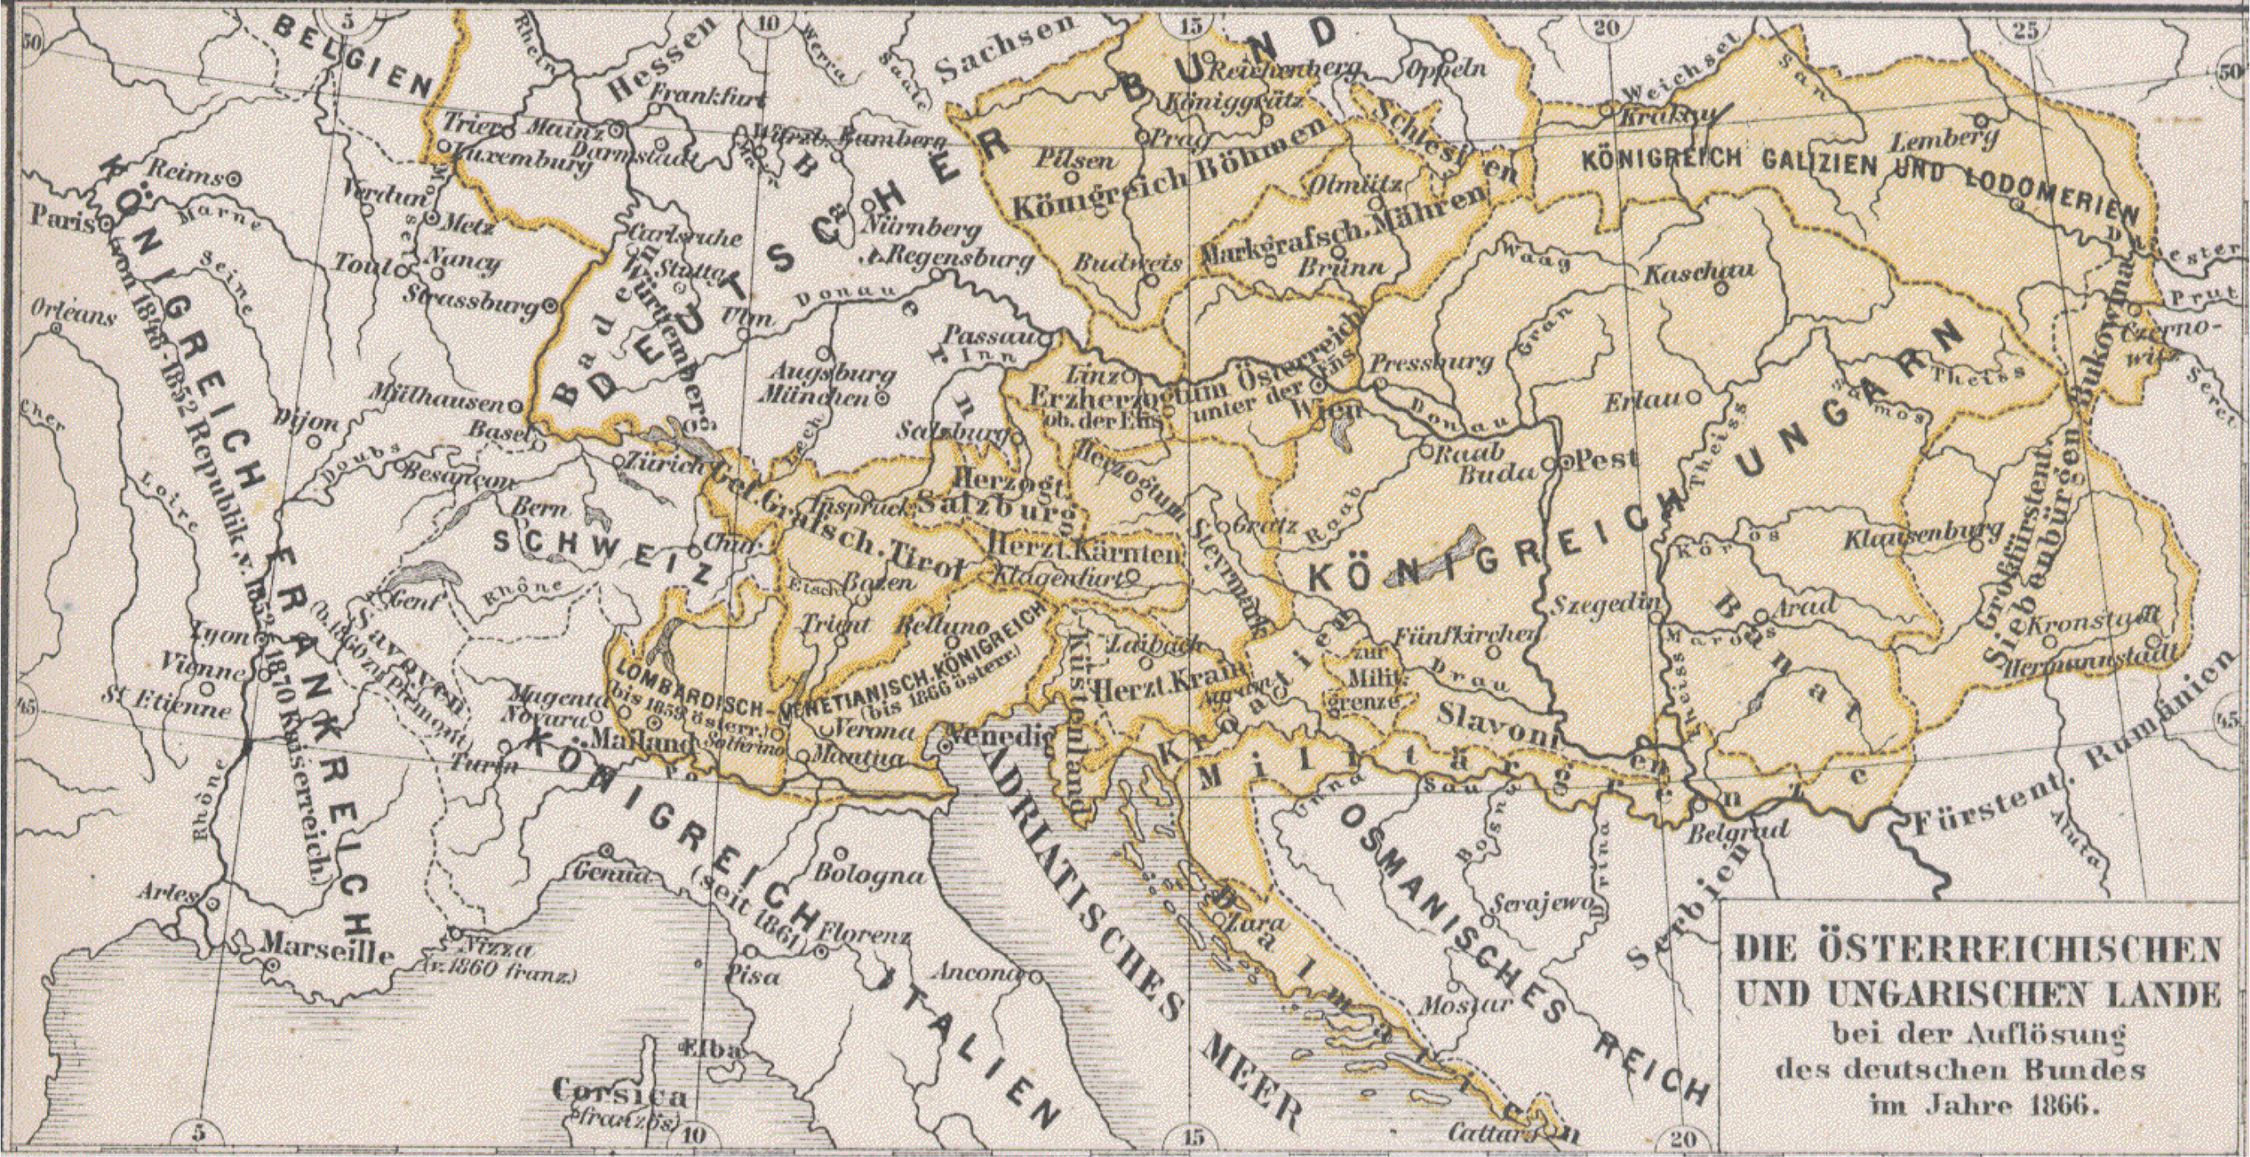
The Austrian Empire in 1866 Source: Meners Konversation-Lexicon, vol. 15 (Leipzig und Wien: Bibliographisches Institut, 1896).
The Source: the Tafeln of the Austrian Monarchy
In December 1829, a small office within the Austrian Empire’s General Direction of Accounts presented a series of 104 statistical tables to the Emperor. 2 The aim was to show various aspects of the economic, social, and administrative life of the Empire in 1828. This was the first volume of the Tafeln, which continued to be published until 1868 with data up to 1865. The Emperor was impressed by the amount of data, although he limited its diffusion to within the administrative environment. It was not until the 1846 edition—containing data from 1841 and with lead type instead of the earlier lithographic printing—that the Tafeln began to be disseminated to the public.
The material contained in the Tafeln was very heterogeneous, and its organization varied over the different editions. A new and enriched series of data was introduced in the 1856 volume, which reported information for the years 1849–1851. 3 Population data was generally presented first, followed by that on the administrative apparatus (courts, prisons), treasury revenue according to its source (direct taxes, fees, concessions, etc.), and finally State budget with income and expenses, including military expenditures and assets situation. Specific chapters were then dedicated to agricultural, mining, and industrial production, commercial activities, postal services, credit, and the transport of goods. Information was also included on the clergy, educational and vocational training institutions, the health system, and charitable works. The information was published for each Land, though summary data on provinces (Delegationen) is also available in the publications between 1828 and 1857.
For our purposes, certain recurrent tables are of particular interest. One such table contains data on the population, while others refer to vital events in each Land, specifically marriages, births, and deaths, with s few volumes containing migration data as well. Exceptionally, the second volume includes synthetic vital data for the years 1819–1828 for all Länder except Hungary (Ungern) and Military Frontier (Militärgränze).
The Tafeln present total population figures for each year with the exception of those close to census-taking periods. Up until 1851, records of the native population (einheimische Bevölkerung) appeared as well. In these years, the total population is equal to the native population minus the temporarily absent, plus the temporarily present and the military. Unfortunately, while data on the military is always reported, that on the present and the absent only appear for certain Länder of the Austrian Empire 4 and is missing instead for the others. With regard to the Lombard Venetian regions, and Hungary, Transylvania, and Military Frontier, the differences between the two figures (i.e., resident and total population) are equal only to the military presence. In order to obtain nuptiality and birth rates, we thus use the total population, in practice an estimate of the de facto population. We do this for reasons both of continuity with the years after 1851, and because the natural movement events were recorded where they took place, and therefore refer to the de facto population. 5
Population data varies in quality from one Land to another. In some Länder, military authorities drew up population estimates every three years until 1846. In others, civil authorities made yearly computations, such as in Tyrol, Dalmatia, Lombardy, and Venetia. Population registers existed in the latter two regions, which were updated daily with births and deaths, and less frequently with migrations. The periodic calculations in other regions, clearly motivated by military considerations, are less consistent with modern census taking.
The information on natural movement, specifically marriages and births, contains meaningful classifications. Throughout the period, marriages were reported by the civil status of the spouses, age of the bride and groom respectively at wedding, as well as live births by sex and legitimacy. Other information, such as the seasonality of marriages, became available starting only from 1851. 6 These vital data were collected by priests, who made a civil copy of the parish registers of marriages, baptisms, and burials, drawn up for religious purposes. Data collection in non-Catholic communities was subject to certain norms. Owing to the secular experience of parish priests, the information from the registers is generally considered much better than the population estimates, with some exceptions (e.g., some marriage and birth data in Hungary is missing or published by rounded numbers for many years).
The task of characterizing the population of such a vast Empire is obviously not without its challenges.
7
Table 1, which summarizes data obtained from the 1857 census,
8
shows that the populations of the Empire’s Länder differ greatly in size as well in age distribution, fertility levels, Catholic populations, and extent of agricultural activity. This immense area encompassed a diverse array of geographical regions, economic and social realities, and cultural behaviors. These ranged from the Duchy of Salzburg, with 140 thousand inhabitants in 1857 to Hungary, with a population of 10 million; from industrialized Bohemia to rural Transylvania; from urbanized Vienna to the Alpine regions of Tyrol or the agricultural Hungarian plains
The Länder of Austrian Empire: Selected Data by 1857 Census.
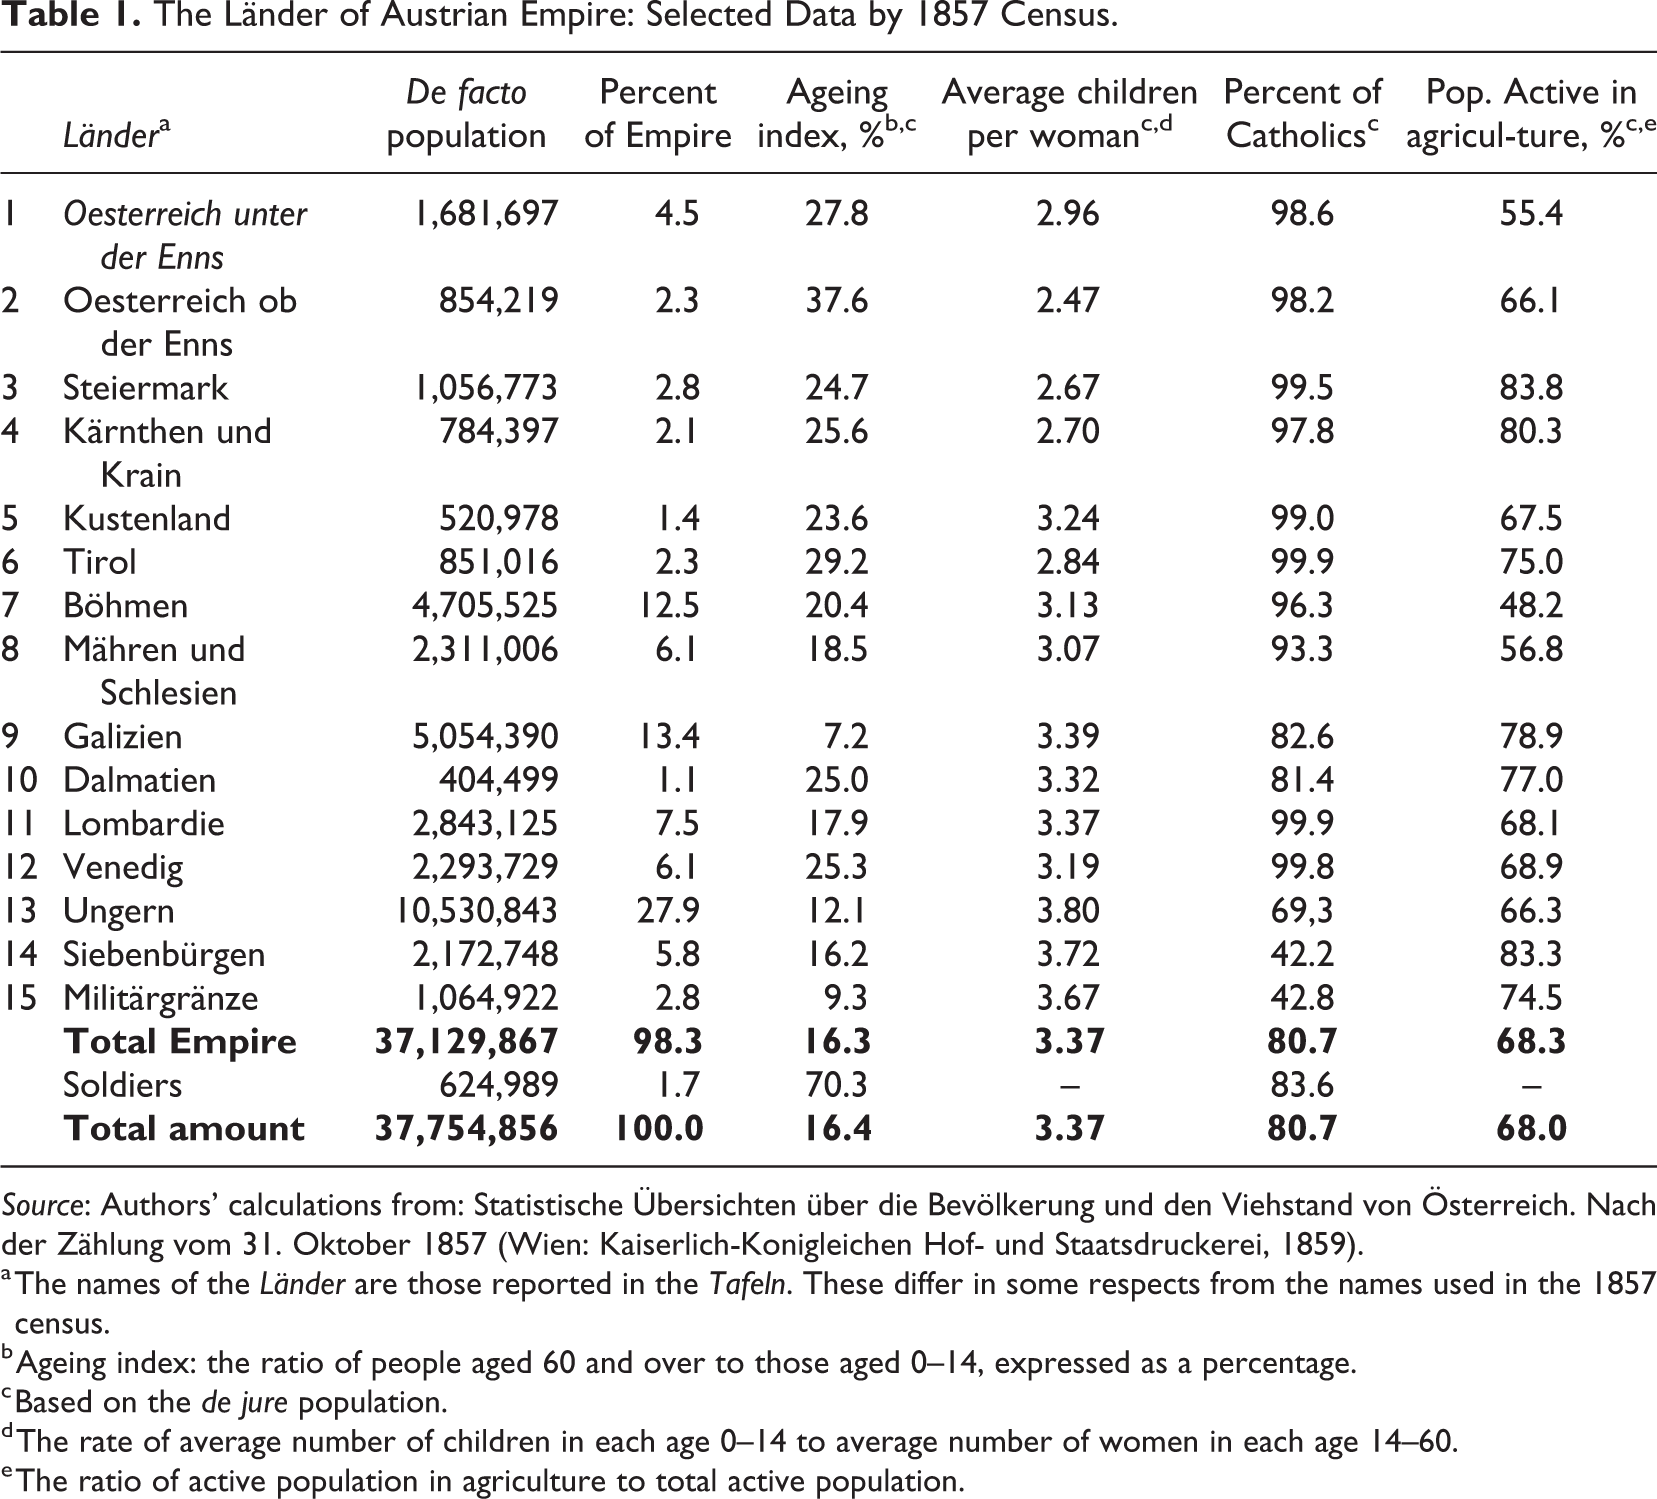
Source: Authors’ calculations from: Statistische Übersichten über die Bevölkerung und den Viehstand von Österreich. Nach der Zählung vom 31. Oktober 1857 (Wien: Kaiserlich-Konigleichen Hof- und Staatsdruckerei, 1859).
a The names of the Länder are those reported in the Tafeln. These differ in some respects from the names used in the 1857 census.
b Ageing index: the ratio of people aged 60 and over to those aged 0–14, expressed as a percentage.
c Based on the de jure population.
d The rate of average number of children in each age 0–14 to average number of women in each age 14–60.
e The ratio of active population in agriculture to total active population.
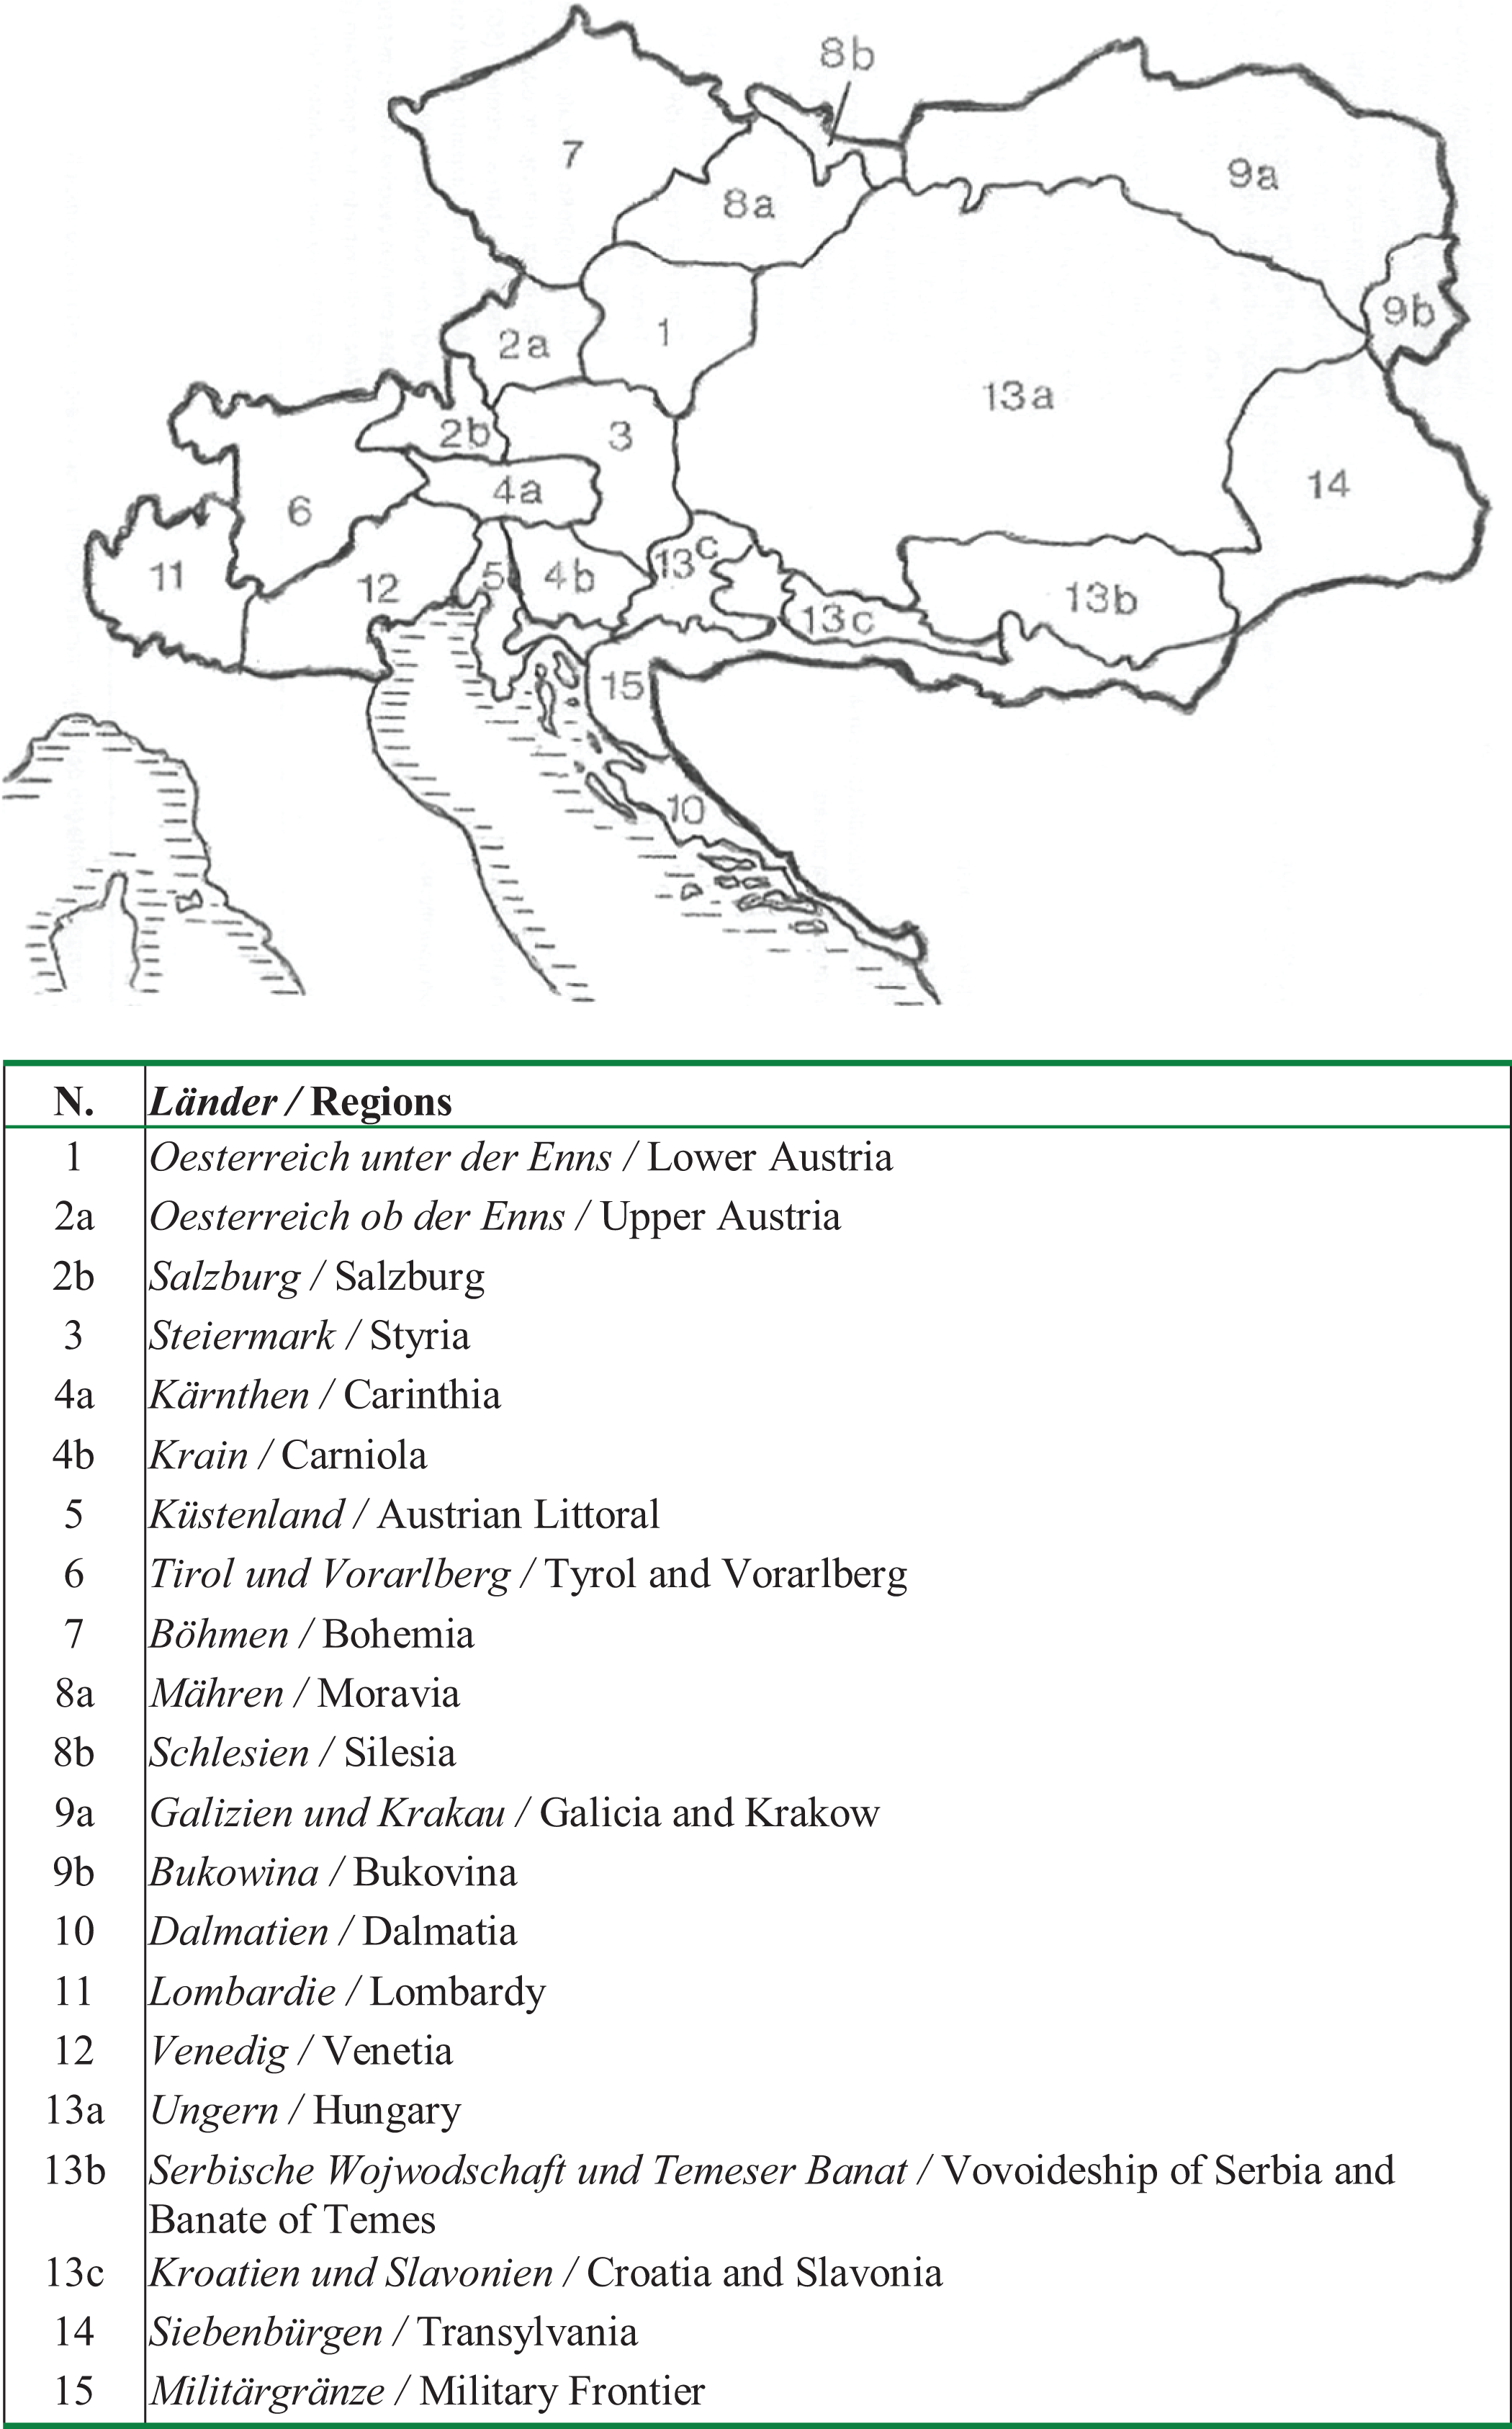
A sketch map of the Länder of the Austrian Empire, 1866.
Historians of the Habsburg Monarchy agree that although a single administrative machine oversaw the Empire’s vast territory and attempted to enforce homogeneity, diverse behaviors relating to various societal dimensions persisted across the regions throughout the nineteenth century. Indeed, while modernization and economic growth generally arrived late to all the provinces of the Empire compared to other European regions, 10 the eastern provinces offered better living conditions than in the west until the end of the nineteenth century (as measured by proxies such as stature, food consumption, and daily wages 11 ). This trend reversed by the turn of the century, however, with living conditions remaining stagnant in the east amidst a rapid rise in the west. Moreover, the Empire’s provinces were marked by different levels of wealth and economic growth trends during the nineteenth century. For example, Carinthia and Carniola, Tyrol, and the Austrian Littoral performed better than other regions at the beginning of the nineteenth century, but were then surpassed by Bohemia, Moravia, and Silesia which underwent a process of industrialization. 12 Dalmatia remained underdeveloped throughout the nineteenth century. The provinces’ economic contrasts were further accompanied by social and cultural differences. 13 It is therefore unsurprising that when the Austrian Empire was dissolved in the aftermath of the First World War, its successor states often reflected the character of different provinces of the Empire, and at least a certain level of inner coherence.
In their attempts to centralize the Empire and to smooth out regional differences, Emperors promoted and organized several censuses and established a system of population registers based on recurring enumerations of the population beginning in the mid-eighteenth century. 14 These were, however, greeted with suspicion by local populations, as it was feared that the purpose of the census was to impose new taxes and to weaken the local aristocracy. Thus, population censuses often faced considerable resistance before 1867, which complicated the process of enumeration. As a result, the findings of these censuses have sometimes been regarded with doubt. 15 The level of collaboration varied in different provinces, with Hungary and Dalmatia showing the greatest reticence. 16 We will discuss different provinces’ levels of collaboration in greater detail as we analyze the data.
In light of the above considerations, scholars remain divided as to the quality of the data contained in the Tafeln. Certain Italian scholars are especially critical (Berengo 1963), others more cautious (Zaninelli (1963) or, more recently, more balanced (Leonardi 2005) in their assessments. 17 Yet these scholars primarily focus on the economic data therein, especially that related to agriculture. Less wary is Cvrcek (2013), whose work on living standards in the Habsburg Empire during the nineteenth century uses economic information from various sources including the Tafeln. 18 Generally, however, few scholars have remarked on the quality of the population information, which have rarely been used. The little research that has been conducted has not shown significant inconsistencies. 19 Of course, not all the information is equally precise or complete, as becomes evident when examining certain details or classifications. 20
Our own efforts to evaluate the completeness and accuracy of the birth and death data gives results similar to those of Dalla-Zuanna and Rossi. 21 Calculated the 95% confidence-interval around the mean of 106 M%F, which depends only on the number of births, certain Länder (Lombardy, Venetia, Transylvania) recorded a slight excess of male births—it is also plausible that female births were not registered, possibly because they died soon after birth. In the majority of the Länder, anomalous cases do not exceed expected statistical variability. The results therefore appear to be acceptable, given the period under study.
We examined the accuracy of the number of deaths that were published by sex and age beginning in 1851. Our findings again matched those of Dalla-Zuanna and Rossi (2010) 22 in showing a certain degree of age heaping, especially around ages ending in zero. This practice is relatively contained for almost all of the regions (11–12%), and just slightly higher in others (representing around 13% of cases in Bohemia, Dalmatia, and Lombardy). Somewhat more unusual is the preference for ages ending in nine, for which it is difficult to find an explanation (Hungary 14%, Galicia 16%, Transylvania 17%, Military Frontier 20%). 23
Finally, the unknown ages (Unbekanntes Alter), were just a few thousand out of more than 11 million deaths considered; for a given year, this percentage rarely exceeds 0.10% and is often less than 0.05%. 24 The situation improves in the second part of this period; overall, missing information is less common for women than men. This data regarding age also seems valid in light of the period in which it was collected.
It is difficult to assess a source that was developed from scratch. In the case of the Tafeln, however, the natural movement data can be considered as quite reliable since it comes from an existing and consolidated source, namely the parish registers. This is less true of the stock data, which require further attention. In both cases, our verification is not limited to a simple internal compatibility check but is furthered by a substantial examination of the results, such as birth and marriage rates, constructed and discussed below. Indeed, although the total population figures, as well as those of births and marriages, do not generate suspicion, we nonetheless thoroughly check the results of our analysis. Stock data and natural movement data require a certain level of coherence to be judged of good quality. The results must be reasonably plausible; not being compatible, for example, in birth rates that are too high or too low for the period studied. Furthermore, levels of birth and marriage rates that are either both too low or too high might be the result of an over- or underestimation of the denominator population, respectively.
For these reasons, in what follows the measures built using both state and natural movement data are viewed with appropriate caution and examined on a case-by-case basis. We have greater trust in those constructed with natural movement data only, several of which are considered below. This refers not only to specific characteristics of these events such as illegitimate births, but also to measures obtained from the joint examination of natural movement data, such as the average number of children per marriage. It is, in any case, reassuring to observe that the levels and trends we obtain from the Tafeln reflect the diverse marriage regimes and family structures identified by prior research for the Länder of the Empire, as we further discuss in the following sections.
Nuptiality
Information available on marriages is not uniformly complete in all regions of the Empire. While there is sufficient continuity for the Länder of the old Austrian Empire, problems do exist relative to other regions. Notably, data for Lombardy and Venetia do not extend up until 1865, ending respectively in 1853 and 1864, with annexation to the Kingdom of Italy. The most critical situations, however, are found elsewhere: Hungary, Transylvania, and Military Frontier all have important gaps. 25 Finally, note that all natural movement data up until 1855 refer to the administrative year, that is from November 1st to October 31st, though this practice was replaced with the calendar year in 1856.
Using the available data, we can calculate marriage rates for each year 26 for the different Länder (Figure 2). Table 2 and Figure 3 summarize the levels, which vary extensively across the areas, evidently the result of diverse customs and traditions in the different regions of the Empire. We observe that marriage rates in the Military Frontier are much higher than in other regions. Specifically, they are around 11–12‰ until 1848, higher than in all other Länder, and then rise to between 12 and 19‰ in the second half of the century, with great year-to-year variability. These latter figures suggest that the data may be unreliable, at least for this period. 27 In contrast, marriage rates in other Länder are generally between 6‰ and 8–9‰, a widespread decrease is clear between 1851 and 1855, likely due to a famine that culminated in the crisis of 1855.
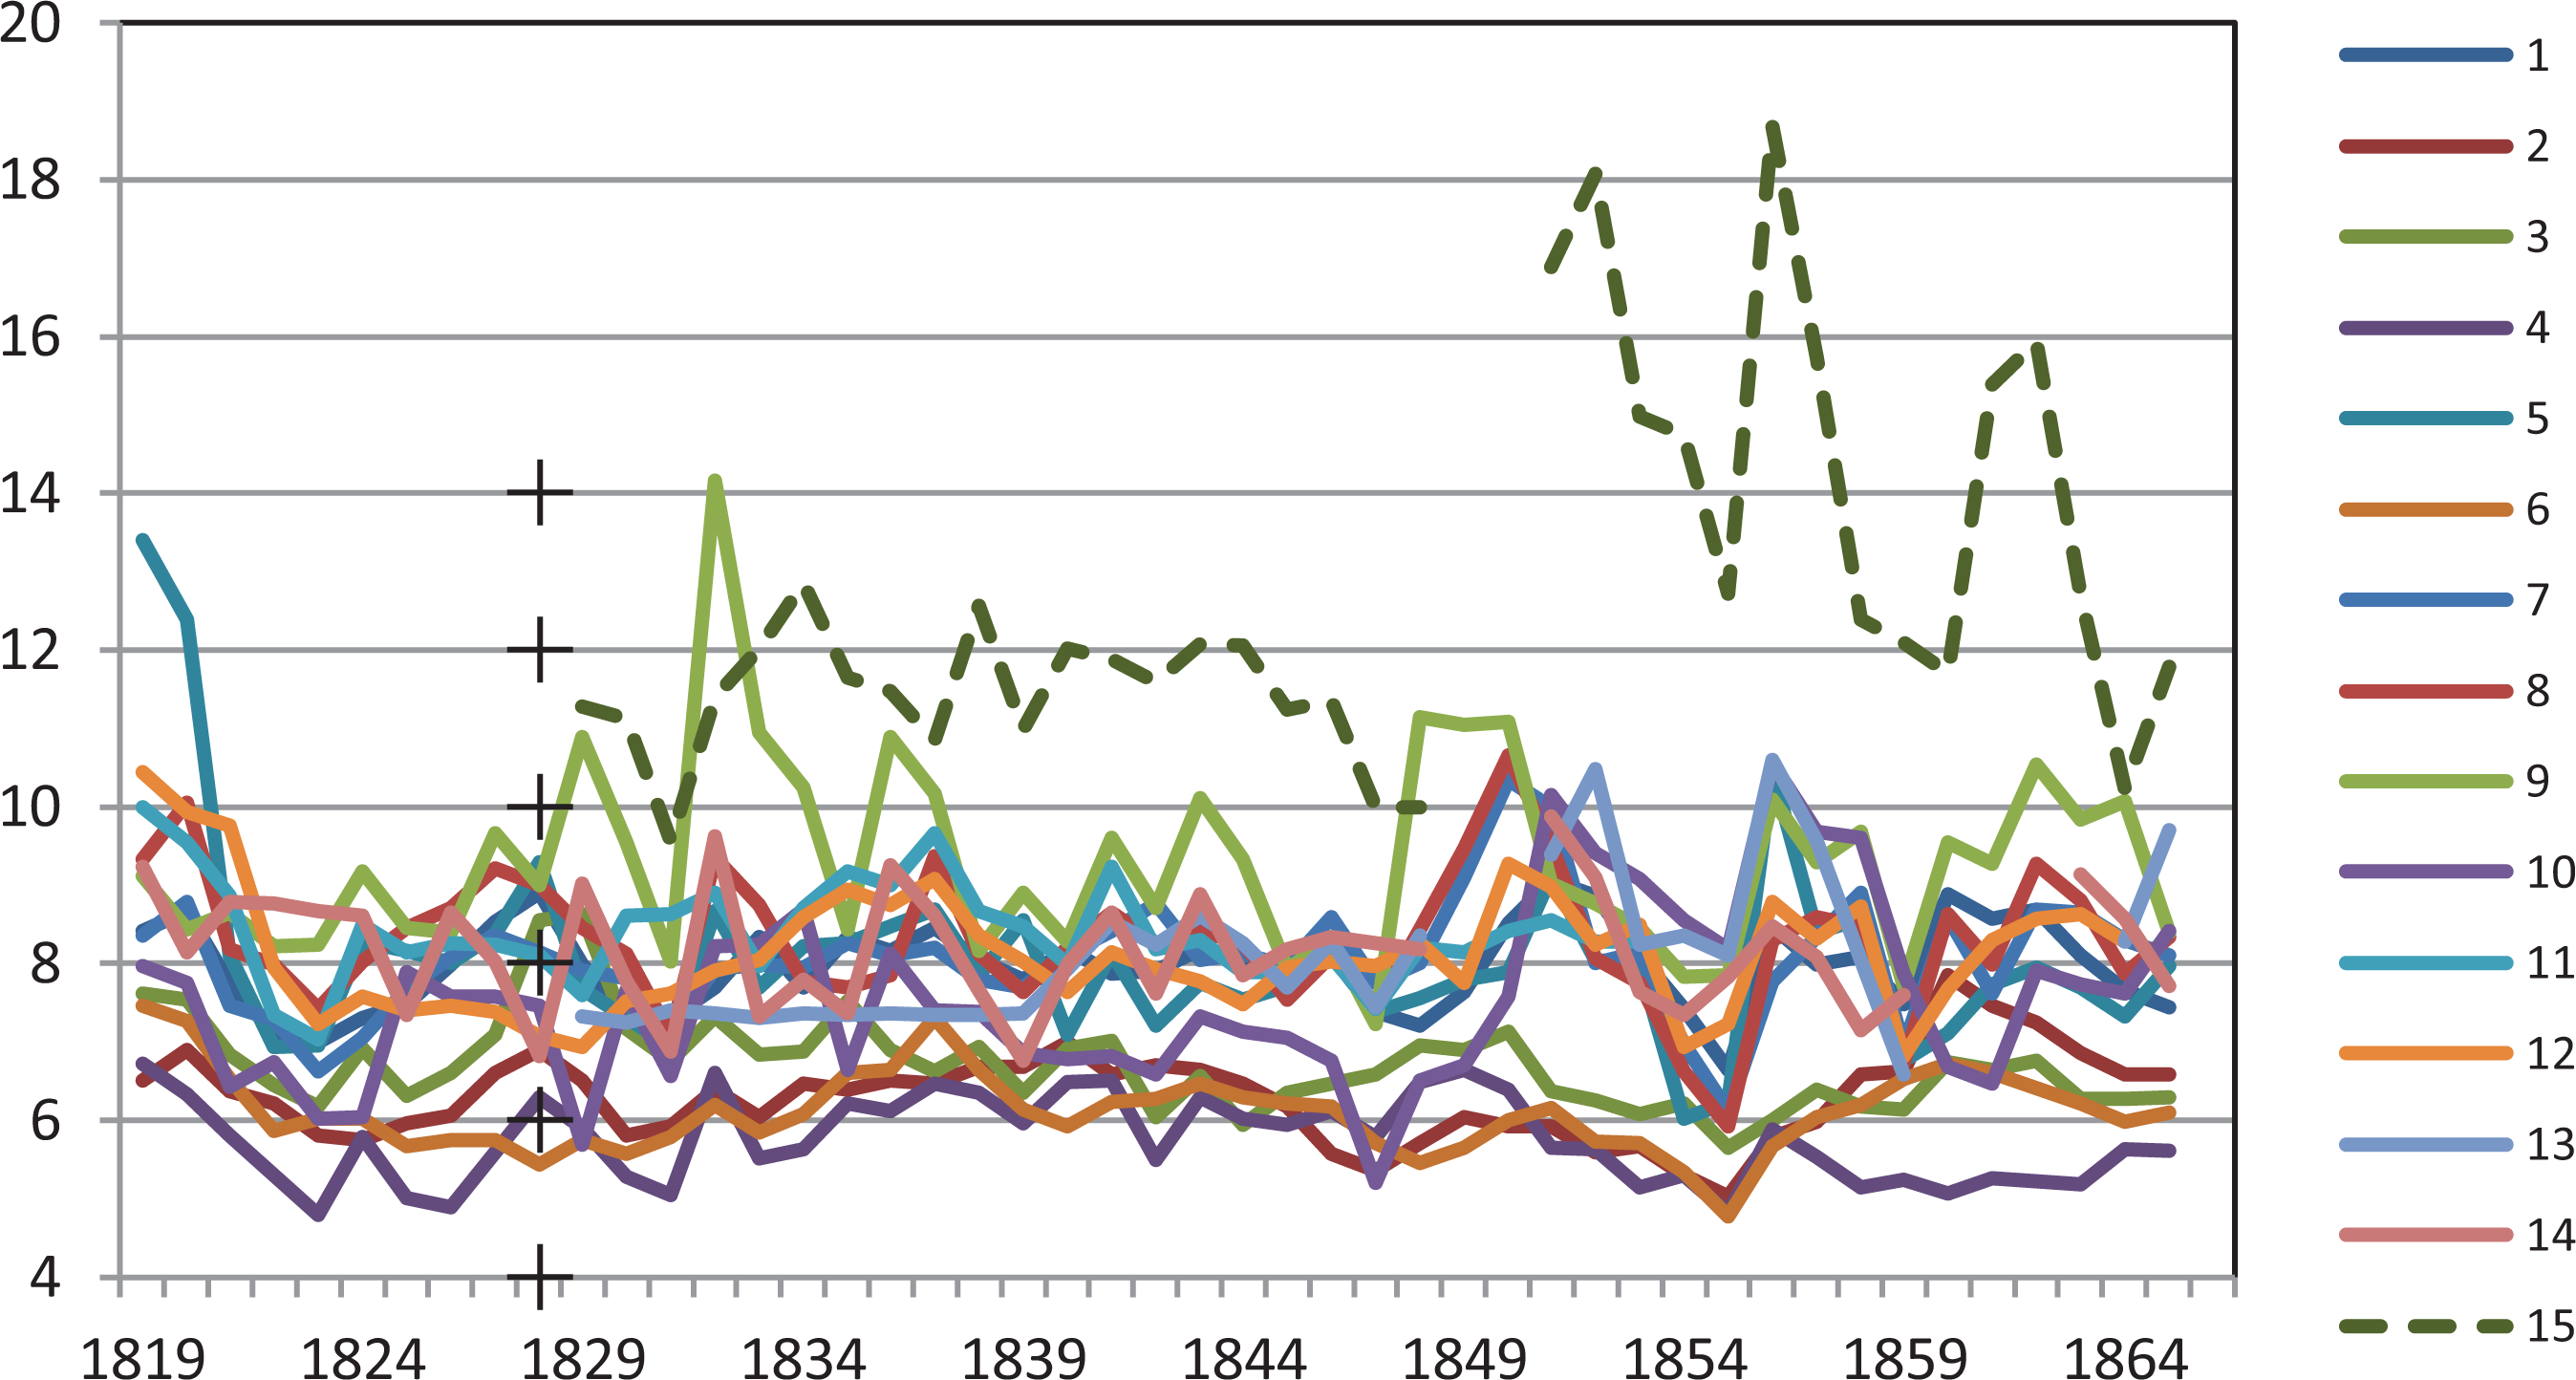
Nuptiality rates (‰) in the Länder of the Austrian Empire, 1819–1865. (For the names of the Länder, see Figure 1).
Mean Total Marriages Per Year, Rates of Nuptiality, Percentage of Second Marriages, and Mean Ages of Spouses in the Länder of the Austrian Empire, 1828–1865.
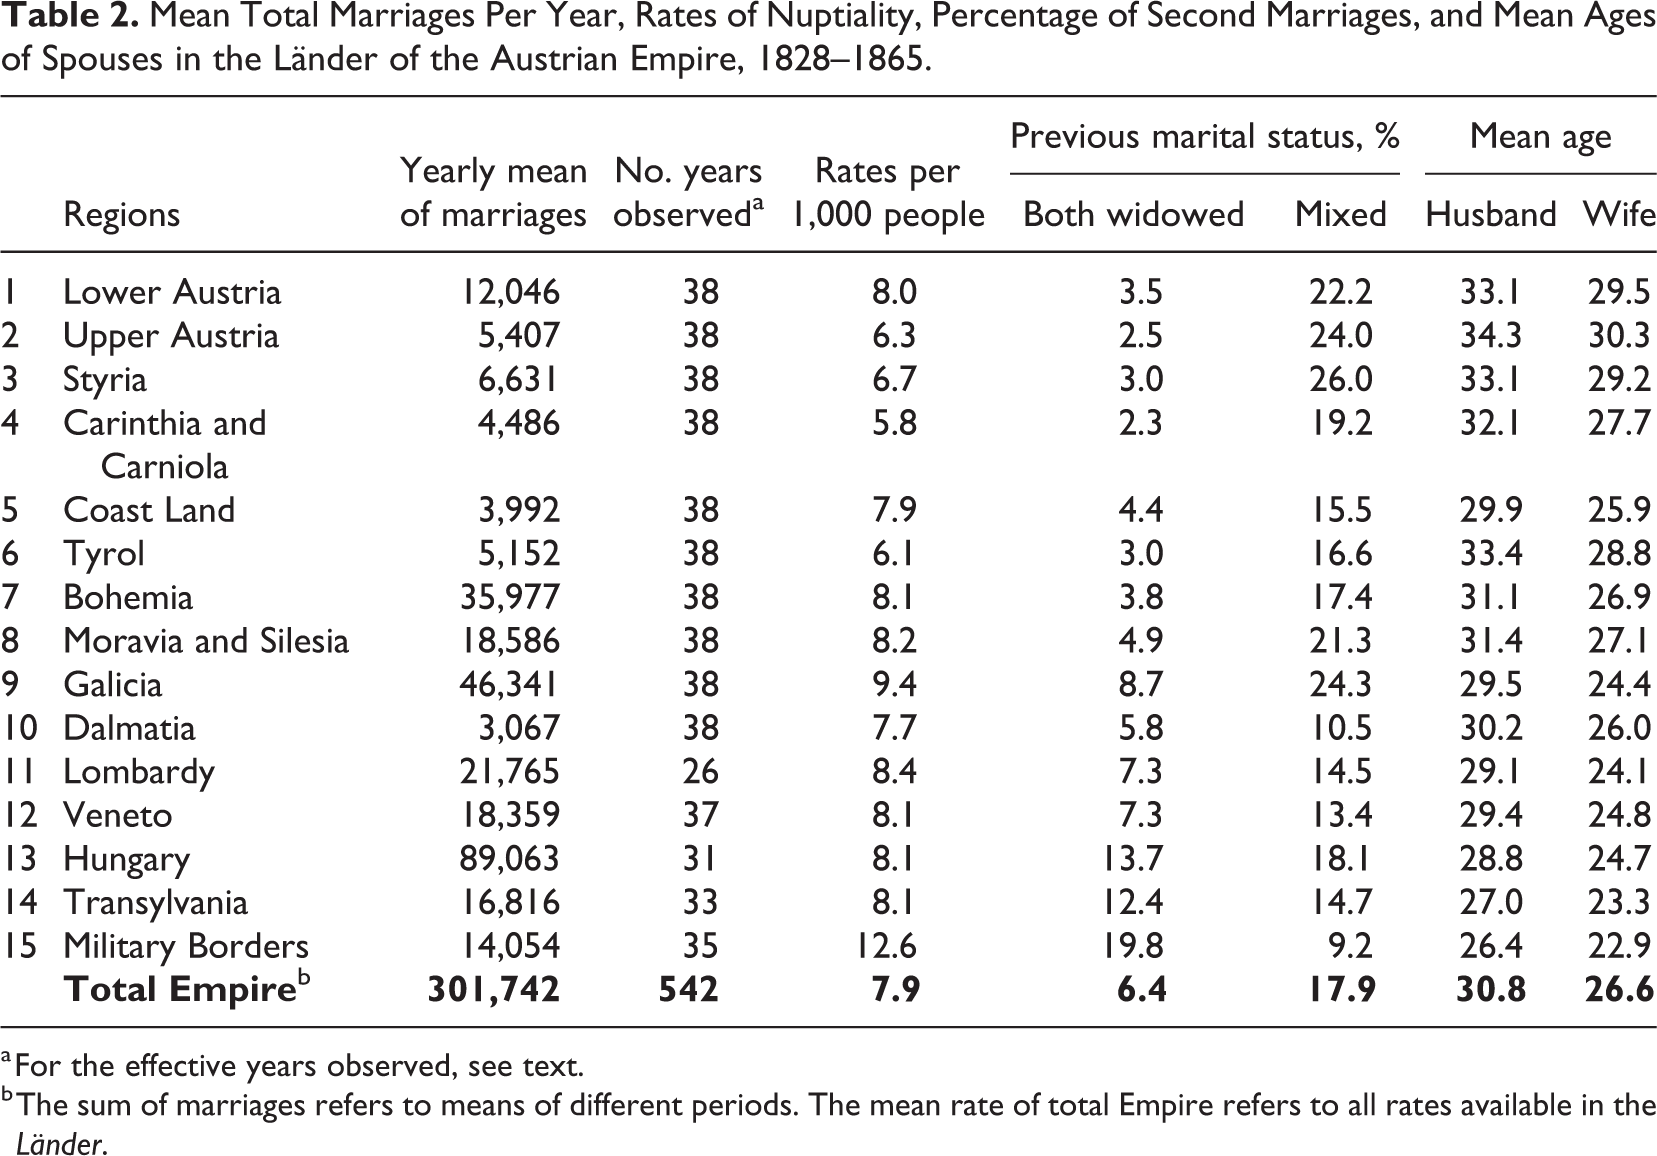
a For the effective years observed, see text.
b The sum of marriages refers to means of different periods. The mean rate of total Empire refers to all rates available in the Länder.
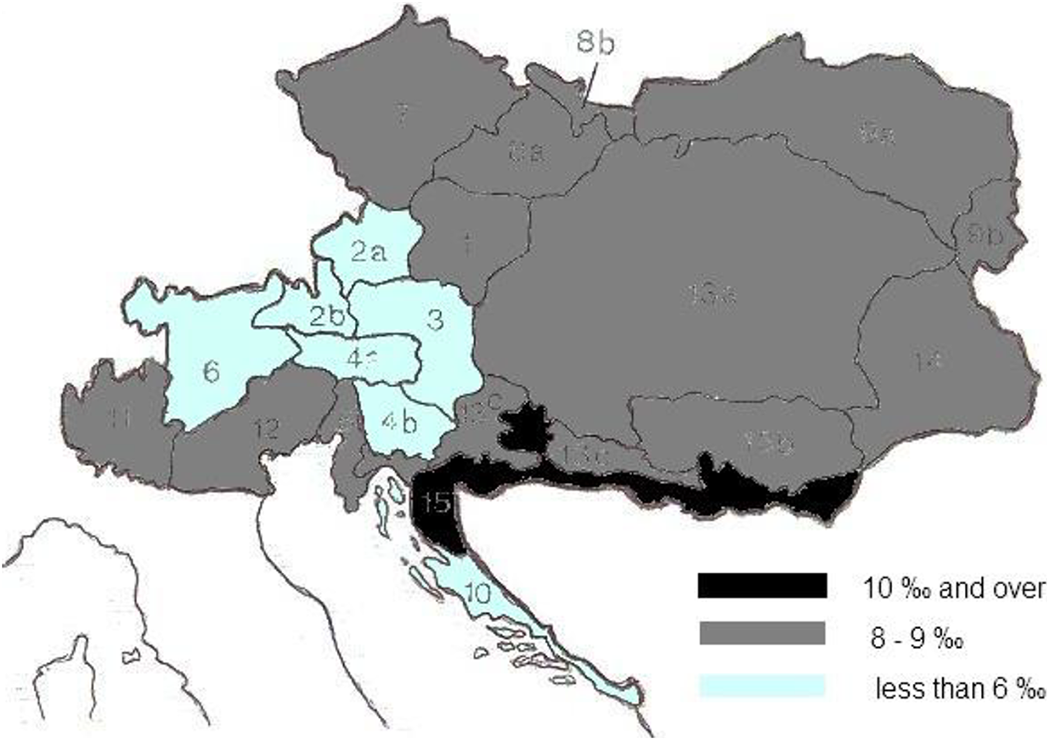
Mean nuptiality rates (‰) in the Länder of the Austrian Empire, 1828–1865.
Aside from the Military Frontier, the Länder with the greatest variability are Galicia, Dalmatia, and Hungary. Examination of the slope of the regression line over historical time (b), not shown in the table, shows no decisive time trends in the dynamics of marriage rates, except for those mentioned in the Military Frontier.
The total variance of the 542 marriage rates obtained is 3.4. Interestingly, however, the variance between groups (variance of the mean) is greater than the variability within each Land (the residual), with between-group variance accounting for three quarters of all variance (Table 3). In other words, over some forty years of observations, the nuptial differences between regions are much more pronounced than the variability observed in nuptiality within each Land. This indicates that beyond the real or supposed variability within individual Länder, it is clear that each Land had its own distinguishing characteristics based on social, historical, and anthropological factors, as we shall see further on.
Means and Variability of Selected Parameters of Nuptiality and Fertility in the Länder of the Austrian Empire, 1828–1865.
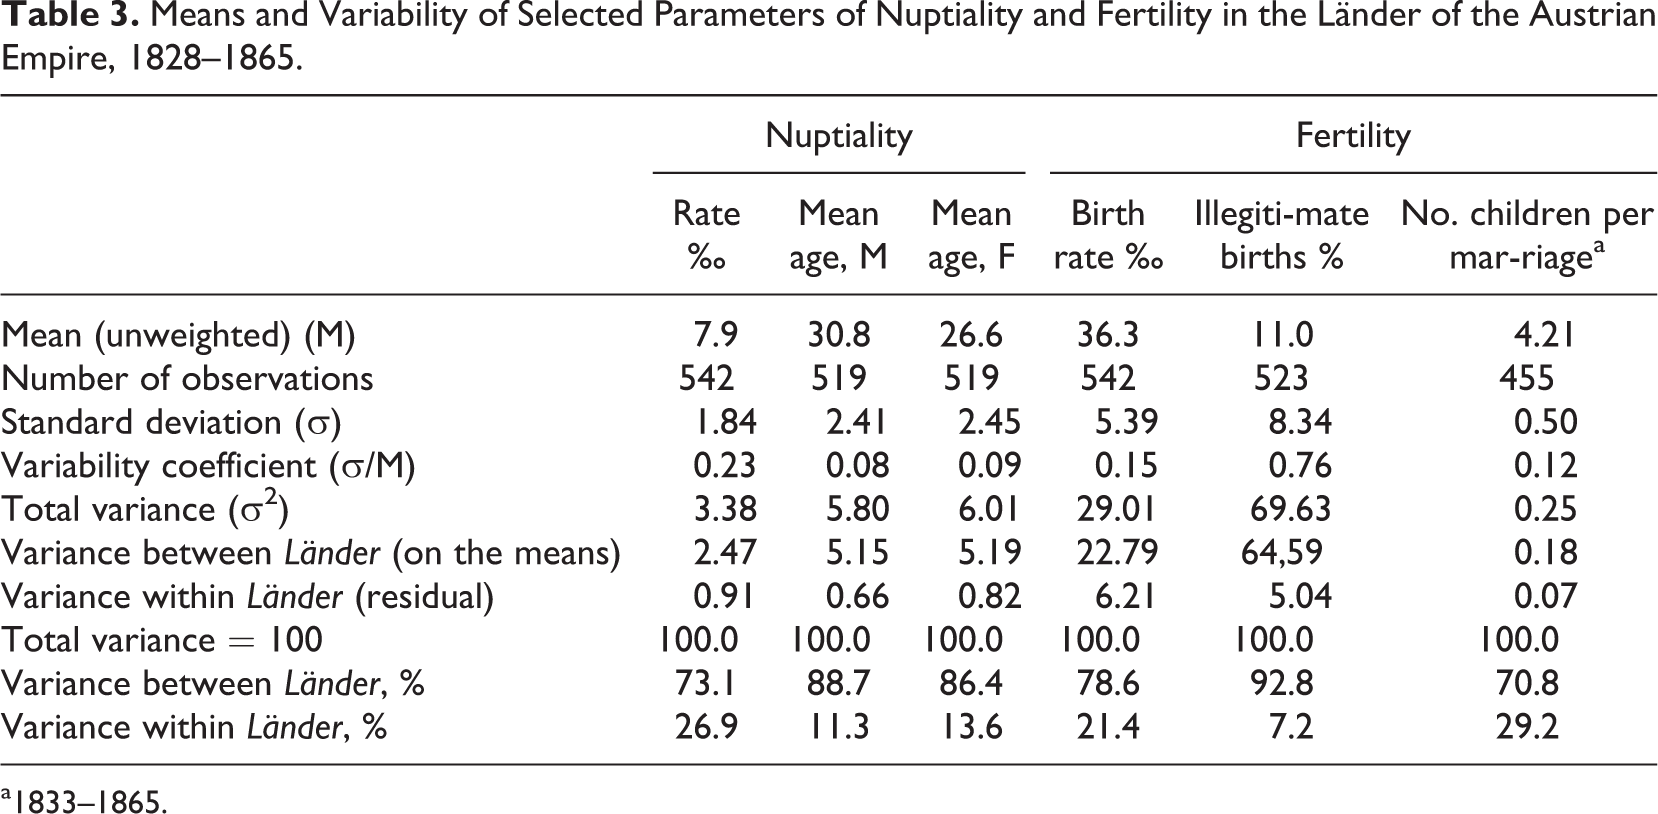
a1833–1865.
The age at marriage is available for the entire period for broad age groups. Unfortunately, these classifications refer to marriages between partners of any civil status, thus including both first and subsequent marriages. Table 2 indicates the percentage frequency of remarriages, listed separately for marriages between two widowed partners and those with only one (mixed marriages); the frequency of second marriages is extremely variable from region to region. It is possible to calculate a mean age at marriage, 28 but not the mean age for first marriages only, which would have been the more interesting factor, especially for comparisons with other European regions. In fact, all studies available for various Western European countries over this period indicate the age at first marriage, 29 which is not the case in our data.
Table 2 also lists the mean age at marriage in the various Länder over the study period. 30 Overall, the average ages are rather high: 30.8 for males and 26.6 for females. However, the situation is once again extremely varied. Differences between regions are considerable: the mean age at marriage over the study period ranges for grooms from 26–27 in the Military Frontier and Transylvania up to 33–34 in the central Länder (Upper Austria, Lower Austria, Tyrol, and Styria). Likewise, for brides the lower age range (22–23) and the higher range (29–30) are found in the same regions. This relationship is unlikely to be random, since we observe a strong correlation between average age at marriage among males and females in the various Länder. The link is direct and very close, with r = 0.959. Such patterns are evidently due to different customs established across various locations of the Empire, which remained present even beyond the mid-nineteenth century.
The overall variability of average age at marriage across all years and Länder is similar for men and women, although slightly higher for brides. In addition, the pattern of variance between and within Länder gives similar results: 86%–89% with regard to the former, 11%–14% for the latter (Table 3).
The temporal trends of age at marriage (parameter b, which is not, however, reported in Table 2), show slight increases over time in the average age at marriage in all Länder (though at an annual rate of less than 0.09, about one month per year), with the sole exception of the Military Frontier for men, where there is a very minor decrease, and Transylvania among women, where there is an increase of 0.15 (just under two months a year). The difference between men and women in average age at marriage is about four years in almost all Länder, with the exception of Lombardy and Galicia, where it exceeds five years, and in Military Frontier where it is less than 3.5. These results are influenced by both varying customs and local habits, which are slow to change over time, as well as by the frequency of remarriages, which decreased over time in almost all Länder.
As we can see in Figure 3, the Länder seem to cluster into two macro regions on the basis of nuptiality. The central Länder (Upper Austria, Tyrol, Styria, Carinthia, and Carniola) stand out for their low marriage rates, while the Italian Länder and those located further east are characterized by much higher marriage rates.
Even though these trends, as mentioned earlier, cannot be compared with similar patterns in other European regions, they are nonetheless interesting given their relevance to existing scholarship on the family systems and marriage patterns of these very areas. Indeed, the various ages at marriage and nuptiality in the different Länder reflect these regions’ distinct kinship systems. Scholars have raised a number of key issues to this regard, to which we now turn. For the sake of brevity, we limit our discussion to certain important topics and relevant areas, as a consideration of the different and complex dynamics of every region mentioned here is both beyond the scope of this study and amply covered by prior research. Our aim here is to assess the macro trends and elucidate the social and cultural backdrop to these demographic observations.
There is now a general consensus among scholars that the available historical information does not support the supposed divide between Eastern and Western European family structures postulated by John Hajnal in the 1960s. 31 Such data, in fact, indicates that Central Europe under the Habsburg Monarchy was characterized by a significant complexity and variety of household patterns. 32 Our analyses of the Tafeln similarly indicate a more complicated situation than Hajnal’s East-West divide. While marriages take place at earlier ages in the Hungarian provinces, this also holds for the Italian territories. Co-residence patterns, generated by and in turn producing such trends, were similar in all these regions when observed at a macro level. However, they are the result of a variety of micro-regional patterns, dependent on ecological, economic, social and cultural factors, which could shift over time. 33 For instance, a micro-level analysis carried out in a region near Budapest indicates that household structures underwent a transformation around 1830, with lower cohabitation attributable to changing opportunities to leave home for heirs. 34 A recent study based on the 1868 population census notes that single-family households became prevalent in the Hungarian provinces and Transylvania, reaching around 70% of registered households. 35 This societal change was the result of a wide variety of behaviors related to different settlement types and particular social, ethnic, and religious contexts. 36 For instance, Jews tended to live in nuclear family households, while Lutherans and the Orthodox were more likely to live in complex households. Farmers, especially those who owned land, lived more frequently in complex households than did artisans or non-manual workers. 37 In Buda and its surroundings, the nuclear family was more frequent than in other regions such as the southern trans-Danubian areas or the northern regions near the present-day border with Slovakia. 38
Meanwhile, the percentage of simple-family households in the Italian provinces varied roughly between 60% and 75%. This percentage was higher in Friuli, slightly lower in Tyrol and Lombardy, and more variable in Venetia. 39 Furthermore, Italian provinces differed between the alpine regions and plains areas in terms of prevalent types of household formation. 40 In particular, the former were characterized by smaller properties, which communities tended not to divide among heirs. As a result, children were likely to reside with their parents even after marriage. Yet there were also differences based on the management of livestock: neolocality prevailed where it was handled by the community, whereas households tended to be more complex if the animals were controlled by the single families. In contrast, properties in the plains were bigger and households therefore tended to be nuclear with greater frequency. However, here as well differences in forms of co-residence were connected to social status and forms of production. As in Hungary, landowners and sharecroppers resided more often in complex households, while day laborers tended to dwell in single-family households. 41 Nevertheless, scholars agree that household composition also depended largely on the age of household heads, on the life cycle of its members and also on demographic factors that influenced the number of surviving children a couple could have or the chance for a young son to have living parents. 42 Thus, the general trends described above are fluid and change over time even within the same socio-cultural and geographical context. 43
The inheritance systems in the Italian and Hungarian provinces also shared certain similarities. Inheritances were split among all male children in Hungary and Transylvania, meaning that sons received equal partitions of family property and had the same means to form and maintain a new family. Daughters generally had the right to a dowry. 44 In the Italian provinces, the situation was more fluid. Primogeniture prevailed until the mid-eighteenth century, when it then entered into crisis, and was subsequently abolished under Napoleonic domination. 45 Though primogeniture did allow large patrimonies to remain intact, it also created conflicts among siblings and often had the effect of bringing to an end certain families, particularly during the second half of the eighteenth century, when marriage rates among second-born sons fell. The Napoleonic Code (Code civil des Français), furthermore, established that all children, male and female, could inherit equally. Even though the Italian states that were subject to French rule largely recovered the legislation that had been forcibly repealed under the Code, the practice of one child receiving the full inheritance faded. 46 Parity among male and female children, though, did not become the norm. As daughters were granted a dowry, they were generally excluded from inheritance.
The relatively high percentage of single-family households found in these regions and the practice of all male children receiving equal inheritance suggests that neo-locality was quite widespread. This can be linked to the younger age at marriage and higher nuptiality rates that emerged in these areas compared to the alpine provinces of Austria and Tyrol. Here in fact, the lower marriage rates and higher age at marriage indicated in the Tafeln (Figure 3 and Table 2) can be explained by differences in marriage systems and household formation in these provinces. In particular, the marriage pattern and system of inheritance, known as the “Alpine marriage pattern,” distinguish these areas from the other Länder of the Empire. 47 Impartible inheritance thus prevailed (Carinthia, Lower and Upper Austria, and Tyrol), meaning that only the first son was to inherit all property, while the other siblings would receive certain amounts of money, often small. They could try to improve their lot by marrying a heir or heiress, or they could become servants to their older brother, migrate, or make a living through trade. 48 With the rise of industrialization, however, some trades disappeared, leaving no opportunities to gain extra income aside from inheriting property. Attempts to stabilize properties resulted in limitations to marriage, and a consequent increase in unmarried people as well as a higher average age at marriage. In addition, adherence to the rule of primogeniture became stricter, making it more difficult for couples to marry if they did not own a house or have a regular income. 49
The system of impartible inheritance in these regions was connected to two household models: the traditional stem family, where the oldest male has power over other household members, and the so-called Ausgedinge household, where the inheriting son becomes the head of the household. In this latter system, documented in northern Austria, elderly parents would sell the farm to the heir and go into retirement. 50 As Berkner 51 has shown, the age of inheriting sons at marriage was negotiated so as to neither force parents to retire too early nor to oblige sons to marry too late. Nonetheless, it did result in men marrying at quite late ages. The two systems, the traditional stem family and Ausgedinge, coexisted in these regions and were flexibly adapted to cope with issues of supply or temporary crisis through reducing marital fertility, using marriage restrictions, or other methods. 52 In Lower Austria, however, 51% of cottagers and 18% of peasant farmers found a new place of residence separate from their parents. Meanwhile, in Upper Styria the number of farms and, as a result, the number of active full-time peasant farmers scarcely changed from the 16th century until the abolishment of the manorial system in 1848. 53 The limitations on marriage imposed in these regions can explain the high mean age at marriage in the Austrian Länder. 54
Bohemia, Moravia, and Silesia had a similar inheritance system to the Austrian alpine provinces. However, this area was the most industrialized of the Empire, 55 meaning that inheritance was not the only determinant of livelihoods allowing young couples to start a new family. In northeastern Bohemia, a combination of agriculture and textile production offered work to several generations within the same household. Nuclear households prevailed in the more industrialized areas of Moravia, such as the Ostrava region, especially among Jewish families. 56 For these reasons, marriage trends were closer to those found in Hungary, Transylvania, and the Italian provinces, with age at marriage somewhat in-between these aforementioned regions and the Austrian alpine areas.
The Military Frontier is at the other extreme, with very high marriage rates and the lowest age at marriage for both males and females. This may be, at least partially, the product of the particular family system that was prevalent in the province, characterized by the migrations and tensions that marked the region. During the Turkish invasion of the Balkans in the 17th century, groups of Serbs moved across the borders of the Empire and settled in this area, seeking protection. In 1627, it became an autonomous province, and promoting immigration by Serbian groups was endorsed to create a buffer area against Turkish expansion. Although zadruga households are no longer considered to have been the predominant family structure in the Balkans, 57 they do seem to have been quite widespread in the militarized frontier area at the beginning of the nineteenth century. 58 In these households, properties were inherited by male siblings, but they remained undivided since brothers would live in the same household with their wives and children, managing the land together. This resulted in the formation of sizeable multi-unit households in which children could be a useful workforce, particularly when adult males were involved in wars. Zadruga households were thus in part developed as a defense strategy against recurrent military attacks. Women along with older and younger members of the household, would help protect the home. 59 As the later census of 1953 testifies, this area was still characterized by subsistence agriculture hundreds of years later, tilled with underdeveloped technology, and extensive cattle breeding, which was most easily maintained under the zadruga system. Zadruga were divided only when its members became too numerous, in which case the latter formed smaller inokosna, which would once again become zadruga as their descendants grew in number over time. 60 This type of organization can explain the early age at marriage, as well as the higher nuptiality and fertility rates in this region. 61
Indubitably, the different trends in nuptiality, household structures, and marriage systems in the Empire’s macro- and microregions also had an influence on fertility, a topic we turn to in the next section.
Fertility
Birth Rates
We are able to use the data from the Tafeln to construct crude birth rates for individual years for each Land in a manner analogous to the construction of marriage rates in the previous section. The results are indicated in Figure 4, which also includes calculated rates for the years 1819 to 1828, in addition to the 1828 to 1865 period. Table 4, meanwhile, contains averages and trends for each Land over the latter period only.

Birth rates (‰) in the Länder of the Austrian Empire, 1819–1865. (For the names of the Länder, see Figure 1).
Means of Live Births, Birth Rates, Illegitimacy Ratios, and Marital Fertility in the Länder of the Austrian Empire, 1828–1865.a
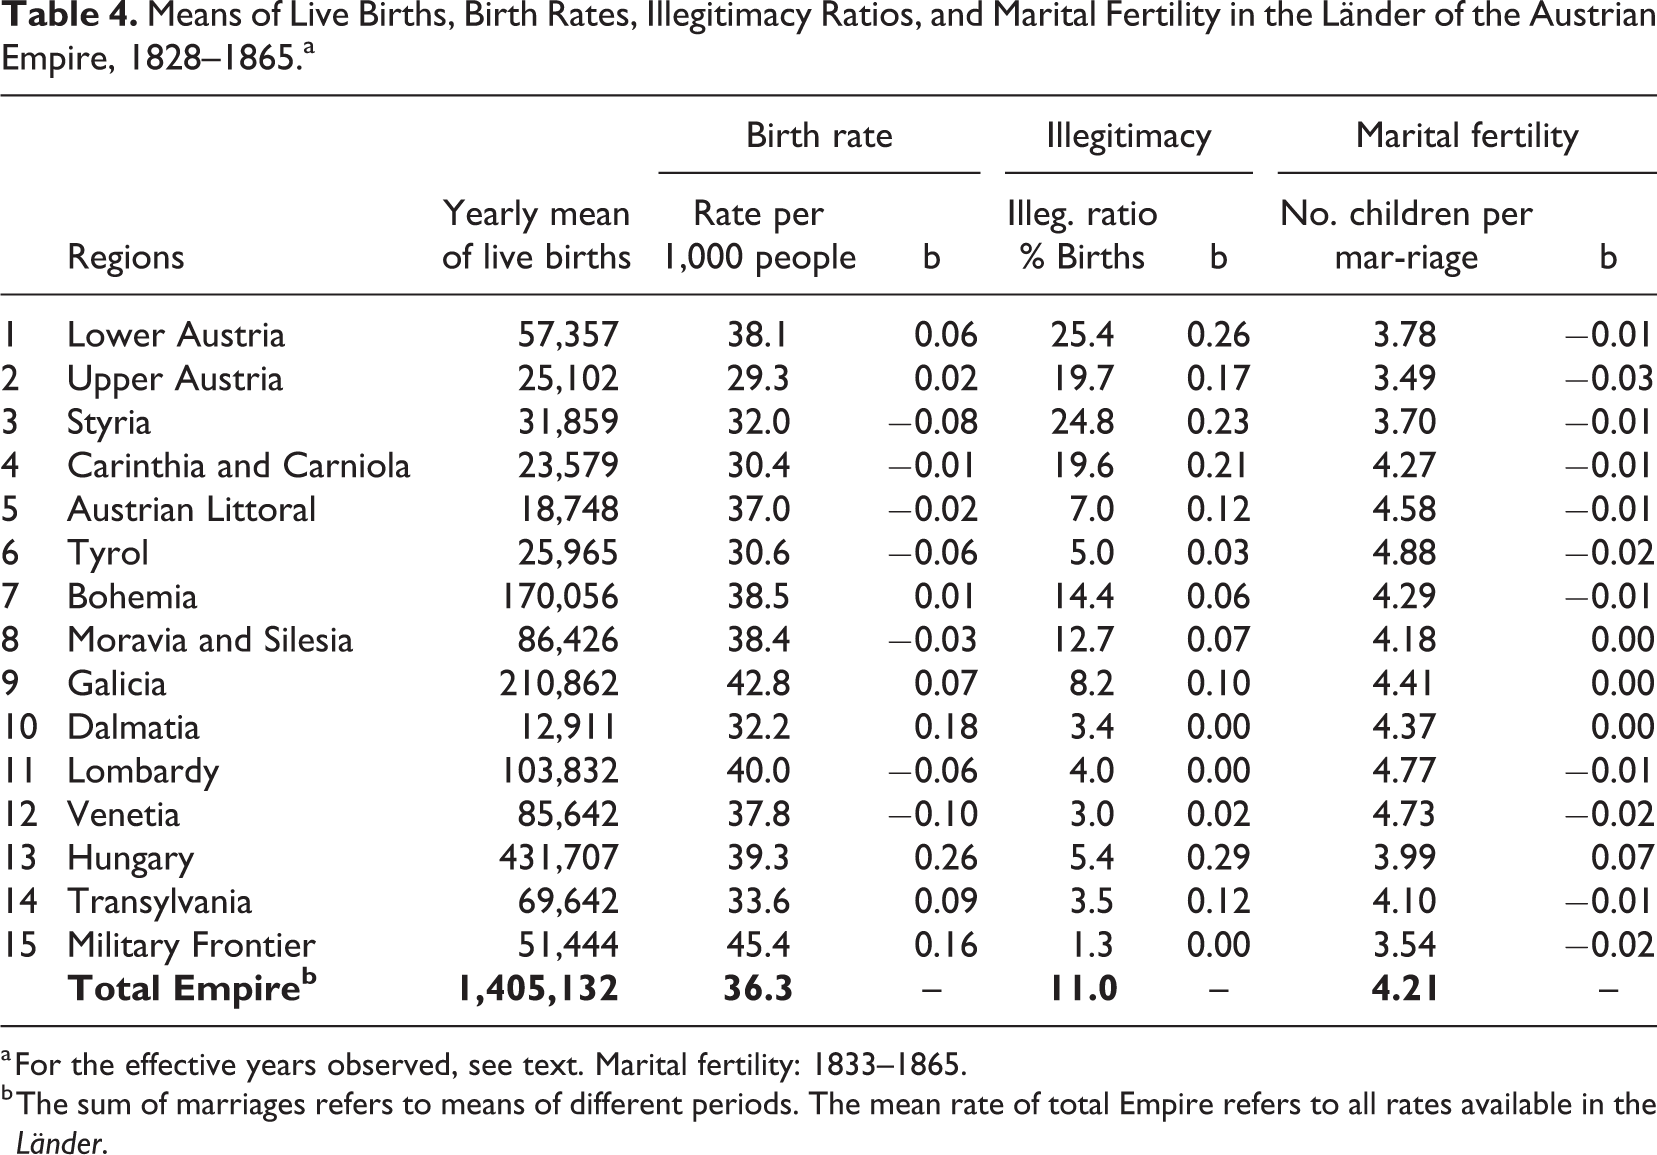
a For the effective years observed, see text. Marital fertility: 1833–1865.
b The sum of marriages refers to means of different periods. The mean rate of total Empire refers to all rates available in the Länder.
Indeed, though the earlier period shows rates consistent with successive periods, we disregard these numbers as they may be skewed by an erroneous estimation of the denominator population. Generally, birth rates seem to differ greatly from region to region. The central European Länder of Upper Austria, Styria, Carinthia and Carniola, and Tyrol maintain a steady rate of 30‰, while the Austrian Littoral, Bohemia, Moravia and Silesia, and Venetia fluctuate between 35–40‰. Meanwhile, some Länder have values approaching or even exceeding 40‰ (Military Frontier, Lombardy, and Galicia). In examining the parameter of interest (b) over time, we see that certain Länder are characterized by an upward trend. These are Military Frontier, Transylvania and, most notably, Hungary and Dalmatia, where there is a mean increase of 1‰ every four to five years. Seven Länder show a slight negative trend, though there is no indication of a decisive decline in birth rates during this period.
Here, we must ask ourselves whether values ranging from 45 to 50‰ are plausible, such as those found in Hungary and Dalmatia. The same might be asked of the birth rate of Dalmatia, which fluctuates from 30‰ (1828–53 mean) to 36‰ (1854–65) in just a few years, or in Hungary, which increases from 36‰ (1828–40) to 40‰ (1841–53), to 43‰ (1854–65). Military Frontier seems to undergo a similarly drastic change, from 45‰ (1828–53) to 48‰ (1854–65). Such large oscillations over a short time period are cause for some suspicion. That said, the nearly universal decreases during crisis years are credible. These include declines in 1848 and 1855, when cholera spread to almost all regions of the Empire.
The variability of birth rates is a notable feature of these data with a total variance (σ 2 ) of 29.0. This is quite a bit higher than the total variance of nuptiality (3.4, Table 3). However, since the reference values are different, the variability coefficient (CV = σ/M) provides a more meaningful comparison: this measure is, in fact, lower for fertility (0.15) than for nuptiality (0.23).
Variability in fertility is far higher between Länder than that within Länder (residual), accounting for over three-quarters of total variance over the forty years of observations. This indicates that beyond real or suspected variability within the individual Länder, it is clear that each Land had its own distinguishing character resulting from various social, historical and anthropological factors. Though we observed this pattern above relative to marriage, the differences in fertility between Länder are even greater. In any case, there is a close correlation (r = 0.88) between the average rates of marriages and births among all 15 Länder. The clearly different trends between the Länder suggest that these macro regions can be considered as proxies of the complex intersection of components that determined fertility, marital fertility and nuptiality. In fact, as has been shown, each Land had its own specific social system and cultural and linguistic setting that indubitably impacted behaviors, beyond the socio-economic factors identified at the micro-level. 62 Indeed, each Land corresponds to markedly different language groups, and behavioural divergences according to linguistic characteristics have often been interpreted as the result of variance in the ease of information flow. Moreover, it is not simply knowledge of (or conversely the inability to understand) a language that condition a person’s adherence to that group’s norms or commitment to a particular set of social relations, but rather one’s identification with a linguistic group. In fact, scholars have viewed the different Länder as so distinct to this regard that it would be more appropriate to view them as separate countries. 63 And in fact, as mentioned in the introduction, the new states founded after the dissolution of the Austrian Empire, in the aftermath of the First World War, often reflected the character of different provinces of the Empire.
Table 5 provides a comparison with other European countries. The Austrian Empire has the highest birth rates, closer to those of Finland and Germany (36‰) than to other northern countries (Belgium, Denmark, Norway, Sweden, the Netherlands, England, and Wales), where birth rates were already lower in the mid-nineteenth century. None of these countries, except for France, experienced a continuous decline in fertility. Data from the Tafeln confirm the view generally held by scholars, namely that the fertility transition in most of the territories of the Habsburg Empire only began from the end of the nineteenth century. Nonetheless, some pockets of low fertility have been identified by scholars, though they are blurred or invisible in our data collected at the macro regional level. For instance, in some south Trasndanubian provinces of Hungary, fertility decline (clearly related to marital fertility control) already appears at the beginning of the nineteenth century. 64 Similarly, in several areas of South Styria fertility decline occurred earlier compared to other regions, starting in the second half of the nineteenth century. These behaviors have been explained by the fact that properties were small and a high number of children was not affordable, especially as large-scale emigration had not yet begun. Conversely, areas such as northern Styria or the Hungarian Great Plain were characterized by bigger properties and hence children were needed as source of labor. 65
Birth Rates in European Countries Over Selected Periods.
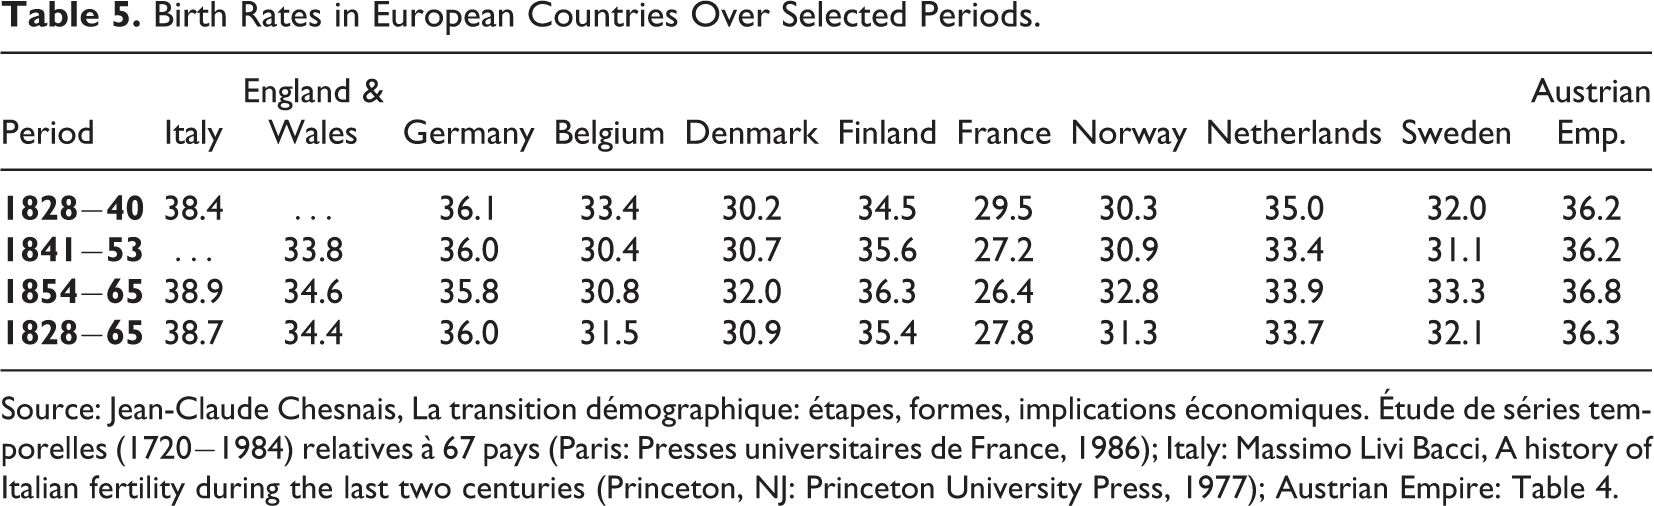
Source: Jean-Claude Chesnais, La transition démographique: étapes, formes, implications économiques. Étude de séries temporelles (1720−1984) relatives à 67 pays (Paris: Presses universitaires de France, 1986); Italy: Massimo Livi Bacci, A history of Italian fertility during the last two centuries (Princeton, NJ: Princeton University Press, 1977); Austrian Empire: Table 4.
The more industrialized areas of Moravia and Bohemia do not, instead, seem to have experienced a more rapid decline in fertility than agricultural regions. 66 This was likely due to the proto-industrialization phase of these areas, which created new structural options to marry, form a household, and have legitimate children, particularly for those for whom this had previously been more difficult. The beginnings of industrialization might thus have represented an opportunity to earn money and afford a family, at least until the economic cost of children became too high. 67 It would therefore seem, as similarly observed in France, that the first incentives to limit fertility did not come directly from industrialization but rather from the need to contain property fragmentation in certain rural areas. Nevertheless, such cases represent the forerunners of fertility decline, it would still be several decades before fertility control was adopted by the rest of the population and becomes visible at the macro level in all the areas belonging to the Monarchy. 68
Illegitimate Births
The available data further allow to examine two particular aspects: the illegitimate birth ratio and marital fertility. Indeed, the Tafeln include information on birth legitimacy for almost the entire period. 69 Given the norms of the era and the different consideration of children born within as opposed to outside of wedlock, the data is viewed as relatively precise. The frequency of illegitimate births considerably differs across the Empire. Using a ratio of illegitimate births to total live births, this figure ranges from a very low 3% to over one-quarter all births (Table 4 and Figure 5). There appears to be a clear divide between Länder with illegitimacy ratios of over and under 10% respectively. A distinction that also has a clear geographic distribution; the central part of the Empire having the greatest frequency of births outside of marriage (Bohemia, Moravia and Silesia, Lower and Upper Austria, Styria, and Carinthia and Carniola), whereas in the southern part of the Empire, from west (Lombardy, Venetia, and Dalmatia) to east (Military Frontier, Transylvania), 70 figures are lower.
The trends are equally interesting. Figure 6 shows that this ratio increases in Länder generally characterized by high levels of illegitimacy, rising by 0.20%–0.25% annually in Lower Austria, Styria, and Carinthia and Carniola for an increase of nearly 10 percentage points over the nearly forty years of observations. The increase is so steady that a linear regression shows a remarkably good fit (r = 0.8–0.9). Conversely, Länder with lower levels of illegitimate births show nearly no variation in this ratio over the study period. The relationship between the rate of increase (coefficient b) and the mean level calculated for the regions is r = 0.45.
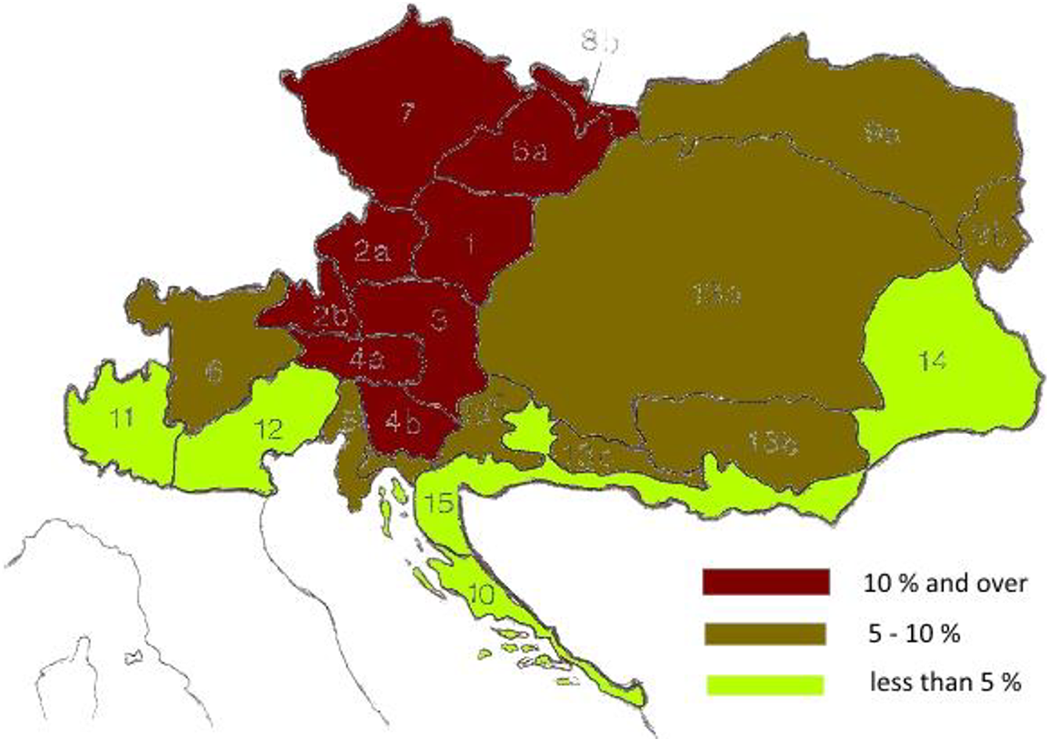
Mean illegitimacy ratio (%) in the Länder of the Austrian Empire, 1828–1865.
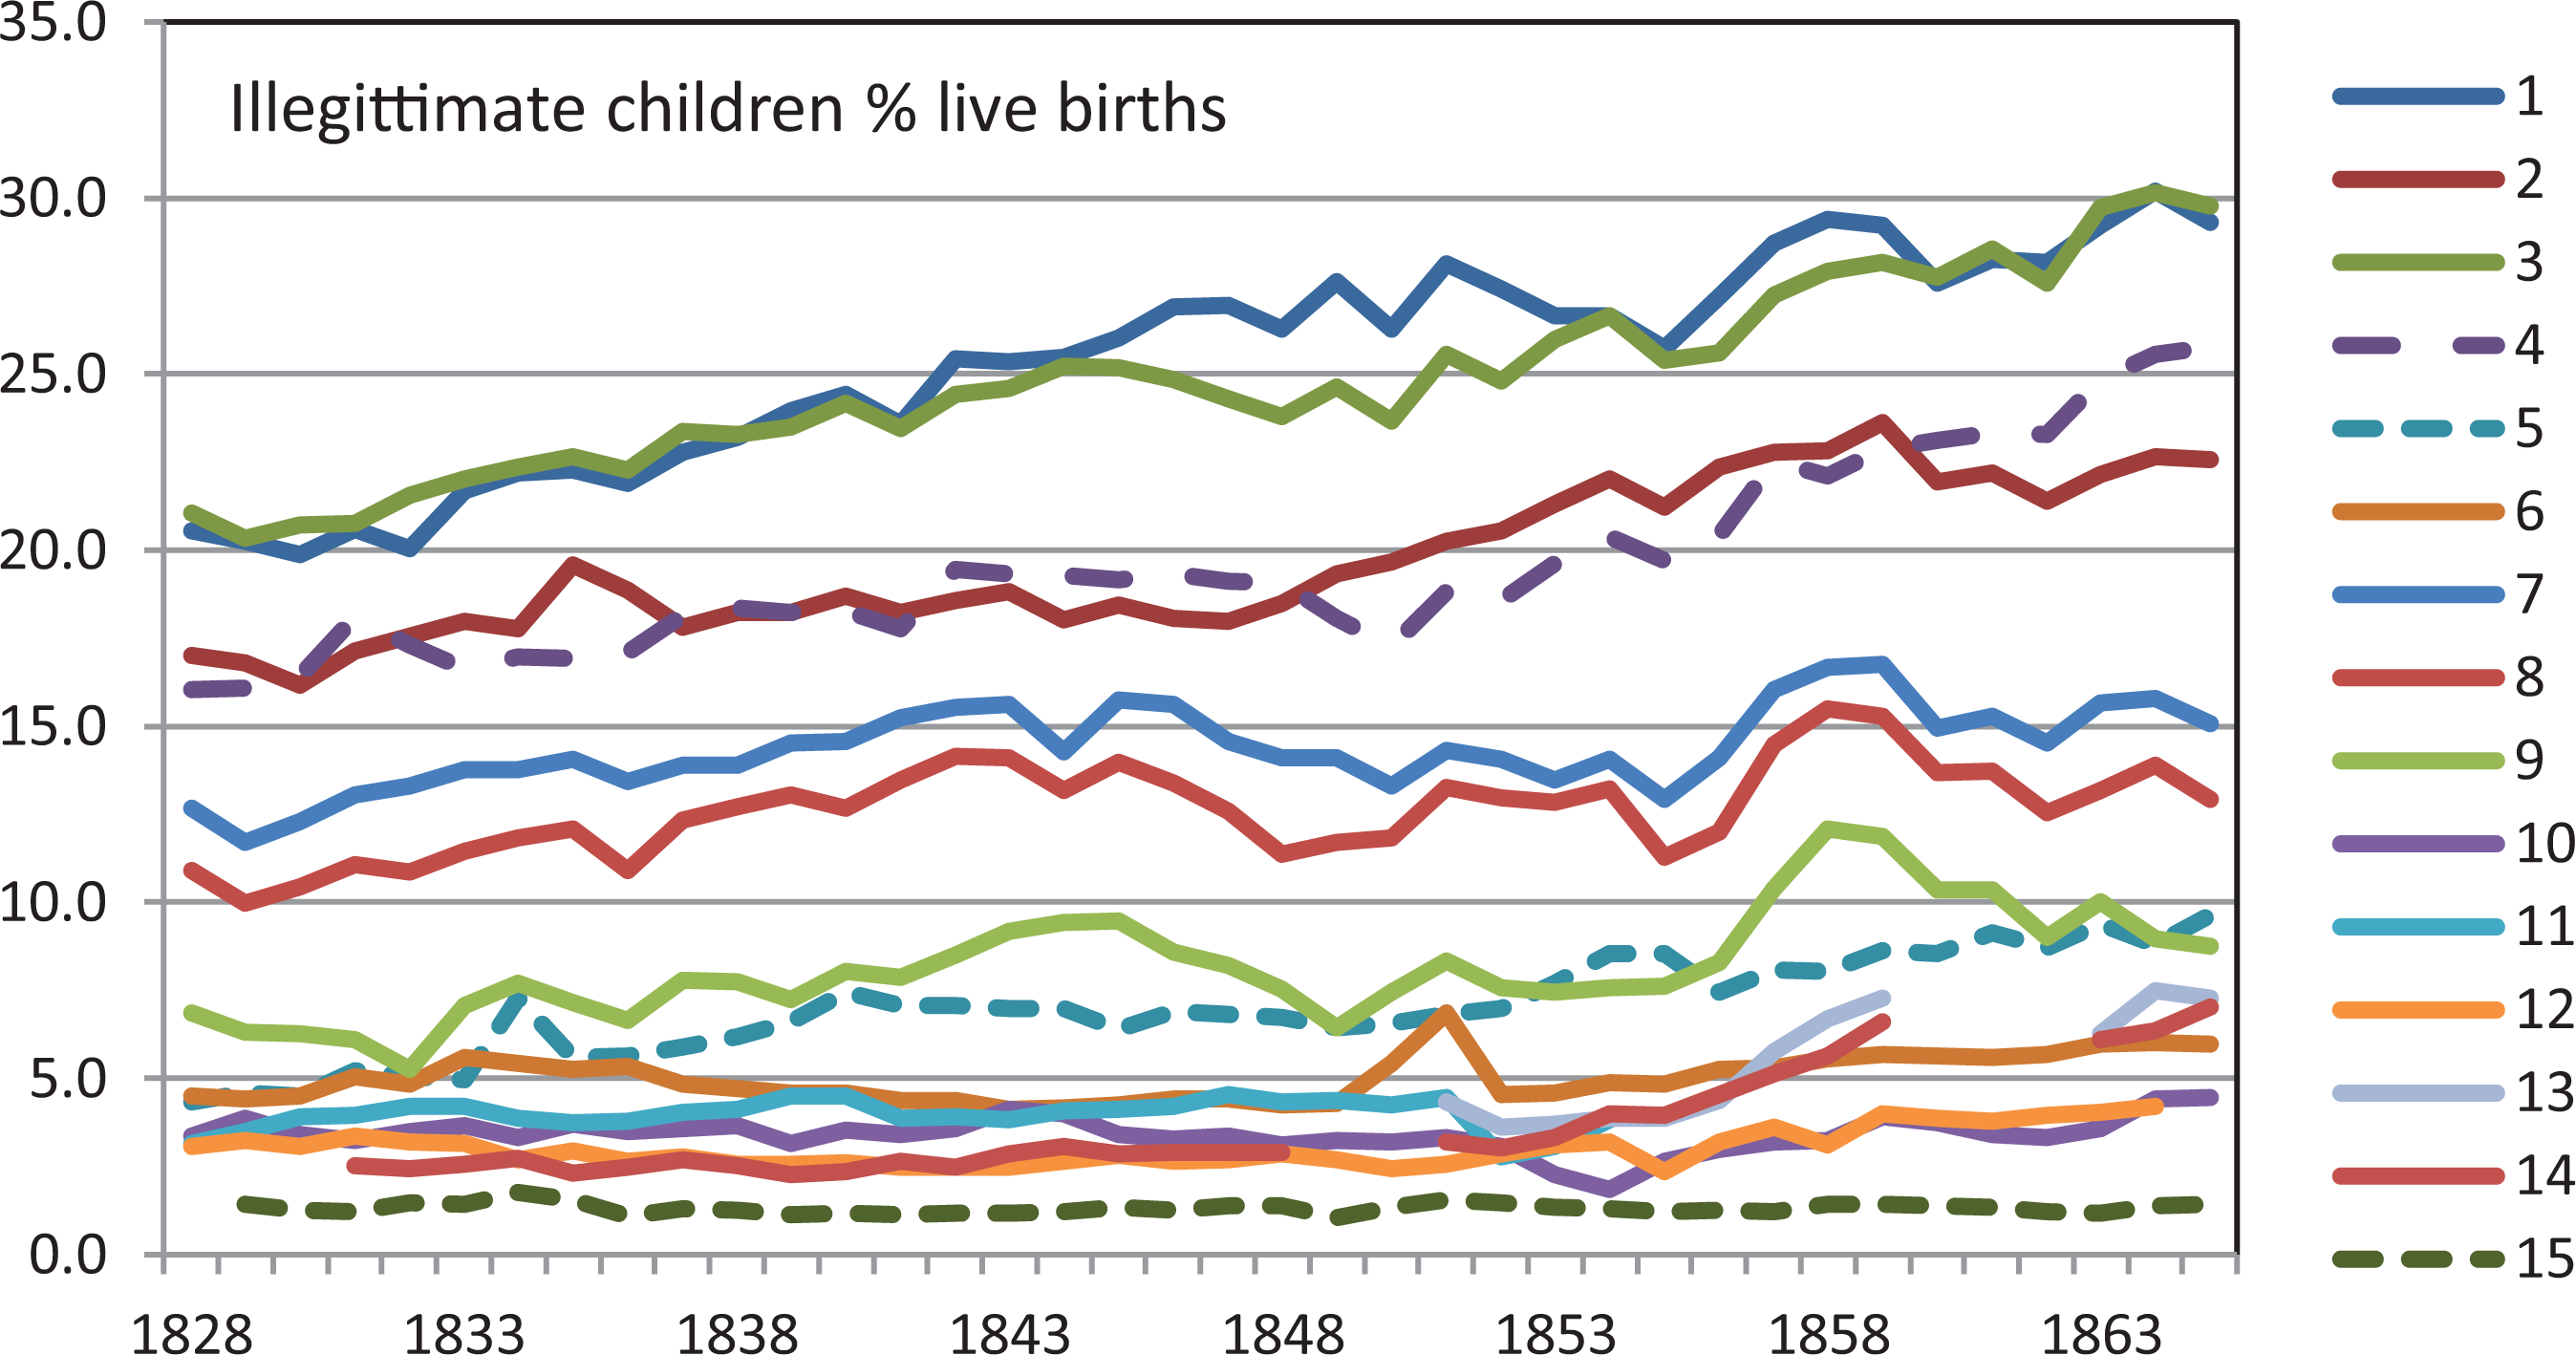
Illegitimacy ratio (%) in the Länder of the Austrian Empire, 1828–1865. ( For the names of the Länder, see Figure 1).
Hungary presents a special case due to the fragmentary nature of its data, which are available for only twelve non-consecutive years. Here, the initial ratio is low (5.4%) and rises over time, yet both the level and trend of these data are open to scrutiny. Transylvania is another anomaly due to different interruptions in the data. Here as well, the mean is extremely low (3.5%), but with a rising trend.
The mean illegitimacy ratio is 11% for the Empire as a whole. As expected, overall variance in this ratio is almost entirely due to differences between Länder (93% of total variance) as opposed to within them (Table 3).
Finally, there is a noticeable, though weak, negative relationship (r = −0.475) between the illegitimacy ratio and marriage rate, calculated using the mean values of each of the 15 Länder. Where illegitimacy is lower, marriage is higher and vice-versa, as might be expected.
Illegitimacy in general became quite widespread in Europe during this period as a result of changes brought about by the Industrial Revolution. Around the mid-nineteenth century it was at 6% in England, 7% in France, 12% in Germany, 14% in Iceland, 11% in Denmark, and 9% in both Sweden and Norway. 71
Different explanations have been offered to justify the rising proportion of illegitimate children. On the one hand, migration towards towns increased the number of domestic servants, who were not permitted to regularly marry due to their obligations. 72 On the other hand, recent studies have shown that at least a portion of these illegitimate children were born and raised by couples not officially married. For instance, scholars have noted that firstborn children in several European regions at the end of the eighteenth century were three to four times more frequently illegitimate compared to all births. 73 The number of children born within eight months of marriage also increased during this period. Indeed, during the second half of the eighteenth century, an increasing number of births are the result of premarital conception, accounting for 37% of births in England, 18% in Germany, 10% in France, and about 5% in Tuscany. 74
Strict marriage rules, such as those in effect in some Austrian alpine regions, increased non-marital unions. As Fauve-Chamoux has pointed out, when impartible inheritance was the norm, the oldest sons took over the farm, while the other siblings could become his servants. Being landless and without dowry, servants could not marry locally and their children were born illegitimate. In regions where some additional income outside of agriculture was available, marriage was a possibility, but migration to cities was often preferred. 75 Migrants to towns often did not have the means to arrange an official marriage, leading them to frequently live in premarital cohabitation and marry at a later ages upon reaching sufficient economic affluence. Within the Habsburg Empire, towns had a higher proportion of unmarried individuals. According to Gruber, 70% of men aged 25 to 29 were unmarried in the cities of the Alpine provinces. 76 In Vienna, a mid-nineteenth century crisis in the textile industry (i.e., a major employer of migrants to the city), led much of its workforce to seek employment in small shops and handcrafts. Workers in these industries lived in the master tradesman’s house and thus remained unmarried. As a consequence, only one third of men in this working group were married in the 1850s. Due to these trends, 50% of children in Vienna were illegitimate in 1850. 77 The situation later changed with improvement in the economic situation.
The data from the Tafeln show a high level of illegitimate births in the Austrian alpine provinces. As described above, the dominant marriage pattern and household system in this region resulted in later ages at marriage. Peasants in this region were also strictly subjected to seigneury, whereby they required approval to marry. Amidst the economic changes of the Industrial Revolution, increasing importance was placed on obtaining the consent of the village representatives (i.e., those who owned a certain amount of property) for marriage, with decisions made along economic criteria. A certain level of wealth thus became necessary to obtain permission to wed, driving people lacking such means to resort to non-marital partnerships. This caused the number of illegitimate children to rise even higher in these regions, as shown in Table 4 and Figure 6. 78
Conversely, in Tyrol, which had an inheritance system similar to the Austrian provinces, peasants paid taxes but enjoyed relatively high personal freedom. They did not need to negotiate marriages, and obtaining consent was unheard of. Peasants thus had greater freedom to marry even without a given level of wealth, which may explain the lower percentage of illegitimate children in this Land. 79
The low proportion of illegitimate children in Italian Länder, as well as in Hungary, Transylvania, Galicia and Bukovina, can also be traced to the inheritance system that developed in these regions during the first half of the nineteenth century. As discussed earlier, sons in these regions inherited an equal partition of family property and therefore had the same means to form and maintain a new family. 80 However, partible inheritance in these regions, particularly in Hungary and Galicia, became problematic as the population grew during the nineteenth century, resulting in property fragmentation and out-migration.
Marital Fertility
The construction of any specific female fertility measures is impeded by the lack of classification of births by age of the mother, as well as of women by age. However, the method proposed by Gini (1932) does allow to estimate marital fertility even without births classified by year of marriage. The appendix briefly illustrates the procedure used. 81
Figure 7 shows the results our calculations for the 15 Länder. For ease of reading, we show simple three-term moving averages. This provides a more stable picture without losing sight of the levels and trends. The estimates start in 1865 and go back to 1833, though certain years are not included for individual regions due to missing legitimacy (Hungary) or marriage (Military Frontier, 1819–1828) data. On the whole, the average number of children is between 3.5 and 5.0 with the exceptions of Upper Austria and Military Frontier, in which the average number of births per marriage dips below 3.5 over the observation period, falling below 3.0 at one point. Generally, many Länder appear to undergo a slight decrease at the end of the 1840s, after which fertility recovers over the final eight to ten years of the period. This dynamic may be related to high mortality rates over the years 1847–1855, which saw widespread epidemics, an increase in widowhood, and new marriages between widowed spouses, as seen previously. Moreover, the upheaval caused by increased mortality may also have caused some distortion in the measures.
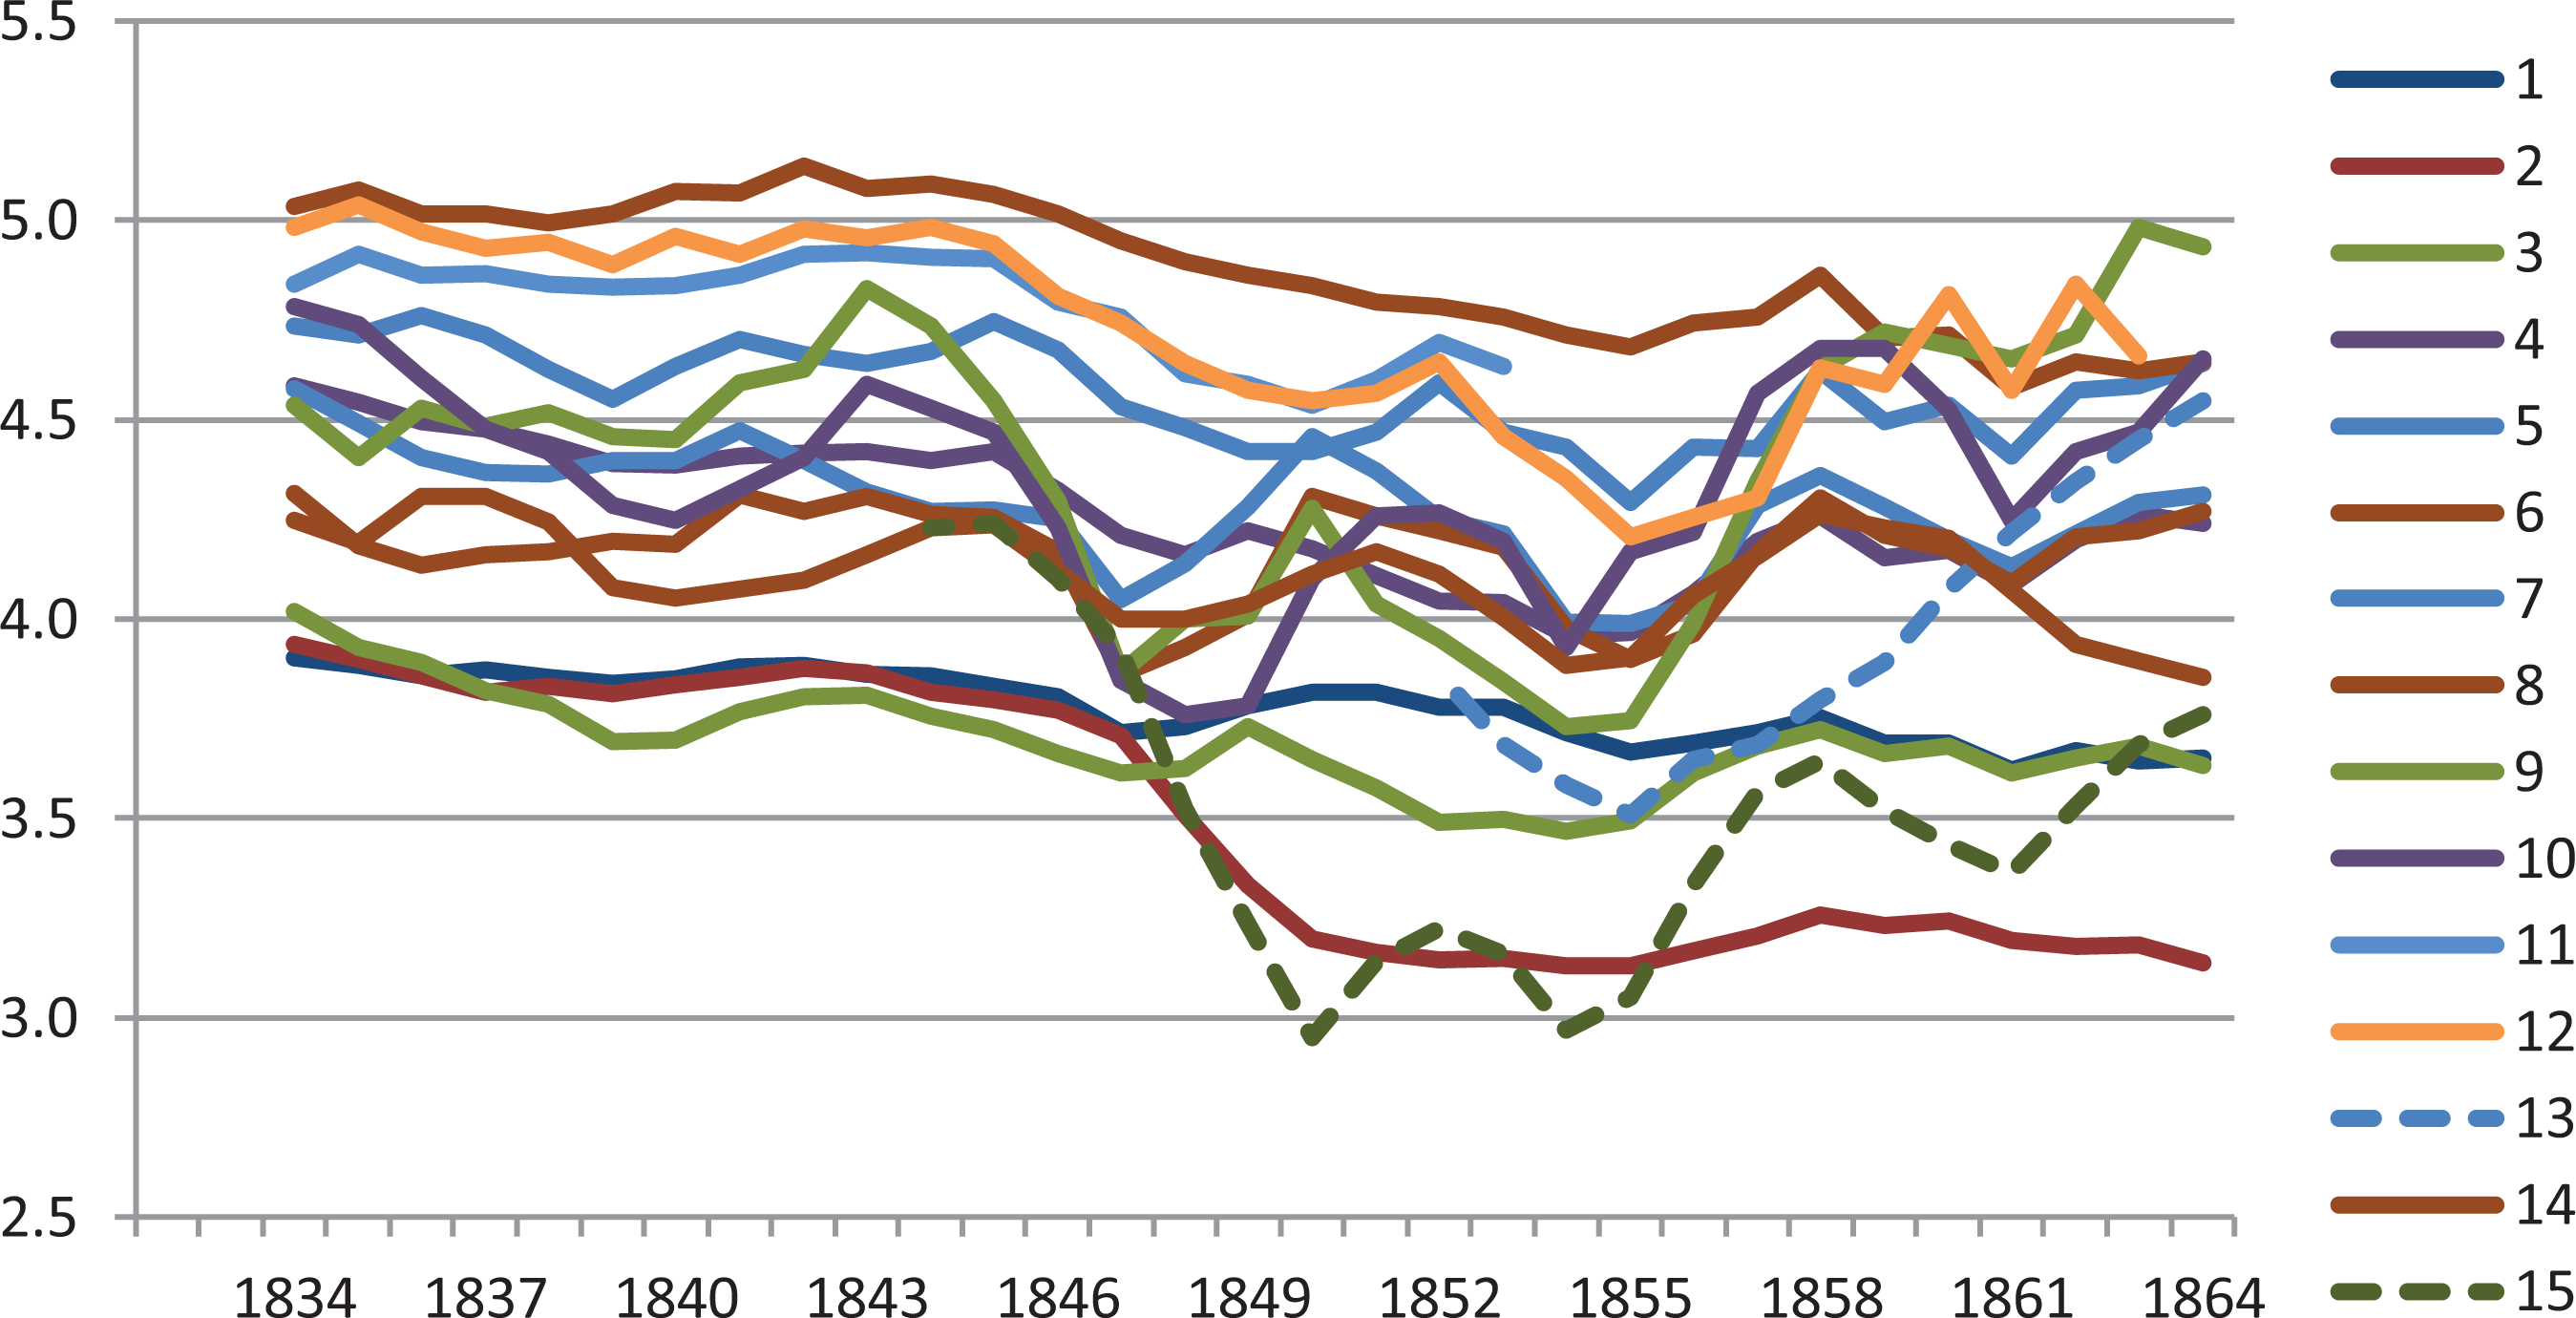
Number of children per marriage in the Länder of the Austrian Empire, 1834–1864. (For the names of the Länder, see Figure 1).
Table 4 summarizes mean values and trends. The Tyrol region shows the highest level of marital fertility with an average of almost 5 children, followed by the Italian Länder of Lombardy, Venetia and the Austrian Littoral (4.5–4.8). The lowest levels, ranging between 3.5 and 3.8, are found in Upper and Lower Austria, Styria and Military Frontier, although for the latter, older data from before 1843 are missing. Variations over the thirty-three-year period studied are often meaningful: some regions see a decrease in marital fertility in the central period which then increases, as in Galicia and Dalmatia (as well as in Military Frontier, though subject to the problem of missing data mentioned earlier). Variations elsewhere are less apparent, meaning that linear interpolation is unable to illustrate the dynamic (b is often zero or close to zero). Certain Länder, however, show a more decisive downward trend, namely Upper and Lower Austria and Styria, with lower overall fertility rates, as well as Carinthia and Carniola and Tyrol. 82 As elsewhere, most of the overall variance comes from that between Länder (72%; Table 3).
Finally, we notice possible relationships between marital fertility and other variables: there is a small negative link to marriage (r = −0.242), and a stronger, if still negative, one with the illegitimacy ratio (r = −0.483) (Figure 8). This last point is perhaps intuitive: although it is difficult to find a cause-effect relationship, it suggests that where marital fertility rates are high, the illegitimacy ratio is low. Conversely, where illegitimacy is high, the fertility rate of married couples is lower.
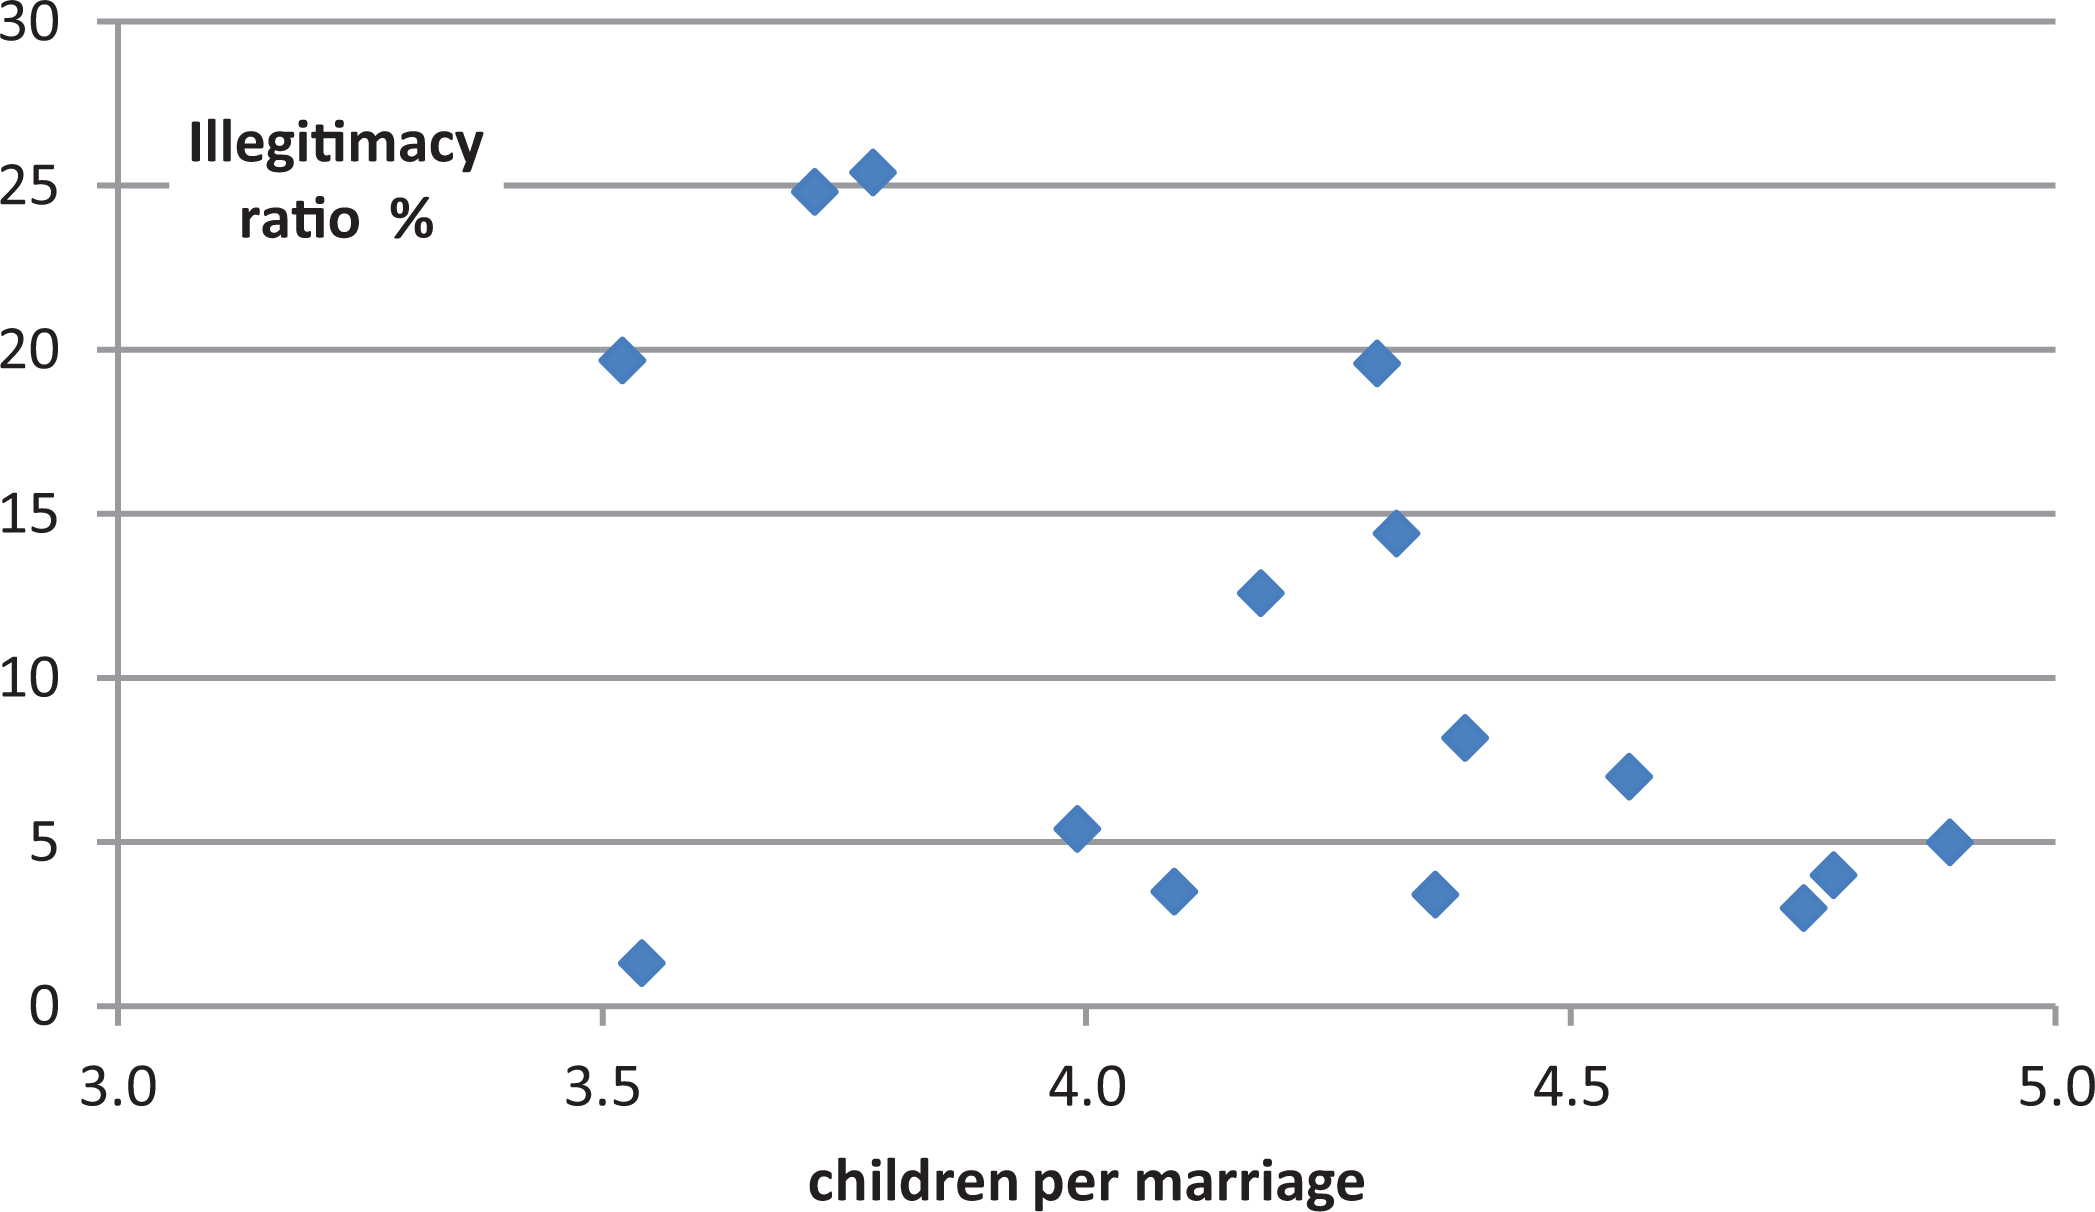
Mean number of children per marriage and illegitimacy ratio in the Länder of the Austrian Empire, 1834–1864.
This data can hardly be compared with that provided for other European regions, obtained by nominal record linkage using parish registers, a method different than that used here. One possible point of comparison is a study by Livi Bacci, which uses Gini’s method to estimate the average number of children per marriage in Tuscany. He finds marital fertility in this region to be 5.64 children per married couple in the period 1820–1824, decreasing to 4.69 in the period 1860–1864, thus reaching levels similar to those we find in the Italian provinces of the Habsburg Empire. 83 Note that the average number of children per marriage is a net rate, i.e. it is influenced by mortality (see Appendix), that could be different in the various Länder.
Conclusions
This paper presents the first attempt to consider the demographic data recorded in the Tafeln. We show that, with the exception of some areas such as Hungary, Transylvania, and the Military Frontier during specific periods, this source is generally reliable. Moreover, the Tafeln information is remarkable in that it offers a wide overview of a vast region of Europe, allowing for comparisons between its different regions, as we have undertaken in this study.
The trends in marriage, as well as legitimate and illegitimate births in the various Länder, allow us to identify macro regions characterized by a variety of behaviors. In particular, the central regions of the Empire and the Military Frontier were distinct from other regions. Notably, such variation can be explained by the different types of household organization, marriage, and inheritance patterns that have been identified by scholars as distinguishing features of the diverse regions of the Empire.
We show that different marriage and household patterns did indeed have an influence on spouses’ ages at marriage and nuptiality rates, as well as on fertility rates and levels of illegitimacy. The demographic data contained in the Tafeln thus lends important additional support to the social dynamics identified in previous research for these regions.
Footnotes
Appendix. Measuring Marital Fertility
In 1932, the Italian statistician Corrado Gini proposed a method for estimating marital fertility, in the absence of births classified by year of marriage. 84 With reference to any given year, t, a measure of legitimate fertility expressing the average number of children per marriage can be obtained using the sum of legitimate fertility rates per year of marriage:
(i being the duration of marriages, and z the maximum distance of the marriages still having children), where LB represents legitimate births, M marriages, the exponent is time and the subscript the year of marriage in which the children were born. Gini provides the following equivalent formula:
namely the ratio between legitimate births in a year and a weighted average of the marriages in which those children were born, called the virtual number of marriages. The weights wi should be obtained with legitimate fertility rates at the various durations of the marriage, divided by total legitimate fertility. The necessary classifications being obviously unavailable, Gini suggests using for the estimate of the weighted average of marriages a system of weights of another population with presumably similar behavior. This way, it suffices to have the historical series of legitimate births and of marriages to obtain, under certain conditions, an estimate of legitimate fertility.
This is what we propose to do here. In fact, it is widely believed that, before the demographic transition, the relative distribution of marital fertility according to duration, expressed by wi, was rather constant over time and space. 85 For this reason, a distribution of fertility by duration of marriage taken from nominative reconstructions has often been used — that found in Fiesole (Florence) among marriages of the period 1630–1680. Marital fertility is obviously quite high for the first year of marriage and declines slowly over a period of twenty years or more before it ultimately drops to zero. Following Gini’s suggestion, the function was first smoothed using a simple moving average procedure. This results in a fertility rate in the first year amounting to about 9% of the total, decreasing gradually over successive years, arriving at 1% at twenty years, and decreasing even further thereafter.
In order to correctly use the method, conditions require that the distribution of marital fertility by distance from wedding, though unknown, be reasonably similar to that adopted as standard; that it is not, for example, upset by exceptional events (e.g. wars, epidemics, famine) that cause couples to postpone having children or, in a period following a crisis, to recover lost fertility by intensifying births. Furthermore, it is necessary to verify that, during the period under observation, neither nuptiality nor the frequency of marriage dissolution substantially changes. Unfortunately, the confirmed presence of epidemics may have an effect on these variables. 86
With these precautions, which must be taken into account, we sought to calculate the average number of children per marriage for each Land, going as far back in time as feasibly possible. Births in a single year were thus related to average marriages of a certain number of previous years; the weights used went as far as twenty-eight years prior. For example, for the calculation of legitimate fertility in 1865, marriages from this year back to 1837 are needed; for 1864 marriages, from this year back to 1836, and so on. We did not encounter any problems until 1856, where the marriages from 1856 to 1828 are needed. For the previous years, we decided to also use, if perhaps of inferior quality, marriages of the period 1819–1828 recorded in the Tafeln edition of 1829. 87 This allowed to estimate fertility as far back as 1847 using marriage data from 1847 to 1819.
In order to further lengthen the estimation period of legitimate fertility, we used estimates of (unknown) marriages from earlier years, since the contribution of these marriages in calculating the virtual number of the denominator is very low. 88 For example, the weight on the total marital fertility of marriages of over twenty years is less than 4%, while that on marriages fifteen years or older is only 14%. Therefore, to estimate the number of marriages celebrated before 1819, we decided to use the simple average of marriages of the following ten years, going back year by year for an additional fifteen years. Because of these estimates, the importance of which increases as we go further back in time, we established a threshold of 15%. This means that calculations are suspended when the estimate of the weight of missing marriages exceeds this percentage. This enables us to make estimates of marital fertility as far back as 1833. 89 Marital fertility figures from these very early years should, however, be viewed with extreme caution.
Declaration of Conflicting Interests
The author(s) declared no potential conflicts of interest with respect to the research, authorship, and/or publication of this article.
Funding
The author(s) received no financial support for the research, authorship, and/or publication of this article.