
Abstract
Little is known about the reproductive behavior of the population in insular Greece because of the lack of reliable and unintermittent time series of vital statistics. By applying methods used in historical demography and by indirectly estimating demographic indexes from census returns we try to overcome data scarcity. Substantial differences were found between the islands and mainland Greece. Differences were also found between different groups of islands, with the North Aegean being more conservative as far as the procreative ethics are concerned. Out of wedlock childbearing is less common in North Aegean islands than in Dodecanese or in the Cyclades.
Keywords
Introduction
Although countries in Europe have already undergone the second demographic transition, a lot of things are still unknown about the first demographic transition at regional level. As far as Greece is concerned the main problem in the study of fertility is the lack of reliable and non-intermittent data series before the 1950s. From 1830, when the modern Greek State was established, until nowadays, the first published statistics of vital events refer to the period 1860–1891, and they are of poor quality due to under-registration of births (and to a lesser extent that of deaths). There are certain periods with no published vital statistics either due to political turmoil (1861–1863), or due to the fact that the statistical system was not functioning (1886–1920 and 1940–1949). Even in the twentieth century the quality of the published vital statistics was poor due to under-registration of births up to the mid-twentieth century, apart from the 1930s where the coverage of birth registration was almost universal. In the early 1920s, when the Statistical Service of Greece started publishing vital statistics again, after a long period of interruption, the under-registration of births amounted to 24 percent. 1
At national level a lot of work has been done by Greek demographers to reconstruct the demographic history of Greece. 2 As far as the reproductive behavior at regional level is concerned, there are numerous studies for populations of mainland Greece (indicatively 3 ), but for insular populations the relevant bibliography is restricted to few case studies of small islands. 4 This paper focuses on a greater area of Greece (greater than individual islands or villages), namely the Aegean Archipelago. It tries to overcome the lack of data and to estimate marital and total fertility in the Aegean islands by resorting to methods used in historical demography, and by indirectly measuring Total Fertility Rates and Total Marital Fertility Rates from census data.
Methodology and Research Questions
The islands of the Aegean Sea are grouped into three clusters (Figure 1): The North Aegean islands. The Dodecanese The Cyclades.
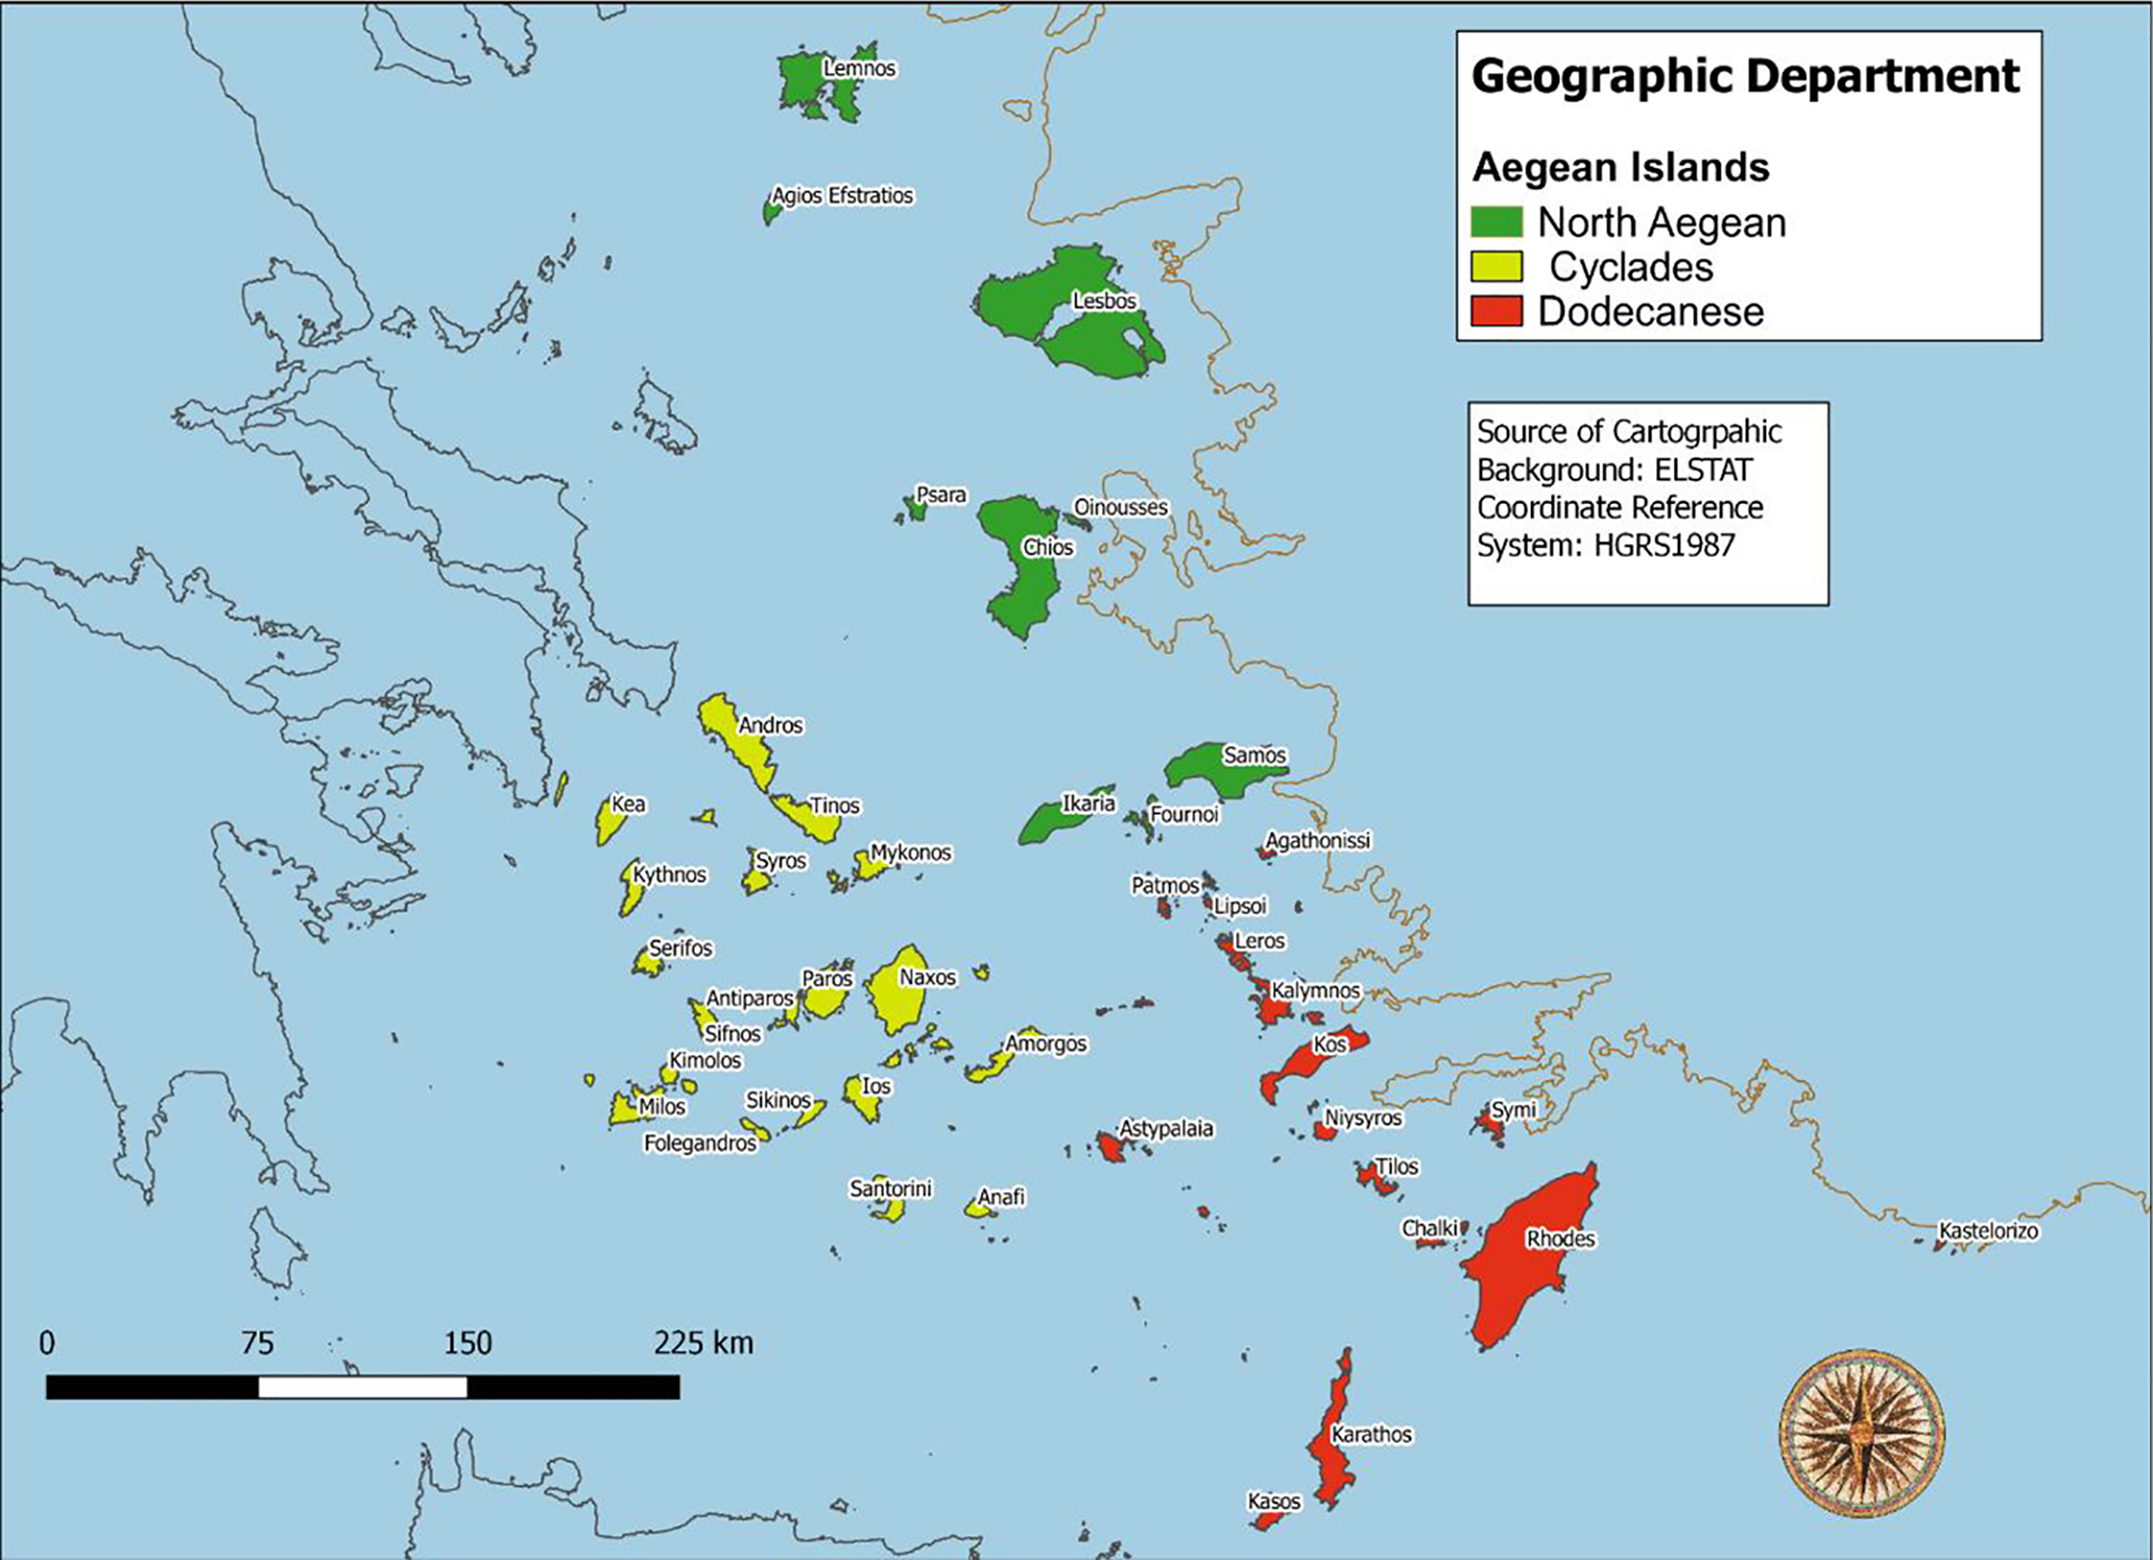
Study area. The Aegean Archipelago.
This grouping is based on geographical and historical criteria as well. The islands within each group have common geo-ecological characteristics and they are also connected by historical circumstances and by similar economic and developmental characteristics.
In recent decades, births have not taken place on small islands due to the absence of obstetric clinics. Even on the islands that there are such facilities (Rhodes, Lesvos, Chios, Samos, Syros), few women have chosen to give birth on the island. An obstetric clinic in mainland Greece is the choice of preference for the childbirth to take place. For that reason, the number of births used to derive demographic indices in this paper are as of the place of permanent residence of mother and not as of the place of occurrence of the event.
One of the most widely used indices of the reproductive behavior in demography is the Total Fertility Rate (TFR). This index gives the average number of births a woman would have during her reproductive life span (from fifteen to forty-nine years of age), if she experienced the Age-Specific Fertility Rates recorded in a certain year, that is the year of reference. To calculate a TFR one needs to have at hand births by age of mother and women of reproductive age by age-group. The Total Marital Fertility Rate (TMFR) is based on a similar rationale, but it takes into account only legitimate births and married women. To calculate a TMFR one needs to have at hand the legitimate births by age of mother and the married women of reproductive age by age-group. 5
From 1956 to 1979, the National Statistical Service of Greece had been publishing the number of births by age of mother and the number of females of reproductive age by five-year age groups (the data needed for the calculation of Total Fertility Rates) only for Greece as a whole and for the ten Geographical Departments of the country. From 1980 onward these data have been published down to the level of Districts as well. 6 To tackle the problem of lack of data, this paper attempts an approximation of TFR and TMFR (Total Marital Fertility Rate) by modifying some indices used in historical demography. More specifically, we have based our estimates on Coale’s indices of fertility, also known as the Princeton fertility indices. These indices were conceived by Ansley Coale and they were used in the framework of Princeton Fertility Project to document and record the fertility decline in Europe down to the level of county during the period of demographic transition. 7 Two of these indices, Coale’s index of overall fertility (If) and Coale’s index of marital fertility (Ig), were calculated and were transformed to the more widely used and easy to interpret TFR and TMFR. This transformation was thought necessary because Coale’s indices by themselves do not have any explicit reference to a precise unit of measure. They take values from 0 to 1, and they express the level of fertility of the examined population as a proportion of the fertility the same population would have had, if it had followed the fertility schedule of the Hutterites in the 1920s, which is the highest fertility schedule ever recorded in human populations. 8 In practical level, the problem that Coale’s indices of fertility try to tackle, is the lack of data on age of mother at birth. For the calculation of Coale’s index of overall fertility (If) the only data needed are the total number of births of the examined population and the age structure of the females aged fifteen to forty-nine. For the calculation of Coale’s index of marital fertility (Ig) the data needed are the number of legitimate births and the age structure of the married females in the reproductive age span (fifteen to forty-nine).
The fertility schedule of married Hutterites in the 1920s was published by Coale in 1971. 9 According to this schedule a female Hutterite who was married at fifteen years of age, was expected to bear 12.44 children per average if she survived until her forty-nine year of age. That was the value of TMFR (Total Marital Fertility Rate) of married Hutterites in the 1920s that resulted from the fertility schedule published by Coale and this value corresponds to a Coale’s index of marital fertility Ig=1. Moreover, due to their religious convictions, almost every woman in the Hutterite community got married at a young age and there was no childbearing out of marriage. Therefore, their marital fertility (TMFR) did not differ substantially from their total fertility (TFR). For this reason, we assigned a TFR=12.4 in the female Hutterites of the 1920s, which corresponds to a Coale’s index of overall fertility If=1. In this train of thought, Coale’s indices of fertility have been transformed to the more widely used and easy to interpret TFR and TMFR in the following way:


Where the subscript exp stands for the expected index in the examined population and the subscript Huts stands for the relevant index in the Hutterite population in the 1920s.
For the period that both the conventionally calculated TFR and the TFRexp can be calculated for Greece, that is from 1961 to 2016, differences between observed TFR (calculated with the conventional way) and TFRexp are very small, in the region of ±0.1 children per woman, as shown in Table 1. As far as marital fertility is concerned the deviation of TMFRexp from the conventionally calculated TMFRobs is greater because TMFRobs gives undue weight to the fertility of teenagers and young women. 10 Consequently, in populations where female age at marriage is relatively high (as it was always the case in the Greek islands and it is the case in Greece in recent decades), the conventionally calculated TMFR is extremely high. 11 However, if the age group fifteen to nineteen is omitted from the calculations, TMFR and TMFRexp are comparable (see Table 1).
Differences between Observed (TFR and TMFR) and Indirectly Estimated (TFRexp and TMFRexp) Indexes of Fertility.
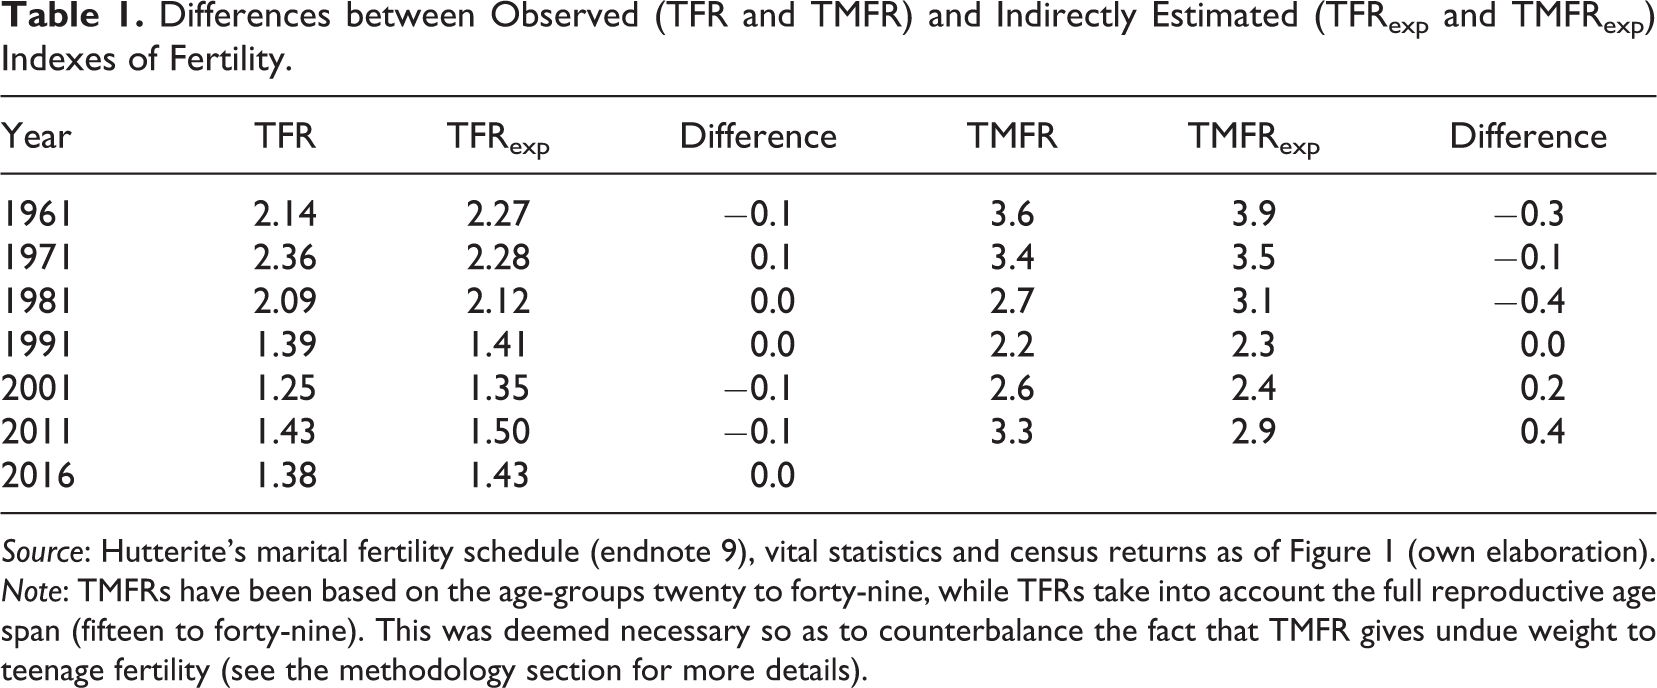
Source: Hutterite’s marital fertility schedule (endnote 9), vital statistics and census returns as of Figure 1 (own elaboration).
Note: TMFRs have been based on the age-groups twenty to forty-nine, while TFRs take into account the full reproductive age span (fifteen to forty-nine). This was deemed necessary so as to counterbalance the fact that TMFR gives undue weight to teenage fertility (see the methodology section for more details).
In general, the transformation of Coale’s indices to the more conventional TFR and TMFR can be used effectively in modern populations although it is better suited in populations that are at the early stages of demographic transition. 12
To examine why overall and marital fertility followed different trends in mainland and insular Greece, a cursory inspection of the different female marriage patterns is made. The description of marriage patterns is set in terms of a) Singulate Mean Age at Marriage (SMAM), calculated for the period 1907 to 2011 as suggested by J. Hajnal 13 , b) Coale’s index of marriage and c) female permanent celibacy, defined as the percentage never married by age fifty. For 2016 mean age at first marriage has been calculated from vital statistics. At a technical level the question that arises is whether SMAM can be used as an approximation of the mean age at first marriage. The computation of SMAM is based on the principle that age at first marriage corresponds to the average number of years spent in the single state by those who eventually marry. This measure is also based on the assumptions that no first marriages take place after age fifty and that there is a consistent fall in the proportion single with age. Its main drawback is that it describes the marital experience of a hypothetical cohort. The SMAM referring to a certain date will not be identical with the actual mean age at marriage (which is a period measure) unless marriage patterns have remained constant over the previous thirty-five years. If mean age at marriage changes over the years, the SMAM will not be an accurate measure of mean age at marriage. However, when observed over successive decades, SMAM reflects the actual trends that have taken place, although it does not give the level (age at marriage) with great accuracy.
The questions this paper tries to answer are: What was the course of fertility in the Aegean islands from the beginning of the twentieth century until the second decade of the twenty-first century? What are the differences among the three groups of islands (North Aegean, Dodecanese, Cyclades) and between the islands and Greece as a whole? Which determinants are accounted for these differences? Is the marital union still the predominant setting for giving birth to a child in the examined populations?
Results
Crude Birth Rates
A first glimpse at the reproductive behavior of a population can be deduced from the Crude Rates of Births (CBRs). Though this index is “crude”—that is, it is affected by the age structure of the population and therefore it is not suitable for comparisons between different populations—it gives us, however, an order of magnitude for the fertility level of the population. In pre-transitional populations (that is in populations where no birth control was practiced) CBR oscillated between thirty-five and fifty births per 1,000 people. In modern European societies CBR is around 10 percent.
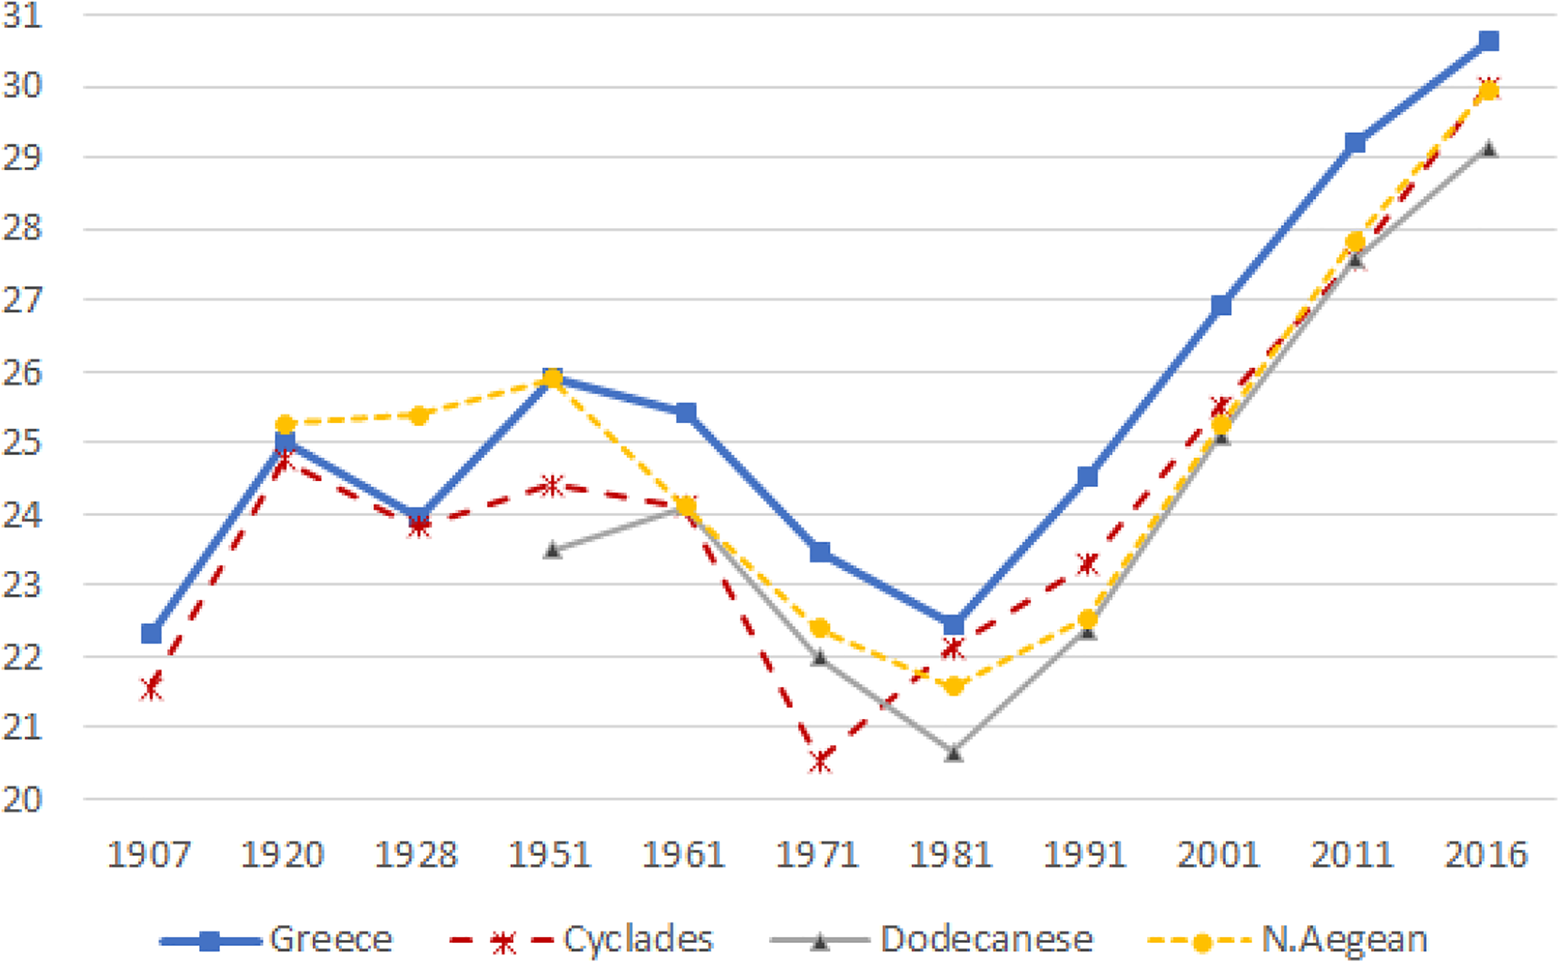
In the examined populations Crude Birth Rates oscillated at about thirty per thousand in the early 1920s but they increased significantly in the end of the 1920s especially in Greece and in the Cyclades (Figure 1). This increase in birth rates is bestowed by several demographers to the influx of 1.2 million refugees that flooded the country after the defeat of the Greek army in “Asia Minor” and the exchange of populations that took place between Greece and Turkey in 1923. 14 It is also known that the refugee population had relatively more men and women in the ages twenty to thirty-nine: 32 percent of the refugees aged twenty to thirty-nine versus 29 percent of the indigenous population. In the case of female refugees this percentage was even higher (34 percent vs. 30 percent of the indigenous). 15 This age structure might have allowed refugees to produce more births per 1,000 population than the indigenous Greeks. It is also a fact that Greece prior to 1922 had been deprived from the more dynamic and productive young men due to: 1) mass emigration of Greeks to transatlantic countries (mainly to the USA) in the period 1890–1920 and 2) continuous wars from 1912 to 1922 (Balkan wars in 1912–13, World War I in 1914–18 and the war in Asia Minor in 1919–22. 16
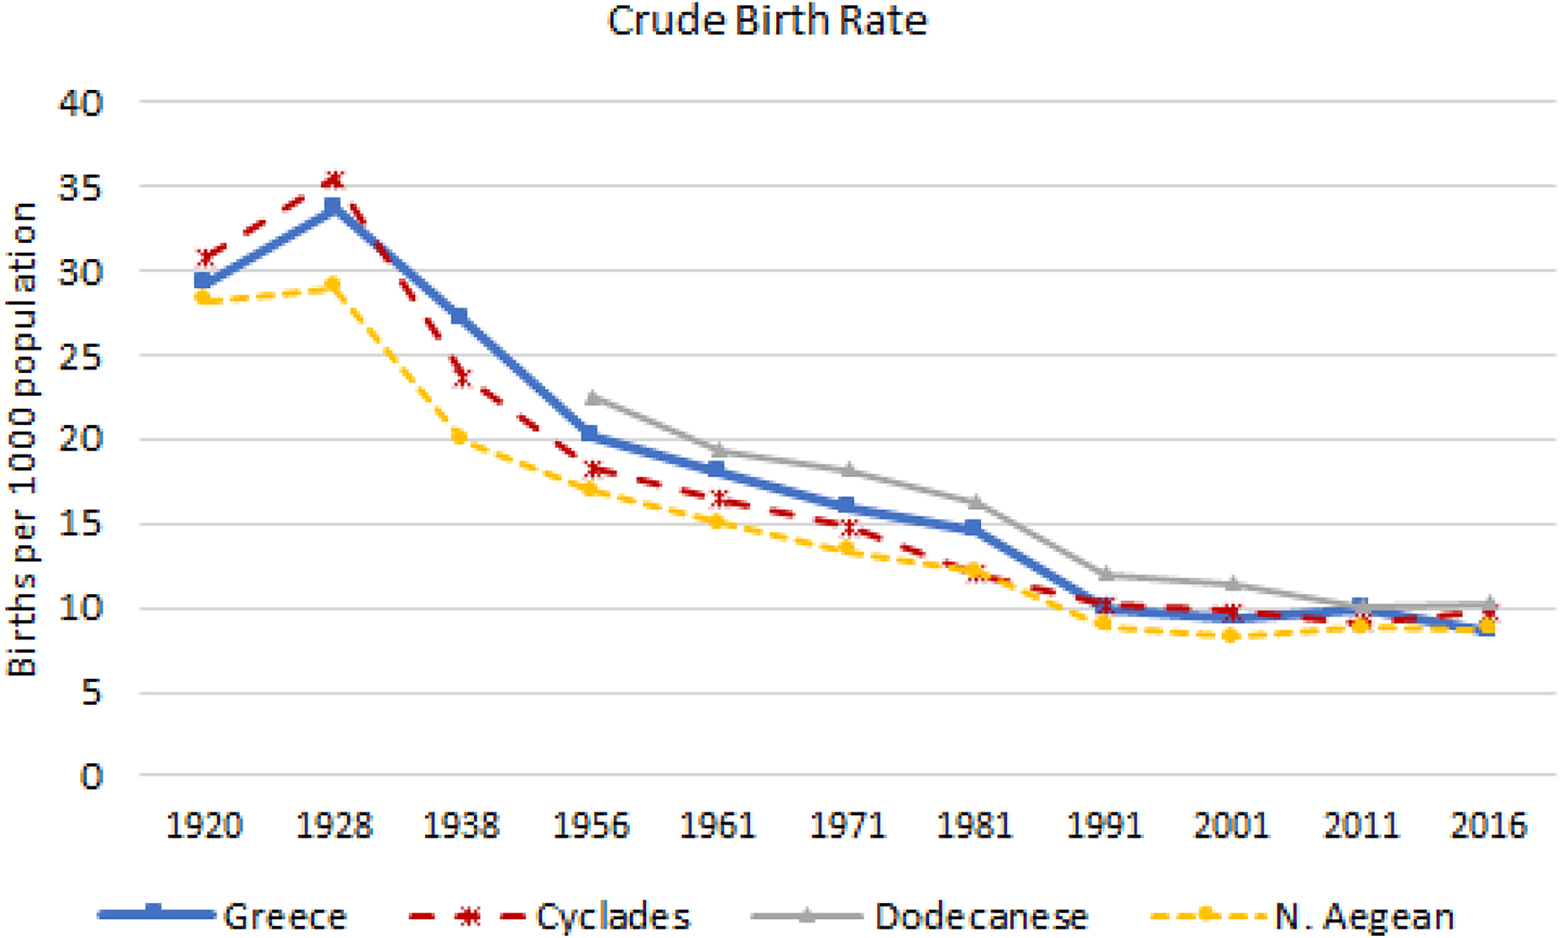
Crude Birth Rates, based on data that have been treated for under-registration of births. Greece, the Cyclades, the Dodecanese, and the North Aegean islands 1920–2016.
Nevertheless, the mass influx of refugees in 1922–23 cannot be accounted, by itself, for the total increase in fertility in the Aegean islands. The 1928 population census enumerated the refugees in the Greek state. According to the census returns refugees constituted 22 percent of Greece’s population, but only 3.7 percent of the Cyclades’ population and 17 percent of the population of the North Aegean islands. 19 It is very likely that in North Aegean refugees contributed to the increase in CBRs in the 1920s. Yet, refugees in the Cyclades were much fewer (3.7 percent of the total) and it is unlikely that they significantly affected the demographic processes on those islands. Two other factors responsible for this temporal increase in birth rates in the 1920s must have been the return of males from a series of wars that took place between 1912 and 1922 and the termination of overseas emigration, in 1921, when USA placed the first numerical ceiling upon immigration. 20 Fertility resumed its declining trend from the mid-1930s onward and the CBR reached 10 percent for the Cyclades at the end of the 1980s and for the North Aegean islands and Greece as a whole in the 1990s. The Dodecanese exhibits higher birth rates all over the study period and its CBRs fell to 10 percent only in the second decade of the twenty-first century (Figure 2).
In general, what is noteworthy in Figure 2 is the relatively big difference in CBRs between the Dodecanese and the North Aegean. On the one hand, the Dodecanese has higher birth rates from 1956, the year when the first data are available, until today (2016). On the other hand, the North Aegean exhibits the lowest CBRs among the island populations from 1920 until 2016. Nevertheless, by inspecting Figure 2 one should keep in mind that crude rates of births (CBRs) are not suitable for comparisons because they are affected by the population age-structure. A better account of the reproductive behavior of the population are given by more refined fertility indices, which are presented further on.
Period Total Fertility and Marital Fertility
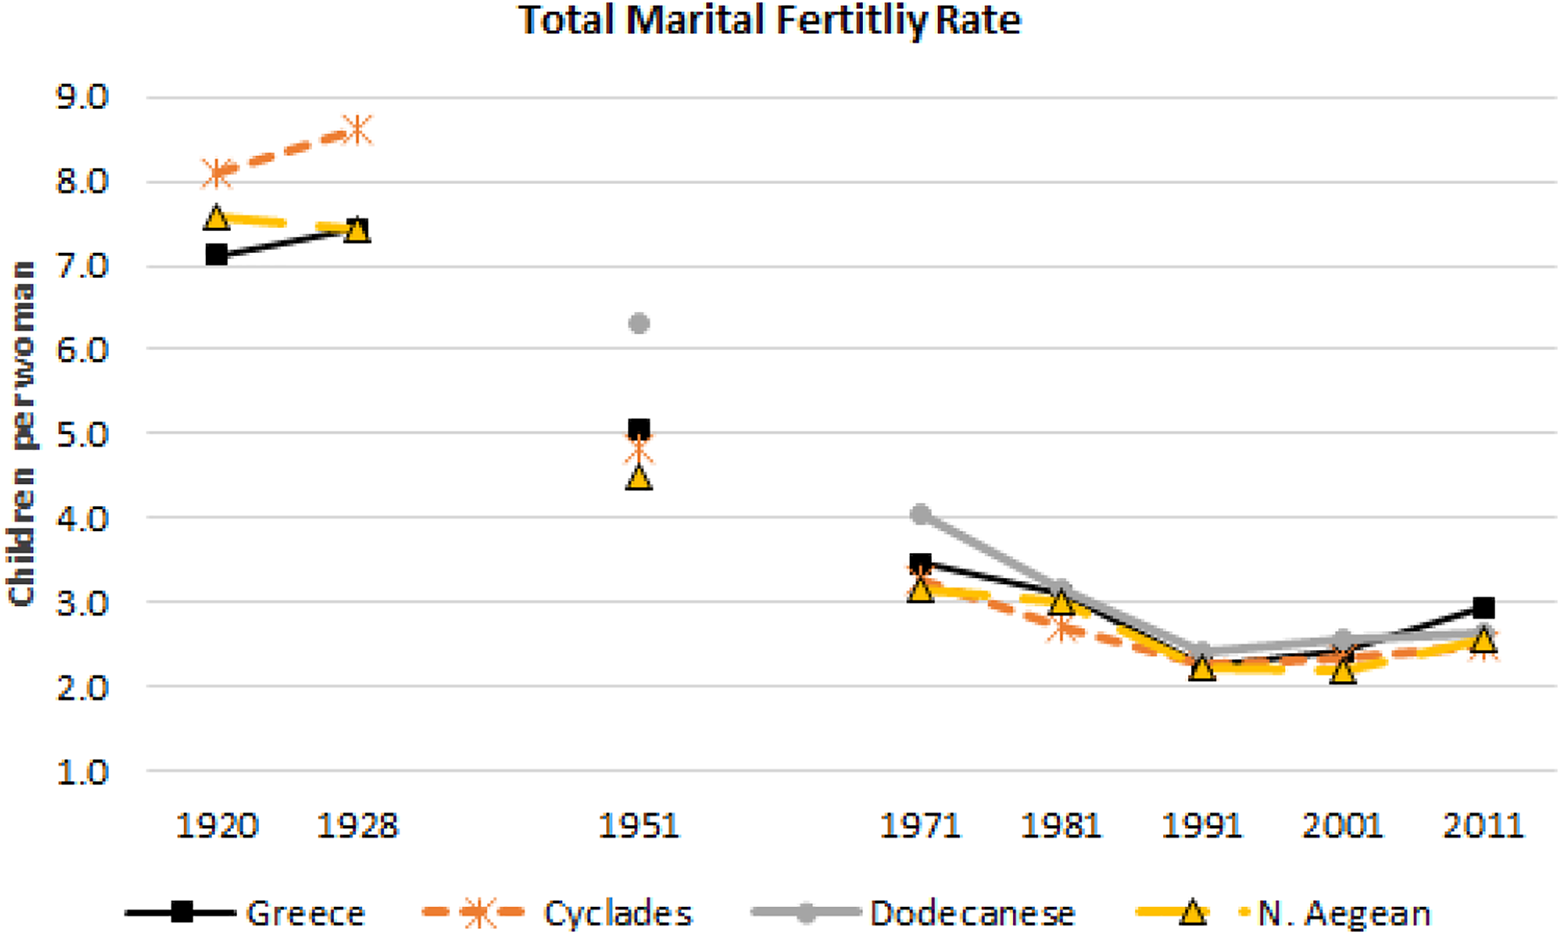
In the years before World War II the Cyclades stood out for their higher fertility (Figure 3). Their estimated TFRexp was 4.4 and 4.9 children per woman in 1920 and 1928, respectively. Those TFRs are greater than those for Greece as a whole and greater than those for the North Aegean islands as well. In the post war years, from 1951 to 1981 the highest TFR is recorded in the Dodecanese. It is very likely that the Dodecanese presented higher fertility than the rest of the study areas in the first half of the twentieth century as well, but there are no data to allow us an unbiased conclusion, apart from a general trend exhibited by birth rates (Figure 2) and fertility rates, both total and marital (Figures 3 and 4). If this trend is a continuation of a pre-war trend, then the Dodecanese had recorded higher fertility than the rest of the Aegean islands and Greece from the beginning of the twentieth century until at least the early 1980s.
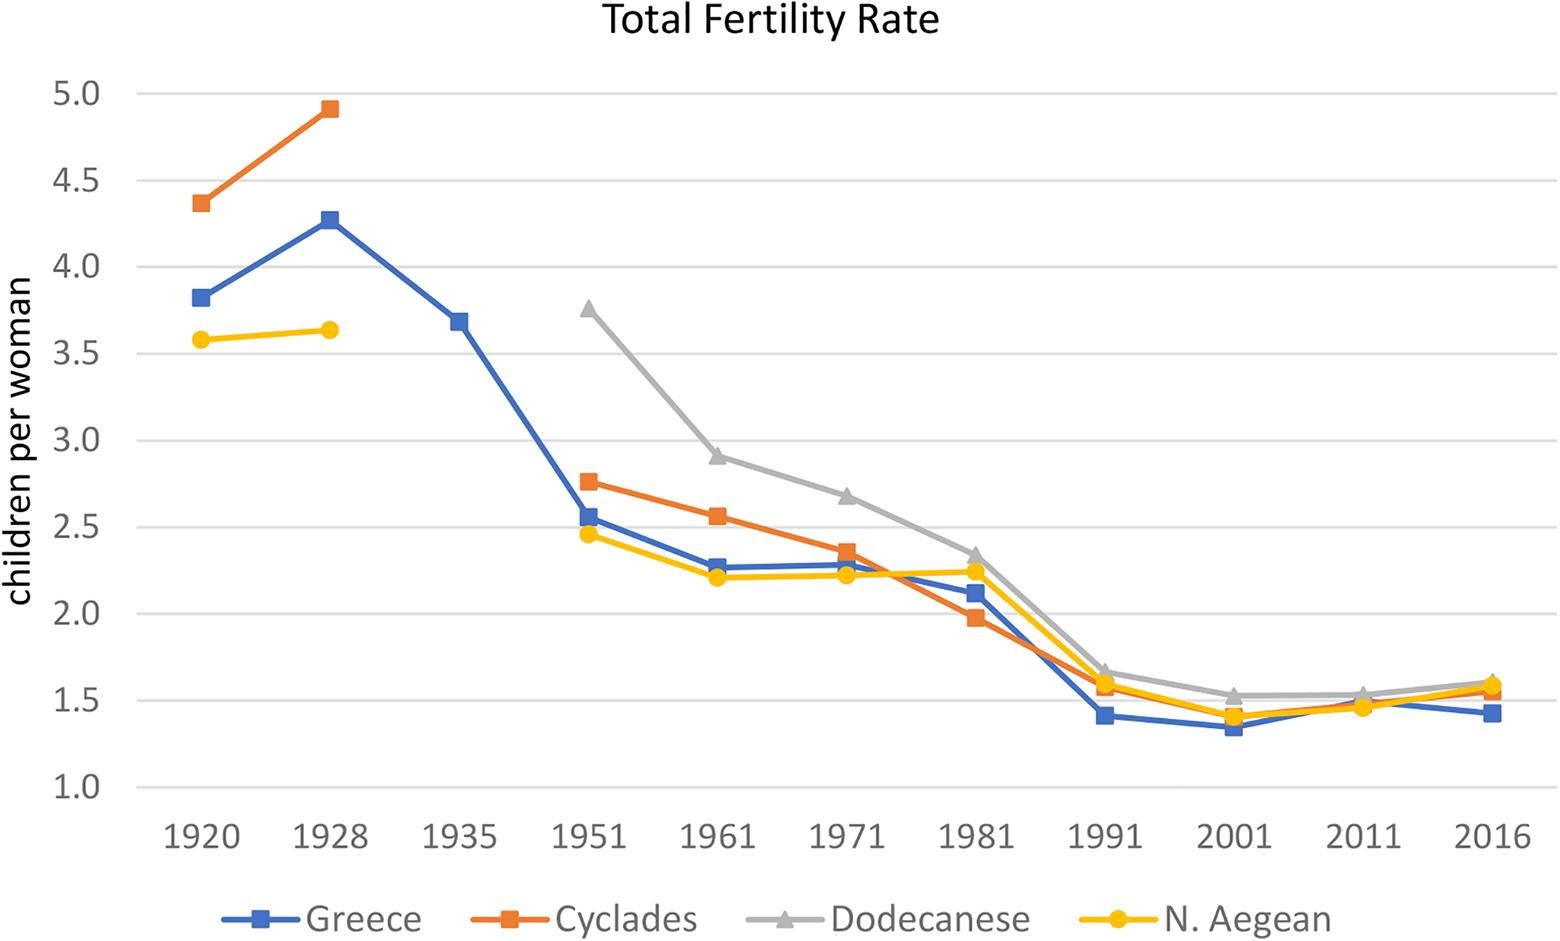
Indirectly estimated Total Fertility Rates (TFRexp). Greece, Cyclades, Dodecanese and North Aegean 1920–2016.
What is noteworthy in Figure 3 is the low fertility in the North Aegean islands. From 1920, when data are available, to the early 1970s, North Aegean presented the lowest TFR among the examined populations. Yet, the fertility of married women in North Aegean gives a different picture (Figure 4). In the first half of the twentieth century, married women had more children in the North Aegean islands than in Greece. Total marital fertility rate (TMFR) in North Aegean was 7.6 children per woman in 1920, while in Greece was 7.1. In the same year TFR was 3.6 in North Aegean and 3.8 in Greece. What is the reason for this inconsistency between TFR and TMFR? The answer to this question lies in the different female marriage pattern in North Aegean and in Greece.
Total marital fertility rates (TMFRexp). Greece, Cyclades, Dodecanese and North Aegean 1920–2011.
The Marriage Pattern and Its Effect on Fertility
In the first half of the twentieth century the female marriage pattern in the North Aegean islands was characterized by higher than the national average age at marriage (Figure 5) and by higher percentages of never married women (Figure 6). This seems to be the reason that there were fewer children per woman of reproductive age in North Aegean, but more children per married woman. In the first half of the twentieth century the marriage pattern seemed to play an important role in shaping the TFR and the TMFR. This relationship reversed in the second half of the twentieth century, where North Aegean exhibits lower marital fertility (TMFR) than Greece but higher total fertility (TFR) since 1981. This is also due to a change in the marriage pattern. The percentages of never-married women from the 1970s onward are lower in North Aegean than in Greece, and this change alone may explain to some extent the higher than the national average TFR in North Aegean. It does not explain, however, the lower marital fertility (TMFR) of the North Aegean compared to Greece.
Mean female age at first marriage 1907–2016. (SMAM for 1907–2011, Mean age based on vital statistics for 2016).

Percent of never married women at age 50: 1907–2011.
Percentages of permanent celibacy alone cannot determine the level of TFR. In modern populations, where birth control is widely practiced, both TFR and TMFR are determined by the choice of the couples regarding the number of children they want to bear. Only in natural fertility populations the marriage pattern determines, to some extent, the fertility level of the population, leaving little space to other determinants of fertility. 22 A synthetic index of marital behavior, which is based on the percentages of married women in each age group, is Coale’s index of marriage (Im), which shows the extent to which nuptiality deviates from being universal. 23 This index ranges from 0 to 1, with “1” meaning that every woman is getting married at her fifteenth birthday and “0” meaning that no woman is getting married during her reproductive life-span. 24
Although Coale’s index of marriage is mainly used in populations acting under natural fertility, it can also be used as a fertility determinant, of minor significance, in populations that birth control is practiced. Table 2 shows Coale’s indices of marriage for the populations under consideration, as those indices have been calculated from census-returns.
Coale’s Index of Marriage (Im).
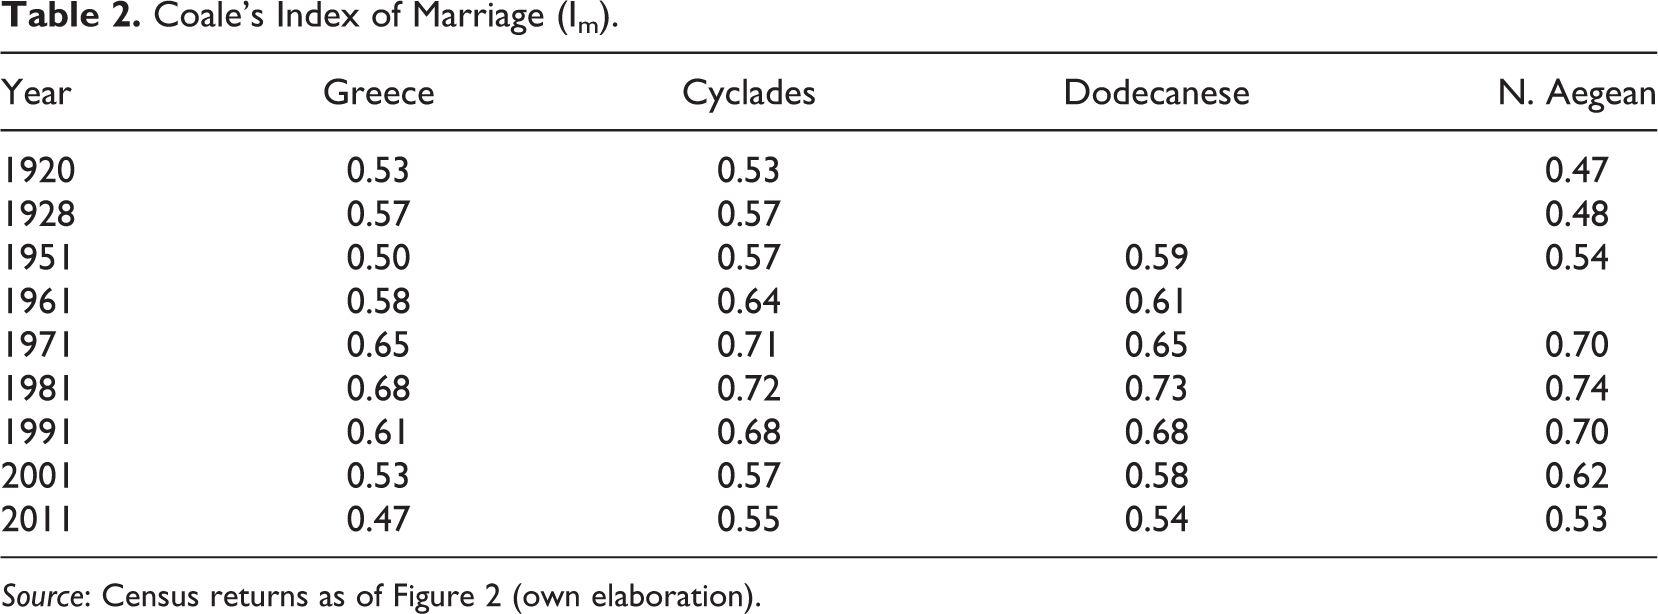
Source: Census returns as of Figure 2 (own elaboration).
Coale’s index of marriage confirms that in the first half of the twentieth century a great part of the potentially fertile population in the North Aegean islands (and, to a lesser extent, in Greece and the Cyclades) did not procreate due to low nuptiality levels. In the second half of the twentieth century, the mean female age at marriage has been dropping from the 1950s until the 1980s (Figure 5) and that drop is reflected in the increase of Coale’s index of marriage, though the percentages of never married women are increasing (Figure 6). In the last decades women in the islands have been getting married a little younger than their counterparts in Greece and the percentages of permanent celibacy in the islands are lower than in Greece. This may explain why from the 1990s onward (2001, 2011, 2016) the fertility level (TFR) in the islands has been a bit higher than that of Greece, while fertility among married women (TMFR) does not differ between Greece and the islands. In other words, women who marry at the same age bear the same number of children both in Greece and in the islands. Nevertheless, women in the islands marry “more” (greater percentages of married women in each age group) and earlier (at a slightly younger age) than their counterparts in Greece, and therefore the total fertility level is a bit higher in the islands compared to Greece.
Period versus Cohort Fertility
The available data from 1981 onward allow us to better inspect the reproductive behavior of the population by studying cohort fertility, which gives the completed family size of women born in the same year or period. Data available for recent decades allow us also to monitor the mean age of women at childbearing and the mean age of women at the birth of their first child.
For the estimation of the Cohort Fertility Rates shown in Figure 6, the returns of the 2011 census were used. Cohort fertility in Greece had already been low for women who were born in the 1920s (Figure 7). Their completed family size was 2.16 children on average, while those who were born in 1927–31 did not bear more than two children (2.01) on average. Nevertheless, cohort fertility remained almost stable at 2 children per woman for those women who were born up to the early 1950s. A decreasing and irreversible trend in cohort fertility started with the birth cohort of the mid-1950s, that is women who started their childbearing career in the 1980s. This descending trend resulted to very low fertility in the twenty-first century. According to the 2011 census-returns women who were born between 1967 and 1971 bore 1.67 children on average, that is 0.33 fewer children than those who were born between 1927 and 1956.
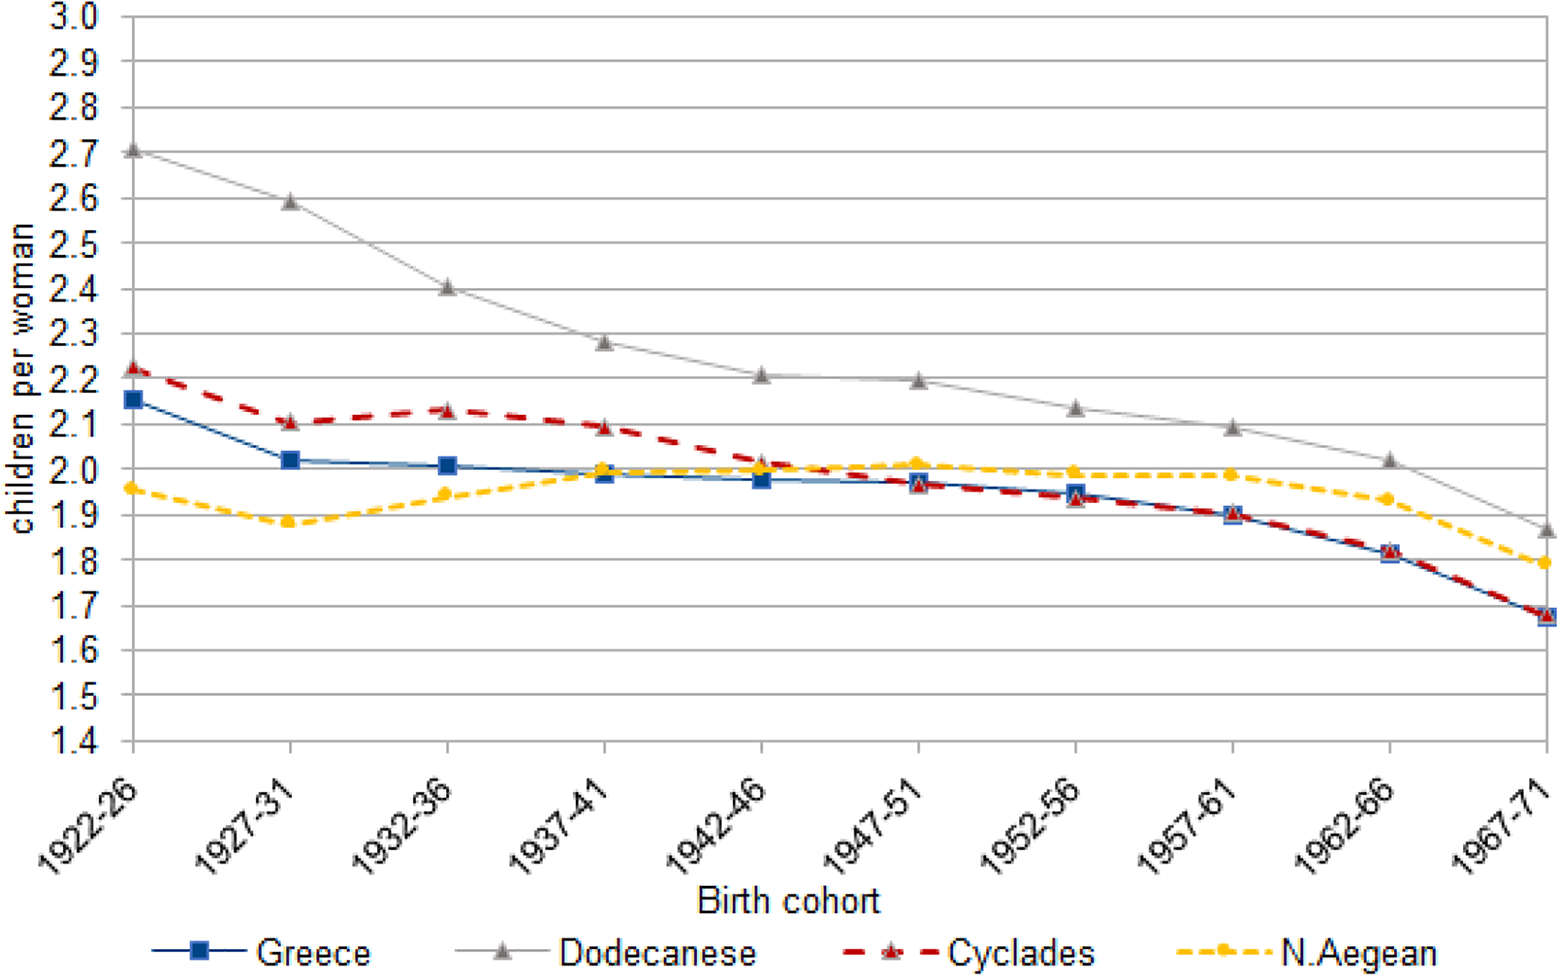
Cohort Fertility Rate: birth cohorts 1922–1971.
As far as the Aegean islands are concerned, it is noteworthy that the Dodecanese stands out for their high fertility. The difference between the Dodecanese and the rest of the islands is more highlighted in longitudinal analysis (Figure 7) than in the period analysis (Figures 3 and 4). A significant decrease in the fertility of the Dodecanese is observed between the birth cohorts of 1922–26 and 1942–46, that is women who started their reproductive career in the immediate post war years (late 1940s) and up to the late 1960s. Between this time span cohort fertility dropped from 2.7 to 2.2 children per woman. Nevertheless, even women of the 1967–71 cohort in Dodecanese had more children per average than women in Greece and the rest of the Aegean islands: 1.9 children per woman, a value very close to replacement fertility, taking into account that women born at the end of the 1967–71 quinquennium had not completed their childbearing history in 2011, when the census took place. Most probably the final fertility of these women was closer to 2.0 children per woman.
A notable ascent in the mean age of women at childbearing has been observed both in Greece and in the Aegean islands from 1981 onward (Figure 8). From 26.3 in 1981 the mean age of women at childbearing reached 31.5 years of age in 2017 in Greece. The trend is similar for the islands, but the level is lower. It seems that all over the examined period women in the Dodecanese were having their children at a younger age than in the rest of the islands and in Greece as well. Compared with the national average, mean age at childbearing in the Dodecanese was usually one year lower, at least for the period 1981–2017. This younger age at childbearing explains, to some extent, the higher fertility rates in the Dodecanese compared to the rest of the examined populations.
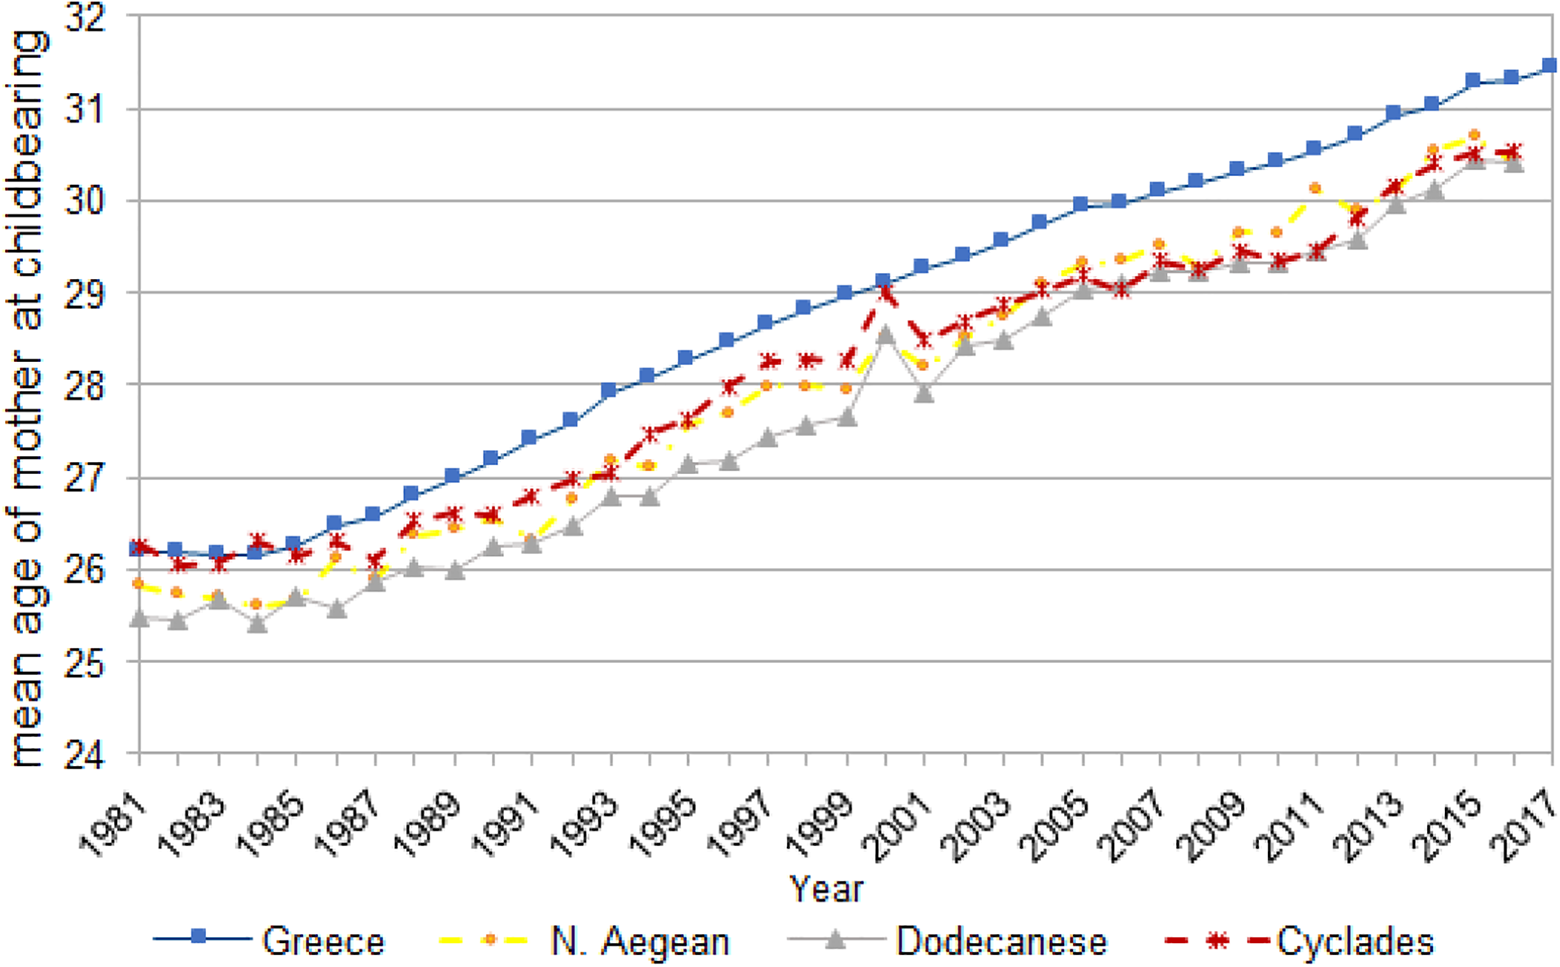
Mean age of women at childbearing: 1981–2017. Source: “Vital Statistics: Births,” Hellenic Statistical Authority, accessed May 1, 2018, https://www.statistics.gr/en/statistics/-/publication/SPO03/- (own elaboration).
The islands differ significantly from Greece as far as the mean age of women at the birth of their first child is concerned (Figure 9). Women in the islands have their first child at a younger age than those in mainland Greece even today. In Dodecanese in the mid-2010s women became mothers at 28.6 years on average, while in the rest of Greece women became mothers almost 2.5 years older.
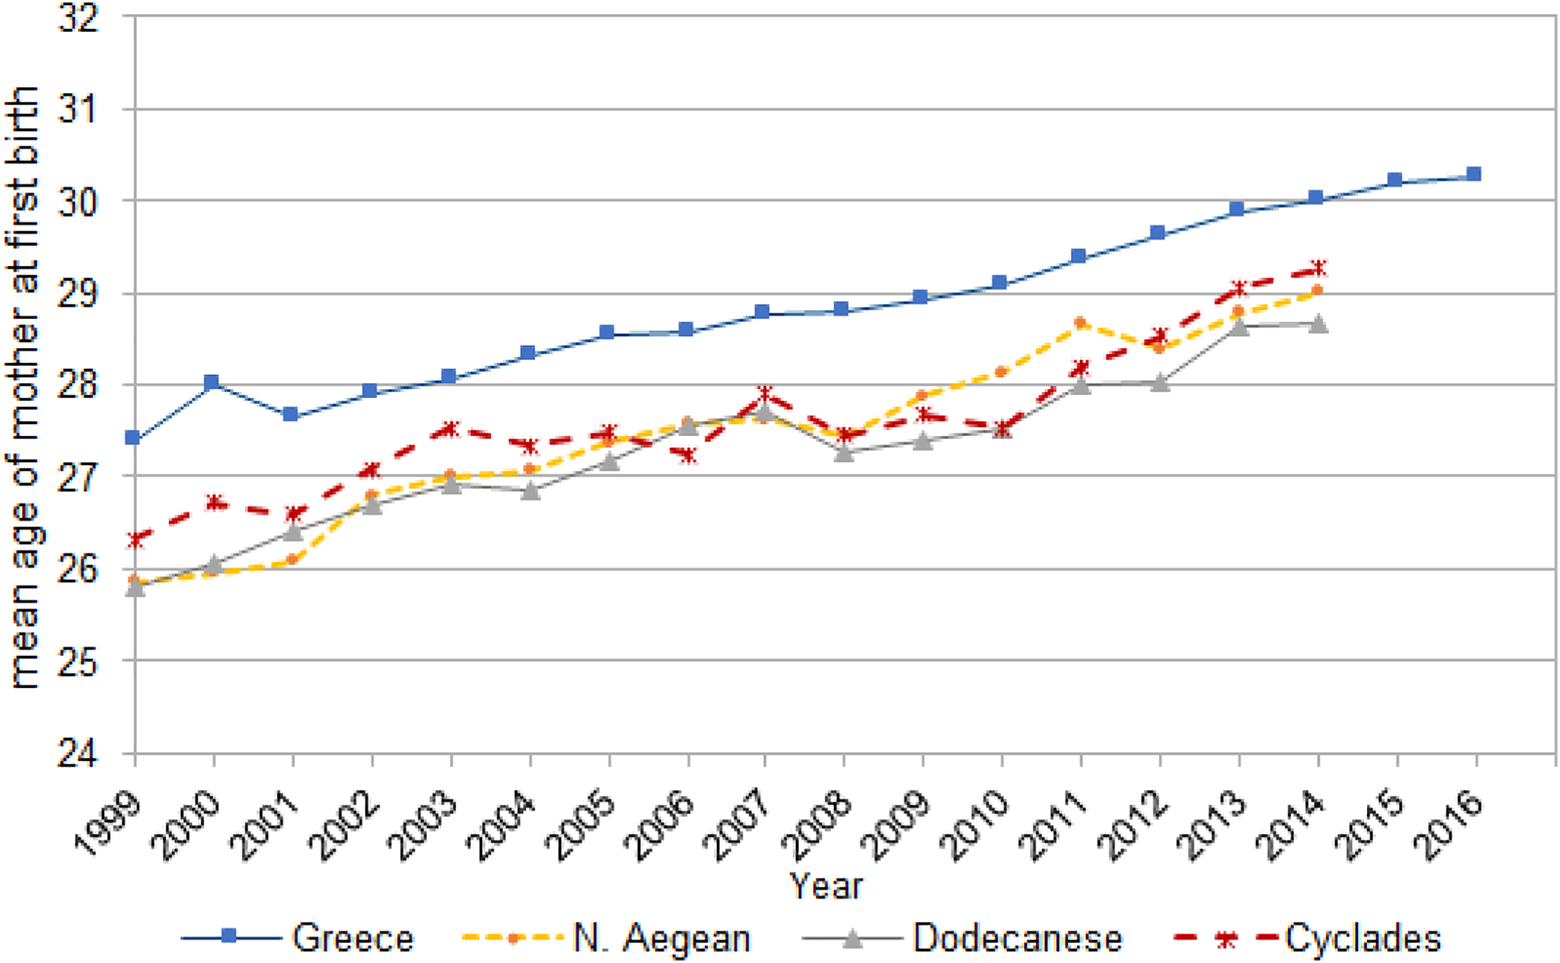
Mean age of women at the birth of their first child: 1999–2016.
Childbearing out of Marriage
Although female age at the birth of the first child is continuously increasing, it does not match the increase in the mean age at first marriage. In 2016, for the first time in the history of modern Greece, the mean female age at marriage (30.6) was higher than the mean age at the birth of first child (30.3). A mean age at first marriage that is higher than the mean age of mother at first birth means that a significant proportion of women have their first child before getting married. This fact indicates a deviation from the traditional setting of childbearing, that is the marital union.
Figure 10 depicts out of wedlock childbearing in the Aegean islands for the years 2014–16. Only the Dodecanese exhibited a bit higher level of out of wedlock childbearing than the national average. The rest of the islands had relatively fewer births out of marriage than Greece. Especially in the North Aegean the percentage (5.7 percent) was similar to that recorded in Greece ten years earlier (in the mid-2000s). Lemnos and Chios have the lowest level of out of wedlock childbearing among the islands (3 percent). On the other hand, in the big islands of Dodecanese the percent of births out of marriage exceeded 10 percent (especially in Kos).

Births out of marriage as percentage of the total births. Aegean islands 2014–2016.
However, there is a substantial difference in out of wedlock childbearing between the Greek population (being the islands or mainland Greece) and populations in other countries of Europe. Whereas in other European countries births out of marriage is a conscious choice, for Greek women childbearing outside marriage is not so. Most pregnancies to unwed Greek women are unplanned and the birth is often a result of a difficult decision between abortion and childbirth. 25 Most probably the reason that some islands have higher percentages of births out of marriage is due to the fact that many foreign nationals (mainly European citizens) live and work in the Greek islands. A significant part of out of wedlock births come from these women. Figure 11 shows the contribution of foreign nationals to extramarital childbearing.
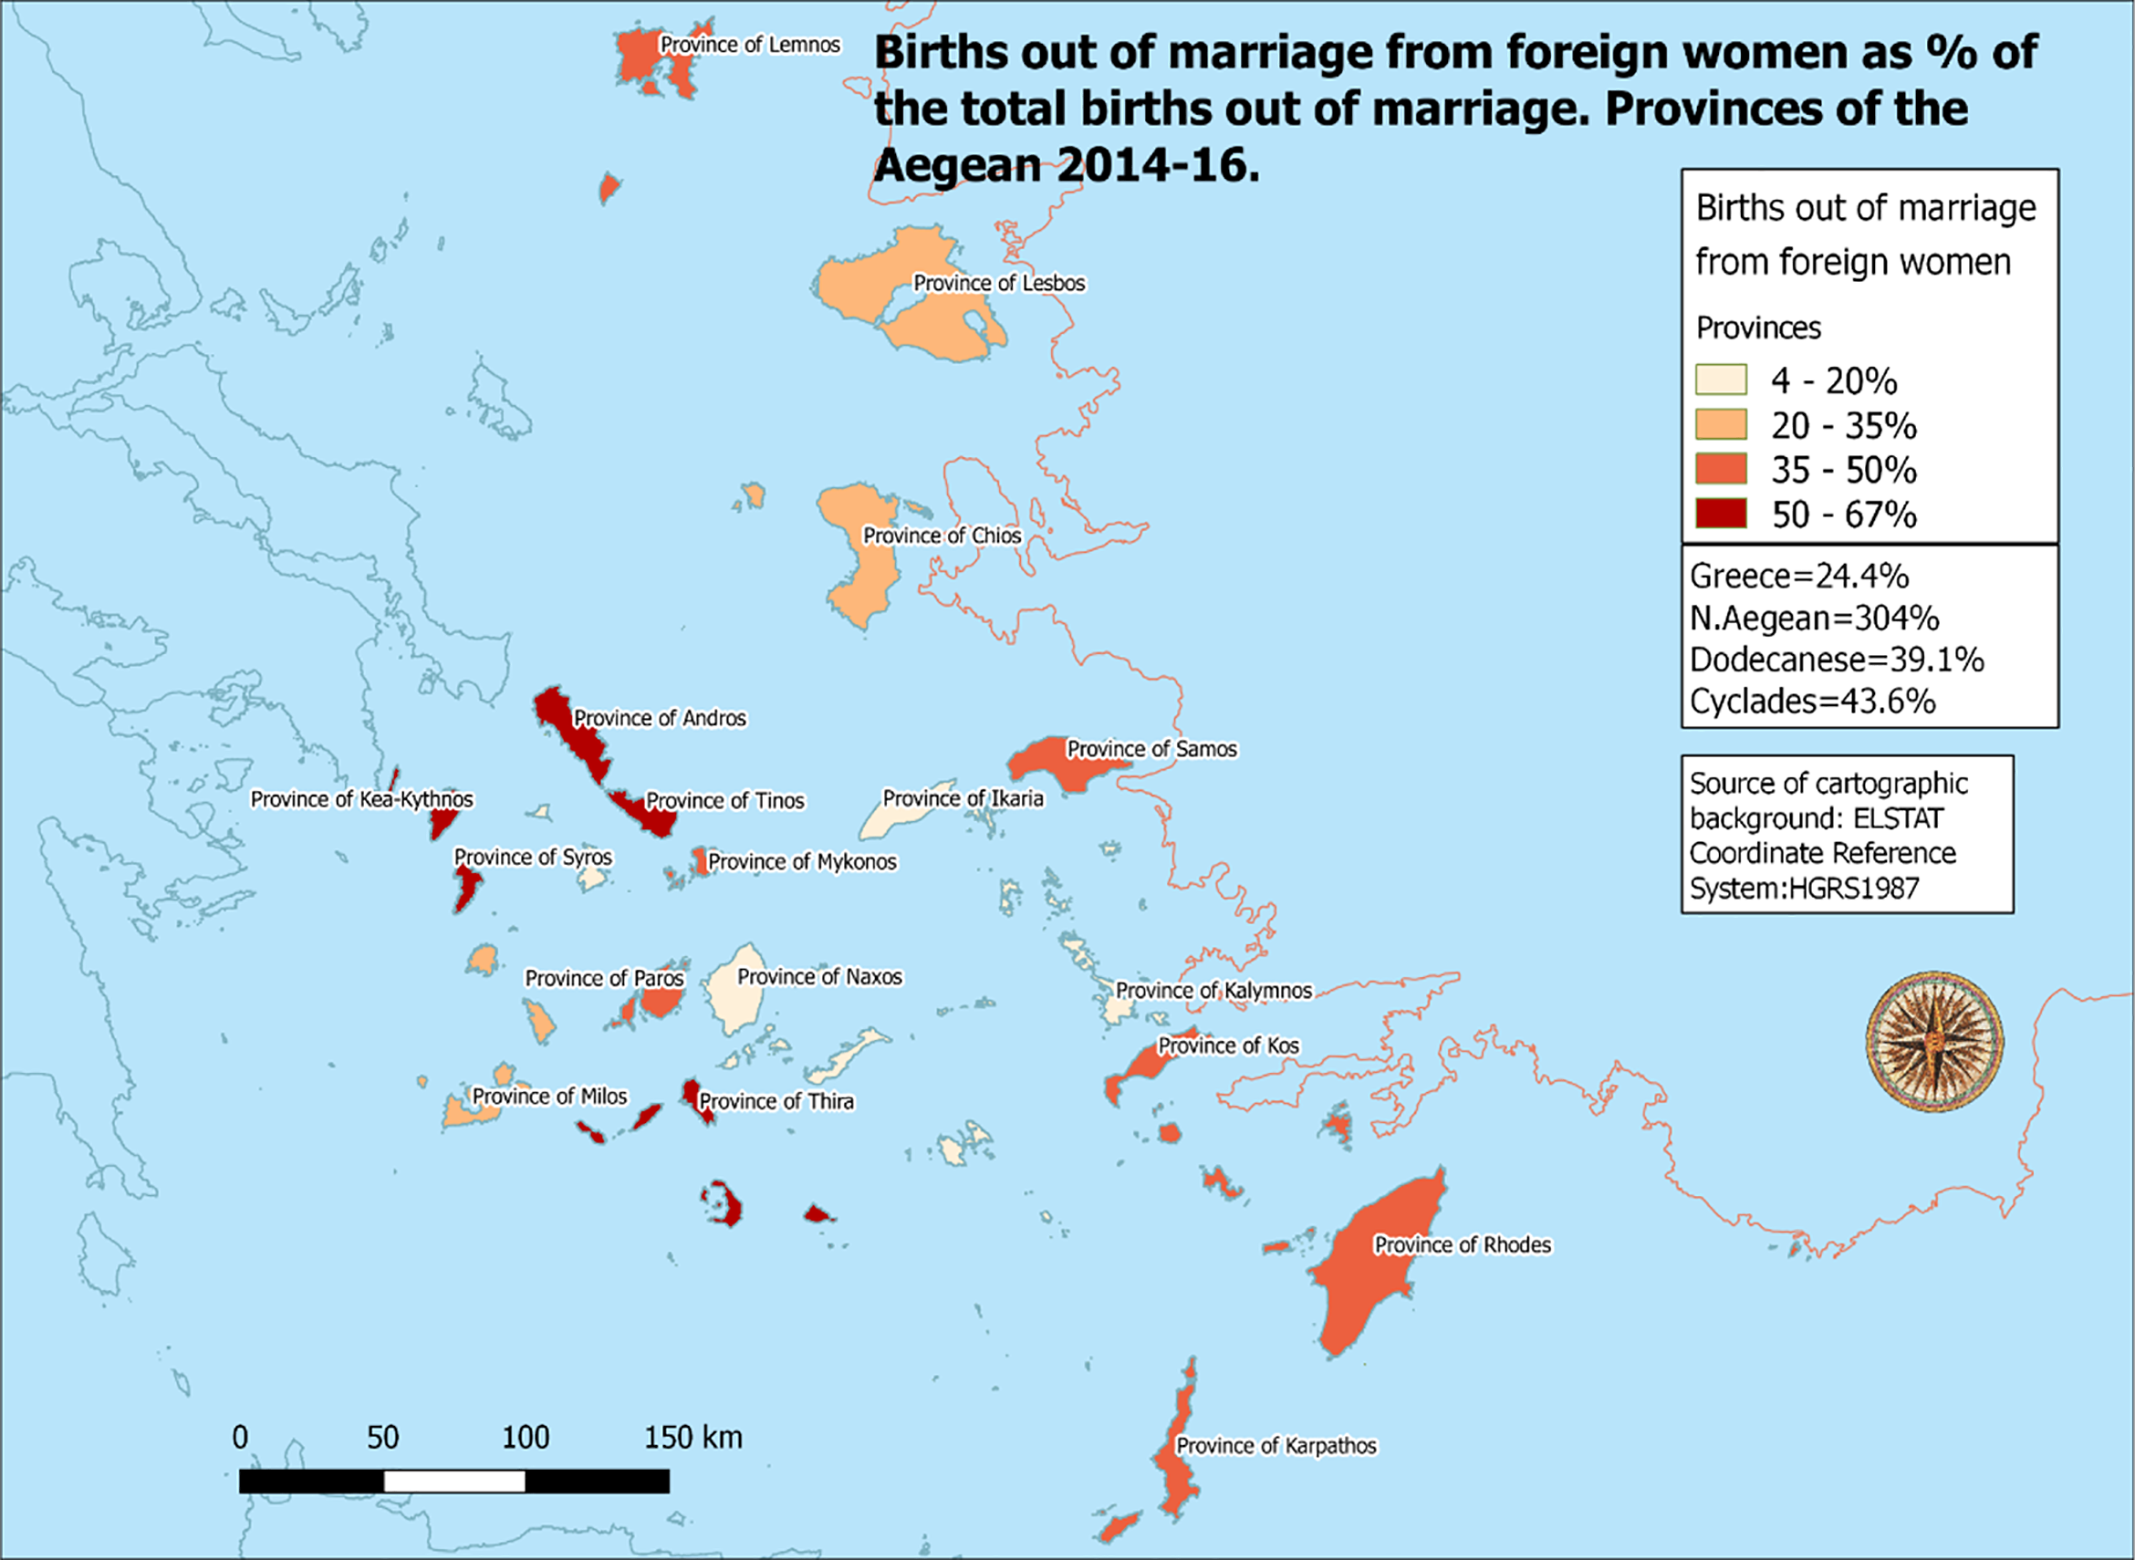
The contribution of foreign nationals to the out of wedlock childbearing. Aegean islands 2015–16.
In Greece as whole 25 percent of extramarital births came from mothers with non-Greek nationality in 2014–16, while in the islands this percentage was substantially higher: 30 percent in the North Aegean islands, 39 percent in the Dodecanese and 44 percent in the Cyclades. In the Dodecanese and the Cyclades, women of foreign nationality were relatively more numerous than in Greece (12.2 percent in the Dodecanese, 13.7 percent in the Cyclades, 8.1 percent in Greece). However, the contribution of foreign nationals who lived in the islands to out-of-wedlock childbearing was disproportionately higher than those living in Greece.
Conclusions
In conclusion, the reproductive behavior of the Aegean islands in the twentieth century has followed the national trend of a decreasing fertility. Although this decrease started in a non-reversible way in the 1930s, there are differences between the three groups of islands. On the one hand, the Cyclades follow closer the trends of Greece, though their fertility level was higher than that of Greece up to the 1980s. On the other hand, North Aegean exhibited lower than the national average fertility in the first half of the twentieth century, most probably due to a marriage pattern that left many women out of wedlock (either by never married or by not remarry when they got windowed). However, in the second half of the twentieth century and in the first decades of the twenty-first century, the North Aegean islands have exhibited slightly higher fertility than Greece.
The Dodecanese registered in the past the highest fertility among the populations under consideration. Today (2016) women in the Dodecanese expected to bear 1.56 children per average by the end of their reproductive life, a value of TFR slightly higher than that of North Aegean (1.55), the Cyclades (1.51), and Greece (1.38). Although fertility is very low in the Greek islands, it is higher than in mainland Greece due mainly to the fact that women marry in a younger age and less of them remained permanently unmarried.
Footnotes
Declaration of Conflicting Interests
The author(s) declared no potential conflicts of interest with respect to the research, authorship, and/or publication of this article.
Funding
The author(s) received no financial support for the research, authorship, and/or publication of this article.