
Abstract
This article examines household change and related demographic and social factors in Botswana during the last 40 years (1971–2011). The analysis uses data from five Botswana censuses and three nationally representative surveys: the 1988 Botswana Standard Demographic Health Survey (BSDHS), the 2000 Multiple Indicator Survey (MICS) and the 2007 Botswana Family Health Surveys (BFHS). Overall, the analysis affords a demographic and socio-economic perspective on the change in Tswana households, which is not generally available in census reports and other population survey analyses but is crucial to family and household policy.
Introduction
Globally, there is a shift in households becoming smaller and less diverse in membership.1-4 In developed countries, a decrease from 3.5 to 2.5 in the mean number of individuals in a household is reported in Italy between 1970 and 2000. While in Britain, between 1970 and 1999, the average household size declined from 2.9 to 2.6 persons per household. 5 The average household size has also decreased across Europe between 1950 and 1990.6,7 The most recent data indicates that average household sizes of fewer than three persons per household are now concentrated across Europe and Northern America. 8 Within this general context, low- and middle-income countries (LMICs) are also experiencing household size and composition declines.
Traditionally, families and households in LMICs are larger and more complex in membership than in HICs.9-12 Bongaarts's analysis in 2001 of household size and composition in 43 developing countries shows an increasing trend toward smaller and more nuclear households across contemporary developing countries. 13 More recent research from the United Nations indicates that East Africa's average household size declined from 5.3 persons per household in 1969 to 4.0 persons in 2014. 14 Countries in Southern Africa are also experiencing declines in household size and composition. In Botswana households, the mean number of individuals has dropped from 5.9 persons in 1971 to 3.7 persons in 2011. 15
The present analysis examines changes in size and composition of households in Botswana in the last 40 years, using census and survey data collected between 1971 and 2011. Next, the study analyses how household change differs by important demographic indicators of fertility and household head's age. Further, the analyses examined key social factors linked to household change by showing which women experience the most considerable declines in fertility using parity progression ratios (PPRs).
There are advantages to studying households and patterns of household change. At a micro level, the number of individuals and types of household members affects the relationships and pool of social and economic support available within a household for childrearing, consumption, and economic production in these domestic units.16-18 For example, evidence in high-income countries (HICs) shows that the family is a critical institution in supporting children's health and development.19-21 Other studies confirm links between household socio-economic status and children's health, cognitive, and behavioural outcomes.22-24 In particular, households with low socio-economic status are likely to be associated with increased risks for stunting 25 and higher diarrhoea rates in infancy. 26
Current studies have also begun to draw attention to households’ nature and their potential to prevent the spread and minimise the severity of airborne diseases such as the recent pandemic-COVID-19.27,28 This is partly because the household size and composition inform the economic and social resources available for the care of household members, such as the elderly and their access to health services.29-31 Also, household size and composition inform the ability to manage exposures to COVID-19 risks related to hygiene practices and social distancing measures. 32
At a macro level, household characteristics have implications for broader societal issues such as care of household members, poverty alleviation, and the housing market (both demand and tenure). As evident in a study by Houle et al., 33 the availability of state support through old-age pensions and childcare grants in South Africa has enabled rural households to provide better care to children of migrants. Concerning the housing market, empirical generalisations indicate that housing prices have paradoxical effects: they discourage marriage and formation of family households in societies where leaving the parental home is standard, as is the case in Italy. 34 Simultaneously, high housing costs reduce household size in societies where young adults’ leaving parental home is postponed until late adulthood. 35 Hall, Ogden and Hill indicate that the increase in one-person households among young adults in England and Wales between 1981 and 1991 resulted in more housing demand in large cities. 36
Background
Although most of the literature on households and change are in developed countries and provide a good starting point and methodological approaches for the inquiry into household change, exploring factors associated with a household change in developing countries such as Botswana remains crucial. New types of households and families are emerging in Botswana due to changing social norms and economic conditions. Since the 1970s, households in Botswana have changed in size and composition due to a decline in fertility, fewer people marrying, and more people remaining single or choosing to cohabit.37-39 Also, new household types in the form of extensive non-marital childbearing and parenting with non-related household members have increased over the years. 40
Other factors associated with household change in Botswana include increased educational attainment, higher participation of women in employment, and increased unemployment among young people.41,42 For example, relatively high literacy rates explain why households are becoming smaller and fertility declines over time. Literacy rates of the population aged 10–70 years in Botswana have increased from 34 per cent in 1981 to 85 per cent in 2010. 43 Unemployment rates have also increased over the last twenty years, making a living with other family or household members a necessary phenomenon, especially among young adults. 44 Census data indicate that unemployment rates have increased from 15 per cent in 1991 to 20 per cent in 2001.45,46
Equally crucial to household formation and change is individuals’ marital status and financial independence. 47 The change in Botswana households also occurs amidst a rise in cohabitation, decreased marriage rates, and increased non-marital births during the 2000s. 48 For instance, in 2011, 21 per cent of adult men and women lived with an unmarried partner, up from 12 per cent twenty years ago. At the same time, the percentage of currently married persons aged 15 years and above in Botswana has been declining over the years; reaching 19 per cent for men and 18 per cent for women in 2011 compared to 47 per cent and 43 per cent for males and females, respectively in 1971.49,50 Also noteworthy is that the period from 1981 to 1990 and 1991 to 2011 shows that more married and single women are financially able to set up new households before childbearing than from 1971 to 1980.
Conceptual Framework
The relationship between household change and demographic factors is well documented in the literature.51-54 Figure 1 conceptualises household change in Botswana. The model adopts Bongaarts’ essay on family and household composition.55,56 In his model, Bongaarts 57 outlines six factors that determine nuclear family composition (nuptiality, fertility, mortality, migration, adoption, and divorce) and four factors associated with how nuclear families and individuals combine to form households (headship prevalence, household formation, household transition and household dissolution). While Bongaarts restricts his model to nuclear families and individuals within these units, the conceptual model in Figure 1 takes an inclusive approach. Figure 1 shows how demographic factors impact household change in a context where household membership is more heterogeneous and complex: including co-residence with family and non-family members in Botswana.

Conceptual framework on the factors associated with household change in Botswana.
Figure 1 shows that household change is also associated with the socio-economic, regional, policy and environmental factors operating through several proximate household change determinants. The proximate determinants of change to a household include those associated with a gain in household size (births and marriage) and household size loss (deaths, divorce and migration). For example, as shown in an analysis of family change over a life cycle in the US, families form when couples marry and increase in size when a child is born. 58 Further, Sweet indicates that families reduce in size when a child leaves home for marriage, schooling, or work opportunities and eventually dissolve in old age when the last member dies. 59 Likewise, in developing countries, a household starts with a few members, and it gains members over time for reasons related to demographic and social-economic factors, resource availability, and the ability to function and maintain its activities.
Previous studies show that deaths and morbidity are associated with household change. 60 In particular, in Botswana, mortality is likely to decrease density in the kin network by reducing the average household size and persons in a household. As Zhao revealed in his work in England, a reduction in mortality increases the number of siblings, cousins, aunts, uncles, nephews/nieces available to an individual. 61 About morbidity, Botswana rates are likely to lead to changes in living arrangements rather than household dissolution. This is possible because the Human Immunodeficiency Virus and the Acquired Immunodeficiency Syndrome (HIV/AIDS), the leading cause of adult deaths and morbidity in Botswana, have a long incubation period of around 11 years between illness and death. 62 Also, given the almost complete coverage of the antiretroviral therapy (ART) programme in Botswana to the population who needs it, more people now live longer with HIV, 63 thus lessening the household disruption change to adult and child morbidity and deaths.
Other shifts, including migration of individuals to other locations due to household requirements, also contribute to households losing or gaining members.64-66 Immigration to Botswana has increased from an estimated 10 861 persons in 1971 to 60 716 persons in 2001. 67 Simultaneously, the report indicates that the number of Batswana emigrating has declined from 45 735 in 1971 to 28 210 in 2001. Thus, given the emigration levels and the reasons for out-migrating among Batswana, it is likely that this process will have very little influence on the change in households. Instead, immigration is expected to contribute to household growth, given that it increased by six-fold between 1971 and 2001.
Simultaneously, Botswana's conceptualization of household formation mirrors migration, marital status, fertility, residential patterns, and labour market conditions. For example, Townsend 68 reveals the importance of male out-migration to the development cycle of the household in traditional Tswana society. Based on life histories collected in Mmankgodi- a village 45 kilometres to the west of the capital city Gaborone, Townsend shows that men co-reside with kin and relatives through most of their lives and are only able to set up their household in their forties. 69 Research in Gaborone and three villages in the South East district by Izzard 70 showed the importance of marital status; those previously married and those headed by never-married women formed female-headed households in Botswana. Over the years, Tswana households have continued to show the features of female heads and the importance of children. For instance, Mokomane, Baker, and Van de Walle indicate that in 1991, 47 per cent of the households in Botswana were headed by a woman, and 31 per cent of the children in these households were grandchildren to the head of the household. 71 This characteristic indicates the role of marriage in Botswana to household life and the role of number of children to household size. However, the number of children has continued to show decline in recent years resulting from the decline in the birth rates and increasing female literacy rates and participation in employment. 72
In recent years, rapid urbanization in Botswana and an increasing demand for housing in urban areas have contributed to declining household size trends. In 1971, urbanization was 9.1 per cent, compared with 64 per cent in 2011. 73 Burch and Matthews and Burch indicate that modern technological developments, urbanization and a rise in income make the co-residency of adults with other members less desirable as individuals seek privacy and can afford to live alone or in smaller households.74,75
Another aspect of household composition is the trend of living alone among young adults under 30 years old due to labour and housing market demands. On the other hand, Siphambe 76 acknowledges the potential importance of the labour market to household formation and the co-residency of young people with family and relatives. He argues that due to high unemployment rates in Botswana, the ability of young people to leave their parental home and set up their households remains low. Unemployment rose from 15 per cent in 1991 to 20 per cent in 2001.77,78
The change in the average household size in Botswana is due to many demographic and socio-economic trends, all coinciding. This study is unique and essential in providing a detailed examination of the household size and composition changes in Botswana from 1971 to 2011 and giving a complete picture of the socio-economic environment in which such changes occurred.
Contributions of This Study
Examining household change over time in Botswana is essential to inform new research questions and design policies about families and households. This is because a detailed and comprehensive understanding of household change and key indicators presents new opportunities and challenges to inform policies and programs targeting services and support to households. Botswana makes an interesting case because, since the 1970s, it has been going through several socio-economic changes, which have implications for household size and composition. This study is the first to examine household change in Botswana quantitatively.
Data and Methods
The analysis uses Botswana censuses for 1971, 1981, 1991, 2001, and 2011, as well as three nationally representative surveys: the 1988 BSDHS, the 2000 MICS, and the 2007 BFHS. The data from the population censuses provide a general overall view of households, while the surveys of 1988, 2000 and 2007 provide more details about household change. Statistics Botswana administered both the censuses and the surveys in 1988, 2000 and 2007. 79 The surveys were drawn from the listing information of the prior census. The 1988 survey used a two-stage sample weighted at household, urban, and rural locations. 80 For the 2000 and 2007 surveys, a two-stage sampling frame first involved selecting primary sampling units (PSU) or enumeration areas from a stratum or an administrative district and selecting households within selected PSUs.81,82
Table 1 below shows the population totals and households enumerated for 1971, 1981, 1991, 2001 and 2011. Table 1 also shows the population and number of households interviewed in the three surveys. The surveys and censuses were conducted on a de facto basis.
Population and Households Enumerated in Botswana by Census and Survey Year.

de facto population count.
Concepts Used in the Study
Household
A household comprises one or more people who occupy a single housing unit, regardless of their relationship by marriage or kinship ties.83,84 Thus, a household can be a family or a non-family. 85 A family household refers to a domestic unit consisting of a father and mother, with or without children, confined to kinship relatedness and including a much wider group such as grandparents, aunts and uncles.86-88 A non-family household comprises one person or multiple persons that are not related to each other. Household change is defined as a change in the size and composition of a household.
Household Change
Household change refers to the changes in size and composition of a new or existing household. Household size was calculated by dividing the total population in a year by the total number of households. Household composition reflects the distribution of household membership by the age of members during the period 1971–2011, the relationship of household members to the household head (e.g., Spouse/partner, son/daughter, grandparent, aunt, other relative and not related), and the distribution of households with children (aged 0–4 years) and older children (5–17 years) during 1988, 2000 and 2007.
Household Head
Households analysed have a head, and both the census and the surveys asked household members to self-define the head of the household. 89 The person referred to as a household head is an adult male or female and a reference person to all other household members.
Fertility
Refers to births per woman and is presented using the total fertility rate (TFR) and parity progression ratios (PPRs). The TFR is the average number of children a woman will have at the end of her reproductive life span, given the prevailing age-specific fertility rates. The TFR is a better measure of fertility than the number of children ever born (CEB), child-woman ratio (CWR) and crude birth rate (CBR) since it is independent of the population age structure.90,91
PPRs
The PPRs consider the number of children a woman has already had; in other words, they measure the extent to which women have first, second, third, fourth and higher-order births.92,93 In contrast to the conventional age-based fertility measures, the parity progression approach has an advantage. The PPRs enable an interpretation of fertility trends based on the decisions relative to having another child, given the number of children a woman already has. 94,95
The PPRs were calculated using Botswana census data for 2001 and 2011. The PPRs were calculated on a cohort basis, as shown in Preston, Heuveline, and Guillot. 96 The women were tabulated by parity, and then the figures cumulated from the bottom up to give the number of women at parity i or more (Pi). Lastly, the parity progression ratios from parity i to parity i + 1 were obtained by dividing the adjacent figures of Pi. 97 The PPRs were calculated for females aged 45–49 and 50–54 years in 2001 (1952–1956 and 1947–1951 birth cohorts, respectively) and females aged 45–49 and 50–54 years in 2011(1962–1966 and 1957–1961 birth cohorts, respectively). The older women were chosen as their PPRs would be closer to their final fertility, whereas, for younger women, their PPRs would be smaller and not reflect completed fertility. 98 The analysis is restricted to women aged 45–54 to prevent bias in reporting births for women over 54.
Also, the distribution of completed family sizes among these women is shown by rural/urban differences and education levels. Education is categorised into four levels: no education, primary, secondary and tertiary. In Botswana, no education means that someone has never attended formal school. Primary schooling refers to the first seven years in the education system, and secondary schooling comprises five years (3 years at Junior secondary school and two years at Senior secondary school), provided there is no failure to complete any of the levels. Tertiary education refers to schooling completed at a university, and this is usually four years for most degree courses, except for the law degree at the University of Botswana, which takes five years.
The number of children in a household: This represents fertility at the household level. While the number of children in a household is not fertility and does not make the births specific to any woman in a household, it serves as a proxy to understand the interrelationships between fertility and household change.
Statistical Analysis
Statistical analysis is carried out in Stata version 15 to assess household size and composition over time and the interrelationships between fertility, age of the household head and household change in Botswana.
Results
Average Household Size and Household Composition
The first question that the analysis seeks to answer is how households have changed in Botswana between 1971 and 2011? Figure 2 below shows that the average household size based on census data has decreased from 5.9 persons in 1971 to 3.7 persons in 2011. Also, Figure 2 shows that the number of children aged 0–14 years falls across all households, while the number of adults has stayed consistent. For example, in 1971, the average household size of 5.9 persons per household consisted mainly of children 0–14 years (2.8 persons), adults aged 15–64 years (2.7 persons), and the rest are adults 65 years and above (0.3 persons). In comparison, in 2011, the average household size is 3.7 persons per household, mainly comprising adults aged 15–64 years (2.3 persons) and children aged 0–14 years (1.2 persons).
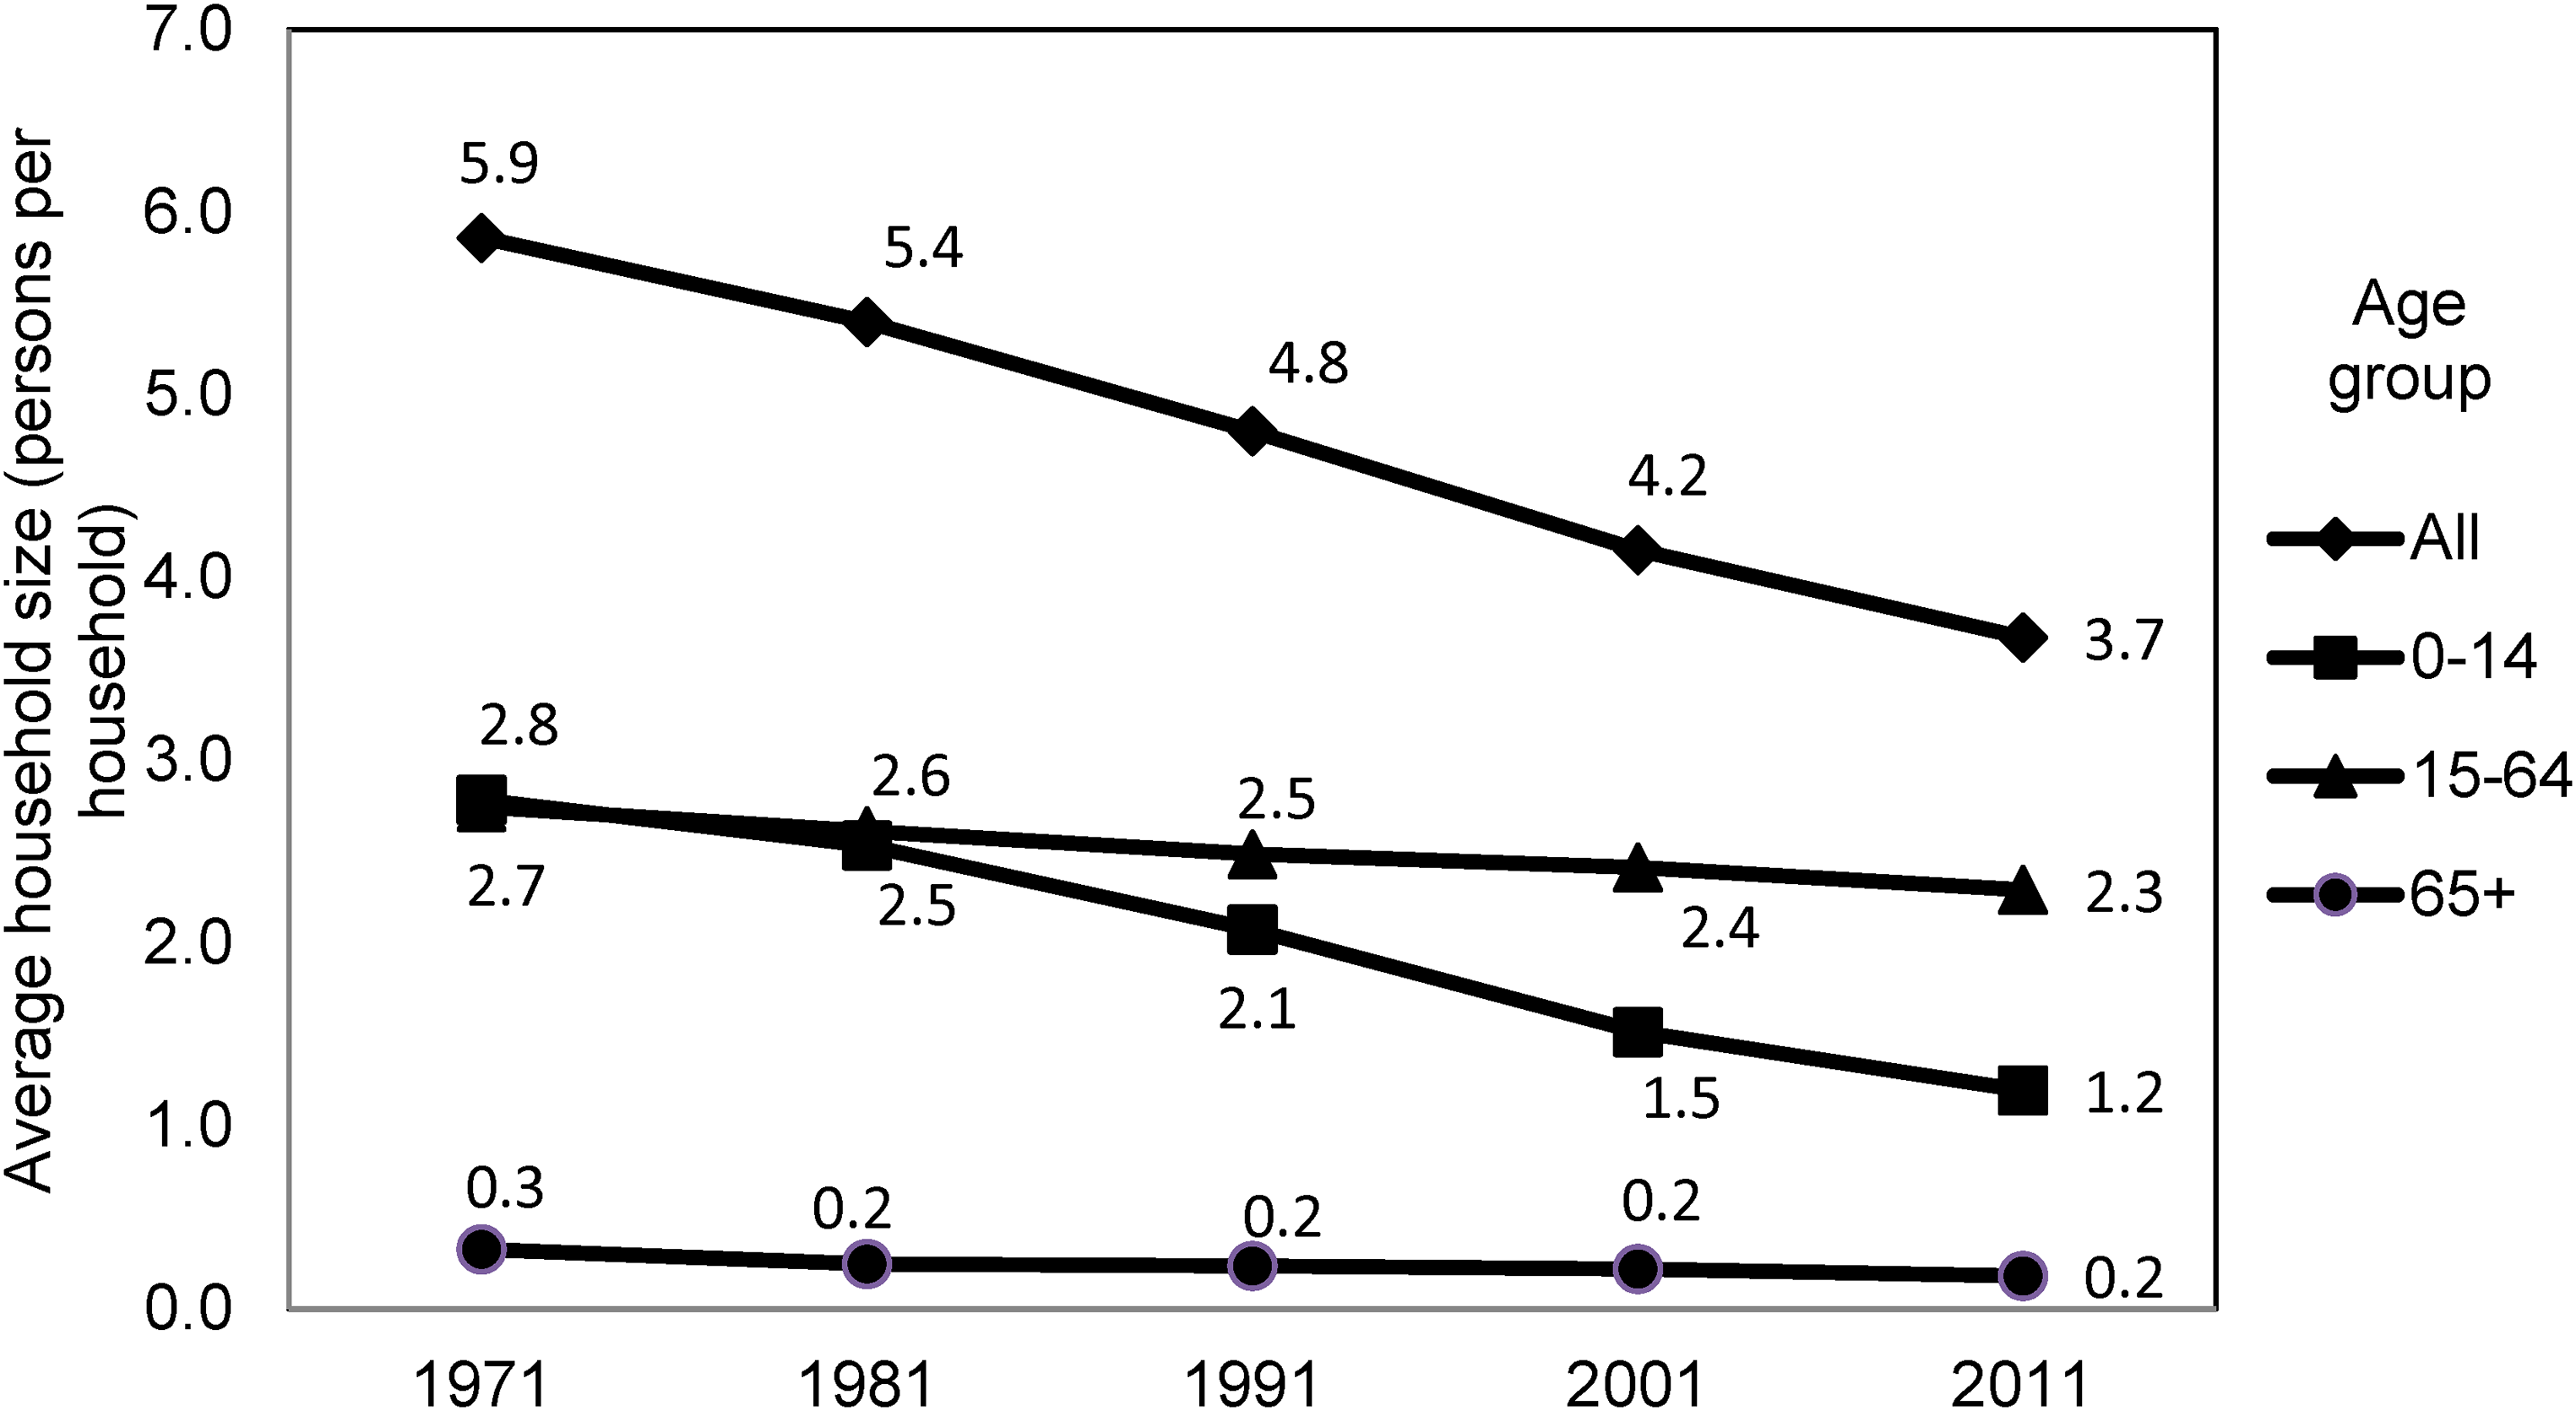
Average household size based on the population aged 0–14 years, 15–64 years and 65 years and above in a household, Botswana census data 1971–2011.
A further examination of the average household size from the 1988, 2000 and 2007 surveys indicates a significant reduction in the average household size during the period. The results showed a drop in household size from 4.9 persons (SD = 3.4) in 1988 to 4.4 persons (SD = 3.1) in 2000 and 3.6 persons (SD = 2.8) in 2007. The results also showed that the average household size was significantly lower in urban than rural areas across time (Table 2).
Per cent Distribution of Households by Size and Residence, Surveys 1988, 2000 and 2007.
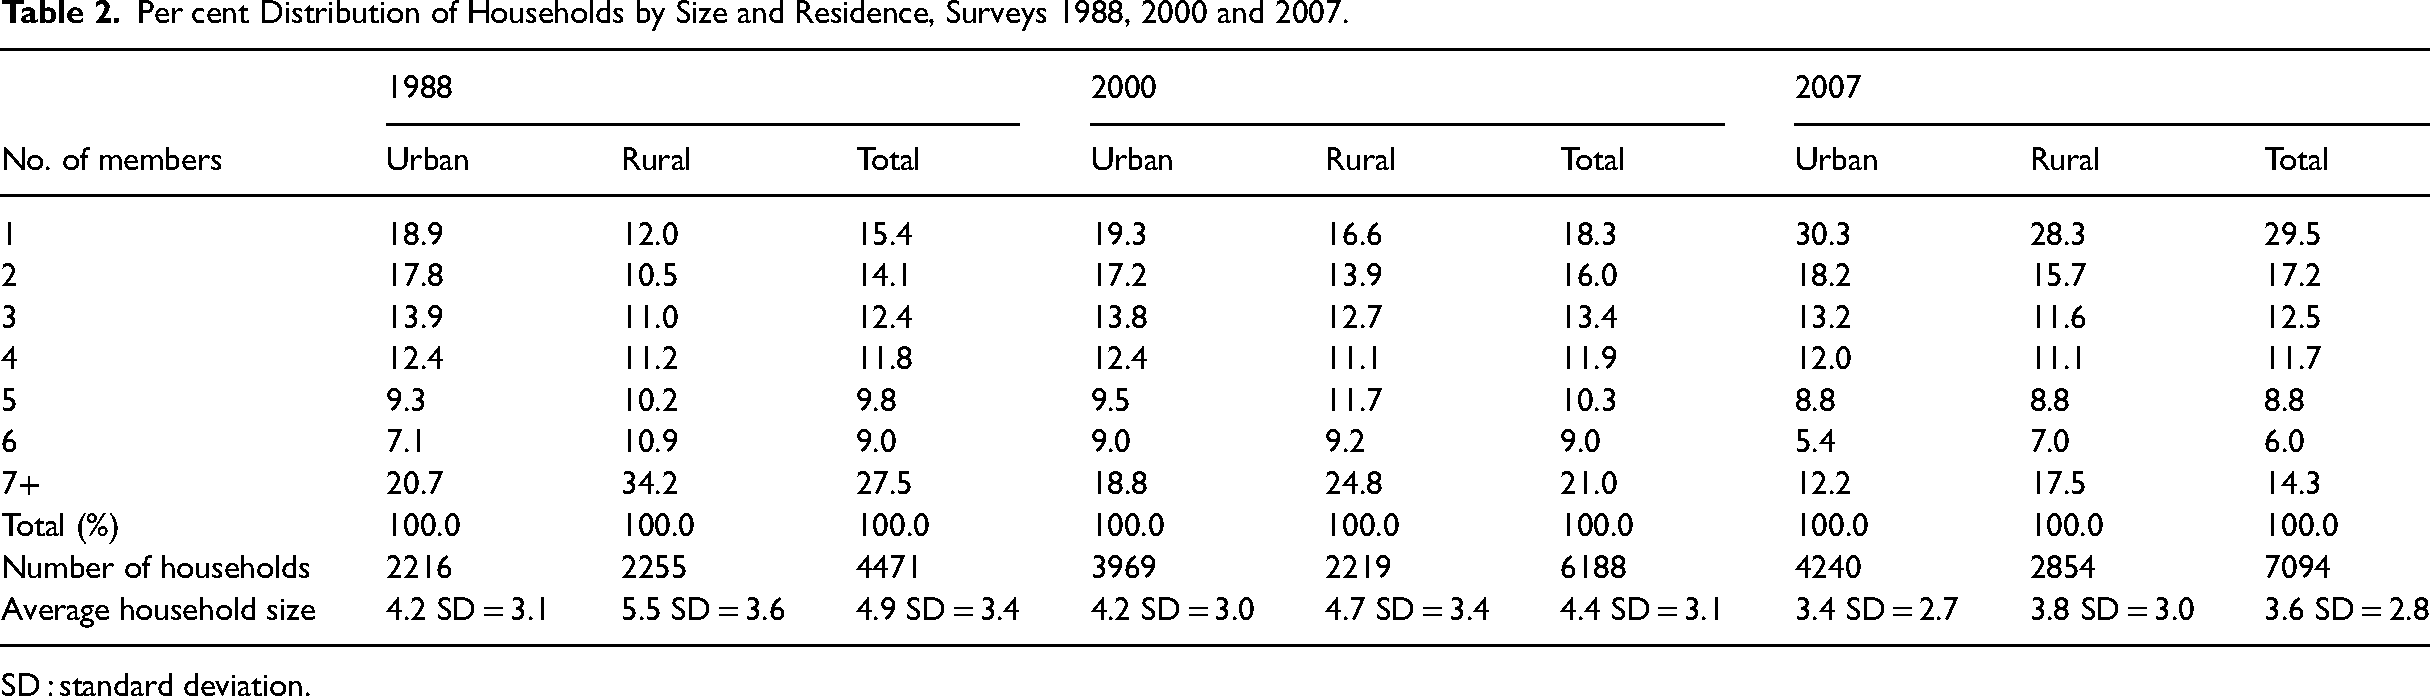
SD : standard deviation.
Over time, the change in household size and membership in Botswana has also resulted in a rise in smaller households. Figure 3 shows an increase in the percentage of smaller households (one person) from 15.4 per cent in 1988 to 29.5 per cent in 2007. At the same time, households with 2–3 persons increased slightly from 26.5 per cent in 1988 to 29.7 per cent in 2007. In comparison, the middle-sized households (4–6 persons) and larger households (7 persons) decreased from 1988 to 2007. Larger households (those with seven persons) dropped from 27.5 per cent in 1988 to 14.3 per cent in 2007 (Figure 3).
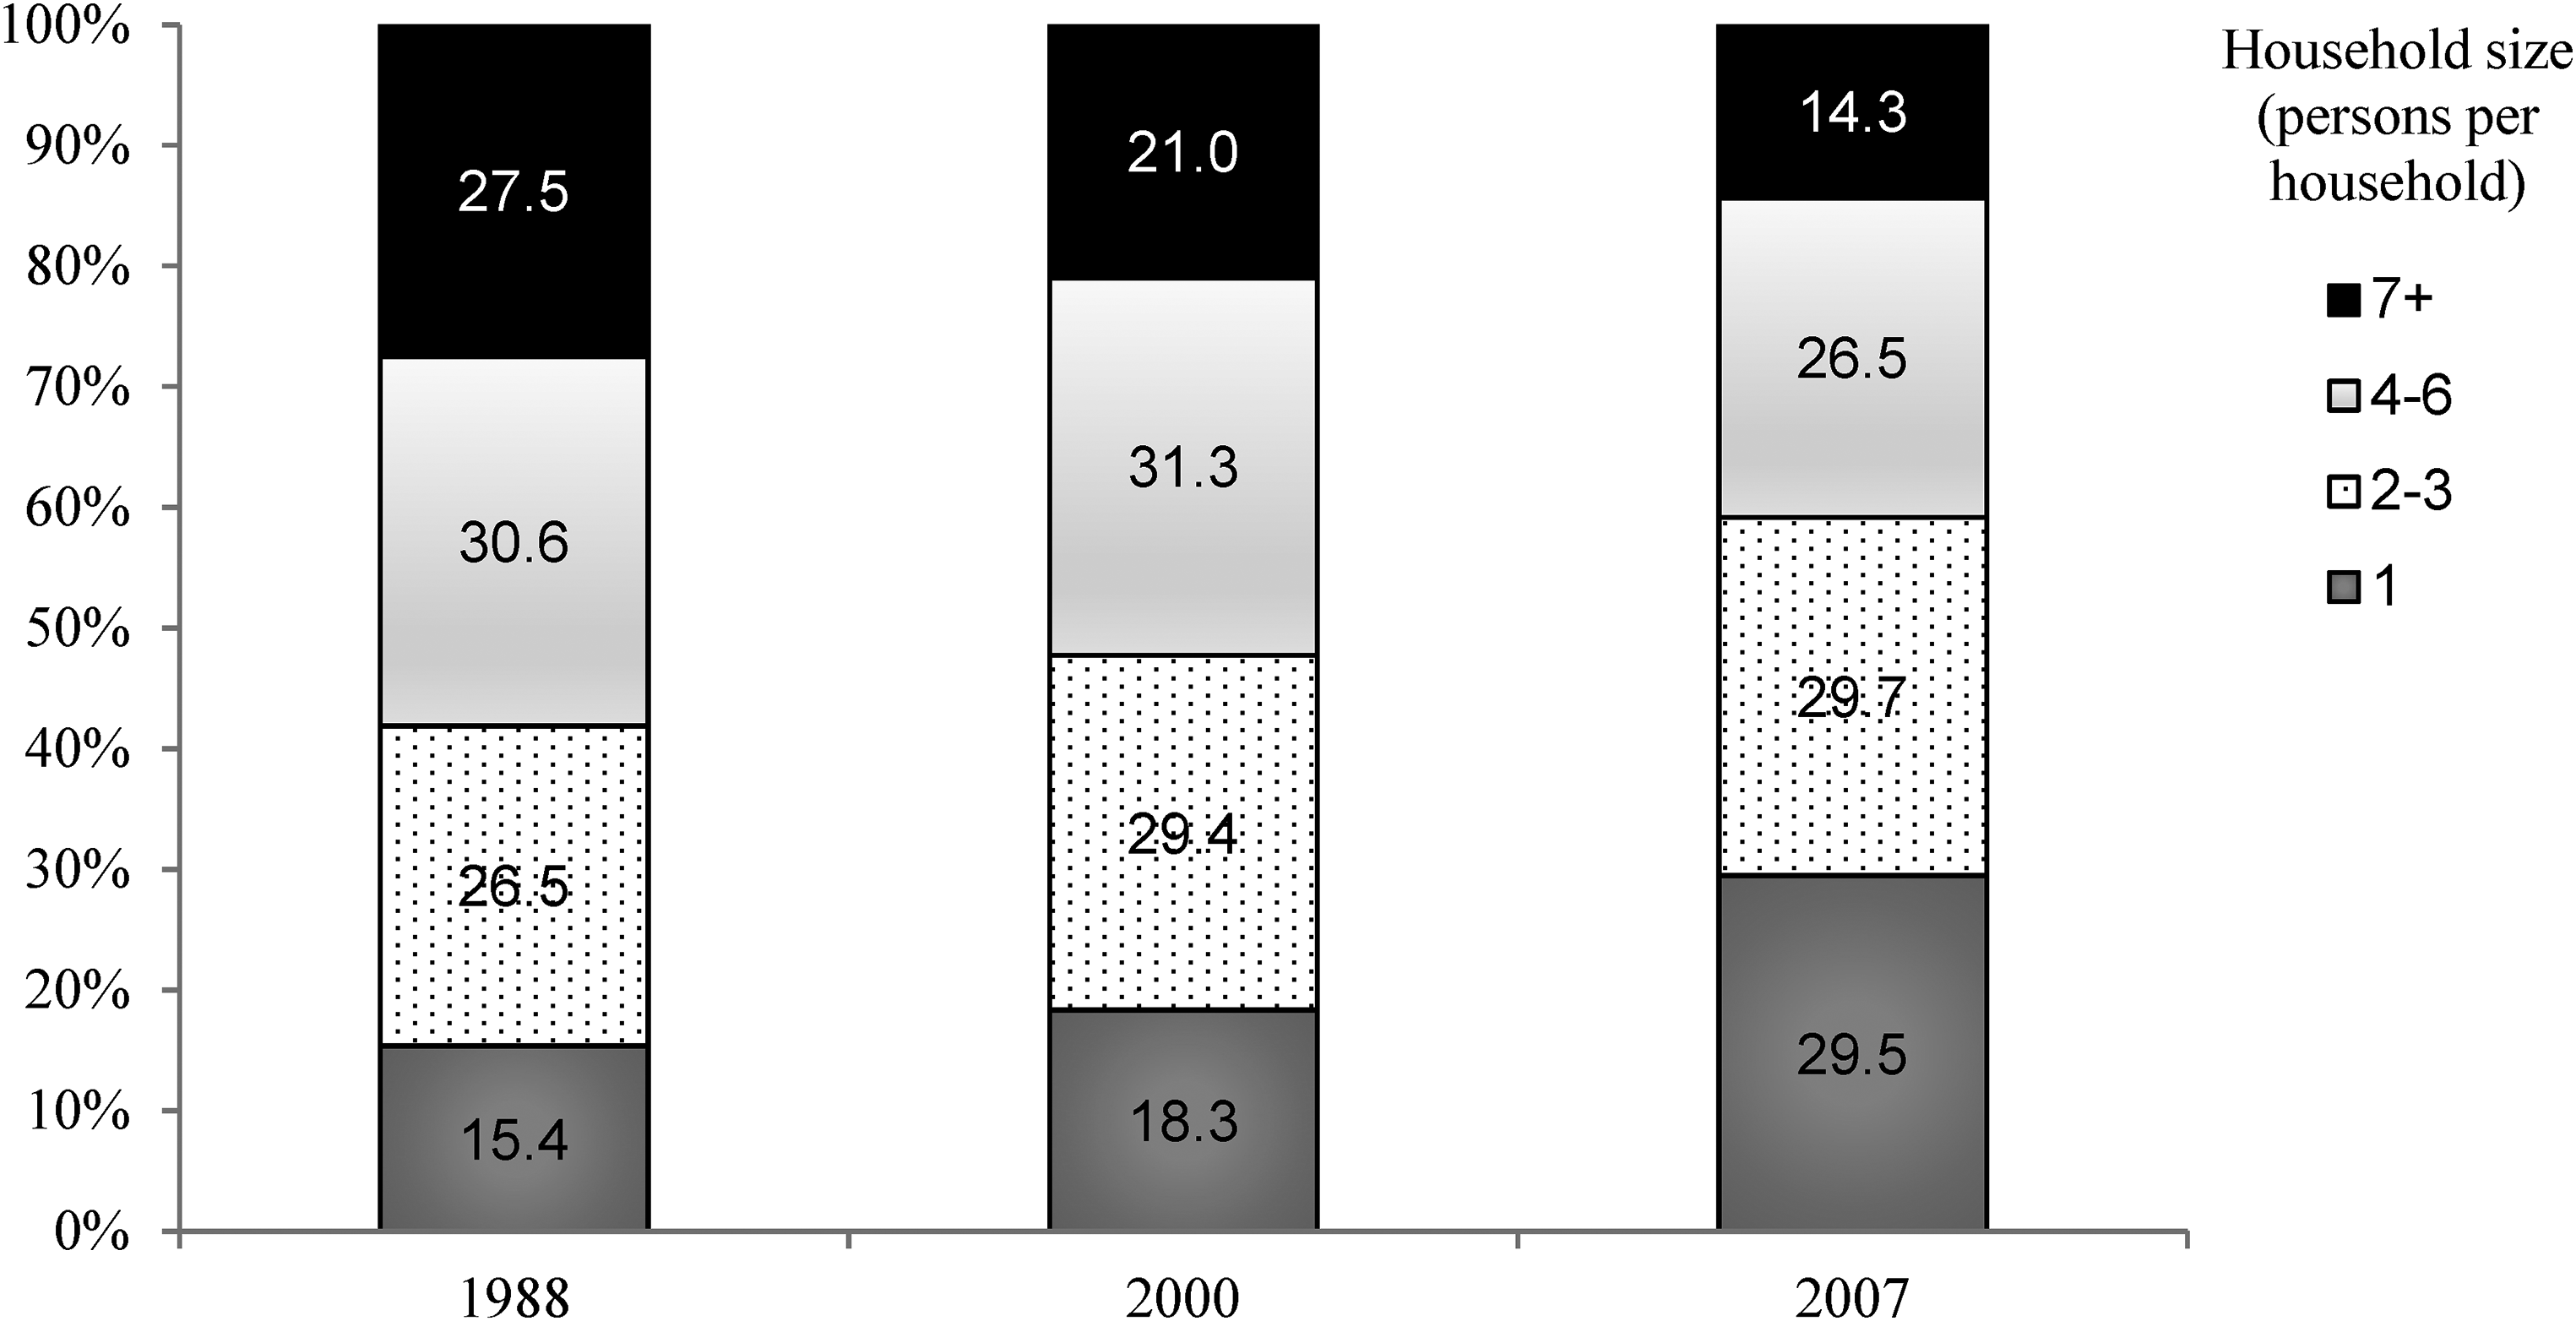
Per cent distribution of households by size. Source: 1988 BSDHS, 2000 MICS, and 2007 BFHS.
Further analysis of one-person households in Botswana shows a distinctive pattern by age group. Figure 4 shows the age pattern of all persons who lived alone in 1988, 2000 and 2007. For both the years: 1988, 2000 and 2007, it appears that people living alone are primarily young (aged 20–40 years), with a peak at ages 25–29 years (Figure 4). Figure 4 also shows that the propensity to live alone declines with age, although it remains higher for females aged 85 and above than for males in the same age group.

Per cent distribution of persons living alone by age and sex in Botswana. Source: 1988 BSDHS, 2000 MICS, and 2007 BFHS.
Sex differences in living alone were also evident in Figure 4. Figure 4 shows the increasing propensity to live alone is high for younger males and females aged 25–29 in 1988 and 2007 and 20–24 years in 2000. Also, Figure 4 indicates that living alone is higher for males aged 40–60 years than for females of the same age between 1988 and 2007. Further, the findings on living alone show that over time, more females at older ages (80 years and above) live alone than males. Generally, females live longer than males in Botswana. The past two censuses show that females’ life expectancy was 57.4 years in 2001 and 70 years in 2011, and this compares to 52 years in 2001 and 66 years for males in 2011
Table 3 classifies households by the relationship of household members to the household head. As shown in Table 3, it is apparent that households in Botswana include a much wider group than just the family, namely extended and non-related persons. However, Table 3 confirms a decline of extended and non-related persons in households, but not their disappearance between 1988 and 2007. The percentage of households with other relatives was 27.8 per cent in 1988, 13.6 per cent in 2000 and 9.0 per cent in 2007. Simultaneously, households with a non-related household member to the household head decreased between 1988 and 2007. Living with a spouse/partner to the household head also declined from 36.6 per cent in 1988 to 28.9 per cent in 2007. The proportion of households with son/daughter to the household head remained notably high over the years: 58.6 per cent in 1988, 55.5 per cent in 2000 and 45.7 per cent in 2007 (Table 3).
Per cent Distribution of Households by the Relationship of Each Household Member to Household Head, Surveys 1988–2007.
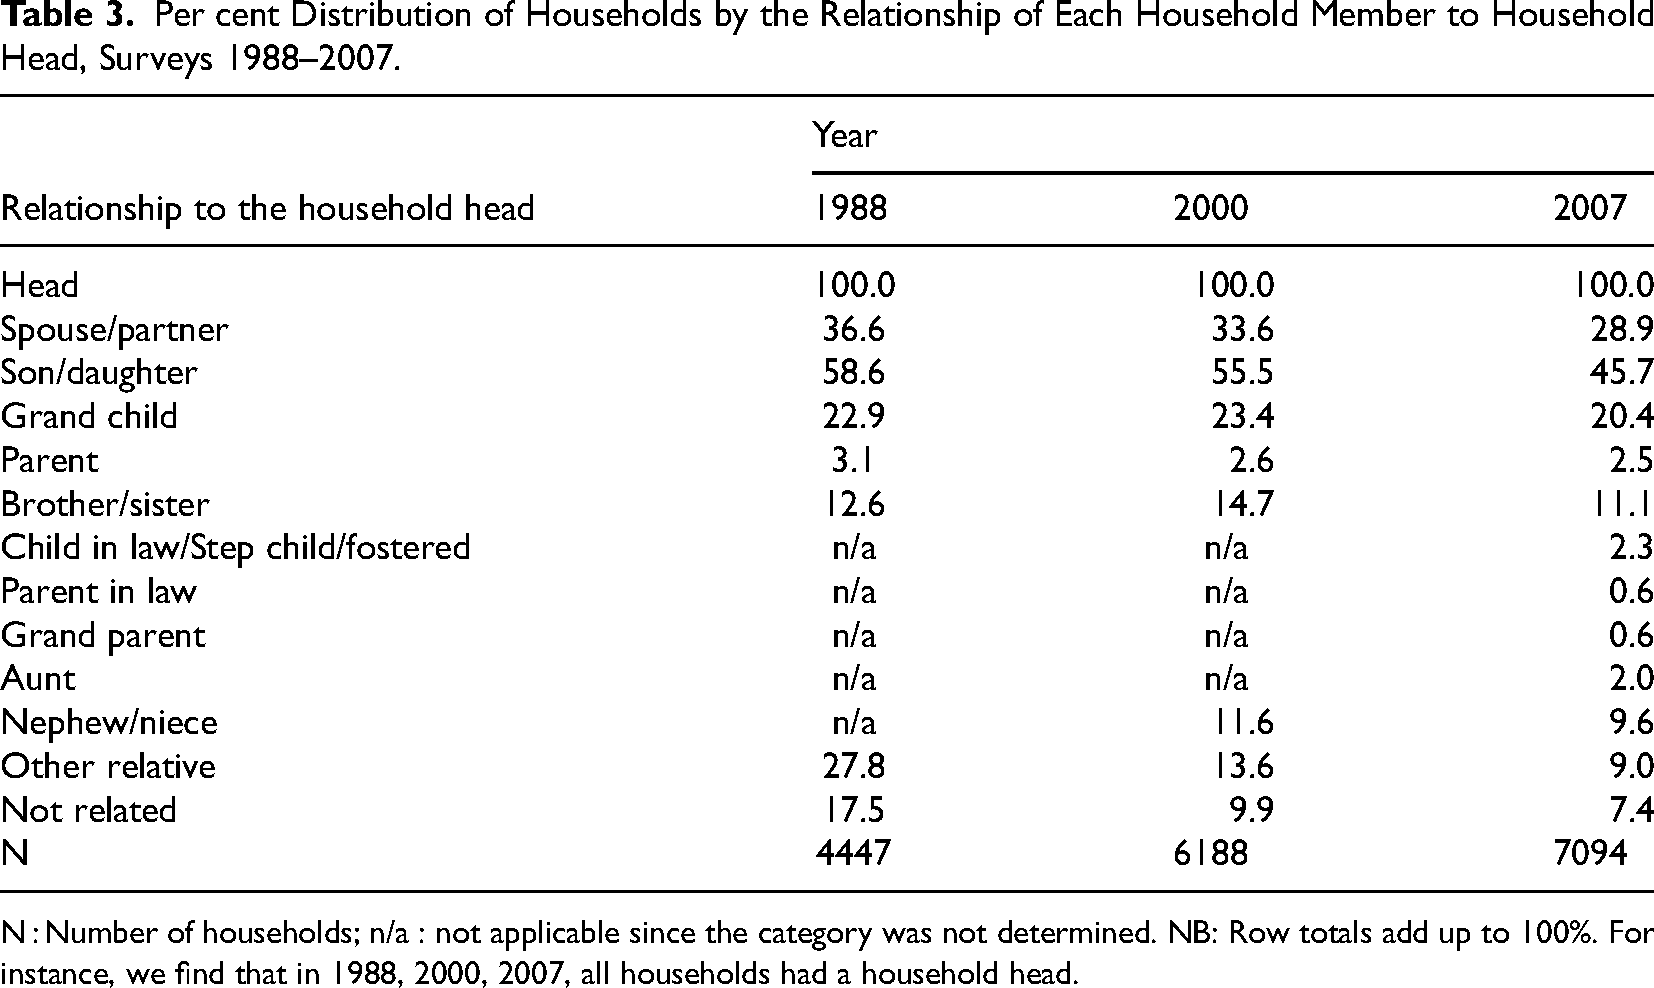
N : Number of households; n/a : not applicable since the category was not determined. NB: Row totals add up to 100%. For instance, we find that in 1988, 2000, 2007, all households had a household head.
Fertility and Household Change During 1971–2011
The results indicate that fertility has been declining over the years in Botswana. The total fertility rate fell sharply from 6.5 children per woman in 1971 to 3.2 children in 1991 and 2.9 children per woman in 2011. Insights into critical social processes driving household change examined which groups of women experienced the most considerable declines in fertility using parity progression ratios (PPRs). Figure 5 examined the parity progression ratios for females who had completed childbearing, those aged 45–49 and 50–54 in 2001 and 2011 by residence. There is a slight disparity in progression from zero to first birth between women in urban and rural areas (Figure 5). However, considering progression to higher parities, an apparent gradient emerges; wherein women in urban areas experience a greater decline in progression to third, fourth and higher parities than those in rural areas. The reductions are much higher in 2011 than in 2001. For example, for women aged 50–54 years, the two to three PPRs in 2001 is 0.91 in urban areas and 0.93 in rural areas. While two to three PPRs among women of the same age in 2011 are 0.87 in urban areas and at a rate of 0.90 in rural areas.

Parity progression ratios by residence for women aged 45–49 and 50–54 years in 2001 and 2011.
Figure 6 presents the results of the parity progression ratios for females in the 45–49-year age group in 2001 and 2011 by the level of education. What is apparent in Figure 6 is that a high proportion of women, regardless of education level, become mothers and go on to have a first child in 2001 and 2011. However, there is a marked drop in the number of women who go on to have a second and third child. For instance, a pattern emerged for two to three PPRs whereby the lowest proportion of women having a third child is highly educated women. In 2011, the two to three PPRs for women aged 45–49 years and with tertiary education was 0.67, compared to 0.78 for those with secondary education, 0.88 for those with primary education and 0.92 for those with no education (Figure 6).
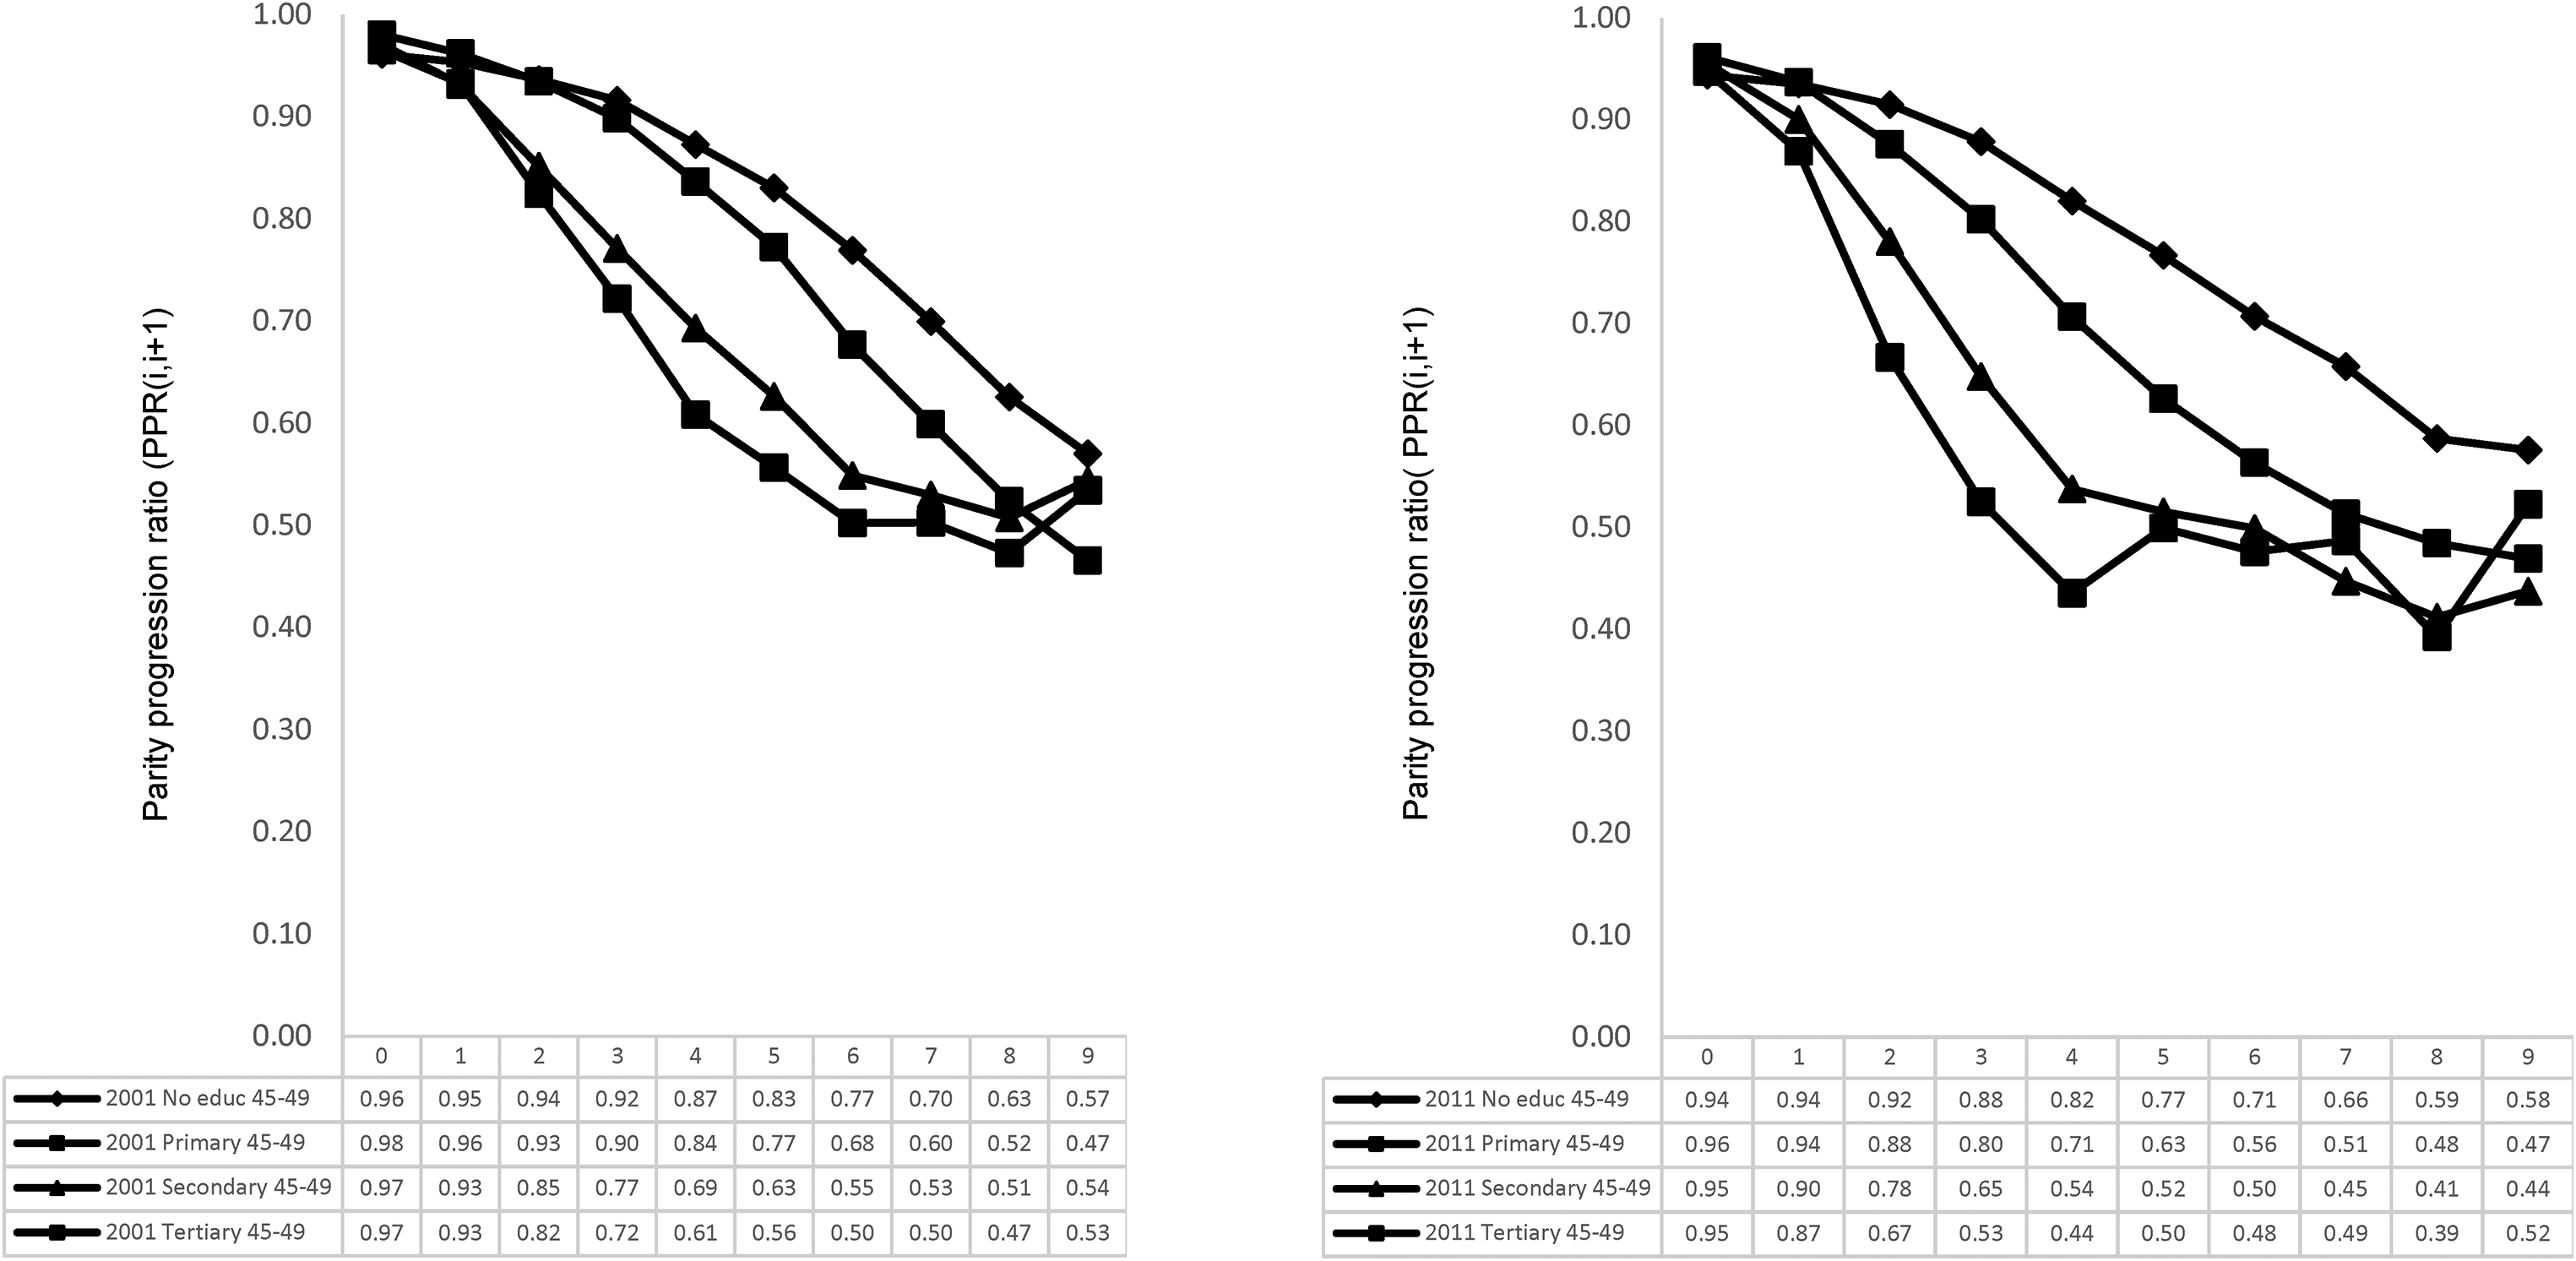
Parity progression ratios for females aged 45–49 for 2001 and 2011, according to their level of education.
Figure 6 also shows that low-educated women (those with primary and no education) progress faster to higher parities than women with secondary and tertiary education. For example, there is a higher decline in the fourth and fifth parity births among women with higher education (secondary and tertiary education) than those with primary or no education (Figure 6). These declines appear more relevant to the fertility pattern in 2011 than in 2001. Finally, for higher parities six and above, the falls in PPRs appear to converge for women with secondary and tertiary education (Figure 6). The PPRs for women aged 50–54 years were also calculated. The graph plotted showed a similar behaviour pattern of a lower proportion of women with secondary and tertiary education having higher birth order births than those with no education and primary education (Results shown elsewhere).
Given the results on the PPRs, it is clear that the urban/rural and educational differences that emerge in fertility patterns among women in Botswana appear to revolve around the third, fourth and fifth birth orders and is linked to fertility decline in Botswana.
Further, a sense of the interrelationships between fertility, age of household head and household change over time was explored. Figure 7 shows that an increasing percentage of households, regardless of the household head's age, have no children aged 0–4 years. Also, Figure 7 shows that having no children under age five is higher among households with younger than older household heads. For instance, Figure 7 indicates that in households with heads aged less than 25 years, the percentage with no children aged 0–4 years increased from 81.3 per cent in 1988 to 87.5 per cent in 2007. While for households with heads aged 40–54 years, the fraction of households with no children aged 0–4 years increased from 50.9 per cent in 1988 to 68.9 per cent in 2007. Among households with heads aged 70 years and over, the increase was from 50.9 per cent in 1988 to 68.9 per cent in 2007.
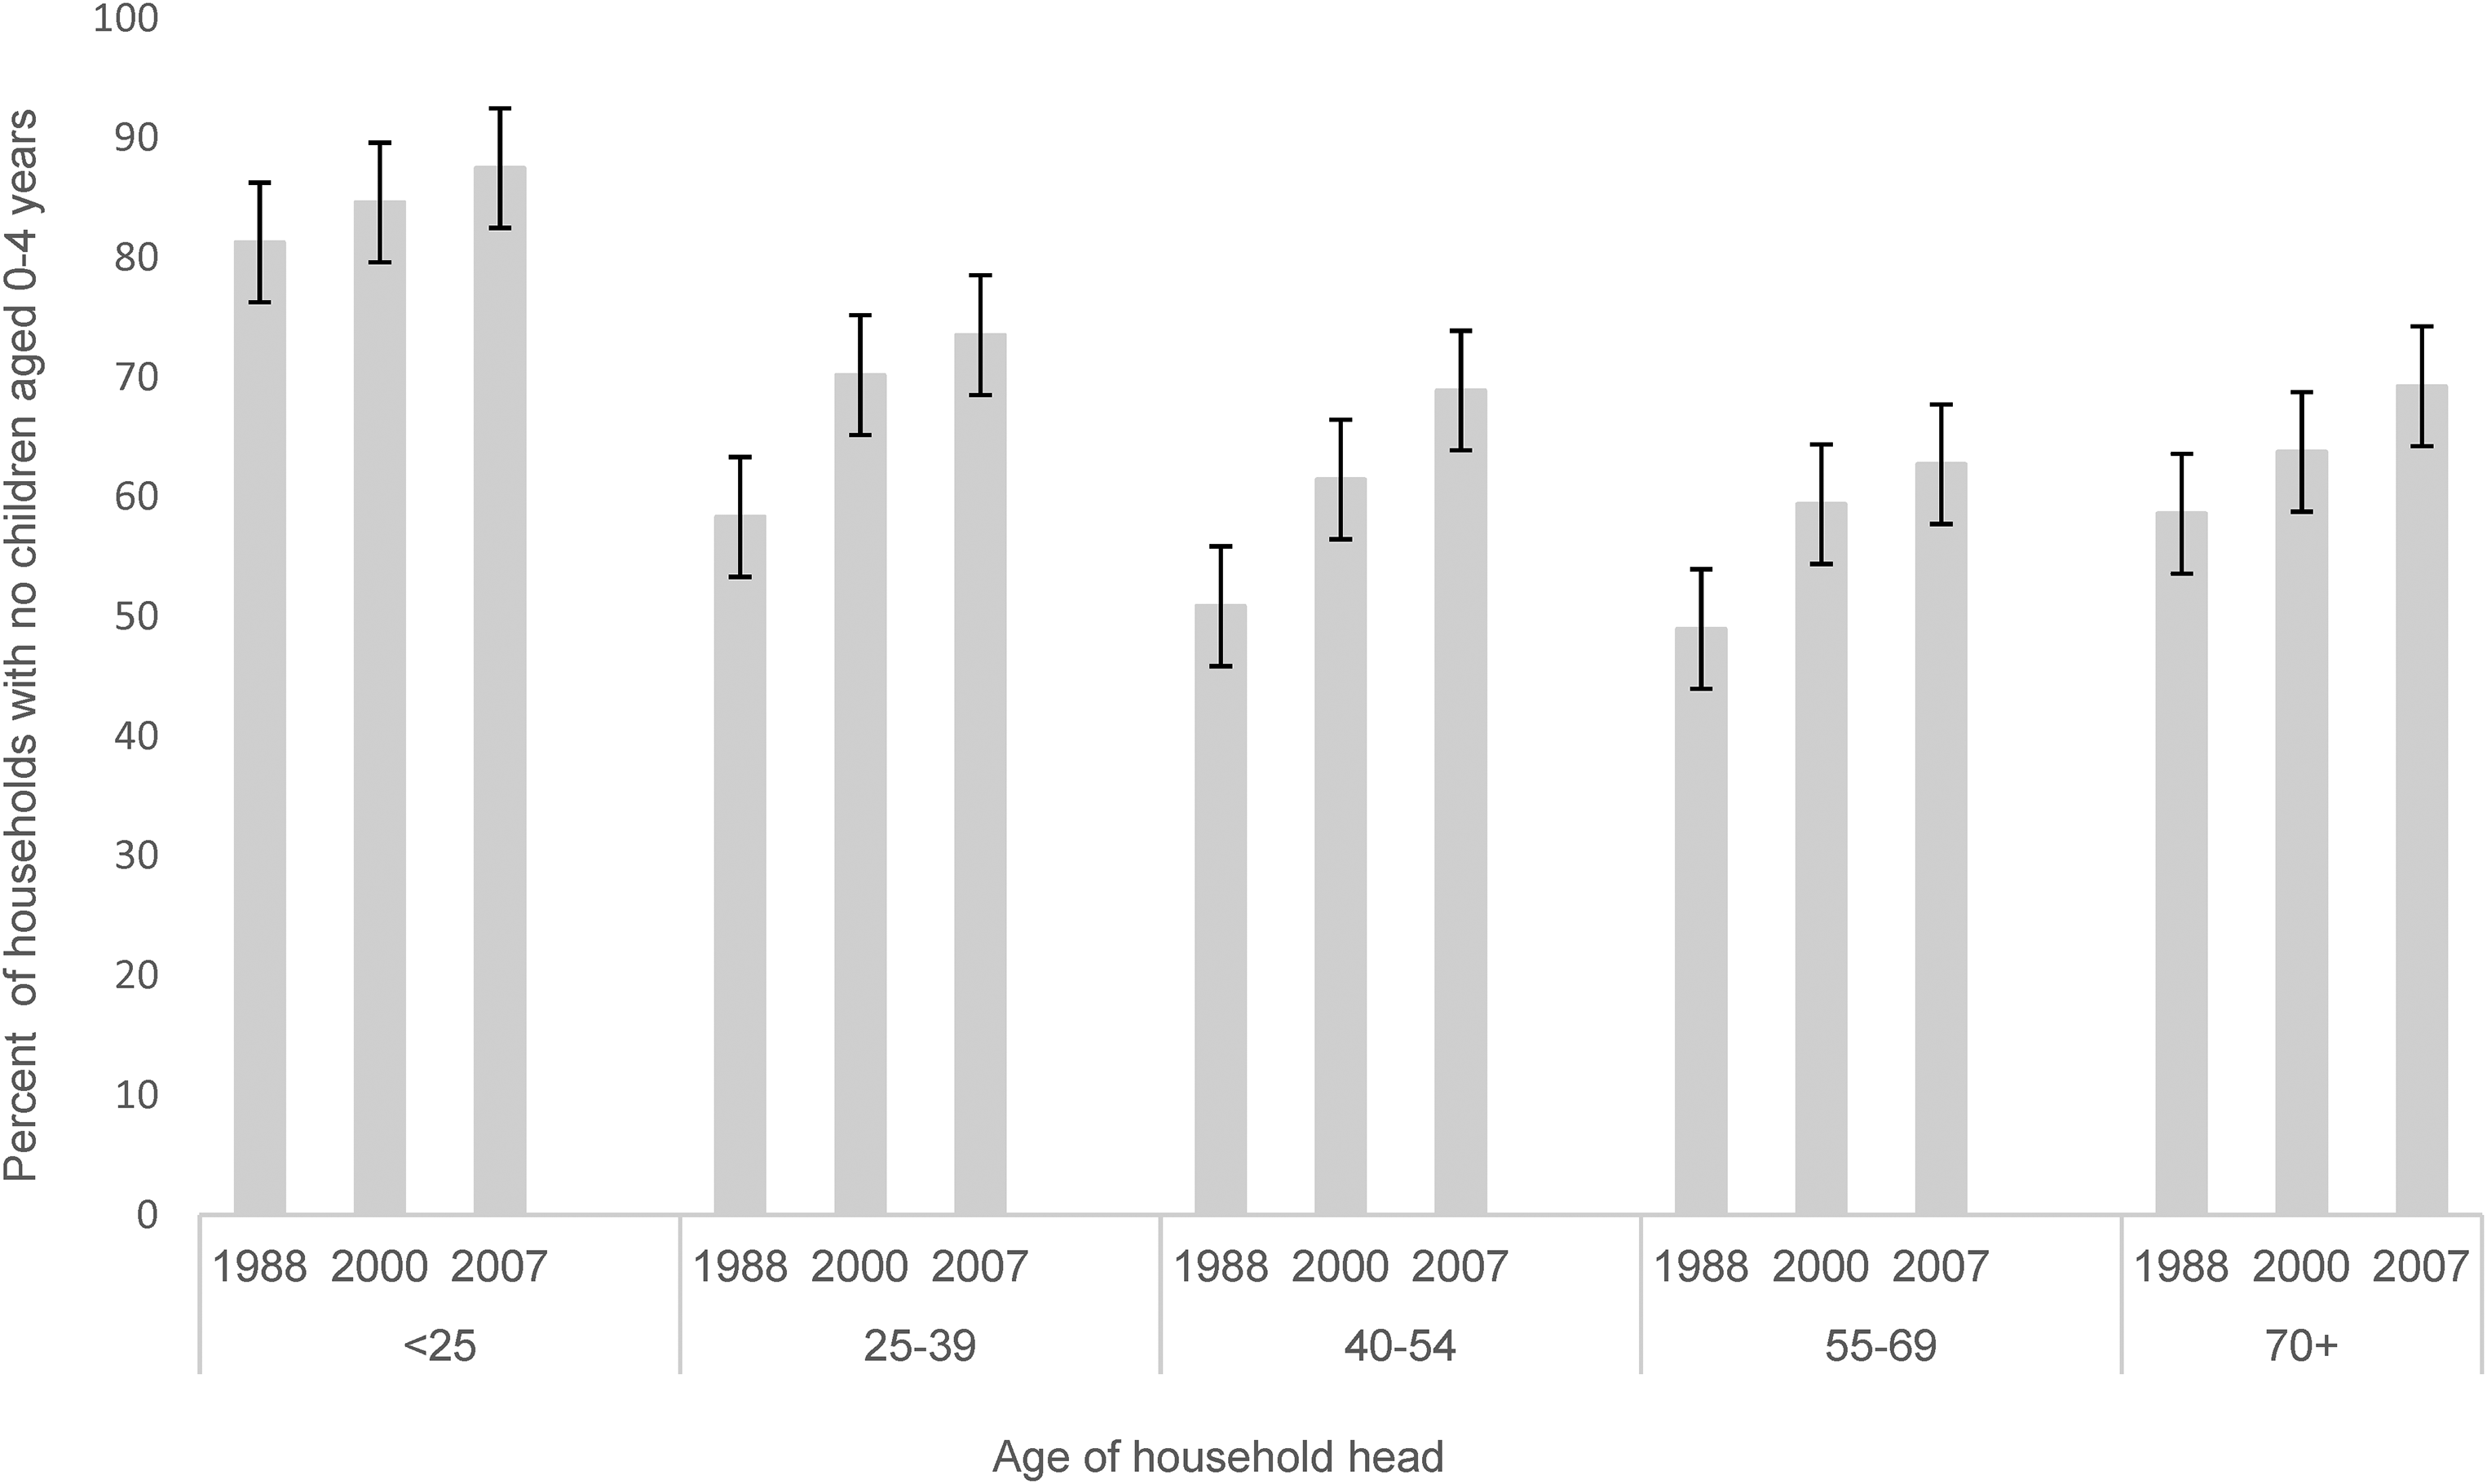
Per cent of households with no children aged 0–4 years by the age of the household head. Sources: 1988 BSDHS, 2000 MICS, and 2007 BFHS.
Further analysis examined the average household size by the age of the household head between 1988 and 2007. Smaller households are significantly more likely to be headed by a younger household head. The analysis reveals a smaller household size for younger household heads (<25 years) compared to older household heads (Table 4). The households in which younger household heads (<25 years) reside is 2.6 persons in 1988 and 2.1 persons in 2007. In contrast, household heads aged 70 years and above stayed in larger households with 5.8 persons in 1988 and 4.7 persons in 2007 (Table 4).
Average Household Size by the Age of Household Head, Surveys 1988, 2000 and 2007.

SD : standard deviation; n : count in the group; 95% CI: 95 per cent Confidence interval.
Discussion
Using census and survey data, this article examines household change in Botswana in the last 40 years (1971–2011). The findings on household size indicate a trend towards smaller households due to a decrease in children per household, a decline in birth rates over time, and a drop in households with many members. The explanation for the decline in Botswana's average house size is supported by evidence from other studies. Several studies in developed and developing countries have linked declines in the average household size to a decrease in the number of children per household due to low birth rates, an increase in one-person households,99-101 and a decrease in households with many members. 102 Further, the analysis shows that the average household size tends to be smaller for younger than older households. The findings on household size and household head's age are consistent with prior research in developing countries. 103
The findings on household head's age and the number of children in Botswana, point to household size differences and membership across households. Since it is unlikely that household heads aged over 70 years and over will have children of their own aged 0–4 years, children in these households imply multigenerational households. On the other hand, a reduction of children aged below five years in a household with heads aged 70 years and over may suggest the decline in fertility and childbearing between 1988 and 2007 among household members of reproductive age (15–49 years) in these households. Older household heads with fewer children host more relatives outside the immediate family. 104
Further, a breakdown of household composition between 1988 and 2007 in Botswana shows that living with family, extended members, and sometimes non-related household members is sustained over the years. However, the number of extended and non-related household members decreases over time. Thus, Botswana's household membership shows that kinship and non-kinship networks are essential support sources, albeit with smaller magnitudes over time. Gaisie 105 and Poukouta 106 noted that a traditional Tswana household rarely comprises only a nuclear family unit; instead, it consists of other family members and sometimes non-related members as housemaids. Also, Gaisie 107 and Poukouta 108 indicate that relatives and not related household members can support the family's social, economic, and political affairs.
The persistent presence of other relatives and non-related household members during the 1971 to 2011 period also indicates Botswana's labour market conditions. Siphambe 109 shows that the changing patterns in employment and unemployment in Botswana have had implications for decision-making and young people's ability to leave the parental home and set up their own. Unemployment rose from 15 per cent in 1991 to 20 per cent in 2001.110,111 The literature on household formation and employment in South Africa also indicates that unemployed people have a lower propensity to set up their households. They stay with parents and close and distant relatives.112,113 Likewise, a study by Ermisch and Salvo 114 from Britain finds that high unemployment rates reduce young people's household formation.
Now, regarding the growth in the number of households, census data shows that between 1991 and 2011, the number of households has increased more rapidly than the total population. A rapid increase in the number of households compared to the total population has been associated with a long-term decline in the average household size.115,116 Further, research evidence indicates that the number of households and the average household size decline is likely contributions of population growth and size distribution shifts to household growth. 117
About fertility in Botswana, there was a decline of about three children per woman between 1971 and 2011. Many factors can explain the decline in fertility in Botswana. An earlier investigation of fertility in Botswana by Rutenberg and Diamond, 118 implies the economic effects of drought on fertility decline in the 1980s. During the 1980s to early 1990s, most men in the South of the country migrated to work in South African mines, leaving females behind to take care of households.119,120 The authors also indicate that the mid-1980s were when family planning services were integrated into maternal and child health services, resulting in the uptake of modern contraceptive methods and reduced childbearing. 121 Further, a study on fertility change in Botswana by Letamo 122 showed that contraceptive use reduced fertility by 25 per cent in 1984 and 31 per cent in 1988. The same author also identified breastfeeding and marriage as important determinants of fertility decline in Botswana during 1980–1990. 123
Beyond the 1980s, evidence indicates that other factors are associated with Botswana's fertility decline. These factors include improvements in female education, participation in employment, declines in marriage rates,124,125 rapid urbanisation in the country, and increasing demand for housing in urban areas.126-128
The fall in fertility in Botswana is expected given that the PPRs for women aged 45–49 years and 50–54 years support the decline in fertility between 2001 and 2011. The results of the PPRs suggest two things. First, some evidence shows that women in urban areas and with higher education have the most significant fertility decline. The findings on PPRs by residents in Botswana show that women with three or more births are becoming rare in urban areas rather than in rural areas. Second, there is a marked drop in the number of women with higher education (Tertiary) who go on to have a third or fourth birth. Botswana fertility levels’ relevant changes revolve around having smaller families, as having one or two children is a social norm over time. Fertility decline in Botswana is also the case given weakening childcare support from families, increased female labour participation, changing norms and attitudes towards low childbearing and preference for smaller households in urban than rural areas.
In addition to the fertility trends mentioned above, the results show a rise in smaller households in Botswana among younger individuals. The results on the propensity to live alone among people aged under 30 years likely reflect a higher proportion of people staying single, low marriage rates and the decline in children aged 0–4 years in households with younger heads. In particular, living alone among males under 30 years is possible as men who are unmarried and have children in Botswana are less likely to stay with their children and family members. As shown in a study on non-residential unmarried biological fathers and parenting in Botswana, most of the children born out of wedlock remain in the custody of their mothers as their fathers often do not have any legal claims to them. 129
There are no ready explanations about differences in living alone by residence in Botswana, except a higher propensity to live alone in urban areas than in rural areas due to the labour market and housing market demands. An account of living alone in Britain and France shows that younger one-person households are much more common in the capital cities of London and Paris and other regional urban centres. 130 This investigation further states that in contrast to rural areas, urban areas can respond to the labour and housing demands created by more people preferring to stay alone. The effects of urban areas on the emergence of living alone in Botswana are likely to be the same as those of Britain and France. Urbanisation in Botswana has increased from 9.1 per cent in 1971 to 45.2 per cent in 1991 and 64.0 per cent in 2011. 131 However, the mechanism through which urbanisation influences living alone is still unclear.
Finally, putting the above changes in households in context, households in 2011 in Botswana were smaller in size, had fewer children, and had fewer extended household members than those in the past. These findings have important policy implications. In the future, it will be essential to understand the relationship between household size and co-residency of adult household members and its implications for issues such as mortality, migration, and resources for household members’ health, care and support. The consequences involving non-related household members in household life are also of importance.
Limitations
This study has some limitations. First, due to the data's cross-sectional nature, the analysis cannot isolate all the demographic and socio-economic characteristics of household change over time. Using data from the censuses and surveys do not tell us anything about the process of household change, as households are identified at each census or survey date rather than followed up. A deep understanding of households and related change processes requires longitudinal data collection and analysis.132,133
Second, the analysis cannot capture the characteristics of household members who are not residents at the census or survey date. Previous studies on the processes of household formation and dissolution in rural areas of Botswana show that at any one time, individual members of households may reside in the village, in the town, at the lands (Masimo), or the cattle post or Moraka.134-136 There is also evidence of multiple links in Botswana between households in the village, town, lands, and cattle post.137,138
Third, other factors not investigated in this study, such as morbidity and deaths due to HIV/AIDS, may be associated with Botswana's household change. HIV/AIDS, the leading cause of adult deaths and morbidity in Botswana, is likely to change those infected’ living arrangements rather than their household dissolution. AIDS has a long incubation period of around 11 years between illness and death. 139 Also, given the almost complete coverage of the ART programme in Botswana to the population who needs it, more people can live longer with HIV, 140 thus lessening the household disruption change due to adult and child morbidity and deaths. Future analysis will control other variables, such as household members’ HIV/AIDS status since household changes have occurred amidst HIV prevalence.
Despite the above limitations, the analysis gives a general picture of Tswana households and conditions, contributing to changes between 1971 and 2011. Many surveys conducted in Botswana collect demographic and household information, but none has detailed such households. Finally, data quality was checked by performing external and internal consistency checks. The analysis data were found to be of acceptable quality and could be used to obtain credible estimates. Additional confidence in the findings is that the data is nationally representative, and Statistics Botswana collected it. Statistics Botswana ensured that the interviewers’ training was thorough and that the accuracy and completeness of the data were checked at all stages of fieldwork and data processing.
Conclusion
This manuscript represents an effort to understand household change and related demographic and social factors in Botswana from 1971 to 2011. The results show that households in Botswana have become smaller and simpler over time-owing to a drop in optimum household membership, an increase in the number of households, a rise in one-person households and a decrease in living with extended family and sometimes non-related household members. At the same time, there is a decrease in childbearing across all households. The most considerable decline in fertility among women aged 45–54 years is found in urban areas than in rural areas and among those with higher education than those with lower education. The analysis of the household head's age and average household size between 1988 and 2007 indicates that younger household heads reside in smaller households than older household heads.
Although the household change analysis is restricted to Botswana, Botswana's situation might signify what is happening in Southern Africa amidst the prevailing socio-economic changes. Further research will collect more household data and extend the analysis to other demographic indicators of mortality, morbidity, migration, and related implications for household members’ health, care, and support. Finally, understanding factors associated with household change helps practice, and it informs family and household policy.
Supplemental Material
sj-docx-1-jfh-10.1177_03631990241265712 - Supplemental material for Household Change and Related Demographic and Social Indicators in Botswana During 1971–2011
Supplemental material, sj-docx-1-jfh-10.1177_03631990241265712 for Household Change and Related Demographic and Social Indicators in Botswana During 1971–2011 by Oleosi Ntshebe in Journal of Family History
Footnotes
Author's Contributions
The author was responsible for all the stages in the manuscript development: conceptualization, preparation, data analysis, and write up.
Availability of Data
Statistics Botswana owns the data used in the current analysis. The data sets used in the current study are available to other researchers with the approval of Statistics Botswana. Alternatively, other researchers can apply to gain access to the data from Dr Enock Ngome, Head of Department of Population Studies, University of Botswana at email: NGOME@ub.ac.bw
Code Availability
Code for the current submission is available from the corresponding author on reasonable request and with permission of Statistics Botswana.
Consent to Participate
Informed consent was obtained from all individual participants included in the study.
Declaration of Conflicting Interests
The author declared no potential conflicts of interest with respect to the research, authorship, and/or publication of this article.
Funding
The author received no financial support for the research, authorship, and/or publication of this article.
Ethics Approval
Supplemental Material
Supplemental material for this article is available online.
Notes
Author Biography
Supplementary Material
Please find the following supplemental material available below.
For Open Access articles published under a Creative Commons License, all supplemental material carries the same license as the article it is associated with.
For non-Open Access articles published, all supplemental material carries a non-exclusive license, and permission requests for re-use of supplemental material or any part of supplemental material shall be sent directly to the copyright owner as specified in the copyright notice associated with the article.