
Abstract
This work contributes to the almost nonexistent literature on the profit rate of the financial sector. It updates the single study to include financial variables to cover the past decade, compares this profit rate to the (almost unpublished) Weisskopf and NIPA financial profit rates, compares the financial and nonfinancial sector rates, and details the procedure to construct the profit rate in the financial sector including relevant financial variables which capitalists consider to make profit-rate decisions.
1. Introduction
One nearly universally accepted stylized fact about the neoliberal form of capitalism is that it has involved a “financialization” of the economy in comparison to the capitalism which existed before it. There are two distinct though thoroughly intertwined aspects to financialization. The first is the universally accepted fact that by many different measures the financial sector has grown relative to the nonfinancial sector. See for example Crotty (2007) and Bakir and Campbell (2010). The second is the important growth in the role of financial relations to and in the nonfinancial sector. This paper is concerned with the financial sector.
In the classical tradition, relative growth of a sector is typically, though not always, driven by a higher rate of profit in that sector, and more broadly profit rates and profit-rate differentials are central to explaining a sector’s dynamics. This paper will consider the minimally empirically studied rate of profit in the U.S. financial sector.
Since the seminal 1 papers for the current dominant empirical methodology for profit rates by Weisskopf (1978, 1979), a number of people have done empirical calculations of the rate of profit using his conceptual formula (gross value added – workforce compensation – capital depreciation)/(fixed capital stock + inventories). 2 Among others these include Holland and Meyer (1980), Allman (1983), of course the continuing work by Weisskopf with his co-authors Bowles and Gordon (1986, 1989), Duménil first with Glick and Rangel (1987a, 1987b), then with Glick and Lévy (1988, 1993), and then a large number with Lévy (among others 1992a, 1992b, 2002a, 2002b, 2004), Michl (1988), Baker (1996), Wolff (2001, 2003), Brenner (2002), Bakir and Campbell (2006, 2009, 2010), Shaikh (2010), and Basu and Vasudevan (2013). Much data are readily available for this from the Bureau of Economic Analysis (BEA) for the United States, and over the years an increasing amount has become available for a number of other countries. We consider this and its extension to include financial variables which the paper will discuss to be the best empirical approach to considerations of broad measures of the rate of profit in national economies.
The majority of these studies were done on the nonfinancial corporate business (NFCB) sector of the economy. Some were on the narrower manufacturing sector, some expanded to the full corporate sector (financial (FCB) as well as nonfinancial), and a few later ones even extended to the full business 3 sector by including the noncorporate business (NCB) sector. As the NFCB makes up roughly 65 percent of the value added by the business part of the economy whose capitalist dynamics we are concerned with, its behavior could be expected to strongly contribute to the overall behavior, but its weight is clearly not enough by itself to assure it will be a good proxy for the whole capitalist economy. 4
The first paper to present an empirical investigation using Weisskopf’s general framework of the rate of profit in the financial sector was Duménil and Lévy (2004). Their paper did not merely apply the general Weisskopf approach to the financial sector, however, but additionally extended it conceptually. The broadest concept of a rate of profit is the total profits gained divided by the capital tied up in the process of obtaining the profits. To the capitalist who is deciding where to put her money and hence determining the dynamics of the system, it does not matter if the profits are “real” in the sense of the value of the output minus costs, or if they are “financial” such as capital gains, earnings from money lent, and so on. Similarly in regards to her capital being tied up, she does not care if it is in fixed capital or in financial assets connected to obtaining the profits. Such financial variables are also important to capitalists operating in the nonfinancial sector, but they are much more visible in the financial sector. We follow Duménil and Lévy’s terminology and refer to this inclusive of financial earnings and capital as the “augmented rate of profit.”
The rest of the paper presents the following considerations concerning the financial rate of profit. Section 2 briefly presents the economic arguments of Duménil and Lévy for their formula for the augmented financial rate of profit, and then updates their empirical results by ten years to present its behavior over the buildup to and entry into today’s economic crisis. Section 3 then considers the degree of similarity of this careful and relatively complex measure to the simpler and more common 5 Weisskopf and NIPA approaches applied to the financial sector. This will enable us to decide if one would be justified in using the operationally much simpler Weisskopf or NIPA approaches as a close proxy for the economically better grounded approach of Duménil and Lévy. Section 4 concludes. The detailed technical appendixon exactly how the economic formulas have been operationalized is considered pedagogically important because we believe that the technical appendix in Duménil and Lévy’s pioneering work is opaque.
2. The Duménil and Le.vy (2004) Financial Rate of Profit
As detailed in the appendix , the conceptual basis of the NIPA rate of after-tax profit is (gross value added – depreciation – workforce compensation – taxes – net interest – net transfers)/(fixed capital stock) = r’ = Π/K. 6 Considering all the financial gains and losses that capitalists consider in evaluating their profits, the augmented rate of profit adds the following financial variables to the numerator to give the augmented profit. First, dividends received (DVD). 7 Second, holding gains (HG) on assets. Third, the depreciation of the value of net liabilities (NL) due to inflation (COR = j.NL for inflation j). And finally, an additional source of profits for domestic enterprises that is not necessarily financial but is not included in Π and so must also be added to get total profits: foreign earnings retained abroad (FERA).
Similarly, to consider the total capital or net worth (NW) tied up in the process of obtaining the profits, it is necessary to add financial assets (FA) and subtract liabilities (L) from the already considered fixed capital. In terms of net liabilities (NL=(L-FDI)-FA), 8 NW=K–NL.
Together these give the augmented rate of profit r*=Π*/NW=(Π+DVD+HG+COR+FERA)/NW. Figure 1 presents the augmented rate of profit in the financial sector from 1947 to 2011. (The other two curves will be discussed in the next section.)

The “Weisskopf,” “NIPA,” and “Augmented” Profit Rates for Financial Business
From the graph of the augmented rate of profit for the financial sector one can see two results.
Concerning its level, it vacillated around 10 percent through the 1950s, began to fall in the early 1960s until the mid-1970s, and began a sustained recovery after 1982. By the 1990s it was back to 10 percent, and it has again vacillated around there since then. While it is generally held (see the above cited works) that the rate of profit in the NFCB sector only partially returned to its pre-decline levels, the augmented rate of profit in the financial sector fully recovered.
Subsequent to its 1982-1997 recovery, its volatility has become much greater. The data clearly demonstrate what one might expect a priori: a profit rate that includes holding gains and losses on financial assets (which capitalists do include in their profit-rate decisions) would fluctuate much more sharply in the presence of large asset bubbles and their collapses, as was the case at the beginning of the 2000s and after 2007. Recall that the only previous published results on the augmented financial rate of profit in 2004 ended just when this new more volatile regime began, and so could not document this change in behavior.
3. Two Other Measures of the Financial Rate of Profit
While the case for including the financial variables in the augmented financial rate of profit presented in the last section is economically persuasive, the complexity of doing so raises the question: how different empirically are the results of including these variables from what one would get without them?
Figure 1 presents two other measures of the financial rate of profit that do not have the augmenting financial variables, whose logic and construction are detailed in the appendix. The empirical data presented here suggest the following answer to this question. The Weisskopf rate of profit in the financial sector does roughly track the augmented rate of profit, but not tightly. In particular, it does not capture the sharp drops in profitability in the financial sector that came from collapses in the contributions from the financial variables, such as in 1991-2, 1999, 2007, and back in 1973-5. The NIPA rate of profit, which is an improvement on the Weisskopf rate in that it properly treats net interest paid as a cost instead of a profit, does a worse job of tracking the augmented rate, particularly prior to neoliberalism but even somewhat worse today. What we can expect then is that the Weisskopf or NIPA rates of profit will in general at best be rough proxies for the augmented rate of profit in the financial sector, and become poor proxies if the rate of profit has strong (and in particular volatile) contributions from the financial variables.
4. Conclusion
Economic reasoning implies that considerations of, and research on, the rate of profit in the financial sector of the economy should include considerations of financial income, financial costs, financial assets, and financial liabilities, since the owners of capital make their decisions in the real world including the effects of these variables. This paper extends over the last decade the only previous such study, compares the results to those one would get if one used the Weisskopf-type or NIPA-type profit rates (without the additional financial variables except “Net Interest Paid” for the latter) that have been used for studies of the nonfinancial sector but never the financial sector, and compares below the profit rates of the financial and nonfinancial sectors including the effects of the financial variables that real-world capitalists consider.
This paper concludes:
The rate of profit in the financial sector fully recovered to its levels prior to the long decline that began for it in the early 1960s.
After recovering its pre-decline level by around 1991, the augmented profit rate in the financial sector had much greater volatility than ever before.
The “Weisskopf” and “NIPA” rates of profit in the financial sector (not published before, but here computed according to their use in the nonfinancial and entire business sectors) are under the best of conditions only rough proxies for the augmented rate of profit in the financial sector, and become very poor proxies when the omitted financial variables are volatile or otherwise important.
The final two conclusions about the rate of profit in the financial sector involve its relative behavior to the nonfinancial sector. The augmented rate of profit for the nonfinancial sector is determined analogously to the description for the financial sector in the appendix. Figure 2 presents the comparison.
The rate of profit in the financial sector, which is generally held to have been higher than in the nonfinancial sector under neoliberalism as a characteristic aspect of that form of capitalism, indeed has been markedly higher over the last two decades. A very important result, however, is that it was not so over the 1980s, neoliberalism’s first decade while it was still establishing itself in the United States.
The recovery of the rate of profit of the financial sector (or its growth) under neoliberalism was stronger than the recovery of the nonfinancial sector. It went from generally below the nonfinancial sector in the 1970s to above it by the 1990s and 2000s. While the nonfinancial sector never fully recovered to its high rates of the 1960s (consistent with the results of other Weisskopf-type and NIPA-type studies for the nonfinancial sector), the financial sector as noted in the first point of this conclusion did.
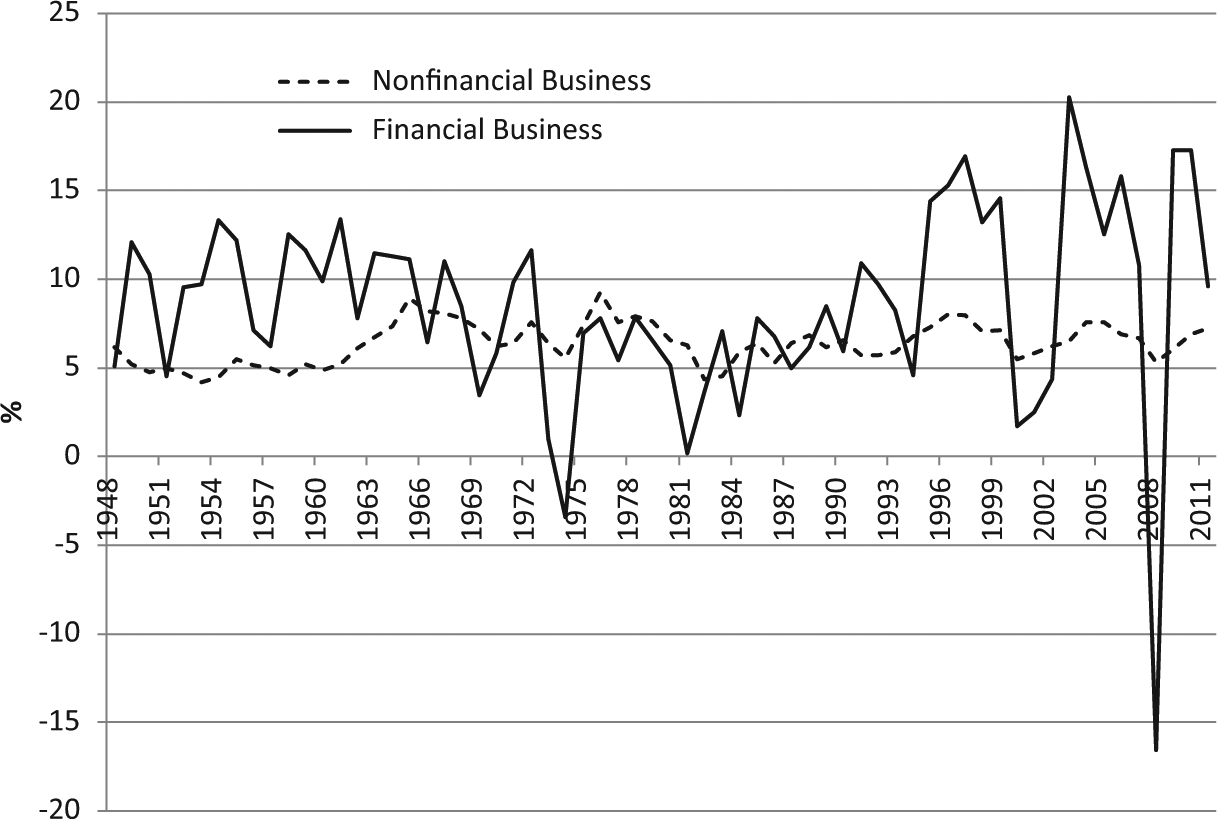
Financial Business and Nonfinancial Business Augmented Rates of Profit
Footnotes
Appendix
Looking at NIPA Table 1.14 as one reads the following economic explanation will aid in following its logic. Gross value added minus the consumption of fixed capital (“depreciation”) gives the net value added (NVA). If one begins with the concept that profits are that part of net value created not paid out to workers as labor compensation (COMP) or to the government as taxes (TAX), one can make a first definition of profits that one finds in the literature which we will call “profits after taxes (Weisskopf) 9 (PAT).” PAT=NVA-COMP-TAX. NIPA tables divide taxes into two parts, taxes on production less import subsidies (TAX1) and taxes on corporate profits (TAX2). The former is not part of what they define as net operating surplus (NOS) while the latter is, but we want to combine them to make a single concept of taxes for considering the allocation of net value. Hence we define TAX=TAX1+TAX2, and then PAT=NVA-COMP-TAX=NOS-TAX2. From NIPA Table 1.14 one sees that NOS-TAX2 consists of four parts: net interest and miscellaneous payments (“net interest paid,” NIP), business current transfer payments (net) (“net transfers paid,” NTRP), net dividends (“net dividends paid,” NDP), and undistributed profits with IVA and CCAdj (“retained earnings,” RE). Since the appropriate concept of profits is retained earnings plus dividends paid out to owners, 10 this PAT includes as profits two terms that should be costs, NIP and NTRP.
While this gives the economic concept of PAT, two final adjustments need to be made to the sector covered to give the numbers we use. In the NIPA data on the financial sector they include the Federal Reserve banks. While they indeed technically have a corporate structure (owned by the member banks), their capital does not behave as private capital, and so we exclude them like the government sector.
Using this procedure with the data from the lines specified below from NIPA Tables 1.14 and 6.9 gives the financial corporate business (FCB) profit PAT. To expand this to the financial business (FB) sector involves first specifying which part of the financial noncorporate net earnings will be treated as labor compensation and which as profit, and then adding the latter to the FCB PAT to get the FB PAT (similarly for financialized profits Π and Π* explained below). This process has been clearly explained since Duménil, Rangel, and Glick (1987) in a number of papers by Duménil and Lévy including Duménil and Lévy (2004), and so will not be included here for reasons of space. 11
Dividing this by the fixed capital stock (K) 12 gives what we call “the Weisskopf rate of profit,” r=PAT/K.
The entry in NIPA tables called “profits after tax with IVA and CCAdj” 13 is also used in the financial profits literature as a profits estimate. We call this “profit after taxes (NIPA)” (Π). Π=PAT-NIP-NTRP=RE+NDP is an improved estimate of after-tax profits over PAT in that it removes from profits the inappropriately included costs NIP and NTRP.
Dividing this as before by the fixed capital stock gives what we call “the NIPA rate of profit,” r’=Π/K.
Finally we document the corrections to the profit and profit rate necessary to include the considerations of additional financial variables that capitalists consider in the real world, to go from Π to Π* and r’ to r*. Note that PAT, Π, r, and r’ were all calculable from BEA’s NIPA and Fixed Asset tables. A combination of NIPA and FoF data is needed for the augmented rate of profit to follow (a reason that it both was not developed sooner and is not used more widely today).
The first correction necessary to Π is the addition of dividends received (DVD) to change net dividends in Π to the proper profit concept dividends paid, as referred to in footnotes 7 and 10.
Two changes in financial stocks operate equivalently to profits in that they increase wealth: holding gains (HG), and the depreciation of net liabilities (NL=(L-FDI)–FA, liabilities minus foreign direct investment 14 minus financial assets) by inflation (j), j.NL, which we label COR. Holding gains are on corporate equities (HG(CE)), mutual fund shares (HG(MF)), and U.S. direct investment abroad (HG(USDIA)), hence HG=HG(CE)+HG(MF)+HG(USDIA).
A final source of income that contributes to total profits is foreign earnings retained abroad (FERA).
Augmented profits are then Π*=Π+DVD+HG+COR+FERA.
The denominator of the rate of profit that includes considerations by the capitalists of all the capital they tie up adds net financial assets (the negative of net liabilities defined above) to the fixed capital (K), which is called Net Worth (NW=K-NL).
Hence the augmented rate of profit is r*=Π*/NW.
In the table of data sources below anything listed as x.y or x.y.z. is a NIPA table, while anything listed F.xxx or L.yyy is a Flow of Funds (FoF) table.
Π “Simple Rate of Profit” 1.14 (line 13 − line 29) − 6.19 (A, B, C, and D) (lines for “Federal Reserve banks,” not the same number line in all tables) (NIPA’s “profit after taxes with IVA and CCAdj” minus the Federal Reserve Banks)
DVD Dividends Received 7.10 line 8 15
The rest of the data (except some on tangible capital) comes from FoF tables, where L-tables give the levels of the given variable and F-tables give the flows. Duménil and Lévy (2004: 96-7) provide a lengthy, careful, and clear explanation of why not all subsectors listed in the breakdown of the FoF “Financial Business” belong in an economically meaningful financial rate of profit. We operate with the same definition of the “restricted financial sector” (which could be called the “economically meaningful financial sector”), though the FoF table numbers have changed slightly since their work. They are now F and L 109, 114, 115, 124, 125, 127, 128, and 129.
The holding gains for any asset are its current level minus its level last period minus this period’s inflow. The method above of indicating the table and line will not work (compactly) for two reasons. First, a given item has a different line number in various of these eight tables whose contributions must all be included and summed. Second, CE and MF do not appear in all eight sub-tables just listed. Below, after the variable name used above and its common name, we will list the name of the line and the tables they appear in. Recall computing holding gains requires both the L and F tables.
HG(CE) Holding Gains on Corporate Equities “Corporate equities” 109, 114, 115, 127, 129
HG(MF) Holding Gains on Mutual Fund Shares “Mutual fund shares” 109, 114, 115
Note that the following two do appear in all eight L tables.
L Liabilities “Total liabilities”
FA Financial Assets “Total financial assets”
The data for the holding gains on U.S. direct investment do not come from any of the eight tables listed above, but rather from L and F tables 229.
HG(USDIA) Holding Gains on U.S. Direct Investments Abroad. The levels come from summing lines 3 to 7 in L.229, while the flows come from summing lines 6 to 10 in F.229.
FDI Foreign Direct Investment (into the United States) L.229, summing lines 10 to 15
j The Rate of Inflation 1.1.9 line 1 (the implicit price deflator for the GDP)
Since there are no inventories in the financial sector, the denominator is K for r and r’ and K − NL for r*. The sources for NL have already been given. Note that while one can get K (and INV) for NFCB (and NCB) from FoF tables, one cannot get K for FB from FoF. From the BEA’s Fixed Asset Table 3.1 ES, the categories that correspond to the financial sector defined above by the eight FoF L and F tables is “Finance and insurance” minus “Federal Reserve banks” minus “Funds, trusts, and other financial vehicles” plus “Management of companies and enterprises.” Hence the financial business fixed assets K is line 49 − line 50 − line 54 + line 62 in the NBEA’s Fixed Asset Table 3.1 ES.
Declaration of Conflicting Interests
The author(s) declared no potential conflicts of interest with respect to the research, authorship, and/or publication of this article.
Funding
The author(s) received no financial support for the research, authorship, and/or publication of this article.
1
There were of course important precursors and contemporaneous works to Weisskopf’s studies. For an extensive discussion of these by both mainstream and heterodox economists, see Duménil, Glick, and Rangel (1984, ![]() .
.
2
Some of the following studies additionally removed net interest, but most like Weisskopf did not. The economics of this issue is further discussed in the appendix .
3
We use “business” as a sector consistently with the work of Duménil and Lévy whose work on the financial rate of profit we will clarify and temporally extend in this paper, with many of the empirical works cited above, and with the economics we are concerned with. It is close to but slightly different from its use by the BEA in its National Income and Product Accounts (NIPA). NIPA divides GDP into Business, Households and institutions, and General government (see for example NIPA Table 1.3.5). We are interested in all capital that accumulates according to the typical behavior of private capital, so the two large categories of total GDP that we exclude because of their different dynamics are government and owner-occupied residential housing. Our business category then includes part of what NIPA classifies as Households and institutions, but in particular it removes the large part of that which is imputed self-rent to owner-occupied housing (and consistently removes the very large term in the capital stock for owner-occupied homes).
4
Business is divided into NFCB, FCB, and NCB. NIPA gives the value added for NFCB and FCB, and then the value added for NCB is the calculated value added from Business minus these two. Noncorporate business dropped from 40.4 percent of Business value added in 1947 to a low of 23.5 percent in 1985 before climbing back to 30.9 percent since the crisis began (average over 2008-2010), averaging 29.1 percent over 1947-2010. FCB rose from 2.6 percent in 1947 to 9.1 percent over 2008-2010 (again evidencing the growth of the financial sector), averaging 6.0 percent over 1947-2010. NFCB remained relatively constant going from 57.0 perceent in 1947 to 60.0 percent over 2008-2010, averaging 64.9 percent over 1947-2010.
5
6
Note finance has no inventories.
7
Note that while dividends received are considered part of a company’s financial income like interest received, dividends paid out are not a financial expense like interest paid out but rather a distribution of profits. The appendix discusses this further.
8
See the appendix concerning the small foreign direct investment correction here.
9
10
People using this approach and the next one have used net dividends paid instead of the conceptually correct dividends paid. We ignore this for now and discuss it below with the corrections for the augmented rate of profit.
11
12
Plus inventories if doing this for the nonfinancial sector, but the financial sector has no inventories.
13
Because higher claimed depreciation allows a firm to pay lower taxes, the legally determined capital consumption allowances that they are allowed to claim are higher than economically realistic depreciation. The CCAdj are adjustments to the CCA to give an economically more reasonable “consumption of fixed capital” which the BEA then uses to compute NVA. Inventory adjustments IVA similarly correct for systematic misspecification of inventories, though the financial sector has no inventories and so no IVAs.
14
15
This table only gives dividends received for the financial sector back to 1958, so a small approximation is needed for data before that. We took the average ratio of the dividends received to the net dividends from 1958 to 1975 and multiplied that average by the yearly net dividends that we do have back to the 1940s in Table 1.14. An even smaller correction concerns the Federal Reserve banks. We have their net dividends but no data on dividends received. If we assumed that Federal Reserve banks received dividends in the same proportion as other financial business institutions, they would receive less than 2 percent of the total over the whole time and less than 1 percent in recent times. They certainly receive a far lower proportion of dividends than the other financial business institutions, and so it is a negligible correction in the face of the missing data to assume no dividends received by them.