
Abstract
The assumption that capitalist globalization has been a period of overall stagnation is the dominant consensus opinion within Marxist political economy. This paper criticizes this opinion and shows that it rests on a mis-measure of the transition of the centrally planned economics of the ex-USSR, Central and Eastern Europe (CEE), and China developed by the official statistical agencies during the Cold War. This mis-measure has the effect of underestimating both the collapse of physical output in the ex-USSR and CEE during the transition and underestimating the growth of genuine national income after the creation of market economies where previously there had been none. This paper develops some alternative, much higher, estimates of the real growth of national income during the transition period.
1. Introduction
The acceptance that the period of globalization has been one of the stagnation of the capitalist mode of production has become a commonplace of most Marxist political economy. The paper argues that this acceptance is predicated, in large part, on a false measurement of the growth of national income following the restoration of capitalism in the former centrally planned economies of the USSR, Central and Eastern Europe, China, and Vietnam. The Marxists of this “stagnation school” have uncritically accepted official national income series that measured the centrally planned economy as a form of capitalism, even if this form of capitalism was a counter-factual imputed one. This represents a break with the classical Marxist tradition that roots value, and therefore national income, in commodity production and exchange. The correction of this mis-measurement of national income reveals the true growth of the capitalist world market with the transition of the centrally planned economies to capitalism. It proves that the alleged stagnation of capitalism is wrong.
2. Capitalist Expansion
The notion that capitalism has experienced a period of stagnation is widely shared by theorists from various traditions, even if these theorists disagree over its start date or the reasons for its existence. Most Marxist writers consider that capitalist stagnation began with the end of the postwar boom in the early 1970s (Brenner 2009; Callinicos 2011; Harvey 2010; Freeman 1999; Kliman 2012). According to them, there was and remains to this day, a classical crisis of the over-accumulation of capital with falling or stagnant profit rates evident from the late 1960s onwards. The effects of this were manifested in the collapse of the Bretton Woods agreement and the subsequent neoliberal offensive of Thatcher/Reagan. Social Structure of Accumulation (SSA) theorists, who emphasize structural change, date capitalist stagnation from the 1980 election of Reagan in the United States. The collapse of the centrally planned economies and the creation of an actual global market, that incorporated a third of the world’s geographical area and population, did not fundamentally alter anything about the nature of the world economy for either of these two schools. 1 This article proves that globalization (the period of capitalist development that began with the creation of a global market in the 1990s) was one in which the scale and reach of capitalist production increased enormously. It provides, for the first time, estimates of the empirical significance of the expansion of the world market with the transition of the centrally planned economies to capitalist ones. It proves that the stagnation evident in the 1970s and 1980s ended with this transition, as the incorporation and transformation of centrally planned economies into market capitalist ones led to a massive one-off increase in the size of world capitalist production in the 1990s. Following this one-off addition, the rate of growth of key sectors of physical production and GDP value series sharply accelerated through the first decade of the twenty-first century, even including the period of capitalist crisis after 2008.
3. Capitalist Stagnation?
In a recent description of what he saw as the theoretical underpinnings of the recent capitalist crisis, Guglielmo Carchedi concluded that the capitalist system “lacks an inherent (tendency towards) growth and equilibrium” (Carchedi 2012: 100). Alan Freeman in a review of official IMF data from the late 1990s concluded that globalization was a period of “absolute stagnation” (Freeman and Kagarlitsky 2004: 49). Andrew Kliman reviewed data from the World Bank and Angus Maddison and concluded that after 1973 the world’s real gross domestic product (GDP) per capita growth rate fell by one half (Kliman 2012: 51). Robert Brenner in a new 2009 introduction to his Economics of Global Turbulence thought that, “The crisis currently unfolding in the world economy is, without close comparison, the most devastating since the Great Depression, and could conceivably come to approach it in severity” (Brenner 2009: 1). Brenner provided a very clear summary of the various themes that have shaped the Marxist analysis of the recent crisis.
[The] fundamental source of today’s crisis is the steadily declining vitality of the advanced capitalist economies over three decades, business-cycle by business-cycle, right into the present. The long term weakening of capital accumulation and of aggregate demand has been rooted in a profound system-wide decline and failure to recover of the rate of return on capital, resulting largely - though not only - from a persistent tendency to over-capacity, i.e. oversupply, in global manufacturing industries. (Brenner 2009: 1)
Based on a series of world GDP growth derived from the World Trade Organization (WTO) Brenner showed that the period from 1991-2000 was the slowest period of world GDP growth for any decade since 1950 (Brenner 2009: 7). Alex Callinicos in his 2010 Bonfire of Illusions repeated the essentials of Brenner’s analysis; Callinicos used Maddison’s figures for global GDP average annual compound growth to contrast the period between 1950-73 (4.9 percent) and 1973-2003 (3.17 percent) (Callinicos 2010: 51). Andrew Glynn used Maddison’s figures to comment on the collapse of Russian output in the 1990s and the rise of China, but did not mention the significance of the restoration of capitalism in either (Glyn 2006: 88). David Harvey in the Enigma of Capital notes how financial crises have grown in scale and frequency after 1973. Harvey cites a series of GDP growth estimates from Angus Maddison to assert that from 1990 to 2003 average annual growth rates slowed to 2.05 percent (Harvey 2010: 25). Harvey wants to prove that capitalism will not be able to grow at the required 3 percent rate necessary to satisfy its potential accumulation (Harvey 2010: 216). David McNally had a more nuanced view of the crisis. In his view the period of neoliberalism from the early 1980s onwards had enabled capitalism to escape from a brief crisis phase 1973-82. McNally again uses Maddison to analyze annual average compound rates of growth from 1870 to 2001 and concludes that the period from 1973 to 2001 with a rate of 3.05 was the second fastest phase of capitalist development since 1870 (McNally 2011: 38). Nonetheless McNally views the post-2008 crisis as a period of global slump for world capitalism. Sam Gindin and Leo Panitch use Maddison’s figures for GDP per capita growth rates, but subdivide the period 1973-98 into two phases: 1973 to 1982 1.4 percent and 1983 to 1998 2.5 percent (Gindin and Panitch 2012: 186). Essentially this reinterpretation of the statistics only works by starting the series the year after a major recession and finishing it the year before the next one; not surprisingly then the average is higher. All of these various Marxist political economists accept the GDP estimates of either Angus Maddison or other official Western statistical agencies based on the same substantive methodology. David Harvey says that Maddison calculated “the total output of goods and services in the capitalist world economy” (Harvey 2010: 26); this shared assumption is wrong.
Maddison, according to his own account, followed Abram Bergson, the founder of the CIA’s building block method for estimating Soviet national income to,
. . . create a counter factual estimate of what Soviet prices would have been if the economy were run on capitalist lines, removing the “distortions” created by the command economy, and getting a better picture of the real cost of production. (Maddison 1998: 312)
Maddison did not measure the output of the world capitalist economy. He measured all output as if it were a part of the world capitalist economy. In so doing he followed the shared convention of the International Monetary Fund (IMF), World Bank (WB), Organization for Economic Cooperation and Development (OECD), European Bank of Reconstruction and Development (EBRD), and World Trade Organization (WTO). This includes peasant subsistence farmers and, far more importantly, the non-capitalist output of the centrally planned economies in their estimates of national income. This meant that he took no account of the real growth of capitalist production with the latter’s transition to the market. When the figures are adjusted to recognize this change – that capitalist production expanded with the transition of the centrally planned economies to capitalism – the empirical basis for the stagnation thesis vanishes.
4. Capitalism and National Income: The Labor Theory of Value
Labor only takes the form of abstract labor and the products of labor the form of values, to the extent that the production process assumes the social form of commodity production that is production based on exchange. Marx noted that a commodity “is a value only to the extent that it is the expression, in the form of a thing, of the human labor power expended in its production and thus insofar as it is a jelly of abstract human labor – abstract labor” (Marx 1867: The Value Form). In commodity production, socially equalized labor assumes the form of abstract labor; this is the basis, content, or substance of value (Rubin 1990). All commodities have two essential properties: their use, concrete, individual, or physical form and their general, social, or abstract form, that is their exchange value, price, or value. The physical properties of things are not directly commensurable, so what determines the proportions in which quantities of different use values exchange on a market is the socially necessary labor time required to produce them. In exchange concrete labor is reduced to a general, social, or “abstract” standard. According to Paul Studenski’s classic history of the national accounts, “National income is an expression, in monetary terms of the current achievements of the national economy”; it is strictly separated by the market boundary from non-economic production that “does not possess economic value” (Studenski 1958: 163). Studenski explained that in Capital Marx defined newly produced value added in income terms as the sum of wages, profits, and rent; in product terms as the sum of consumer goods and net investment goods; and as gross value added the sum of wages, profits, rent, and capital replacement. Marx noted that replacement of capital is never a part of income, but always flows back into the economic system in the form of capital (Studenski 1958: 23). The “value of the product” was equivalent to the “gross national product” (GNP), which included duplicated values of raw materials and supplies and the replacement of used up capital; while net value, what Marx called the “gross income of society,” consisted of “wages, profit (including interest), and rent” or “net national income” (Marx 1981: 979; Studenski 1958: 23).
Contemporary Marxists like Emet Tonak and Anwar Shaikh (Tonak and Shaikh 1996) in the United States and Alan Freeman in the UK (Freeman 1991) have used the national accounts to estimate value production. Their application is too narrow, limited to what they consider to be the productive sector only, and they do not criticize the application of these measures to centrally planned economies; but it confirms the general principle that Marxists can critically apply the Western system of national accounts (SNA) to measure the output of Western capitalist economies. The plain conclusion is that exchange value, value, and therefore national income only exist in a capitalist economy based on market production and exchange. That is an economy predicated on generalized commodity production.
5. The Soviet Debate from the 1920s
As part of the wider debate around the New Economic Policy (NEP) 1921-28, Soviet economists addressed, and in large part invented, measures of a commodity economy. In 1923/4 P. I. Popov and L. N. Litoshenko produced the first Balance of a national economy (Spulber 1964). The Balance was based on a development of Marx’s reproduction schemas published in Capital volume II. The young Wassily Leontief, who was involved in its development, criticized the limitation of the Balance to material use values, but explained that its method “provides a possibility of comparing the economic weight of all the areas of production with one another, leaving aside their technical peculiarities,” even if “the total amount of goods can be computed only with reference to a commodity economy” (Lieontiev 1964: 91-92). The issue of coverage formed a key point of debate for Soviet theorists contemplating the significance of unproductive and productive labor (Boss 1986), and criticism for later Western estimates of Soviet national income.
From the mid-1920s Soviet economists debated the nature of value in the centrally planned economy. They formed two opposing tendencies: the “idealists,” led by I. I. Rubin, who emphasized the historical nature of Marx’s value categories; and the “mechanists,” who regarded value as a trans-historical natural psychological phenomena. The debate was resolved in 1930 by the mass arrest and deportation of the idealists; I. I. Rubin was denounced as a Menshevik wrecker. The mechanists were also criticized but their view provided the foundation for the new Stalinist orthodoxy. This was expressed in the 1931 Materialy, an internal planning produced under the direction of N. Osinskii, that measured the material output of the centrally planned economy in its first phase from 1928 to 1930 (Davies 1994: 28). The Materialy was clear that, “The crucial distinguishing feature of our expanded reproduction in comparison with capitalist reproduction is that it is not the reproduction of capital but the reproduction of use-values” (Pervukhin 1985: 121). Nonetheless, while there was no exchange, and so no exchange value, “national income may be taken to be the sum of labor expended by society in production in the given year” (Pervukhin 1985: 106). Planners developed a post factum measure of “national income” to distinguish the contribution of living labor to annual physical production (Davies 1985: 44). They could not match physical transactions with a financial equivalent (Gregory 2004: 241), but by aggregating concrete labor hours a subjective estimate of “national income” could be produced. This was national income without national incomes. It prefigured the Western subjective measurements of the centrally planned economy, paradoxically based on the same subjective figures.
6. Western Measures of Soviet Output
The need for “objective,” “independent,” or more accurately Western estimates of Soviet output became acute during the Second World War. In 1939 Colin Clark, an associate of Keynes and a key participant in developing the UK system of national accounts, used the first ever application of purchasing price parity (PPP) to provide an estimate of Soviet output independent of the official propaganda. Clark showed that, when measured in Western prices, the growth in Soviet output was much lower than the official figures.
During the war the demand for independent information was a key intelligence requirement of the U.S. military and diplomatic authorities; the research effort moved from the work of isolated individuals to that of an organized intelligence effort. The U.S. military authorities needed to know the military capacity of the Soviet economic base, its ability to withstand the Nazi invasion, its likely strength after the war, and the objective basis for any claims for reparations. Leontief drew up the first official estimate of Soviet output in 1943, under the aegis of the Office of Strategic Services (OSS), the wartime forerunner to the CIA (Leontief 1943). Its Soviet Department was headed by the young Abram Bergson, who as a student of Leontief and Simon Kuznets had written an early study of the Soviet wage system in 1937. The Soviet Department of the OSS was transformed into the United States Navy Project Research and Development (RAND) Project after the war (Engerman 2009) as Bergson oversaw the extension of the U.S. system of national accounts to the USSR.
Bergson’s project was not uncontested. Julius Wyler (Wyler 1946), in collaboration with Paul Studenski, developed an estimate of Soviet output at U.S. prices. Naum Jasny, another Russian, U.S.-based Marxist exile, sought to correct “distorted” Soviet planned prices (Jasny 1960). Jasny undertook a detailed examination of Soviet price statistics to show how the introduction of new machines distorted growth figures. These machines did not exist in the 1926 base year used in Soviet national accounts. Their price was estimated on their initial installation price, which was only an administrative price based on an accounting “value” for concrete labor time. This “price” – in fact a unit of account used to measure the physical quantity of labor required for production – was higher than the later “price,” as efficiencies raised productivity with the expansion of the scale of production. The issue of how to account for the “hidden inflation” of innovation became a consistent theme of Western debates in the years to come (Harrison 1999).
Alexander Gerschenkron, an opponent of Jasny and colleague of Bergson at RAND, similarly noted how industrialization affected the measure of national income (Gerschenkron 1951) as pre-industrialization base year prices were high and would show a larger increase in output than the lower post-industrialization given year prices. This became known as the Gerschenkron effect and “correcting” for it, or more accurately using the lower given year prices, was the major means through which Western experts produced lower estimates of Soviet output than the official figures.
There were essentially two methods or combination of methods developed. One set of experts priced physical quantities of Soviet output at Western prices; usually in U.S. dollars but occasionally UK pounds. They then guesstimated appropriate amounts of depreciation and of the value of services, often based on a head count of the number of workers employed there. The other set of experts sought to revalue Soviet output to remove the price “distortions” of the central plan (Nove 1955). These distortions rose from two sources it was believed. Jasny and Gerschenkron had highlighted the inability of the apparatus to account for the introduction of new machines, but as important was the absence of rent, interest, and moral depreciation, the result of the obsolescence of machinery due to technical progress, from the Soviet Material Product System (MPS). The issue of coverage, as the MPS never measured the output of the service sector or government, was resolved by using comparable Western data.
Abram Bergson developed the definitive version of Soviet “national income” (Bergson 1953). Bergson was aware that neoclassical marginalist theory was predicated on consumer sovereignty and did not apply to an economy without consumer sovereignty (Bergson 1964). But, while bemoaning the fact, he argued that some theory – even if not applicable – was better than no theory. Bergson wanted to assert the universal application of neoclassical economics, so he swapped consumer preference for planners’ preference. Planners were subject to the laws of neoclassical economics, he asserted, even if the price signals necessary to influence their behavior did not exist and could not be known. Bergson’s 1930s study of Soviet wages argued that as there were wage differentials based on skills and output, a form of capitalist wage market existed (Bergson 1944), even if this “market” could not determine the price of labor, the supply of labor, or the quantities of consumer goods supplied.
Bergson applied an adjusted factor cost (AFC) that re-priced Soviet output by redistributing official estimates of Soviet “value” and physical production, according to the categories of the market economy. This formed the basis for his AFC standard; it assumed the existence of a capitalist economy in the national accounts where
i) All commodity prices resolve fully into charges for primary factors, particularly capital, land, and labor. ii) For capital, there is a net charge, corresponding to the average internal return on this factor in the economy generally, and an allowance for depreciation of a conventional sort. iii) The charge for land, “rent,” corresponds on the average to the differential return to superior land. iv) “Wages” are at a uniform rate for any occupation and as between occupations differ on the average in accord with differences in productivity and disutility. v) Similar principles apply in the case of the relation of wages to farm labor income. vi) Commodity prices are uniform in any given market area. (Hoeffding 1954: 45; Bergson 1953: 42-43)
Never mind the absence of profits, rent, interest, and real wage labor and the differential pricing of identical outputs; Bergson assumed “a hypothetical charge of 25 billion roubles for agricultural rent and a hypothetical interest charge of 10 percent per annum on Soviet fixed capital” (Bergson 1961: 140). He went on, “In all cases, the cited figures supposedly represent both direct and indirect incidence, that is, charges not only on final goods but on immediate articles used in production” (Bergson 1961: 140). These estimates were “supposed,” not real. This was a statistical exercise only. Paradoxically, precisely because Bergson’s estimates were a reworking of official data, they were only marginally different from the figures of the Soviet authorities themselves. Bergson’s AFC became the standard applied to all centrally planned economies in Central and Eastern Europe (CEE), China, and Vietnam. Abraham Becker applied Bergson’s AFC to an estimate of the USSR’s national income for 1958-64 (Becker 1969). CIA Sovietologists produced regular reports for the Joint Economic Council (JEC) of the U.S. Congress applying these methods (JEC 1982). A CIA team based in Washington, DC did the same for China. Thad P. Alton in New York estimated national income for Bulgaria, Czechoslovakia, East Germany, Poland, Romania, and Yugoslavia (Alton et al. 1991). In 1961 Alexander Eckstein, with the support of Simon Kuznets and Abram Bergson, published national income estimates for 1952, the final pre-plan year. Ta-Chung Liu and Kung-China Yeh (Yeh and Liu 1965), part of the U.S. Air Force Project RAND, worked with Simon Kuznets on an early Western attempt to reconstruct Chinese national income to conform to Bergson’s standard Western definitions and corrected for “obvious biases”(Yeh and Liu 1965: 125). They noted that Communist policy in 1955 was “designed to wipe out whatever free market activity was left in rural areas” (Yeh and Liu 1965: 14), and that by the end of the First Five Year Plan in 1958 private enterprise’s share of industry and retail trade had declined to zero (Yeh and Liu 1965: 15).
This definition of market activity was no longer one based on actual market activity. They addressed typical issues of coverage, depreciation, and the treatment of taxes and subsidies and concluded that the “Communist concept of national income appears to be essentially the same as that of net domestic product at market prices as defined in the U.S. Department of Commerce, except for the narrower scope of economic activities covered in the Communist definition” (Yeh and Liu 1965: 215). Apart from the essential difference between central planning and the capitalist market, national income was the same.
7. Problems in Measuring the Centrally Planned Economies during the Transition to a Market Economy
The establishment of Bergson’s building blocks as the method of choice of Western statistical agencies and institutions was unchallenged until the collapse of the Soviet Union after 1989. The big-bang wholesale privatization implemented in CEE and the now Commonwealth of Independent States (CIS) led to a very rapid collapse of the central plan. The price mechanisms necessary to create a division of labor did not exist, so with the removal of the planning apparatus, output slumped. But this was not a collapse of output within the market boundary. While the total amount of physical output declined, production within the now real market boundary exponentially increased and so did national income.
The transition economies were aptly named. They were in transition from centrally planned production to market production. Yet Western statisticians and their new partners in the statistical departments of the transition economies did not differentiate between the output of the two modes of production. Rather they aggregated them together. A series of official studies by the OECD, World Bank, Goskmostat, and the IMF explained how, through the appropriate statistical reconciliation, the centrally planned production of use values could be treated as market production in the national accounts, even before the existence of an actual market. The World Bank’s report on the historically planned economies (HPEs) noted that, “HPEs have no economy wide ‘markets’ for most goods or services,” but nonetheless “. . .the equivalent of ‘market prices’ in the SNA is ‘established prices’ in the MPS, which include net indirect taxes by sector” (Marer et al. 1992: 14). The equivalence of market and non-market prices was not established by the objective fact of sale, but subjectively in the national accounts.
The OECD in partnership with the CIS Statistical Committee developed production, distribution, use of income, and capital accounts for the USSR for the last three years of the centrally planned economy 1988, 1989, 1990. They redefined the categories of the Soviet Material Product System (MPS) as if they were the categories of a market economy measured by the SNA, and measured centrally planned output as market output even before it was (OECD 1993).
The World Bank and Goskomstat used the change in physical non-market indicators to construct an index of GDP at market prices for the central plan in 1990, that is before there were any market prices, or for 1991-94, before real market prices existed (World Bank and Goskomstat 1995: 90). The revised estimates for GDP at constant prices for 1991-1994 used either physical volume indicators or production or employment data for each economic activity to extrapolate the base year (World Bank and Goskomstat 1995: 92). According to their estimates GDP in constant prices declined by about 35 percent between 1990-1994, less than the former official estimate of about 47 percent.
The IMF treated the subjective list prices of the central planners as if they were genuine market prices. Enterprises could “work round” list prices where they did not cover “costs” of production or if they needed “higher values,” as their physical completion, not their reflection in nominal values, was all that mattered in the plan (Bloem, Cotterell, and Gigantes 1996: 14).
Harry Wu and Angus Maddison separately and together published a series of papers which attempted to provide a definitive alternative estimate of China’s national income to the official statistical series. Both Maddison and Wu recognized that during the plan period
[One] cannot talk meaningfully about prices that reflect consumer preferences or factor costs for either consumer or producer goods in China because there was (and still is to a certain extent) no market through which such consumer preferences or factor costs could influence the prices of these commodities. (Wu 1993: 70)
Angus Maddison, according to his own account, applied Abram Bergson’s methods to the period of China’s centrally planned economy to estimate the real level of China’s growth (Maddison and Wu 2008: 14). Actually Maddison’s estimates owed less to Bergson than to Colin Clark’s PPP. The use of PPPs facilitated Maddison in abstracting from China’s centrally planned economy by measuring China’s planned output in the prices of comparative capitalist nations. Wu reconstructed China’s GDP for 1952-77 based on the official output estimates for 1978-90 by establishing a relationship between GDP and MPS at a sectoral level (Wu 2000: 477).
8. Separating the Plan from the Market
After the fall of the USSR and the opening of the Goskmostat archives to Western economists, there were attempts to re-estimate Soviet output. Again official statistics were used and the re-estimates, while generally lower, closely followed the original estimates (Kuboniwa 1997). Under the central plan production units reported their output to the planning authorities; with the destruction of the plan there was no clear reporting path. The situation was complicated by the multiplication of small output units, particularly due to the de-collectivization of agriculture in China and the self-interest of producers (Holz 2004). Changes in the tax structure meant that the producers had incentives not to report output, interest, or profits to avoid taxes. The legal framework to impel them to do so was not yet established, while the switch from quantitative measures of physical output to value measures based on exchange caused confusion. The transition to a survey system of data collection typical of the SNA took time to establish. Reporting authorities struggled to cope with the pace of transition and there were mistakes in the presentation and aggregation of data. In the CEE and CIS this was exacerbated as it took several years for market prices to act as real determinants of income and output (Bloem and Cotterell 1996). Nonetheless, through an emphasis on the production side of the national accounts, estimates were produced. They were certainly driven by ideological considerations; they wanted to reduce the scale of the collapse consequent on the introduction of the market. But more fundamentally, they confused the collapse of the plan with the collapse of the market, when the collapse of the plan was a consequence of the market and a necessary precondition for its growth and, therefore, of real national income.
To establish the real growth of national income with the transition of the centrally planned economies it is necessary to separate centrally planned from market production. The estimates developed here are not based on any new empirical material; quite the opposite. They are based on a re-interpretation of the same empirical data that underpin the current estimates of the growth of national income during the transition period. Essentially this re-estimate argues that, as national income measures output within the market boundary, before the existence of an actual market there is no actual market output and so no national income.
During the transition period there was a rapid increase in the proportion of total production that was undertaken within the market boundary even as centrally planned production collapsed, until the market entirely displaced the plan. Present official estimates of national income during the transition aggregate the collapsing plan with the expanding market and so are unable to measure the change in either accurately. As the collapse of the plan in the CEE and CIS was greater than the growth of market production, so official national income estimates measure the contraction of the plan as the contraction of the market, or in other words, they invert the real process: the rapid growth of market production at the expense of the central plan is measured as the rapid fall of market production alongside the plan.
The deflators used here provide only an estimate of that annual process, but they make no difference to the aggregate. At the beginning – before the market in the central plan – there was no national income; at the end, all production was market production, in the sense understood in the West.
9. The Disaggregated Measures
By applying the market boundary deflators illustrated below, it is possible to make a rough estimate of the growth of real market production in the transition economies. The European Bank of Reconstruction and Development (EBRD) developed estimates of the growth of private production during the transition period in their annual “Transition Reports” (EBRD 1999). The EBRD’s “private sector shares” of national income were approximations based on available statistics from both official (government) sources and unofficial sources. Their term “private companies” referred to all enterprises in which a majority of the shares were owned by private individuals or entities. The underlying concept of private sector value added included income generated by the activity of private registered companies as well as by private entities engaged in informal activity, in those cases where reliable information on informal activity was available. The EBRD estimates occasionally differed quite markedly from available data from official sources on the contribution to GDP made by the “private sector” or by the “non-state sector.” This was usually as the definition of the EBRD concept differed from that of the official estimates. Specifically for the CIS countries, official data in most cases refer to value added in the “non-state sector,” a broad concept which incorporated collective farms as well as companies in which only a minority stake has been privatized.
Accepting the limitations of these estimates – they are general figures indicative of a trend, rather than definitive totals – they nevertheless provide a good proxy for the growth of market production inside the CEE and CIS. The totals for any given year are not in any respect decisive. For the purposes argued here, it is enough they prove that at the outset of the transition there was little or no market production, and by the end of it the market had subordinated the vast bulk of economic output to it.
These estimates of the growth of market production can be combined with the EBRD transition indicators that measure the degree of transition from a centrally planned economy to a Western market one on a scale of 1-4. These demonstrate that even in countries like Turkmenistan, Bosnia and Herzegovina, and Tajikistan, which even in 2001 had a minority of output produced in the private sector, the EBRD rated its score on the liberalization of market prices as 2001 Turkmenistan 2.7., Bosnia and Herzegovina 4, and Tajikistan 3.7. The assumption of the estimates developed here is that after 2001 all production in these economies is subordinated to market prices.
Private Sector Proportion of GDP % in CEE and CIS.
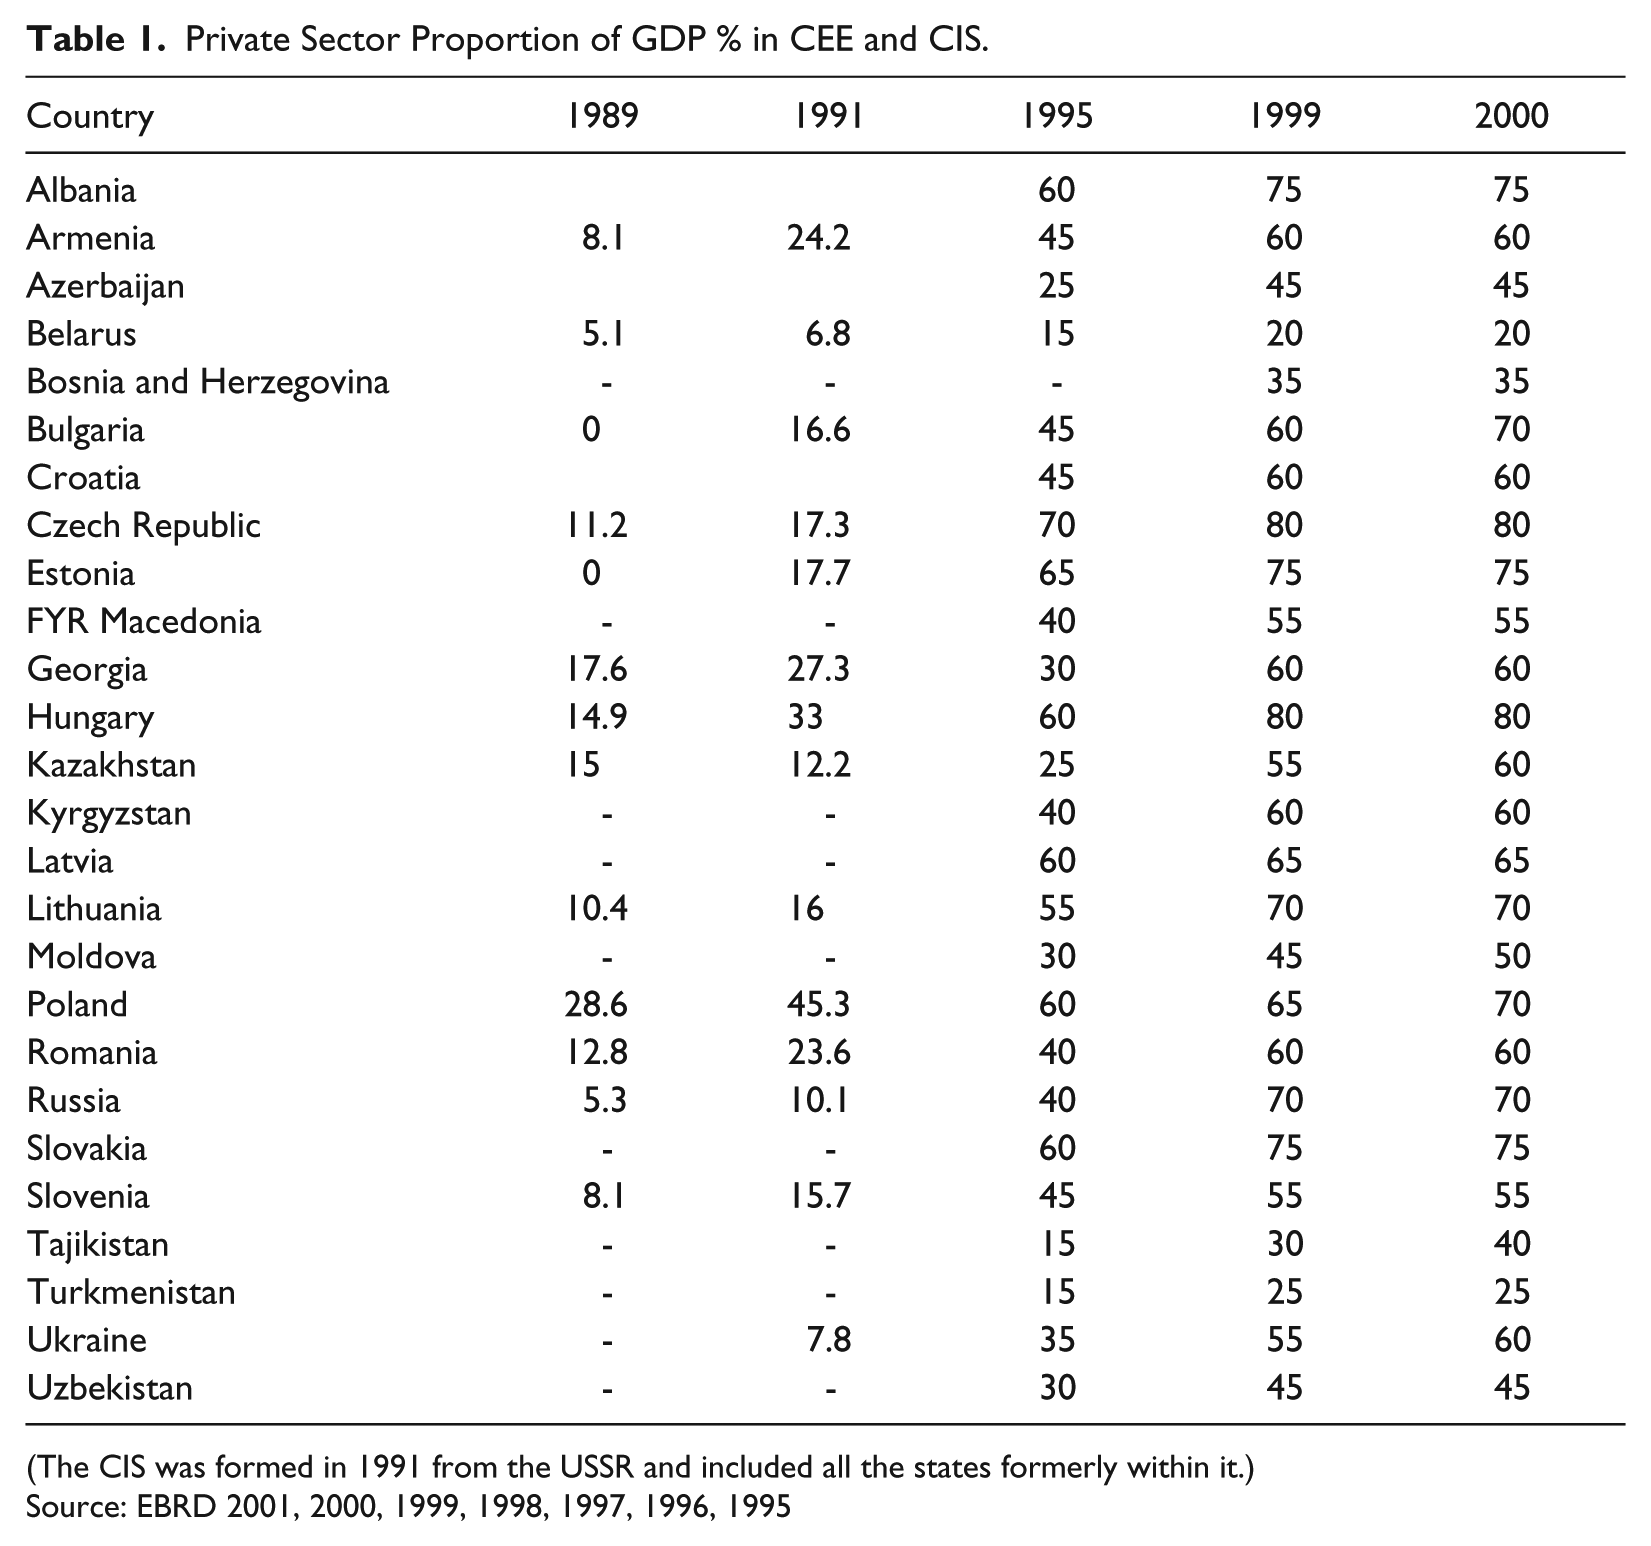
(The CIS was formed in 1991 from the USSR and included all the states formerly within it.)
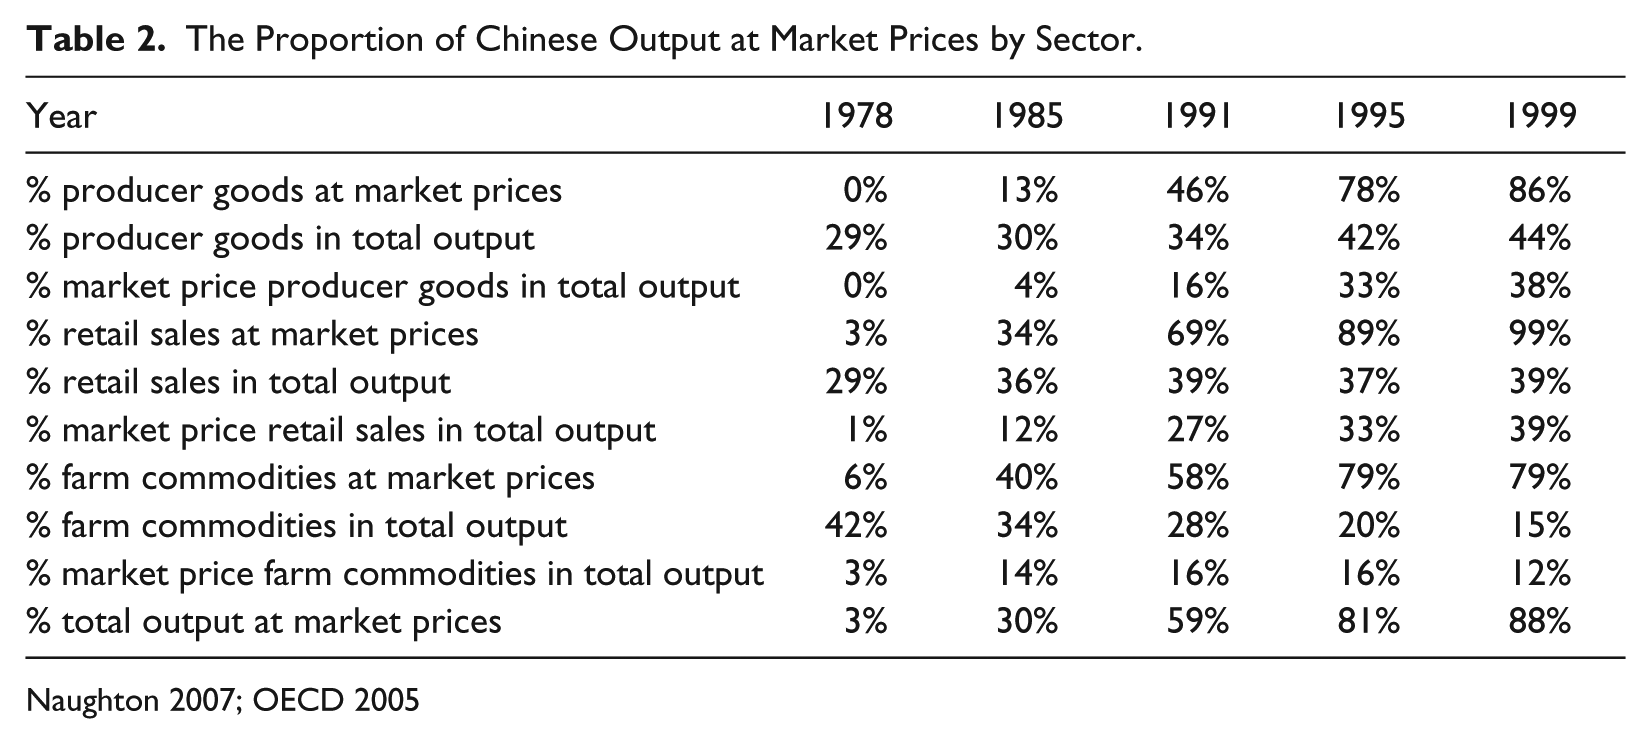
10. China
In China pro-market price reforms began in 1978. Over the next three decades this process created a market economy, but with the control of the Chinese Communist Party (CCP) intact. The proportion of centrally planned output was fixed and surplus above this minimum target was sold at market prices. This led to a rapid growth in the proportion of market output, even though this was not initially reflected in a change of ownership. As national income is a measure of output within the market boundary, it is the growth of this market production which is decisive for the argument presented here. The deflators used are based on an empirical survey undertaken by the OECD; the empirical data and methodology underpinning it is described in detail by Dougherty and Herd (1995: 6). The OECD survey utilizes the industrial firm database of the Chinese National Bureau of Statistics (NBS) based on a survey of 140,000 valid firms in 1998 and 180,000 by 2003. For each firm, detailed balance sheet data were available in addition to basic information on its ownership structure, industry, location, and employment. This high level of detail allowed for several types of adjustments to be made to value added, intermediate inputs, profit, and capital concepts to ensure that they corresponded with international practice. To establish the proportion of each sector at market prices, the proportion of total output in that sector is multiplied by the proportion of market prices in that sector. The total for the entire economy is a simple addition of these three totals. This provides the total output real GDP deflator that shows the proportion of total output produced at market prices. Once again this is only an approximation of the proportion of total output produced by the market in any given year; most significantly it proves the growth of national income as a proportion of total output, until the market subordinates the entire economy to it.
Table 2 demonstrates how the proportion of output at market prices increased very rapidly during the reform period; total output grew fast but the capitalist sector grew even faster. By the mid-1990s the transition was complete. It is assumed for China and the CEE and CIS that all centrally planned production ceases after 2001, as by this time the economy as a whole was subordinate to the market.
The Proportion of Chinese Output at Market Prices by Sector.
Physical indicators enable the comparison of national economies and allow the practical demonstration of the growth of capitalist production during the transition period. The estimates for aluminium are compiled from a variety of domestic and international public sources based on information available to the United States Geological Survey (USGS 2012). Hydraulic cement is similarly compiled from domestic and international public sources available to the USGS. Electricity figures are drawn from the British Petroleum (BP) Statistical Review of World Energy collated from government sources and published data (BP 2012). Steel figures derive from the World Steel Association compilation of reports from national steel associations where possible (World Steel Association 2012). The source for automobile figures is the International Organization of Motor Vehicle Manufacturers (OICA 2012) comprising 37 national trade associations, including all major automobile manufacturing countries, making up most of the worldwide motor vehicle industry. The GDP PPP statistics originate from the Groningen Growth and Development Centre (GGDC 2012).
PPP provides an alternative measurement standard to exchange rate based conversion factors such as the World Bank “Atlas” method. “Atlas” uses a conversion factor which is the average of the exchange rate for that year and the exchange rates for the two preceding years, after adjusting them for differences in relative inflation between the country in question and the United States. As the centrally planned economies had no real exchange rate as understood in the West, such exchange rate comparisons are particularly useless during the transition period.
PPP is defined as the number of currency units required to purchase an amount of goods and services in the subject country, equivalent to what can be bought with one unit of the object base country currency. This is usually the U.S. dollar. PPPs address the problem of comparing different national economies, with different price structures, wages, and productivity. They use detailed categories of outputs matched for quality and specified price information for representative items intended for consumption, investment, and government services. The goods should be equivalent – of physically identical, quality, use, taste, and standard – irrespective of variations in the mode of production. Coverage of national and international measures should be made to a common standard. PPP estimates are sensitive to the sample of products, prices, regions, and periods. The country reversal test means that in a given bilateral comparison, it should not matter which country is used as the base country. The product of the price and quantity ratios should equal the expenditure ratio. For the test to be met, both the price and quantity indexes must be computed independently. The Conference Board’s Geary Khamis (GK) GDP estimates, used by Maddison, adjust values to reflect the productive capacity of different economies (Conference Board 2012). Geary Khamis PPPs give a greater weight to the more developed economies.
The disaggregation of centrally planned from capitalist production demonstrated in Table 3 proves conclusively that the period of globalization has not been one of the stagnation of world capitalism.
World Total, Capitalist and Centrally Planned Production, Various Physical Indicators, and GDP Percentage Change.
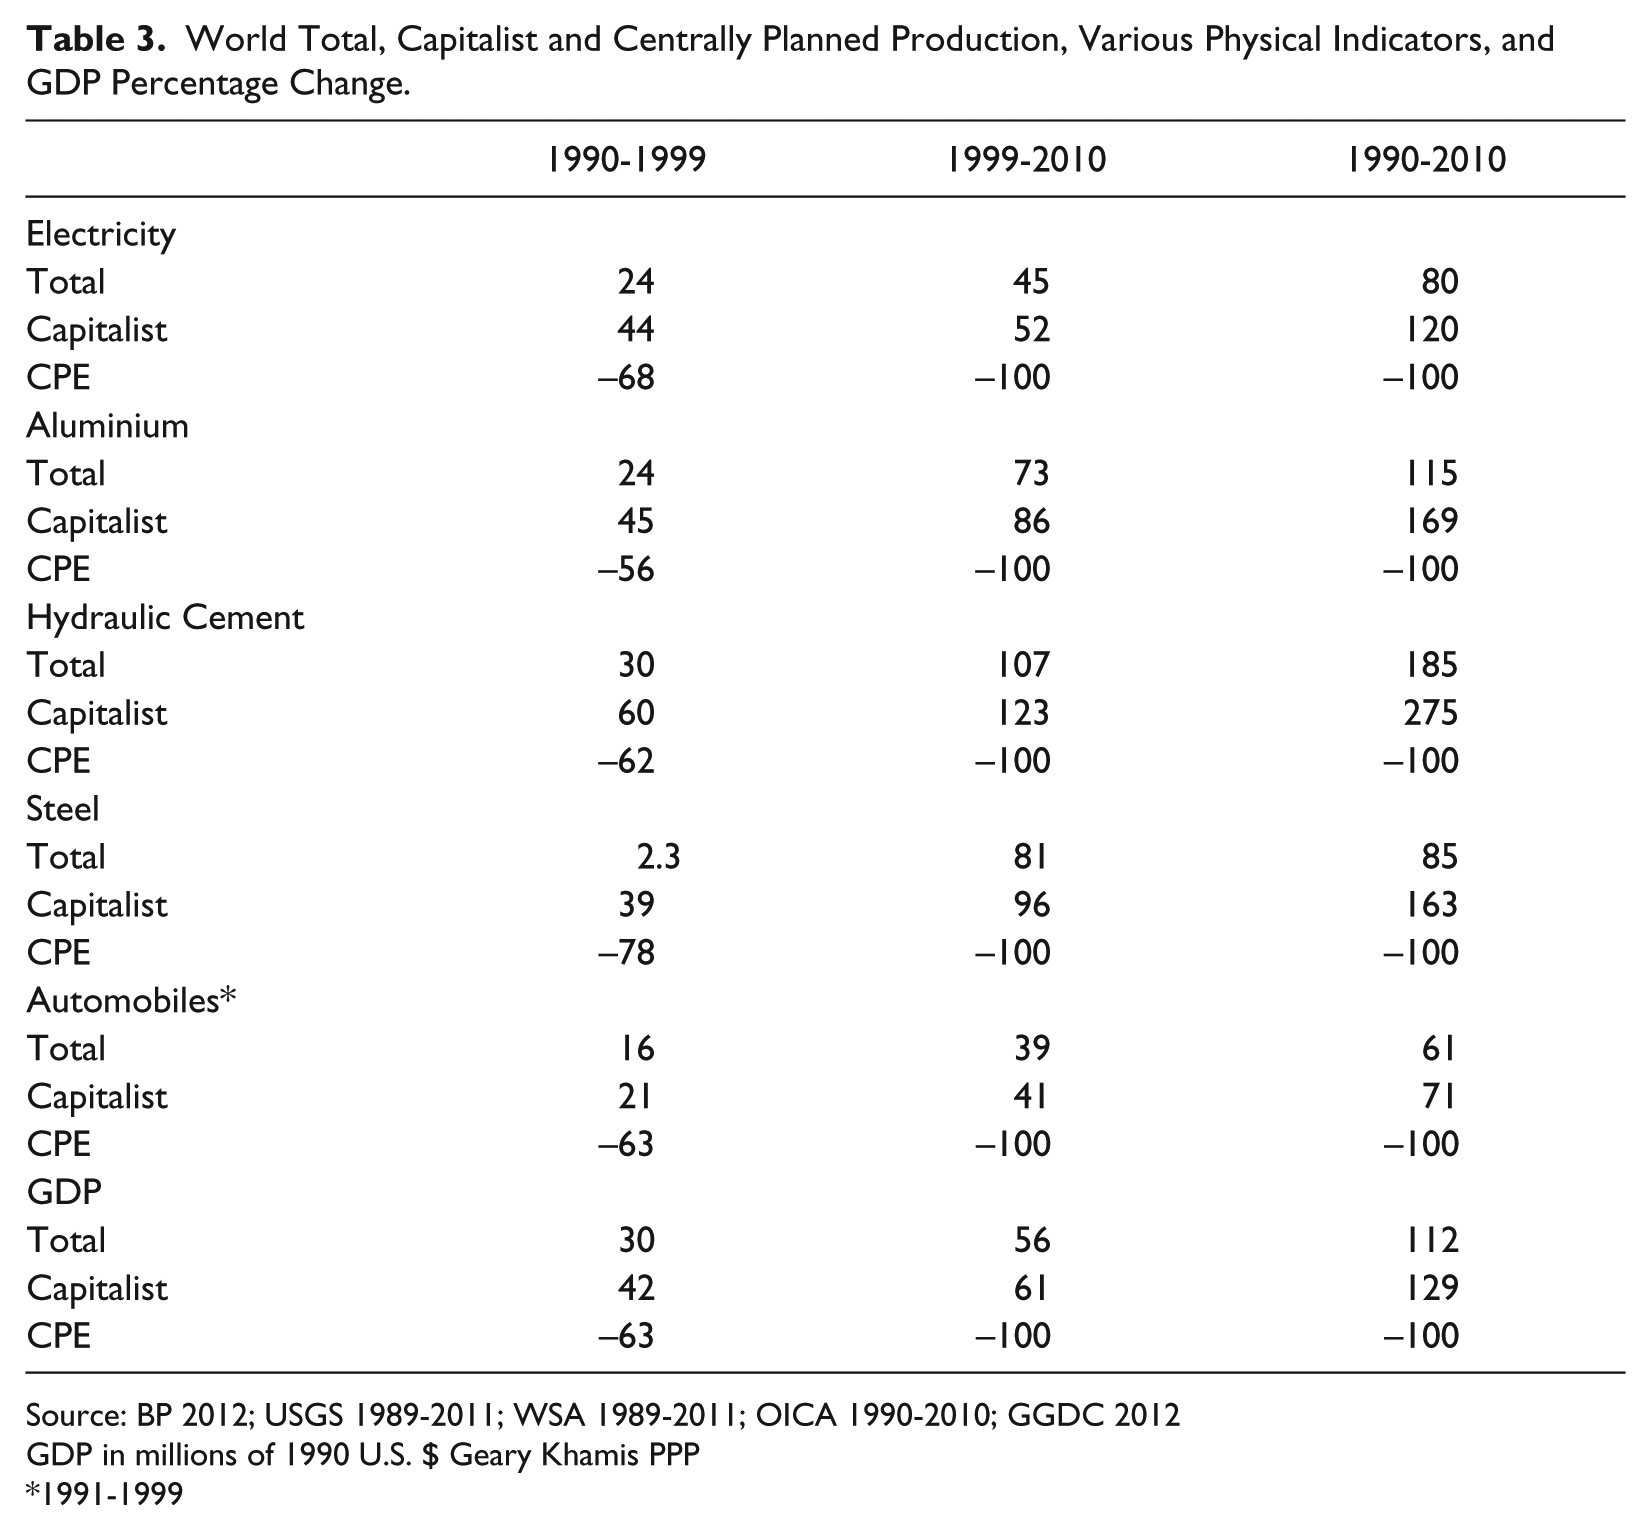
GDP in millions of 1990 U.S. $ Geary Khamis PPP
1991-1999
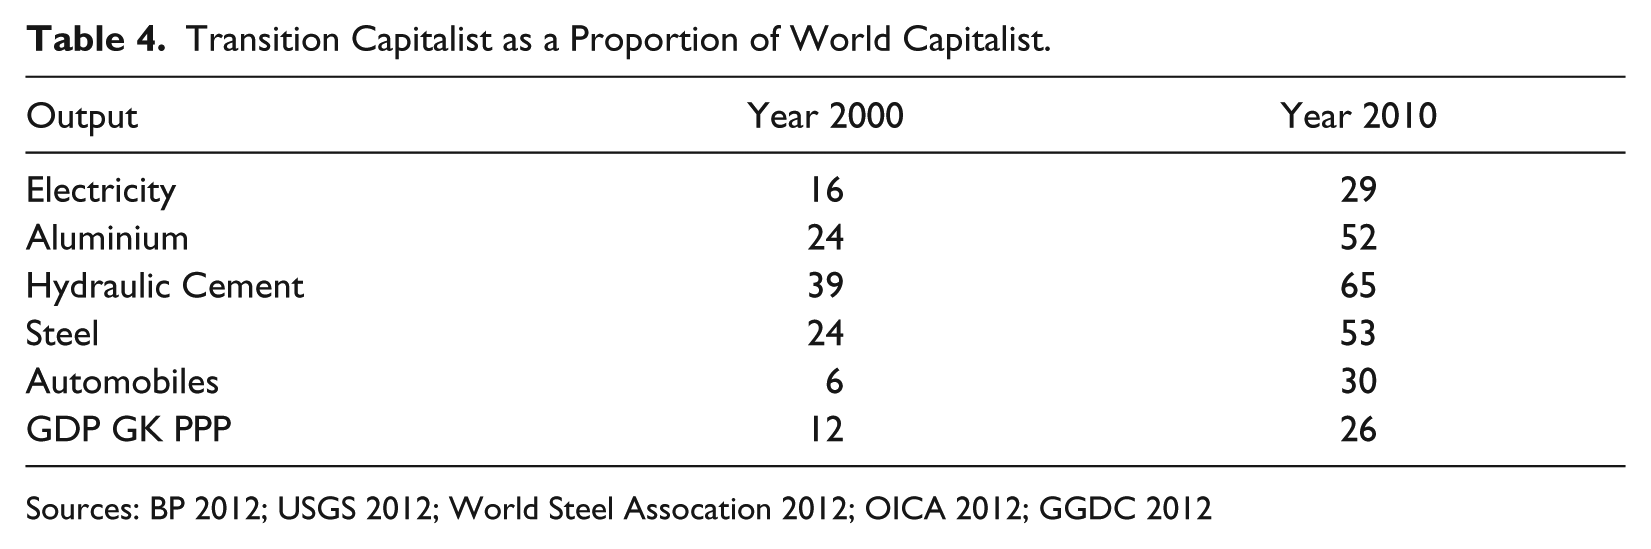
During the 1990s capitalist production of electricity rose 44 percent, aluminium 45 percent, hydraulic cement 60 percent, steel 39 percent, automobiles 21 percent, and GDP 42 percent, with rate of increase accelerating the decade after. This is particularly significant as this period extends to 2010 and so includes the period of the credit crunch recession after 2008. The growth of output in the emerging markets has been combined with the accelerated decline of industrial output in the West, but this is a transfer of production, not its disappearance. By 2010 the transition economies as a proportion of total capitalist production produced 29 percent electricity, 52 percent aluminium, 65 percent hydraulic cement, 53 percent steel, 30 percent automobiles, and 26 percent of GDP.
Transition Capitalist as a Proportion of World Capitalist.
11. Other Indicators of Capitalist Expansion
This piece proves that the assertion of capitalist stagnation based on a claimed decline or slowing of national income growth during the period of globalization is untrue. The one-off increase in capitalist production consequent on the transformation of centrally planned economies into capitalist ones was probably the largest increase in the world market in history. It was followed by a period of even more rapid growth during the first decade of the twenty-first century. But what about other indicators; do they confirm the stagnation thesis?
12. Trade
The destruction of the Soviet Union and CEE not only opened the formerly centrally planned economies to capitalist accumulation, but it removed the only rival military and economic power to the United States, thus limiting the negotiating strength of emerging nations like Brazil and India. Without the USSR, these dependent capitalist nations no longer had a material counterbalance to U.S. hegemony. Trade barriers that had protected domestic manufacturing virtually disappeared, Brazilian tariffs fell from 1991 29 percent to 2011 14 percent, China from 1991 41 percent to 2011 8 percent, and the United States from 1991 6 percent to 2011 3 percent (UNCTAD 2012). World trade increased absolutely by around fivefold between 1991 and 2011, and as a proportion of GDP from around 18 percent in 1991 to 32 percent in 2011 or by around two-thirds (UNCTAD 2012). From the early 1990s genuinely capitalist trade emerged in the transition economies and grew from around 6.5 percent of the world total in 1991 to 37 percent in 2011 (WTO 2012). One direct consequence of this huge increase in trade was a doubling of the size of the world maritime fleet, as UNCTAD observed, “The year 2012 saw the turn of the largest shipbuilding cycle in recorded history. Between 2001 and 2011, year after year, new building deliveries reached new historical highs. . .. The world fleet has more than doubled since 2001, reaching 1.63 billion deadweight tons in January 2013” (UNCTAD 2013: xiii).
13. Foreign Direct Investment
As capitalism embraced the globe so foreign direct investment (FDI) soared. The total amount of FDI rose by 635 percent between 1990 and 2011 (UNCTAD 2012). The proportion of total FDI directed into the transition economies increased even faster than the total, from almost nothing in 1991 to around 15 percent of the world total by the mid-1990s. There was a marked fall after the East Asia financial crisis of 1997 which was reversed thereafter and not even interrupted by the hi-tech recession of 2001 growing back to the 15 percent level. Outward FDI, investments from the transition countries, and in particular China and Russia, began to rise sharply from the mid-2000s. As a result the repatriation of profits from multi-national corporations formed an increasingly large proportion of total profits in major Western economies. In the United States foreign profits as a proportion of total profits rose from 1987 13 percent to 2012 21 percent. This was itself a fall from the 32 percent peak of 2008 as profits from the rest of the world very significantly cushioned the credit crunch collapse of that year (BEA 2014).
But even this underestimated the significance of the transition economies for these corporations, as they realized huge profits through unequal exchange: buying cheaply, below the value of a commodity in typically China, and using their monopoly control of the domestic market to re-sell at or above its value in the West. This phenomenon is obscured in the national accounts, as this additional value is considered to have been created where the output is sold not produced.
The total quantity of Chinese exports increased 10-fold during the first decade of the twenty-first century, until China surpassed the United States as the largest industrial producer and exporter by 2014. Meanwhile, the price of Chinese imports to the United States rose just 4 percent between 2004 and 2014 (BLS 2014), even while the technical quality of those imports, their sophistication, value composition, and the skill level required for their production, increased sharply (Amiti and Freund 2005). This has not only reduced the cost of investment but increased real living standards for the working class, who disproportionately purchase these cheaper low-end consumer goods, even while income inequality has risen very significantly.
14. Profits
The rate of profit is the bell weather of the economy. The U.S. economy remains the largest in the world and still accounts for around 18 percent of world output on PPP measures. The recovery of U.S. profit rates coincided almost exactly with the onset of globalization in the early 1990s. While the Reagan counter-reforms of the early 1980s defeated the unions and allowed a fall in wages as a proportion of national income, it was only the opening of the world market to the unimpeded rule of finance capital that consolidated the upward trend. Taking U.S. corporate profits as a proportion of national income, either before or after taxes, shows the same trend: in 2012 before-tax profits were 16 percent of national income, after-tax profits 14 percent of national income, either close to or exceeding the highest level since 1929 and approximately doubling since their low point in the early 1980s (BEA 2014).
15. Privatization
The integration of East Germany into a united Germany in 1991 meant a one-off increase in West German GDP of around 16 percent, which was not included in figures for German GDP growth due to the same statistical glitch that caused the underestimation of the transition in general. But the capitalists not only privatized entire economies in the CEE and ex-USSR, but large sections of nationalized industries and public services previously protected, to some degree at least, from the full effects of market competition. This has increased the proportion of national income that produces value rather than just output. As capitalists could shift loss-making heavy industries to the transition economies, so they could rid themselves of their domestic manufacturing industry and industrial working class. Services tend to have a lower technical and value composition of capital than manufacturing, so the national accounts will show a lower rate of productivity, the amount of value added per unit of worker, as each unit of output incorporates less constant capital. Similarly the rate of capacity utilization will fall as the proportion of services rises in total output: a barber’s shop cannot open all night; a car factory can.
Trade Union Density as a % of Total Workforce.

International Labour Organisation 2014, *1982, **1983, *** 2009, **** 2008
The destruction of domestic Western manufacturing and their replacement by imports lowered the domestic Western organic composition of capital and raised profits, but lowered the growth of total factor productivity and productivity in general. It appears that this shift causes a further stagnation of the economy, when it is actually a sign of a more thorough domestic restructuring of capital only made possible by globalization.
16. Class Struggle
After the Reagan/Thatcher defeat of their domestic labor movements, manufacturing plants were closed and their workforce was physically dispersed. This made it far more difficult for workers to organize without the industrial core of the domestic working class, thereby weakening trade union organization, working class parties, and general militancy. Over the average ten-year period from 1997 to 2006, the EU14 strike rates in the production and construction industries were almost three times those of the service industries, even as manufacturing and construction declined rapidly as a proportion of total employment. This in turn helped drive down wages and undermined the ability of labor organizations to oppose speed-ups and productivity drives. Trade union density fell and the proportion of workers covered by collective bargaining agreements declined precipitously.
As strike activity declined, in the UK the average number of days lost per year in the late 1970s and early 1980s was around 7 million working days in official records, or 300 days per thousand employees. Each successive year between 1986 and 1994 registered the lowest number of stoppages since the Second World War. Since 1994 the numbers of stoppages and working days lost have stabilized at these historically low levels. By the early years of the twenty-first century, days lost to officially-recorded stoppages stood at around 0.5 million per annum, just 20 days per thousand employees (ACAS 2008). A study of strike activity in 33 different countries showed a close similarity between the UK experience and the international one (Hale 2008). While there have been isolated bursts of strike activity since the 2008 recession in Greece and Portugal, these have neither been sustained or generalized.
17. Living Standards
While wages as a proportion of national income have fallen steadily since the early 1980s, working class living standards have continued to rise as increases in productivity have outstripped the fall in the real value of the wage. Consequently, this has been a golden period for capitalism where working class living standards, the amount of use values the wage can buy, have increased, even as the cost of producing those use values has fallen. This has been masked by official inflation figures that are derived from a changing basket of goods that represent the current purchases of “average” families. As the cost of manufactured goods has declined, then the proportion of wages spent on services has increased; in the UK it doubled between 1990 and 2000, even as wage rates have stagnated. This has had a profound effect on weakening the class identity of the working class in the West. In the emerging markets living standards have risen even faster albeit from a very low level; measurements of children malnourished under 5 in China fell from 1990 12.6 percent to 2010 3.6 percent, while average earnings for the urban working class have risen at double digit annual rates for over two decades.
18. Working Class
In 1991 the centrally planned economies had a population that was 35 percent of that in the market capitalist economies. The restoration of capitalism in them massively increased the world’s working class that could be exploited by capital, while at the same time the world’s capitalists paid almost nothing to privatize the assets of entire economies. The entire privatization receipts of the USSR amounted to $7.5bn. As a result the world organic composition of capital fell. Over the next two decades of globalization, this profound one-off reduction was consolidated by a very large increase in the urban population as subsistence farmers moved off the land into factories. In 1991 43 percent of the world’s population lived in cities; by 2014 this had risen to 54 percent, an increase of around a quarter (FAOSTAT 2014). This means that the capitalist workforce has at least doubled between 1991 and 2014. Even this understates the real growth as the increase in physical infrastructure–roads, railways, mobile phones, and the internet–has dragged subsistence farmers into the market economy. Guglielmo Carchedi claims that financial crisis was caused by the “shrinking productive basis of the economy” (149). Carchedi cites a paper by Gold and Feldman that claims that “some 31 million manufacturing jobs were eliminated between 1995 and 2002 in the world’s largest economies.” Employment in manufacturing declined, he claims, while “global industrial production rose by more than 30%” (155). Carchedi ignores the extension of the world market into the former centrally planned economies. By 2006 China, now the second largest capitalist economy in the world, employed 112 million industrial workers (Bannister 2009), not including millions more in the former USSR and CEE.
In sum these other indicators confirm that globalization has been a general period of very significant capitalist growth and advance, a true “belle époque,” capable of withstanding the Great Recession–possibly the deepest financial crisis in its history, the credit crunch of 2008–virtually unscathed. The reason is ultimately simple; during the Great Recession of 2008 world output fell by 0.6 percent, a figure that is 28 times smaller than the 17 percent increase in world capitalist production due to the transformation of the centrally planned economies into capitalist ones.
19. Conclusion
National income measures the value of production within the market boundary. The existence of national income is coincident with and limited to market economies. The application of imputed national income measurements to the centrally planned economies served a purpose provided it was understood this was a limited, counter-factual series that indicated the relative productive potential of centrally planned economies. These imputed measurements had no objective existence in the real world. The collapse of centrally planned output with the transition to the market was the empirical confirmation of this fact. The increase of global national income that necessarily coincided with the extension of the market into the now transitional economies was (particularly in the CEE and CIS) measured as a reduction of national income rather than the creation of it. As a result the official measurement of national income during the transition period grossly underestimated the growth of the world market and capitalist production with the restoration of capitalism in these economies. The period of globalization, between 1990 and 2010, that allegedly demonstrated “persistent over-capacity and over-supply in global manufacturing industries,” saw increases of capitalist production for electricity 120 percent, aluminium 169 percent, hydraulic cement 275 percent, steel 163 percent, automobiles 71 percent, and GDP 129 percent.
The uncritical acceptance by Western Marxists of the statistical measures produced by Western agencies led to a profound mis-estimation of the nature of globalization. Western agencies aggregated the output of the centrally planned and the capitalist economies, with the result that their estimates of capitalist transition grossly underestimated the growth of the world market during this period. By disaggregating the decline of the central plan from the growth of capitalism it is possible to show that the period of globalization has not been one of stagnation and decline, but of the massive expansion and growth of capitalist production.
Footnotes
Declaration of Conflicting Interests
The author declared no potential conflicts of interest with respect to the research, authorship, and/or publication of this article.
Funding
The author received no financial support for the research, authorship, and/or publication of this article.
1
Globalization is a period of capitalist accumulation that precisely originated outside of the traditional heartlands of capitalist development through the integration of previously non-capitalist economies into the world market (Lippit 2010). Some SSA theorists like David Houston (1992) did note the significance of the restoration of capitalism although they did not appreciate the significance of the official mis-measurement of national income. Terence McDonough (2003) provided a quite accurate description of the various factors that created globalization, although a recent collection of SSA theorists’ writings around the recent credit crunch made no mention whatsoever of the restoration of capitalism in the CPEs (![]() ).
).
Author Biography
![]() .
.