




Abstract
The fall of the Icelandic economy in 2008 highlighted the destructive effects of unbridled markets. Yet, in recent years Iceland’s annual growth rates have been significantly higher than those of the overwhelming majority of advanced capitalist countries. The aim of this article is to delve into the fragile foundations that the current Icelandic economic boom rests on. We argue that the impressive appreciation of the Icelandic króna, triggered by the rapid expansion of tourism, has made the rapid absorption of unemployment compatible with price stability during the recovery period. By restricting sources of international competitiveness, however, this tourism-led recovery strategy will render the current level of unemployment and real wages inconsistent with internal and external equilibrium in the long run.
1. Introduction
The economic growth achieved by Iceland in the wake of the banking collapse that shook the Nordic country in 2008 has been extraordinary. After suffering one of the largest falls in GDP on an international scale over the 2009–10 period, the small Atlantic island enjoyed a robust recovery. The aggregate growth in output was higher than 25 percent between 2011 and 2018—more than twice that seen in other OECD countries. “The miraculous story of Iceland” (O’Brien 2015) has generated a mix of enthusiasm and admiration among policymakers and academics. Many of them have attributed the merits of this miracle to the active intervention of the central bank and the successive governments since the beginning of 2009, which allegedly implemented a series of unorthodox monetary and fiscal measures diametrically opposed to the standard prescriptions suggested by mainstream economic theory (Hart-Landsberg 2013; Matthíasson 2015; Sigurgeirsdóttir and Wade 2015; Ólafsson 2016; Bohoslavsky 2017; Farnsworth and Irving 2017). Overall, it is alleged that as a result of this conduct, Iceland has emerged “from the ‘perfect storm’ in surprisingly good shape” (Baldursson, Portes, and Thorlaksson 2017: 26), even becoming a “healthier and more equal society” (Blyth 2013: 240). Indeed, a plurality of indicators seem to confirm the success of the Icelandic growth path: between 2010 and 2017, the unemployment rate plunged from 7.6 to 2.8 percent. At the same time, the employment rate rose from 74 to 80 percent, that is, the highest employment rate of any OECD country.
The fact that the extraordinarily tight labor market had no significant effect on the growth rates of the economy would seem to disprove, at least in our case study, the Marxian theory of the reserve army of labor which is defended in this paper. According to Marx ([1847] 1952; [1867] 1990), the shrinking of the industrial reserve army in periods of rapid economic growth reduces competition among sellers of labor and increases their bargaining strength, thereby shifting the distribution of income in workers’ favor. Ceteris paribus, the volume of profits is correspondingly squeezed, thereby weakening the firm’s capacity to invest, insofar as investment depends on the profit margin. It follows that the accumulation of capital requires an excess of labor which, by maintaining a downward pressure on wages, sets the economy on a path of sustainable growth.
Does the continuous fall in the unemployment rate with no discernable slowdown in economic growth disprove Marx’s theoretical prediction? Our answer is negative. We show that foreign trade has the capacity to hasten the process of accumulation, at least in the short run. To the extent to which it allows domestic firms to partly lower the cost of producing goods and services as a result of cheaper imported capital and wage goods, foreign trade “tends to raise the rate of profit” (Marx [1894] 1967: 237), thereby permitting an accommodation of wage demands resulting from high levels of employment. As for the Icelandic case, we argue that the positive effects of foreign trade have been magnified by the strong currency appreciation, inasmuch as it contributed to limiting the erosion of profitability during the recovery period.
The massive influx of tourists has played a paramount role in this respect. From 2010 to 2017, tourism contribution to GDP increasing from 3.4 to 8.6 percent, becoming the largest single sector of the economy. However, the substantial growth of the real exchange rate resulting primarily from the significant increase in revenues from tourism has inhibited the reorientation of the country’s productive structure toward sectors with a higher technological sophistication. More specifically, we provide evidence that the expansion of the leisure-tourism industry acted as a driver of “Dutch disease” for the Icelandic economy, which one can contextualize as “geyser disease.” While inducing a significant increase in output in Iceland generally, the demand shock resulting from the inbound tourism boom has led to a relative contraction of the traded sectors of the economy which are traditionally more receptive to skilled labor and technological innovation (Gylfason 2001; Torvik 2001; Nowak, Sahli, and Sgro 2003; Capó, Riera Font, and Rosselló Nadal 2007; Ghalia and Fidrmuc 2018). The shift of productive resources toward labor-intensive tourism services resembles the detrimental effect of an oil boom, typical of the Dutch disease. As the increase in oil revenues undermines the external competitiveness of domestic non-oil producers, the windfall from tourism has led to a reduction in the competitiveness of the Icelandic tradable goods sector that, in turn, is likely to shake the foundations of sustainable economic growth in the coming years.
The article is structured as follows. In Section 2, we shed some light on the apparent contradiction between the strong growth in employment and the non-inflationary nature of the Icelandic recovery, by taking into account the role of the real appreciation of the Icelandic króna. In Section 3, we focus on the fundamental instability of a development path based on the tourism sector, especially with regard the maintenance of an external balance. In Section 4 we look at the central role played by technologically advanced sectors in ensuring wage and employment growth that is sustainable in the long term. We argue that the fiscal and monetary policies undertaken during Iceland’s “miraculous recovery” condemned the country to relying on low value-added activities. Section 5 draws the conclusions which we use to outline some policy implications that could be useful in promoting sound growth policies not only for Iceland, but also for other economies.
2. Real Currency Appreciation and the Accommodation of Inflationary Pressures
Using the theoretical perspective of Marx as a point of departure, we suggest that there is some rate of unemployment below which the “excessive” bargaining power of workers leads to an increase in wages that ends with the halting of the accumulation process. This means that in a market economy, there exists a given rate of unemployment which makes the working class more conciliatory by accepting a real wage consistent with a profit rate below which the capitalists refuse to invest. Rowthorn (1980) calls this the “normal” rate of profit and argues that when unemployment is below its natural level, low competition in the labor market drives workers to tighten up their demands, thereby spurring a distributional conflict between labor and capital. Such conflict is likely to have an inflationary impact on the economy, inasmuch as the gains that the working class believes to have initially obtained in the wage-bargaining process are thwarted by an unexpected rise in prices, followed by a rise in inflationary expectations and an even higher wage increase in the subsequent wage-bargaining round.
Ironically, the mechanism of the wage-price spiral developed from a Marxist perspective by Rowthorn fits well with the neoclassical idea of “accelerated inflation.” In the former case, the speeding of the rate of inflation occurs as a result of the exhaustion of the reserve army of labor. In the latter case, accelerated inflation happens when unemployment falls below a firmly established “natural” rate—or, in its more recent version, when unemployment persists below the non-accelerating inflation rate of unemployment (NAIRU). The main difference is that the Marxian theory of inflation explicitly acknowledges the fact that capitalism structurally needs a certain level of unemployment in order to discipline workers and keep their aspirations from causing accelerating inflation (Pollin 1998; Devine 2004). But both theories agree that the acceleration of price is brought to a halt only once the unemployment rate returns to its equilibrium level, which brings the wage aspirations of workers in line with a feasible real wage that is consistent with the aforementioned “normal rate of profit.”
Once we have established the wide consensus which exists across the ideological spectrum concerning the existence of a long-term convergence toward the natural level of unemployment and its offspring, the NAIRU, it remains to be clarified why the tight labor market conditions have not led to runaway inflation in Iceland. As a matter of fact, and contrary to the forecasts of the proponents of the NAIRU concept (Einarsson and Sigurdsson 2013), the inflation rate remained below the target set by the Central Bank of Iceland (CBI), despite the rapid and constant reduction in the unemployment rate. First, it should be noted that this phenomenon cannot be explained with a lack of elasticity of real wages to changing labor market conditions. As shown in figure 1, the significant drop in the unemployment rate starting from 2010 was followed by a substantial wage boost. Indeed, the pro-cyclical response of real wages with respect to the unemployment rate reflects the lack of an institutionalized system of neo-corporatist bargaining, which has historically characterized the Icelandic system of industrial relations (Jónsson 2014). Irrespective of the cause, the sustained wage dynamics did not give rise to inflationary flare-ups.
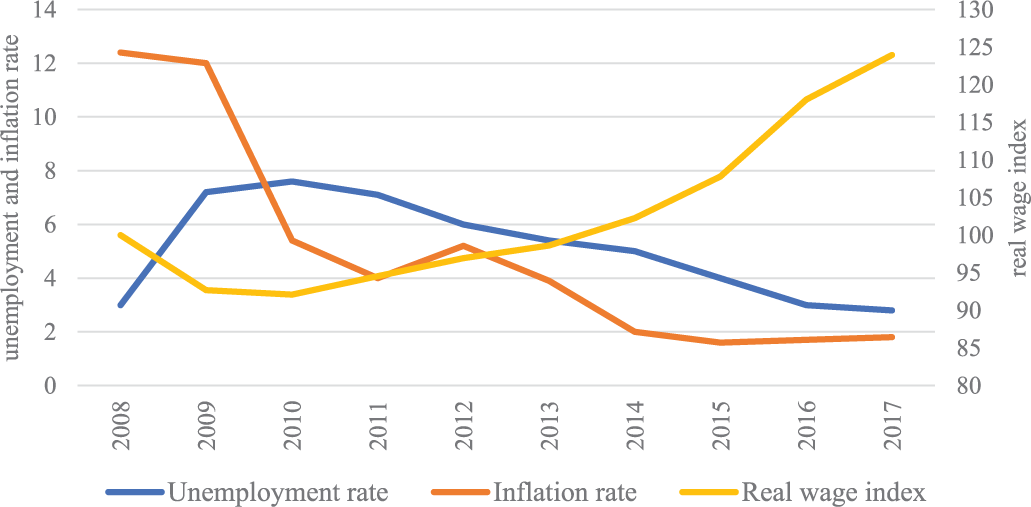
Unemployment rate, inflation rate and real wage index (2008 = 100)
Should we, therefore, consider the possibility that wage growth in Iceland did not lead to a fall in the rate of profit such as to trigger an accelerated rise in prices? This hypothesis is supported by the data in Figure 2, which shows that the rate of profit 1 never falls far below its historical average, and from 2012 at least until mid-2017 shows an upward trend in spite of unhampered wage growth.
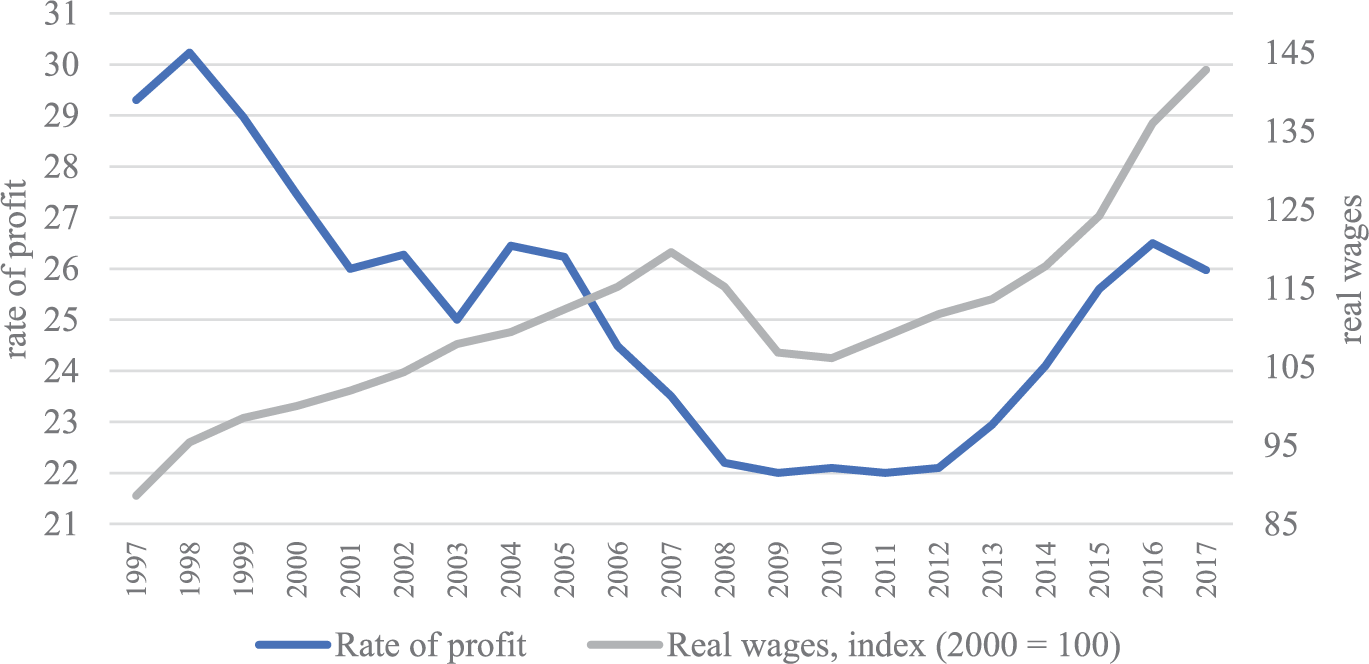
Rate of profit and real wage index in Iceland (1997–2017)
A persuasive explanation of the low impact of real wage growth on profits lies in the Icelandic króna’s dramatic appreciation from 2012 onwards. In this regard, we offer a brief theoretical digression on the relationship between the real exchange rate, the profit rate, and real wages. The real appreciation of a currency against foreign currencies corresponds to a fall in the relative price of foreign products in terms of domestic products, or a rise in the purchasing power of the national currency on international markets relative to its purchasing power within the country. The real exchange rate measures the relation between domestic prices and foreign prices expressed in a common currency. As a rule, the real exchange rate is estimated by comparing the consumer price indices of the reference country with those of its trading partners. In order to measure a country’s purchasing power of international goods, however, we believe it is more appropriate to estimate the real exchange rate as the relationship between the price level of domestic output and that of imports, measured in a common currency. We call this index output-import based real effective exchange rate (OIBREER):

where: PGDP = GDP price deflator and PM = import price deflator.
From this point of view, a real exchange rate revaluation can be interpreted as a nominal appreciation not followed by a decrease in the national output price level. 2
In this condition, the price of domestically produced goods and services remains unaltered, while the price of imported goods and services decreases. That is, as much as these imported goods and services are elements of capital goods and wage goods, the internal cost incurred for inputs decreases, while the output’s price remains unchanged. This explains why the rapid growth of real wages does not necessarily translate into a fall in the rate of profit. The logical bases for this argument are put forth by Shaikh (1999), who assumes a reciprocal relationship between the real exchange, real wages, and rate of profit. Within Shaikh’s model, however, the real exchange is in the last instance determined by the levels of labor productivity and real wages—while taking them as exogenously determined. In our model, instead, we regard the real exchange as an independent variable of the system that can either have a positive or negative effect on the profit rate and the level of real wages.
In the first place, it can be shown that, at a given level of real wage, the real exchange determines the rate of profit. The latter, in fact, depends on two key variables: the share of profits of the value-added (profit share) and the output/capital ratio (the so-called productivity of capital). On the one hand, since the output volume of a given economy is composed of the sum of wages and profits, it follows that an increase in the share of this output appropriated by the labor force (an increase in the wage share) decreases the volume of profits appropriated by businesses. On the other hand, since the profit rate is calculated as the ratio between the volume of profits and the capital stock, an increase in the cost of the latter in relation to output (i.e. a decrease in the output/capital ratio) decreases the profitability of investment. We start from the fundamental equation of the profit rate:

where: r = rate of profit; K = capital stock; W = mass of wages; Y = total output; Y − W = mass of profits.
If we divide the numerator and the denominator of this equation by Y, we have:

Equation 2.1 shows us that, since profits consist in the share of output that doesn’t go to labor in the form of wages, the profit rate can be written as the product of the profit share and the output/capital ratio. In what follows, we show the impact of the real exchange rate on the two components of the profit rate. As for real wages, other things being equal,
3
a depreciation of wage goods means that the wage share decreases and therefore the rate of profit increases. This can be shown as follows. At every level of employment,


Since

Since

According to our definition, a change in the real exchange rate determined a change in import prices but not in output prices. Since part of the wage goods are imported:

where: Πsh = profit share; K = nominal capital stock; W = nominal value of total wage bill; Y = nominal GDP; Py = PGDP; Yr = real GDP; em = employment; Wr = mass of real wages; Pw = private consumption deflator (PC); ER = real exchange rate (OIBREER)
As for the cost of capital, other things being equal,
4
a depreciation of capital goods causes the output/capital ratio and therefore the rate of profit to increase. This too we can demonstrate mathematically. At every level of employment,

As noted above, since

Since

According to our definition, a change in the real exchange rate determined a change in import prices but not in output prices. Since part of the capital goods are imported:

where: K = nominal capital stock; Kr = real capital stock; Pk = investment goods price deflator (PI); Ct = real capital stock per worker.
The preceding equations show why strong wage increases do not necessarily translate into a collapse of the profit rate: a real appreciation, by depreciating the cost of imported wage and capital goods, may act as a countertrend to the fall in profitability. In turn, the maintenance of the rate of profit in the face of real wage increases makes it unnecessary to increase prices in the face of increased employment and income from labor, which thus avoids triggering an inflationary spiral that could only be resolved with a decline in employment and wages. In fact, a real appreciation increases the level of employment and wages that is compatible with price stability, i.e. it has both a deflationary and expansive impact.
We find this to be exactly what happened in Iceland. During the post-crisis period, the growth of demand for tourism services was accompanied by a corresponding inflow of foreign currency. From 2009 to 2017, the number of foreign visitors to Iceland increased more than fourfold, from 715,000 to 2.88 million. The massive inflow of tourists was naturally followed by massive expenditure on consumption products and services. The latter increased sixfold over the same period, reaching the astronomical figure of almost US$12 billion between 2010 and 2017. The large foreign currency inflows due to growth in tourism triggered the real appreciation of the national currency, the Icelandic króna (figure 3).
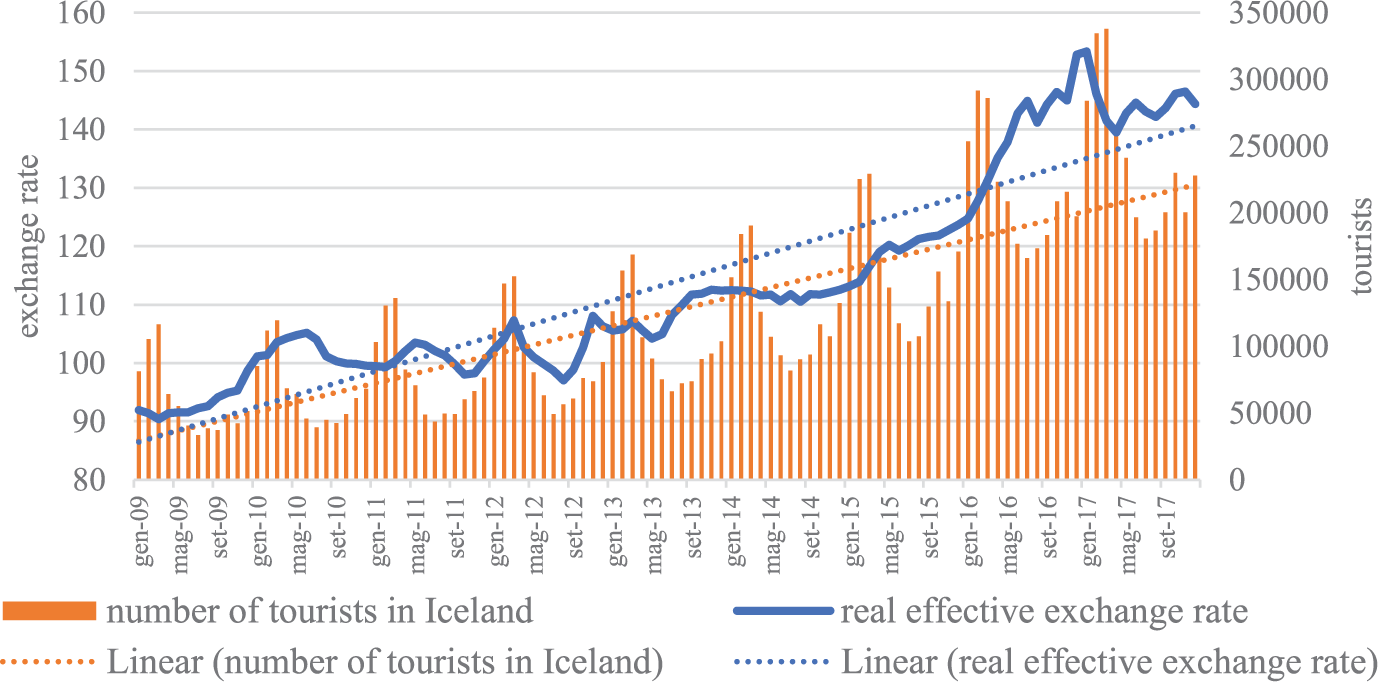
Real effective exchange rate and number of tourists in Iceland (2009–17)
The movement of the real exchange rate had a strong impact on the two components of the rate of profit. On the one hand, the appreciation increased the profit share in the face of an unchanged real wage. On the other, the appreciation increased the output/capital ratio in the face of an unchanged capital per worker. With regard to the profit share, we started from the concept of “hypothetical wage mass.” 5 We refer to this as the total amount of nominal wages necessary to maintain the actual overall payroll unchanged (in real terms), assuming that the growth of personal consumption prices coincides with that of output. The hypothetical wage mass can be calculated as follows:
The hypothetical wage mass is:

where P is the GDP price deflator and Ŵ is the real wage. We can rewrite:

where
By definition, we have the following:

where
Looking at eq. (12.1) we know the following:

Thus we conclude:

At this point, dividing the hypothetical wage mass by the corresponding GDP, we can calculate the hypothetical wage share. From this, we can finally deduce the hypothetical profit shares. These are understood as the profit share of GDP based on the hypothesis that nominal wages coincide with hypothetical ones. Figure 4 shows that the effective profit share is overall higher than the hypothetical profit share during the period of recovery. If we focus only on the steepest period of currency appreciation (2014–17), the movement in the real exchange rate raised the profit share by an annual average of 3.6 percent, from 44.4 to 48 percent.
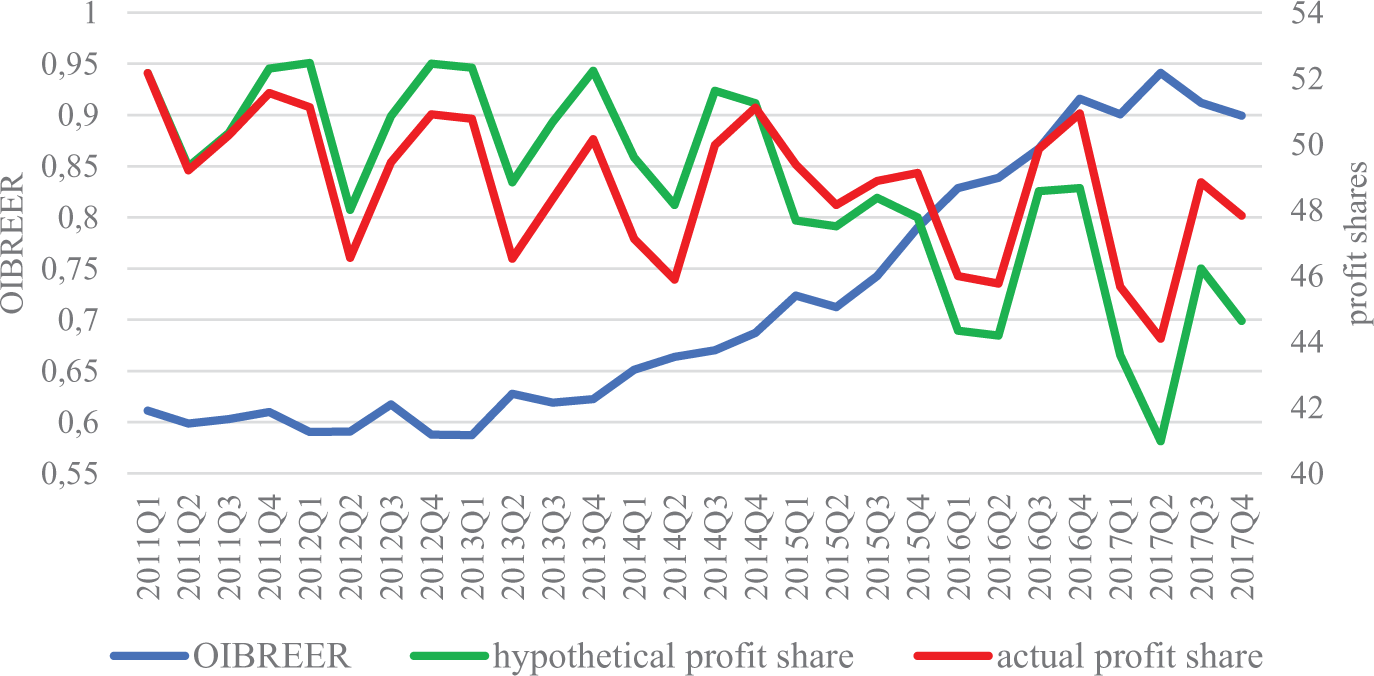
Dynamics of real exchange rate, hypothetical and actual profit share
It is worth reiterating that this surplus of profits does not derive in any way from a reduction in real wages, but rather from an overall higher growth of output prices compared to that of personal consumption prices. As figure 5 shows, the relative growth of PGDP depends on the movement of the real exchange rate, which, by definition, depresses the prices of a share of private consumption (the imported wage goods) compared to output prices. It is therefore not surprising to find a positive relationship between the trend of the real exchange rate and the relationship between the effective profit share and what would result from a uniform price trend (PGDP = PC).

Correlation between OIBREER, PGDP, and PC (1997–2017)
As far as the second component of the rate of profit is concerned, we estimated the impact of the real exchange rate on the output/capital ratio. To do so, we calculate the hypothetical nominal capital stock, which is defined as the capital stock that would have occurred if the prices of capital had followed the same trend in output prices.
The hypothetical capital stock is:

where P is the GDP price deflator and

where
By definition, we have the following:

where
Looking at Equation 13.1 we know the following:

Thus we conclude:

At this point, dividing the GDP of each period by the hypothetical capital stocks, we can calculate the hypothetical output/capital ratio. Figure 6 shows that the actual output/capital ratio was overall higher than the hypothetical output/capital ratio during the recovery period. If we focus only on the steepest period of currency appreciation (2014–17), the movement of the real exchange rate raised the productivity of capital by an annual average of 6.9 percent.
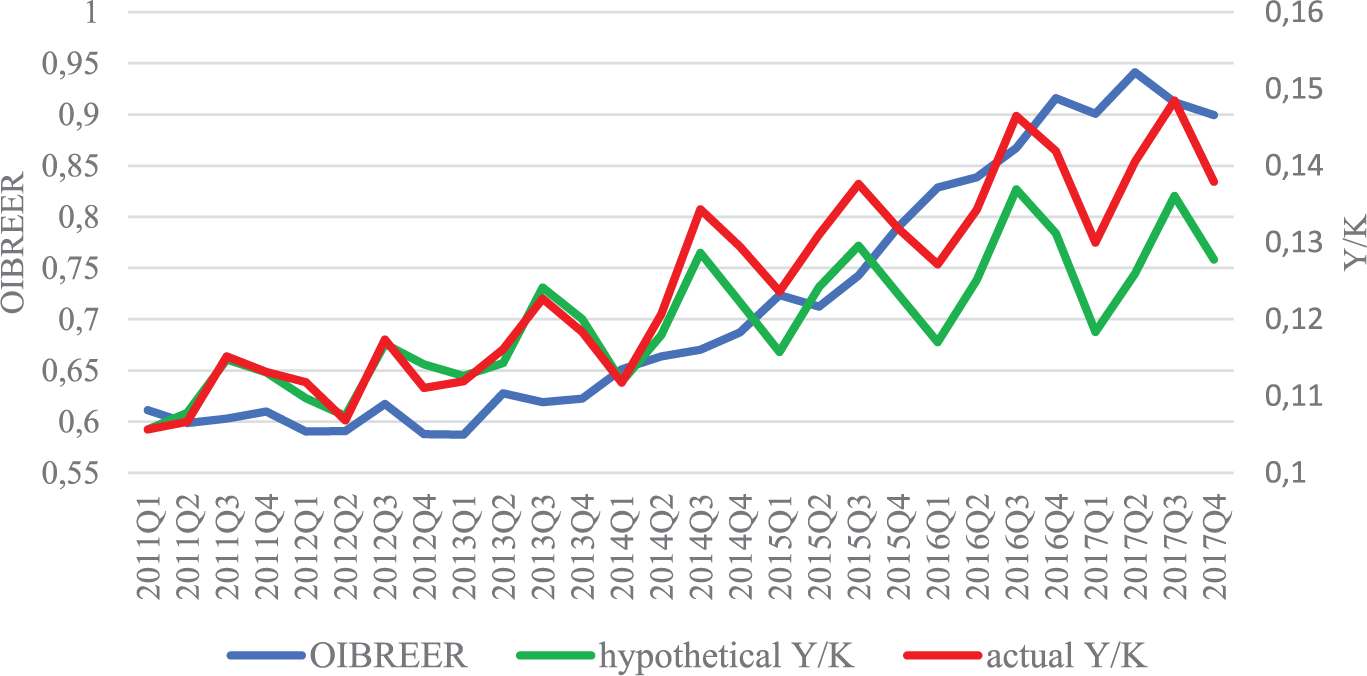
Dynamics of real exchange rate, and hypothetical and actual output/capital ratio
It is worth recalling that an increase in capital productivity expresses an overall higher growth in output prices compared to that of investment goods prices. As figure 7 shows, the relative growth in PGDP depends on the movement of the real exchange rate, which, by definition, depresses the prices of a share of capital goods (the imported capital goods) compared to output prices. It is not surprising that we see a positive relationship between the movement of the real exchange rate and the relationship between the actual output/capital ratio and what would result from a uniform price trend (PGDP = PI).
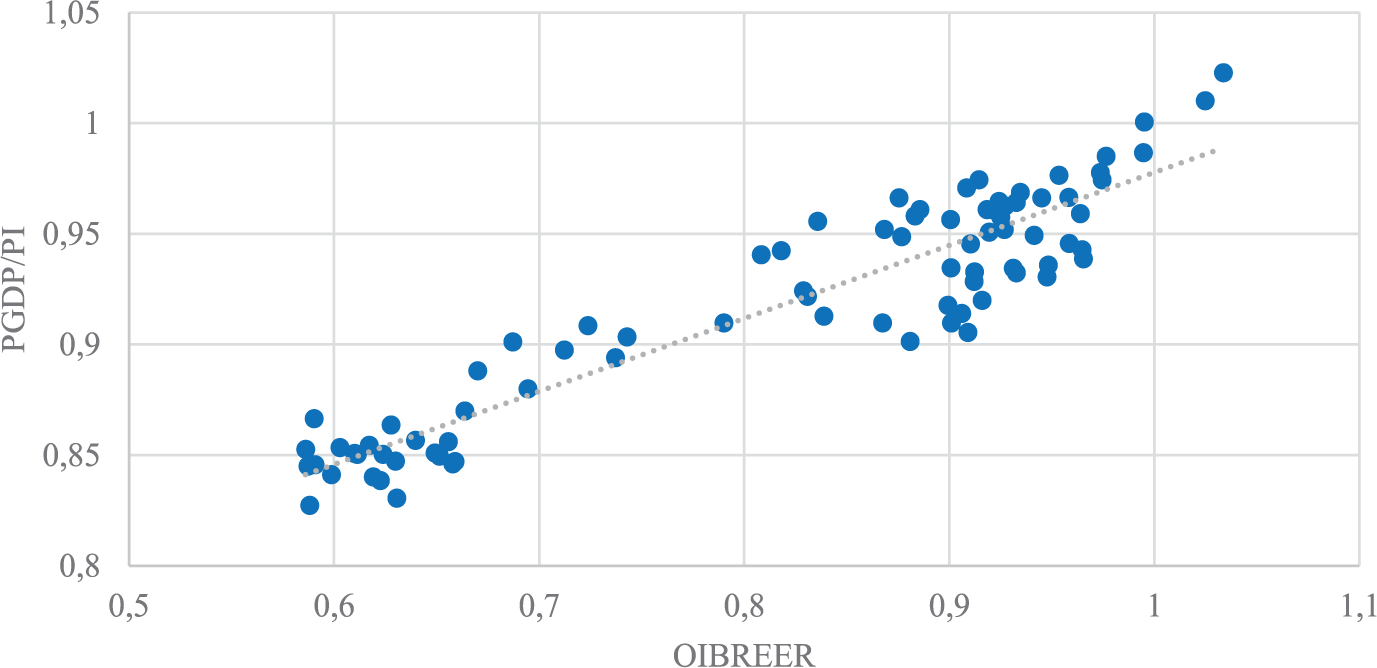
Correlation between OIBREER, PGDP, and PI (1997–2017)
At this point, we can quantify the overall impact of the real exchange rate on profitability, by using equation 2.1. To this end, we compare the profit rate calculated by reference to the actual profit share and the actual Y/K ratio, with the profit rate calculated on the basis of the hypothetical profit share and the hypothetical Y/K. We define the latter as the hypothetical profit rate corresponding to a situation in which the prices of personal consumption goods (wage goods) and investment goods (capital goods) move parallel to the prices of the output (ΔPC = ΔPI = ΔPGDP). We verify that there is a strong positive correlation between the movement of the OIBREER and that of the rate of profit in relation to the hypothetical profit rate. This indicates that a real appreciation (depreciation) increases (decreases) the rate of profit assuming an unchanged real wage. This occurs by virtue of the relative reduction (increase) in the price of imported goods, which manifests itself in the divergence between the indices of output price on one hand, and those of capital goods and wage goods on the other. During the recovery period, the mechanism described above played out quite clearly (figure 8): the acceleration of the real appreciation of the króna between 2013 and 2014 led to an average increase of 16.8 percent in profitability, compared to the hypothetical situation in which there was no real depreciation of wage and capital goods.
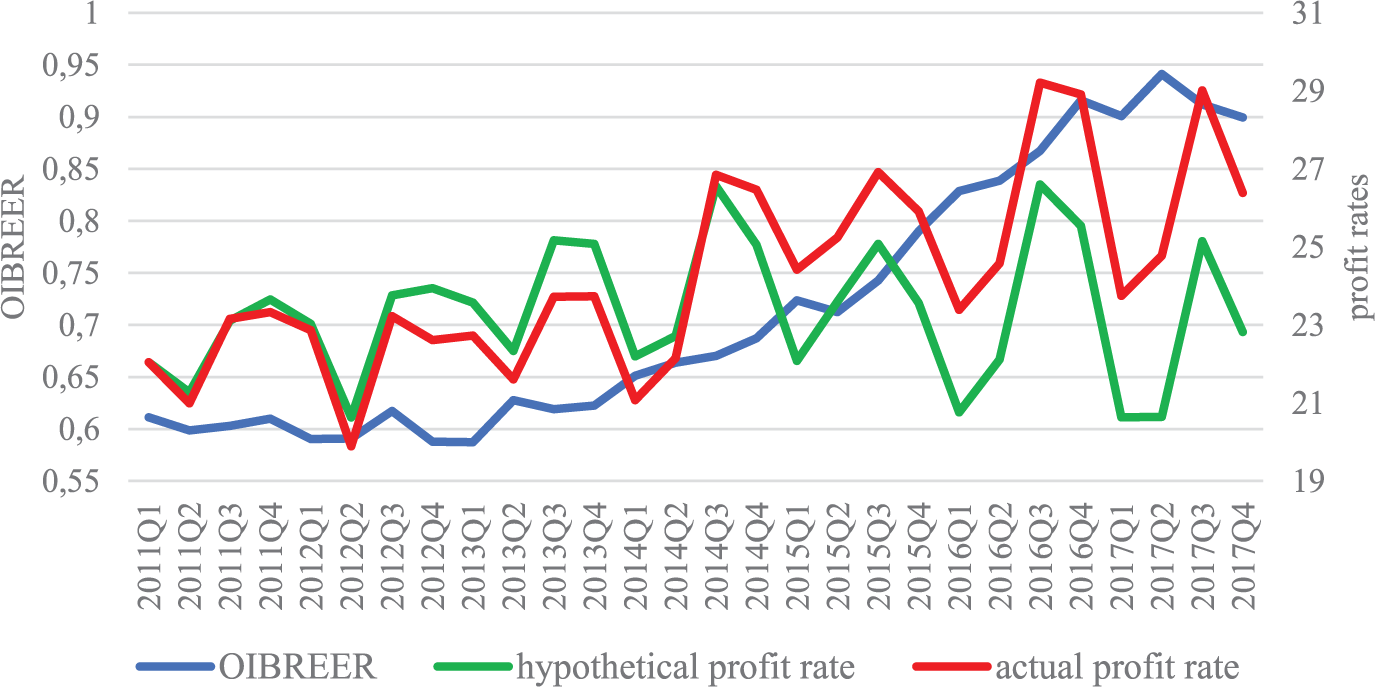
Dynamics of real exchange rate, and actual and hypothetical profit rates (2011–17)
We stress that the real exchange rate has a positive effect on the rate of profit assuming an unchanged real wage. Now all that remains is to show the positive effect of the real exchange rate on the real wage assuming an unchanged profitability. To do this, we need to determine the real wage level that in the hypothetical situation (ΔPC = ΔPI =ΔPGDP) would make the rate of profit equal to the actual rate. According to our estimate (see appendix), in the period of stronger appreciation of the króna (2014–17), the actual real wages are, assuming an unchanged rate of profit, on average 14.9 percent higher than they would have been in the situation where prices moved uniformly.
To sum up, the revaluation of the króna, by lowering import prices, significantly contributed to making high levels of employment and wages compatible with high profitability and low inflation throughout the recovery phase in the second decade of the twenty-first century.
3. The Structural Weakness Inherent to Tourism-Led Economic Growth
On the basis of what has been said so far, must we then conclude that a sustainable growth path ultimately consists in a continuous overvaluation of the real exchange rate? Obviously, things are more complicated: even assuming that the monetary authorities can determine at will the real exchange rate, such a maneuver would have detrimental effects on the external equilibrium, insofar as a real appreciation tends to have a negative direct impact on the import-competing industries. In order to understand this, one should bear in mind that, all else being equal, a revaluation generally increases the prices of non-traded goods in terms of traded goods. This has a twofold effect: first, it increases the markup on costs set by producers in the non-tradable goods industries; second, it reduces the markup of tradable goods industries (Hua 2007; Gala 2008). The increase in profitability of non-tradable relative to tradable firms “thereby encourages resources to be switched out of the production of tradable goods and redeployed in the non-traded goods sector” (Rowthorn and Wells 1987: 88–89). Since a stronger exchange rate would also boost the purchasing power of the domestic population, the aforementioned shift of internal resources between sectors implies that the induced increase in demand will not be matched by any corresponding increase in the domestic supply of tradable goods. We can, therefore, conclude that the expected impact of an appreciation of the real exchange rate is a decline in the share of domestic and foreign demand for tradable goods satisfied by domestic tradable industries. The resulting displacement of domestic sources of supply by foreign enterprises may then lead to an external imbalance, which is an unsustainable situation in the long run for any country other than the United States (Thirlwall 1979; Prasad 2014).
In Iceland, however, the real exchange rate was able to markedly appreciate without causing any trade deficits thanks to the tourism boom (CBI 2016). While it is true that “heavy króna depreciation in the wake of Iceland’s banking crisis might have helped promote the initial pick up in tourism” (IMF 2017: 5–6), it is equally true that the “subsequent appreciation has not deterred the sharply rising number of arrivals” (IMF 2017: 6). Although the continuous appreciation of the króna has turned Iceland into the most expensive tourist destination in the world, 6 the number of foreign tourists visiting Iceland has risen from just under half a million to over two million between 2011 and 2017. The expansion of the tourism sector is mirrored in the growing share of foreign exchange earnings from tourism as a percentage of total exports, which has increased from 20 percent to 42 percent between 2009 and 2017. This has allowed Iceland to maintain a trade surplus during the post-crisis period. However, without the tourism’s foreign exchange earnings, Iceland’s overall trade balance would have shown a systematic deficit since 2011. As indicated in figure 9, if we exclude the massive export revenues coming from the tourist sector, the balance of trade would have averaged a deficit of −11.3 percent of GDP between 2014 and 2017, against an actual average surplus equal to 5.9 percent.
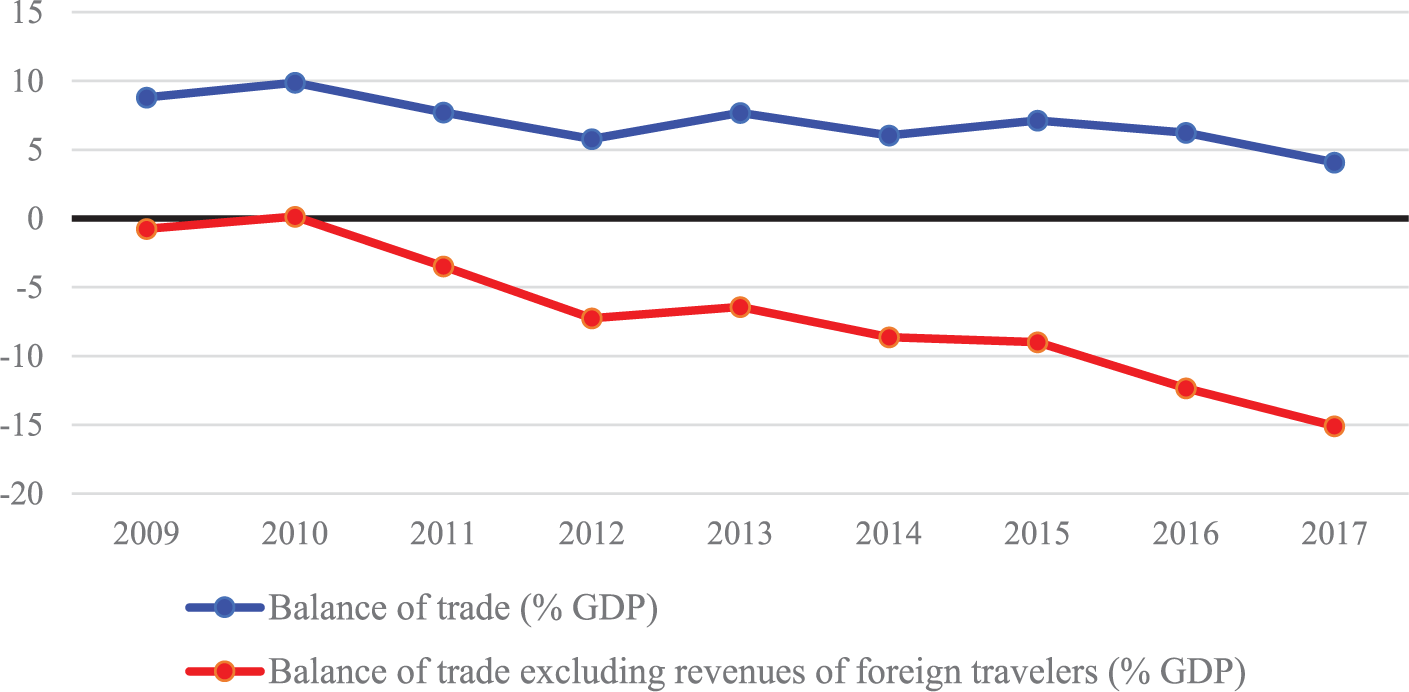
Balance of trade with and without revenues of foreign travelers (% of GDP)
During the recovery period, the tremendous upward shift in the demand curve due to the increase in the perceived attractiveness of the territory made an adjustment of the real exchange rate superfluous. The problem in maintaining an external balance in such a way is that the tourism boom could easily come to a halt, for a host of different reasons. First, it would appear that the continuous appreciation has started to dissuade potential visitors, leading one of the largest Icelandic banks to announce that “the tourism boom is over” (Landsbankinn 2018). Indeed, at least up to 2016, the exchange rate appreciation has had a limited effect on a range of tourism prices due to multi-year pricing agreements with foreign tour operators—agreements often stipulated in foreign currency. However, the substantial revaluation of the Icelandic currency has pushed the more heavily exposed businesses to start pricing in króna rather than foreign currency to keep prices stable. The preservation of profit margins guaranteed by this strategy has nevertheless made “Iceland less competitive with other destinations” (Sutherland and Stacey 2017: 16). The data would seem to confirm this dynamic: prices for some tourism services have been rising at breakneck speed over the last two years. This has notably slowed down the rate of growth of the number of tourists visiting Iceland—from 41 to 10 percent between July 2017 and June 2018. Moreover, the strengthening króna has produced a wave of cancellations, the main culprit of which is high prices, which has made visiting the country unfeasible for a large segment of travellers (Þórsson 2017; RUV 2018).
Second, it is not far-fetched to hypothesize that the downward trend that we have witnessed in the last year could stretch into the near future. For example, the demand from high-income tourists may fall at a more sustained rate if Iceland continues to attract mass tourism, consisting of middle- or low-income people. To paraphrase Hirsch (1976: 27), the “congestion or crowding through more extensive use” of Icelandic tourist sites, with the environmental degradation that this implies, 7 might decrease the satisfaction derived by high-income tourists from having access to a unique destination offering adventure and wild experiences. Not being able to signal their status to others through this sort of (positional) consumption, higher-income tourists might well shift their preferences toward new, exotic tourist sites ahead of the masses. Finally, Iceland could be adversely affected by an external shock outside of the country’s control. After all, the eruption of Eyjafjallajökull in 2010 that closed Europe’s airports “is a stark reminder of the unpredictability and wide-ranging impact of geological events” (Forbes 2018: 20).
Regardless of the cause, if the downward trend concerning the growth of the tourism sector were to consolidate, the current level of exports could only be sustained through a real depreciation of the Icelandic króna. One the one hand, this would make the tradable sector more competitive. On the other hand, a real depreciation entails a decrease in the profit rate and/or real wage rate (Frenkel and Rapetti 2015). Given the high responsiveness of real wages to labor market conditions, however, a reduction in workers’ compensation can only be attained by means of increased levels of unemployment. It should be noted that a delay in the adjustment of real wages would postpone the improvement in the competitive position of the country. If such an event occurs, an external imbalance will arise, since the trade balance will be strongly affected by a further decrease in exports (assuming unchanged imports). In this eventuality, the current real exchange rate could be maintained only at the price of a continuous flow of capital from abroad to cover the current account deficit. This would contribute to transforming Iceland once again into an essentially parasitic economy, with the increasingly external fragility that this implies.
In this regard, we must consider the possibility that the dynamics of capital flows are already laying the foundations for this transformation. Especially since the progressive lifting of capital controls, significant foreign net capital inflows have been registered. The latter can be explained by the yield spreads between Icelandic and other OECD countries’ government bonds, which helped to attract foreign capital in search of high returns. Between the first quarter of 2015 and the first quarter of 2018, the financial account of the Icelandic balance of payments recorded a surplus of 467,000 million króna. This capital inflow evidently played a non-marginal role in supporting the Icelandic exchange rate. However, the possibility cannot be excluded that an increase in the risk aversion of investors or the need to stop the formation of speculative bubbles may cause a sharp reversal of the expansionary monetary policies that are currently dominant at the international level (BIS 2016).
4. What Should Have Been Done Differently to Put the Icelandic Economy on a Sustainable Growth Path?
So far, we have shown that there are enough elements to question the long-term sustainability of a growth path such as the one Iceland has been following during the past decade. From the demand side, a considerable appreciation leads to a significant increase in profits and real wages which, as a norm, induces an increase in demand for tradable goods. From the supply side, a strong currency tends to squeeze the profitability in the tradable goods industries. In Iceland, the combination of these two forces would have been expected to manifest itself in the form of a potentially unsustainable trade imbalance. However, the very rapid expansion of a particular sector of the economy, which is strongly dependent on exogenous variables and tends to be subject to sensitive cyclical fluctuations, has allowed the country to combine, at least temporarily, rising wages and profits with continued currency appreciation, along with the accumulation of trade account surpluses. The risk is that, given the heavy reliance on tourism, a further slowdown in revenues from foreign travellers would easily throw the trade balance into an unsustainable deficit, which only a sharp currency depreciation could correct. Therefore, from the perspective of exchange rate policy, there seems to exist a trade-off between the objectives of maintaining external stability and securing the current level of income in the long run: a depreciation of the real exchange rate can boost external competitiveness only at the cost of squeezing real wages or profits (or both).
But what is, if any, a sustainable growth path that might reconcile a high purchasing power vis-à-vis international output with a balance of trade equilibrium? In other words, how could a country like Iceland offset the detrimental effects of a currency appreciation on the external position of the country in the long-run? If we assume that the major intent of the policymakers is to preserve the current level of income entailed by an appreciated exchange rate, then the maintenance of external balance can be achieved by enhancing the profitability of the tradable sector’s firms. This would induce more resources to flow toward this sector, hence supporting the development of exporters and import-competing firms.
A shift of the country’s productive structure toward high value-added sectors and activities—where the output price determined by international markets is high in relation to the amount of labor and capital expenditure which is required to produce that output—might well serve this purpose. Typically, this growth strategy requires a productive specialization toward non-traditional branches of activities, thanks to which countries are able to avoid intense competition. In particular, specializing in the production of more sophisticated tradable goods is desirable for a country because it enables the economic system to resist the downward movement of prices (Amin 1974). On the other hand, specializing in sectors that produce relatively simple and standardized products characterized by stiff international competition involves facing a fierce race to the bottom on prices. This is all the more true in light of the turn of a growing number of developing countries toward export-oriented strategies, which appears to have increasingly exposed international exporters “to the emergence of more competitive suppliers in countries with lower costs” (Akyüz 2005: 29).
Under this set of historically contingent circumstances, high-income countries like Iceland can insulate themselves from low-cost competition by means of their superior endowment of technological capabilities. These do not only consist of product or process innovation conducted by highly qualified scientists mainly engaged in R&D work. In fact, for a technology to be effectively introduced, the skills necessary to design entirely new products and processes, or what Amsden (2001: 3) calls “innovation capabilities,” must be complemented with “production capabilities,” namely the ability necessary to transform intellectual inputs into tangible outputs by specialized technicians involved in the production sphere proper (Wood 1994), as well as the “tacit capabilities” that are learned and reproduced through actual operating experience—otherwise known as learning by doing (Nelson 1987).
From the above it follows countries tend to specialize in productive sectors with different technological levels—the latter being dependent on the degree of technological capabilities, in all its forms, of the available population (Lall, Weiss, and Zhang 2006). The endowment of higher technological capabilities in developed countries allows their firms to specialize in the production of commodities exchanged in innovation-intensive markets (Cimoli and Katz 2003), where lower technological capability implies the probability of facing intense price competition from international rivals (Kaplinsky and Santos-Paulino 2006). In other words, the higher the level of technological capabilities of a nation’s labor force, the higher the probability of firms in that nation acquiring a dominant position in technology-intensive markets. To the extent that it offers opportunities to earn technological rents (Reinert 1995; Amsden 2004), one might expect that export specialization for technologically innovative commodities allows high-income countries to increase the profit margins of the tradable sector’s firms without squeezing labor compensation. We can therefore conclude that, in the long run, the specialization in highly technological markets which attribute a much greater value to highly skilled labor appears to be an effective strategy for maintaining all the benefits of a strong currency (i.e. high rewards of labor and capital) without generating structural deficits in the balance of trade.
4.1 The mismatch between wage level and technological capabilities in Iceland
The set of technological capabilities that play a significant role in fostering competitive advantage through the specialization toward knowledge-intensive sectors can be captured in the Economic Complexity Index (ECI) developed by Hidalgo and Hausmann (2009). Based on the authors’ assumptions, a nation’s overall complexity can be expected to reflect its ability to efficiently manage production processes that require a wide range of knowledge and skills. The ECI, which is proportional to the total complexity of the products exported by a country, is derived by analyzing the “ubiquity” of such products: in short, the fewer the countries that export a certain product, the higher the complexity of that product. This is based on the idea that, as the level of advanced knowledge required to make a certain good increases, the number of countries that are able to produce and export that good decreases. It is therefore easy to see why ECI is both a proxy for the mix of knowledge and skills which underpin the production structure of a country and a good predictor of the income of that country. Exporting non-ubiquitous goods means, in effect, exporting goods that require knowledge that is difficult to acquire and therefore less subject to international competition and whose price, therefore, tends to be high(er) compared to the labor value they contain. It follows that the higher a country’s level of economic complexity is, the higher that country’s income can be expected to be.
Before testing whether the current level of Icelandic wages (and the unemployment rate consistent with it) is coherent with the complexity of the Icelandic productive system, it should be clarified that, according to Hidalgo and Hausmann, ECI is correlated with a country’s income as measured by GDP per capita rather than the average wage level. However, the model we adopt implies that workers appropriate at least part of the higher incomes deriving from an international specialization in sectors with higher added value. This is based on the assumption that an increase in the value produced per hour worked leads to an immediate increase in profitability and investment spending. This increases the demand for labor, which will shift the wage curve upward. With this clarification, let us now assess whether Iceland’s average wage level is consistent with Iceland’s productive capabilities and its respective knowledge bases. For the measurement of the level of complexity of exports, we refer to the data provided by the Atlas of Economic Complexity (Hausmann et al. 2014). 8
From the following chart (figure 10) two conclusions can be drawn: in line with the thesis of Hidalgo and Hausmann, if we exclude Iceland, wages in other high-income countries are generally positively correlated with ECI. However, compared to other OECD countries, Iceland has a wage level which, when compared to the complexity of its export basket, appears to be significantly higher.

Relationship between ECI and labor wages (in constant prices at 2017 USD PPPs)
In 2017, the most exported typologies of goods in Iceland were raw aluminum and marine products, whose complexity indices are well below the world average product complexity index. In the aggregate, the complexity of the top products exported by countries whose average wage level in purchasing power parity (PPP) is similar to Iceland’s is incommensurably higher than those exported by Iceland, meaning that, upon closer inspection, the Icelandic high salaries would not appear to reflect the productive specialization of this country.
The pattern of significantly lower value of ECI for Iceland is confirmed by the time series provided in Figure 11. In fact, during the economic recovery period, Icelandic economic complexity decreased from −0.781 to −0.847. We can therefore confidently rule out that the Icelandic recovery was driven by an increase in exports of advanced products which require sophisticated labor inputs.

OECD countries with largest and smallest ECI
We come to similar conclusions if we focus on the percentage breakdown of Iceland’s exports according to two broad technological categories embodied in the final products, namely medium-tech (MT) and high-tech (HT) (figure 12). Insofar as they “have ‘difficult’ technologies, with high skill, complex learning, and demanding technological activity” (Lall 2000: 343), MT and HT products together provide a good indication of the skills level associated with productive specialization and should, therefore, correlate with the wage level. As figure 12 shows, the fall in the share of MT and HT exports that occurred in Iceland between 2006 and 2011 was not followed by a rebound, contrary to the great majority of European countries. Between 2011 and 2016, products with a high and medium technological content continued to constitute only 9 percent of total exports, compared to a European average of 48 percent, which is significantly higher compared to the previous five-year period.
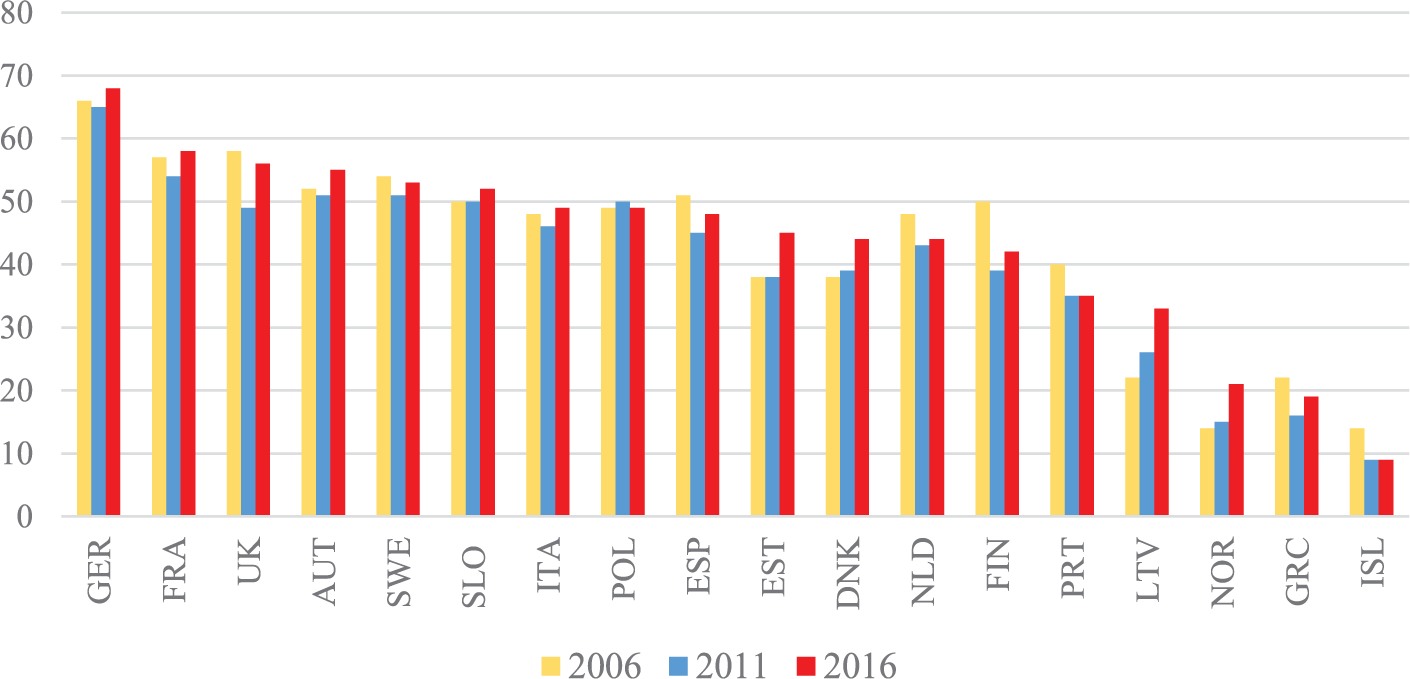
Hi-tech and medium-tech exports on total exports, 2006–16 (%)
Overall, Iceland shows an accelerated decrease in the economic technological content of exports when compared to the remaining OECD countries. Nevertheless, real wages increased significantly faster in Iceland, if it is true that between 2011 and 2017 Icelandic real wages increased by 32 percent, compared to an average increase of 6.2 percent. This confirms that the level of Icelandic wages is becoming increasingly unjustified on the basis of the country’s productive specialization.
4.2 The policy of technological stagnation
The data presented above indicate that the dizzying growth of labor income in Iceland during the country’s “miraculous recovery” is not due to the diversification of the productive structure toward more dynamic exports with higher technology content. If we assume that the modernization of products already in use and the creation of qualitatively new products depends on the scientific sophistication of labor resources, it logically follows that the decisive element which helps to shelter an economy from fierce international competition is the “gray matter” of its working people (Amin 1974: 89).
This can be stimulated through purposeful investment in education and R&D. Although the impact of educational investment on the growth of export sophistication in high-income countries is less evident than that of R&D outlays (Zhu and Fu 2013), the general development in the level and quality of education still exercises an indirect, but no less important, influence on the capacity for innovation in these countries. First, high-quality secondary and higher as well as vocational education makes it possible to improve the absorptive capacity of domestic manpower, that is, its capacity to incrementally upgrade imported technologies as well as improve manufactured products (Golichenko 2016). Second, and perhaps more importantly, the educational system delivers R&D units its product: highly skilled scientists, engineers, and technicians—the quantity and quality of whom is the decisive factor in the efficiency of basic research, applied research, and experimental development work (Turchenko 1976). It follows that a diversion of resources to expand the scale of education indirectly stimulates the germination of new scientific ideas, their effective assimilation into production, and ultimately the specialization in complex productions of a more knowledge-intensive nature.
That Icelandic policymakers have neglected the importance of boosting the country’s technological capabilities is confirmed by the stagnation of investment in education and R&D in Iceland over the past decade. 9 The per capita expenditure on tertiary education (in thousand króna at 2017 prices) fell by over 13 percent between 2008 and 2017. The same goes for per capita public expenditure on total education. Most likely, the latter is bound to further decrease in the coming years as a result of the Icelandic government’s 2016 decision to shorten the duration of upper-secondary education from four to three years. Nonetheless, the cut in education spending has immediately manifested itself in the quality of the product of the educational system with a drop in the scores in international tests for the evaluation of scientific knowledge (PISA), to such an extent that Iceland now “lags the OECD average in science and reading—and the Nordic average in mathematics also” (IMF 2018: 20–21). This means that the decline in educational investment is already decreasing the intellectual potential of labor resources that will soon be employed in the various rings of the innovation chain, thereby undermining the effectiveness of future R&D investments.
Data referring to R&D shows a similar trend. Although Iceland continues to devolve a share of GDP to R&D expenditure comparable to the European average, in fact between 2007 and 2017 it was the country that more than any other reduced the share of added value destined for this sector, from 2.55 to 2.1 percent. The significant decrease in Iceland’s total expenditure in R&D is mainly due to an accelerated decline in the state’s influence on the development of science and technology, if we consider that Iceland is the country that recorded the most marked drop among high-income countries in the contribution of the public sector to the financing of R&D activities, equal to 11.4 percent (figure 13).

Growth in the share of public expenditures on total R&D, 2011–17 (%)
Substantial changes have been taking place in the structure of public R&D spending. Figure 14 gives an idea of the collapse of public expenditures throughout the various stages of the innovation chain. It is evident that the Icelandic government role in supporting and stimulating the development of basic research, applied research, and experimental development has become increasingly marginal.
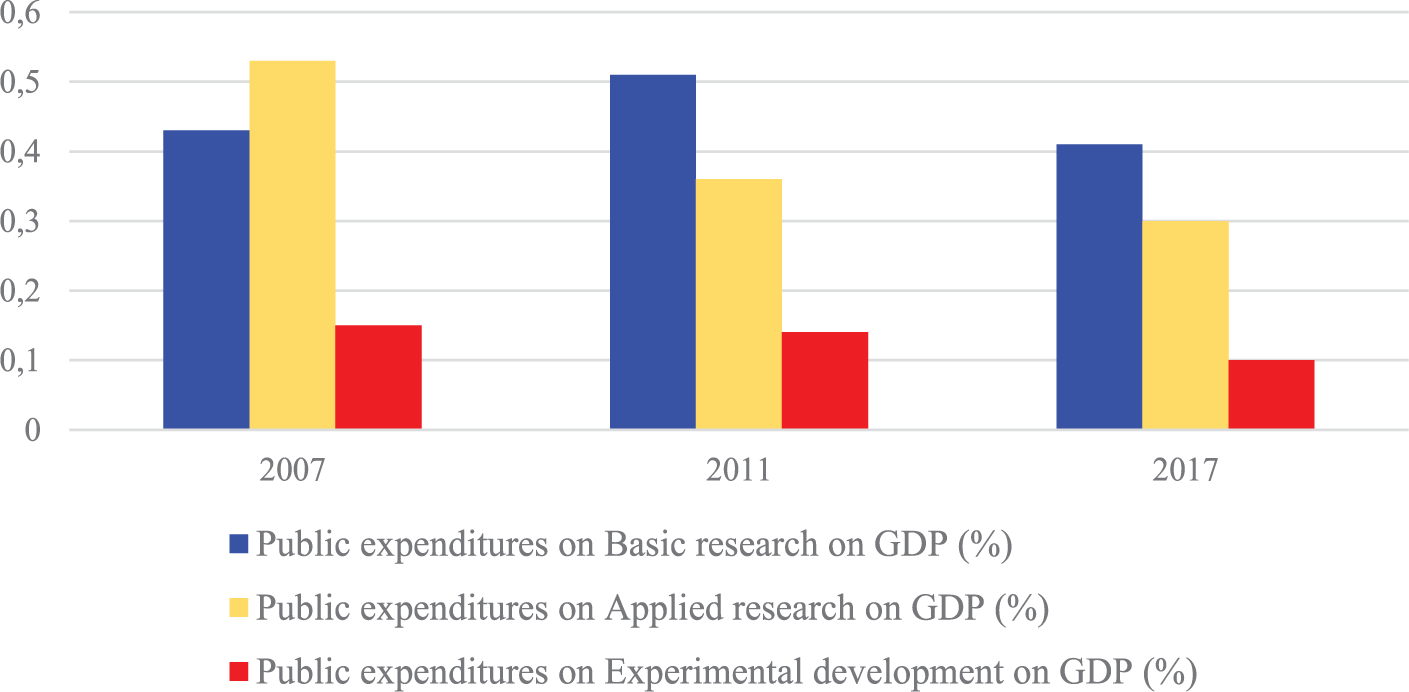
Share of public expenditure by type of R&D activity on GDP (%)
This trend contrasts with the paths followed by many capitalist governments to accelerate the outlays on R&D, especially basic research—which is the starting point in the formation of fundamentally new technologies (Jánossy [1971] 2016). As convincingly demonstrated by Mazzucato (2013), private business is extremely reluctant to finance basic research because it not only entails the greatest degree of risk from the standpoint of profitability but also because the interval between the start of the research, the achievement of new scientific discoveries, and their materialization into new products is of a very indeterminate nature. Early-stage technology development in most of the leading capitalist countries is therefore usually conducted through the government financing of universities and academic institutions with emphasis on discoveries and inventions in fields holding the promise of increasing the competitiveness of domestic products in external markets. As figure 13 confirms, this strategy was actually promoted by a number of governments in western Europe, which took action to strengthen public expenditures in R&D over the past ten years.
The case of Norway is particularly interesting for our study since its oil and gas revenues pose a serious risk to the international competitiveness of the Norwegian tradable sector, and thus resemble the detrimental effect of windfall from tourism on the external competitiveness of Icelandic producers. In contrast to the laissez-faire approach to industrial policy adopted by Icelandic governments, Norwegian policymakers have tried to actively preserve the competitive edge of the domestic manufacturing sector by increasing state allocations to all branches of R&D, from 0.71 to 1 percent of GDP during the 2007–17 period, on the one hand—and through the use of income policies as well as the imposition of some restrictions to capital inflows to prevent the overvaluation of the Norwegian krone, on the other. This policy mix has proved successful in maintaining the appreciation of the real exchange rate and the growth of real wages more in line with the development of the productive capabilities of the country (Larsen 2006). Not unexpectedly, this deliberate strategy helped Norway to insulate, at least partially, its economy from the dangers of resource curse and Dutch disease, as it made its contribution to augment the country’s competitiveness in non-resource exports and import-competing industries, so much so that Norway is the country that recorded the highest improvement in ECI among the capitalistically developed nations between 2011 and 2017 (see figure 11).
The non-interventionist stance of the Icelandic policymakers in the fields of education, R&D, and monetary policies have led to the opposite results. The downward trend in economic complexity during the recent years of strong economic recovery has been accompanied by a parallel stagnation of employment in high-technology manufacturing. As highlighted by figure 15, between 2010 and 2017 employment in high-technology manufacturing as a percentage of employment in manufacturing has decreased from 3.95 to 3.19 percent—one of the lowest values among high-income countries together with Portugal.
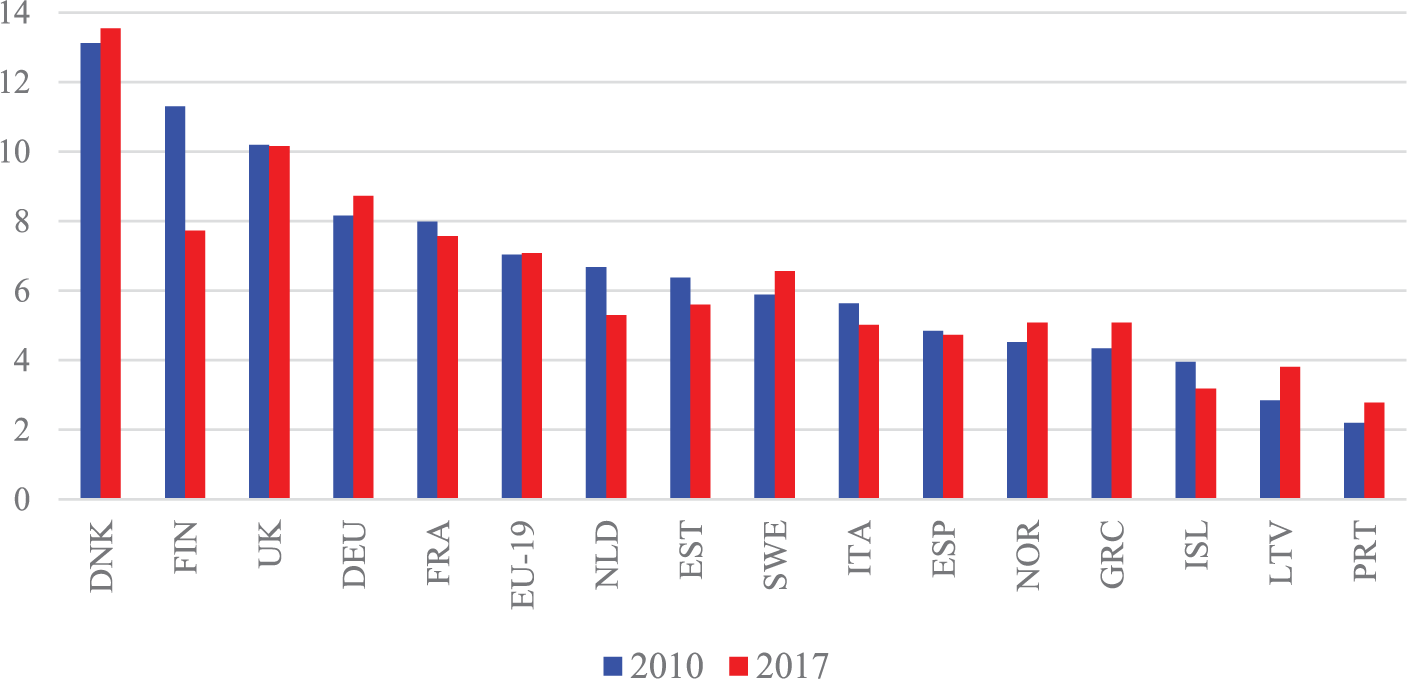
Employment in high-technology manufacturing (% of total manufacturing)
The shrinking of technologically advanced sectors has also reduced the demand for technical skills by Icelandic high-school students—skills necessary to effectively use the most advanced work tools once they have entered the labor market. From 2008 to 2016 the proportion of new entrants to vocational science-oriented programs on the total of new entrants at the upper secondary level has decreased from 18.4 to 17.1 percent.
The stagnation of high-skilled employment was mirrored by a staggering increase in employment in tourism, which traditionally tends to have a higher proportion of unskilled workers than the tradable commodities sector (Cooper et al. 1993; Sutherland and Stacey 2017; Nowak, Sahli, and Sgro 2003). As shown in figure 16, employment in tourism has more than doubled in both absolute and relative terms during recovery period, so much so that in 2017, 15 out of 100 people were employed in this sector.

Persons employed in tourism (total and over total employed, %)
In the meantime, the relatively good employment opportunities for unskilled people resulted in the creation of a distorted system of incentives that discourage individuals from advancing their education. Indeed, evidence suggests that rich employment opportunities in tourism are positively correlated with students’ decision to leave education prematurely, to such an extent that 19 percent of 25–34-year-olds were without upper secondary education in 2017, one of the highest ratios in the OECD (OECD 2018b). All of this shows that the increase in the level of wages and income during the period of the “miraculous recovery” is the result of a fortuitous temporary increase of attractiveness of Iceland as a unique destination for “luxury” tourism, the dark side of which is represented by a productive regression toward an intrinsically labor-intensive and low-skilled sector.
5. Summary and Conclusions
In this article, we have argued that the tourism-led growth model that Iceland has pursued over the past decade has been able to guarantee, at least momentarily, the return to full employment, sustained economic growth, and low inflation. By overlooking its marked elements of fragility, the Icelandic authorities might have unfortunately failed to predict the undesirable effects of this apparent success story, namely, the country’s tendency to specialize in low-skilled sectors. Studying the source of this failure is beyond the scope of this article. However, it can be suggested that short-term considerations (such as the need to combat unemployment and therefore reduce the risk of social instability, while preserving a low-inflation environment) might have led the Icelandic policymakers to overestimate the gains from rapid expansion of the tourism sector. Regardless of the causes that might have limited longer term concern for sustainable development, the passivity shown by the authorities in the face of the tourism boom has, de facto, accommodated a currency appreciation leading to a loss of technological dynamism which in turn has had negative repercussions on the development of the tradable sector. On the other hand, the prevalence of short-term considerations at the expense of an integral approach to long-term growth is also confirmed by the dynamics of public expenditure on education, vocational training, and R&D, which has led to the stagnation of technological capabilities in Iceland.
The most striking result of this laissez-faire approach is the involution of the export sector, where the bulk of skilled labor is usually concentrated (Leontief 1956); the export share of goods to GDP declined from 32.9 to 20.6 percent over the 2011–17 period. Worse yet, this laissez-faire model is simply not appropriate to the task of guaranteeing sustainable growth under the competitive conditions of technologically advanced capitalism. The widening mismatch between the average skill level and real wages of the workforce led to an overvaluation of the real exchange rate, compared to the value that in the long term would permit the maintenance of an external balance. Indeed, we have seen that, in the absence of the tourism boom, the growth of real wages combined with the inability to compete in high-value-added sectors would have inevitably resulted in an unsustainable external deficit.
In section 4, we argued that in the long run, the compatibility of high full employment, high wages and profits, price stability, and external balance can only be guaranteed by a reorientation of the country’s productive structure toward sectors with higher added value. The crucial economic-political requirements for a successful renewal is the formulation of a set of monetary and fiscal policies that reassert an extensive role of the state in creating the conditions for bringing a strong currency into line with external balance. Such an approach dictates a two-part course of action.
First, the preservation of a high purchasing power on international output in the long run requires a “preparatory phase,” which paradoxically involves the adoption of a more competitive real exchange. The increase in per-capita manufacturing exports triggered by a weaker currency might activate a virtuous cycle of foreign trade-driven learning-by-doing processes that cumulatively promote the growth of technological capabilities. This, in turn, could contribute to gradually increasing the average technology content of exports (An and Iyigun 2004), and hence create the background for increasing competitiveness in the more sophisticated segments of the tradable sector. This process will likely enhance the resilience of import-competing industries to cope with an appreciation of the domestic currency in the long run (ECLAC 2012). For policymakers, the timing of action is critical in this regard, since a delay in the adjustment of the real exchange rate could result in forgone learning opportunities (Cimoli and Porcile 2009). This might set in motion a vicious circle where the slowing down of the acquisition of the capabilities necessary for accessing high-value-added markets will, in turn, tend to further widen the competitive gap between Iceland and its rivals.
Second, it is necessary to strengthen the scientific-technical potential of the economic system, which in turn is closely bound up with the rapid improvement of the scientific sophistication of national labor resources. Given the partial ineffectiveness of market forces as a method of stimulating higher educational attainment, the state should intervene to increase the demand for a highly qualified workforce. This goal can be concretely achieved through adequate policy tools that redirect resources away from low-tech sectors to non-tourism tradable productions lying on the technological frontier. Since “market prices cannot reveal the profitability of resource allocations that do not yet exist” (Rodrik 2008: 104), government fiscal transfers might contribute to fostering innovative investments that may otherwise be deterred by a high risk of failure. Finally, mounting employment opportunities in new, non-traditional industries might set in motion a virtuous cycle of cumulative causation. In this process, increased demand for complex skills exerts an upward pressure on quality manpower’s wages that acts as a stimulus for individuals to increase their investment in education. This dynamic finds expression in an upward spiral of skill accumulation at the national level which, in turn, underpins the upgrading of the economy’s technological capabilities. Inasmuch as such capabilities strengthen the competitiveness (and profitability) of domestic knowledge-intensive firms vis-à-vis foreign producers, both in domestic and external markets, they will likely stimulate a reallocation of resources toward the most dynamic segments of the tradable sector.
To conclude, an alignment of the productive structure with the actual level of real wage and external equilibrium is still possible for Iceland on the basis of very different policies from those relying almost entirely upon undirected market mechanisms.
Footnotes
Appendix
This appendix explains in more detail the method we used to determine the specific real wage level that would make the rate of profit equal to the actual rate, under the assumption that output, consumption, and investment prices all grow at the same rate (ΔPGDP = ΔPC= ΔPI). To do this, we need to determine a hypothetical state of affairs, which we call “hypothetical scenario n.2.” This can be defined as a situation in which:
The hypothetical scenario n.2 differs from the actual and hypothetical scenario, in that it is characterized by different levels of real wage and, thus, profit share. Table 1 summarizes the main differences among the actual scenario, hypothetical scenario n.1, and hypothetical scenario n.2.
To determine the actual wage which, in hypothetical situation n.2, would make the rate of profit equal the actual rate of profit, we firstly determined the corresponding profit share. We call this variable “hypothetical profit share n.2” (PSHH2). By assuming that the actual profit rate is the same as the one in the hypothetical scenario n.2 (r = rH2):
where the term KHyp represents the nominal capital stock.
PSHH2 can be calculated as follows:
Since the profit share is 1 minus wage share, we can easily calculate the corresponding hypothetical wage shares (WSHH2). By assuming that the levels of output and employment are exogenously given, we can estimate the nominal wage that needs to be paid to workers in order for them to obtain the wage share of hypothetical situation n.2. This nominal wage, which is called WnH2, can be calculated as follows:
where EMPH is total hours of work.
WnH2 is defined as the nominal wage which makes the rate of profit equal to the actual rate of profit. Next, we estimate the actual hourly nominal wages by dividing the total hours of work to the total mass of nominal wages. Then, we convert the nominal actual hourly wage and the WnH2 into real hourly wages (in 2005 króna). For this purpose, the former was deflated by the GDP deflator. The latter, instead, was deflated by a virtual deflator, which has been assumed to be equal to the private consumption deflator (PC) in the first quarter of the base year (Q12014), while its growth rate has been assumed to be identical with the growth of GDP deflator over the entire period under consideration (Q12014–Q42017). Finally, we calculate the actual real hourly wage in relation to the real hourly wage of hypothetical situation n.2 (WH2), i.e. the real hourly wage that, given ΔPGDP = ΔPC = ΔPI, makes profits equal to the actual ones.
Acknowledgments
We are indebted to Leonardo Bargigli and Pétur Steinn Pétursson for the discussions and ideas that made this article possible. Also we are grateful to the referees for their insightful comments. Any shortcomings or errors are ours.
Declaration of Conflicting Interests
The author(s) declared no potential conflicts of interest with respect to the research, authorship, and/or publication of this article.
Funding
The author(s) received no financial support for the research, authorship, and/or publication of this article.
1
The rate of profit is calculated as follows: [(GDP − compensation of employees)/total capital stock)] × 100.
2
Equivalently, the real appreciation could be represented as an increase in output prices not followed by a nominal devaluation. However, in terms of our model the results are equivalent.
3
That is, assuming an unchanged constant price of output, consistent with our definition of real appreciation, and unchanged wages.
4
That is, assuming an unchanged constant price of output, consistent with our definition of real appreciation, and unchanged real capital per employee.
5
All variables for the calculations in this section are collected from the Quarterly Macroeconomic Model (QMM) of the Icelandic Economy (see Daníelsson et al. 2015) and the underlying quarterly database (see  ).
).
7
For example, the overconstruction of infrastructures and tourist facilities to cope with the increase in foreign visitors might exert heave pressure on Icelandic non-renewable resources, thereby leading to their faster depreciation.