
Abstract
We create unique patent-based measures of Marshall–Arrow–Romer (MAR) and Jacobs knowledge spillovers using patent citations data and use them to test the Glaeser et al. model of local industry employment growth on three emerging technology categories, namely, computing and communications, drugs and medical, and electrics and electronics. We test growth in 45 U.S. metropolitan statistical areas (MSAs) and consolidated metropolitan statistical areas (CMSAs) for eight two-digit industries over the period 1994 to 2000. We find strong evidence for MAR spillovers from specialization, but little for Jacobs spillovers from diversity. Our results suggest that regional specialization, but not diversity, boosts local industry employment growth in these knowledge fields.
Keywords
Introduction
Knowledge spillovers/externalities occur when the innovations of one agent lead to an enhancement of the productivity of another agent that does not bear the cost of the innovations. The extensive literature focusing on the impact that such spillovers have on economic growth generally deals with two types of spillovers: (a) Marshall–Arrow–Romer (MAR) spillovers from specialization and (b) Jacobs spillovers from diversity.
Based on Marshall (1890), Arrow (1962), and Romer (1986), MAR spillovers are between firms within the same industry. Clustering of an industry in one area (e.g., microchip manufacturers in Silicon Valley) helps foster knowledge spillovers across firms in the industry, promoting the growth of both the industry and the city. A city with a high degree of specialization is, therefore, expected to have a high growth rate.
In contrast, Jacobs (1969) argues that knowledge transfers across different industries boost a city’s growth, with the variety and diversity of industries fostering knowledge spillovers. A city with a low degree of specialization (one in which industry is diverse) is, therefore, expected to have a high growth rate.
The contrasting growth conclusions from MAR and Jacobs spillovers have spurred debate and have led to many empirical studies, the results of which have been mixed. Glaeser, Kallal, Scheinkman, and Shleifer (1992); Suedekum and Blien (2005); Van Stel and Nieuwenhuijsen (2004), among others, all find evidence to support Jacobs externalities. Whereas others, including Almeida (2007); Henderson (2003); De Lucio, Herce, and Goicolea (2002); and Zheng (2010) find evidence for MAR externalities.
Some researchers have also found support for both types of externalities, depending on the situation. For example, Lee, Jang, and Hong (2010) find Jacobs externalities to be important for relatively old industries and MAR externalities to be important for relatively young industries; whereas, Caragliu, de Dominicis, and de Groot (2016) find that Jacobs externalities are more relevant in dense urban areas, whereas MAR externalities are more relevant in regions with low density.
Growth studies often rely on indirect measures to identify knowledge spillovers. Industry concentration ratios and representation rates are often used as proxies for spillovers from diversity and specialization, respectively. However, indirect measures of knowledge spillovers make identification of the true externality effects difficult.
In contrast, patent citations have increasingly been used in studies of the geographic localization of knowledge spillovers, following the work of Jaffe, Trajtenberg, and Henderson (1993). Despite certain shortcomings, citations are seen as a more direct measure of knowledge spillovers. To date, however, patent citations have not been used to study the impact of MAR and Jacobs externalities in economic growth.
In this article, we create unique measures of knowledge spillovers using patent citation statistics and use them to test the Glaeser et al. (1992) model of local industry employment growth on the knowledge categories of computing and communications, drugs and medical (D&M), and electrics and electronics. Our patent-based measures of knowledge spillovers gauge the local densities of patent citations to capture the two types of externalities. We find that geographic concentration of knowledge spillovers helps explain local industry employment growth. In particular, we find strong evidence for MAR externalities but little evidence for Jacobs externalities. Our results suggest that regional specialization, not diversity, boosts local industry employment growth.
Patent-Based Measures of Knowledge Spillovers
The patenting process involves a search for “prior art”—relevant existing domestic and international patents. Patent documents list the prior art as citations or “references,” along with information about the invention, the inventor, her employer, and her residence. These patent citations then allow for the tracing of multiple linkages between inventions, inventors, firms, and locations, and enable us to analyze the geographical extent of knowledge spillovers.
The use of patent citations to measure knowledge spillovers is not without limitations, though. Patent citations only capture spillovers between patented inventions, not those between unpatented inventions or through other channels such as skilled labor, conferences, and trade fairs. Citations, thus, represent only a subset of knowledge spillovers. According to Jaffe et al. (1993), the results of basic research cannot usually be patented but tend to generate the largest spillovers and are also communicated via mechanisms that are less likely to be localized. Thus, patent citation–based knowledge spillovers are most appropriate for applied research and we should exercise care in extrapolating to the localization of spillovers from basic research. Nevertheless, the National Bureau of Economic Research (NBER) patent citations data file contains more than 16 million citations made by patents granted between 1975 and 1999, so the portion of knowledge spillovers captured in patent citations should provide an important part of the whole picture (Hall, Jaffe, & Trajtenberg, 2001).
Another limitation is that some patent citations may represent only indirect knowledge spillovers because they were added by the patent examiner rather than by the inventor (Fischer, Scherngell, & Jansenberger, 2009). Fortunately, this bias against finding spillovers can be overcome with a sufficiently large sample size. Thompson (2006) finds that inventor citations are 25% more likely to match the citing patent’s location than are examiner citations for domestic patents within the United States.
A final concern here is whether patent citations are sufficiently correlated with knowledge flows to allow statistical analysis of this proxy, especially with examiner-added citations. Jaffe, Trajtenberg, and Fogarty (2004) surveyed inventors to study the modes and mechanisms of communication that cause knowledge to flow, and found that patent citations do provide an indication of such communication.
Despite these issues, economists have used patent statistics extensively in economic analysis. As Grilichs (1990) explained, “in this desert of data, patent statistics loom up as a mirage of wonderful plenitude and objectivity” (p. 1661).
Data
Our model is based on that of Glaeser et al.’s (1992), who use cross-sectional growth data for large industries in 170 U.S. metropolitan statistical areas (MSAs) between 1956 and 1987. They measure MAR externalities by the ratio of the share of employment in an industry in a city relative to the share of employment in the industry in the entire nation. A higher value (greater than one) indicates an overrepresentation of the industry in a certain city compared with the national level and, thus, knowledge spillovers from specialization are assumed to be dominant for that industry in that city. They measure Jacobs externalities using the industry concentration ratio (the fraction of the city’s employment coming from the largest five industries other than the “own” industry). The smaller this measure, the more diverse the city’s industry mix is, and, thus, knowledge spillovers from diversity are assumed to be dominant for the own industry in that city.
In our study, we use patent citations data to test the Glaeser model in 45 MSAs/consolidated metropolitan statistical areas (CMSAs) in the United States on eight two-digit SIC industries over the period 1994 to 2000.
Our data for patent citations come from the NBER U.S. Patent Citations Data File (Hall et al., 2001). We use U.S. corporation patents because they can be regarded as the result of knowledge spillovers to firms. U.S. patents are classified into six technology categories: (a) chemical, (b) computers and communications (C&C), (c) D&M, (d) electrical and electronics (E&E), (e) mechanical, and (f) others, of which chemical, mechanical, and others are considered the three traditional fields, whereas the fields of C&C, D&M, and E&E are called emerging fields heralding the direction of “technology revolution.” This article uses patents in the three emerging fields of C&C, D&M, and E&E due to the following discussions in Hall et al. (2001) regarding the patenting and citation trends: first, the three traditional fields had experienced steady decline in their numbers of patent applications as a share of the total, dropping from 76% in 1965 to 51% in 1999; second, the three emerging fields received far more citations than the three traditional fields between 1965 and 1999, signifying their higher and still rising technological significance; and third, chemical has the highest self-citation rate, at 17%, whereas citations to others’ patents are closer to the pure notion of knowledge spillover. Thus, the three emerging fields not only cover the more knowledge-intensive industries (Audretsch & Feldman, 1996) but patent citations in these fields also represent better the notion of diffuse knowledge spillovers.
In 1994, there were 82,824 patents granted to domestic and foreign corporations, accounting for 81.5% of all patents issued by the U.S. Patent and Trademark Office (USPTO). Of these, 36,576 patents fell in the above three categories, of which 18,855 had a first inventor that resided in the United States. From these 18,855 patents, 189,427 citations were created between 1963 and 1998, of which 131,117 citations were made to patents with a U.S. first inventor. 1 We use the residential address of the first inventor to locate the firm’s patent-related research and development (R&D) activities. This is reasonable given the fact that most employees live near their workplace. 2
To capture the geographic localization of knowledge spillovers, we look at “citation links” (between the citing and the cited patents) that satisfy the following two criteria: (a) the first inventors of the citing and the cited patents reside within the same U.S. MSA/CMSA (using 1993 U.S. Census Bureau MSA definitions) 3 and (b) the citing and the cited patents are owned by different companies (“assignees”). 4 We choose MSAs/CMSAs as geographic boundaries because these areas are defined to reduce traffic across geographic limits. Furthermore, the Journey to Work data set published by the Bureau of Economic Analysis shows that employees in manufacturing industries tend to reside within the same MSA/CMSA as their place of work. To allow for the possibility of citation links in multistate MSAs/CMSAs, we augment the data set to include links across certain states.
We collect and aggregate employment and wage data from the County Business Pattern (CBP) databases of the U.S. Census for each industry and for each county of the MSA/CMSA. 5 However, in New England, the MSA/CMSAs consist of towns and cities rather than counties. For example, the Boston–Worcester–Lawrence CMSA, which spans the states of Massachusetts, New Hampshire, Maine, and Connecticut in the Office of Management and Budget’s (1993) definition, has nine partial counties out of a total of fourteen. In Bristol County, Massachusetts, only 12 of the 20 towns/cities are included in the Boston CMSA. Because industry-level employment and wage data are only available at the county level, accurately collecting such data for the CMSA is near impossible, and prorating the data introduces inaccuracies. This split-county phenomenon is widespread in New England, and is discussed in Glaeser et al. (1992) and Zhang (2005). Because of this, we exclude from our study the nine MSAs/CMSAs in Massachusetts, Maine, Vermont, New Hampshire, Connecticut, and Rhode Island. In addition, we drop the New York CMSA for two reasons. First, the data for this CMSA also exhibit this split-county issue. Second, as indicated by Glaeser et al. (1992), New York’s largest sectors in the late 1980s (the starting time of our study) were mainly in traditional services such as apparel, wholesale trade, special trade contractors, and business services. These sectors are outside the knowledge scope of our study. In Table 1, we listed all MSA/CMSAs that satisfy the two criteria mentioned before so as to be included in our study, and in Table 2, we listed 10 MSA/CMSAs that are excluded due to the split-county data issue. Altogether, we have 45 MSAs/CMSAs and 5,891 qualified citation links in our sample.
List of MSA/CMSAs in the Sample.

Note. U.S. Census Bureau 1993 definition of CMSA/MSA is used. CMSA = consolidated metropolitan statistical area; MSA = metropolitan statistical areas.
List of MSA/CMSAs in New England Dropped Due to Split-County Data Issue.
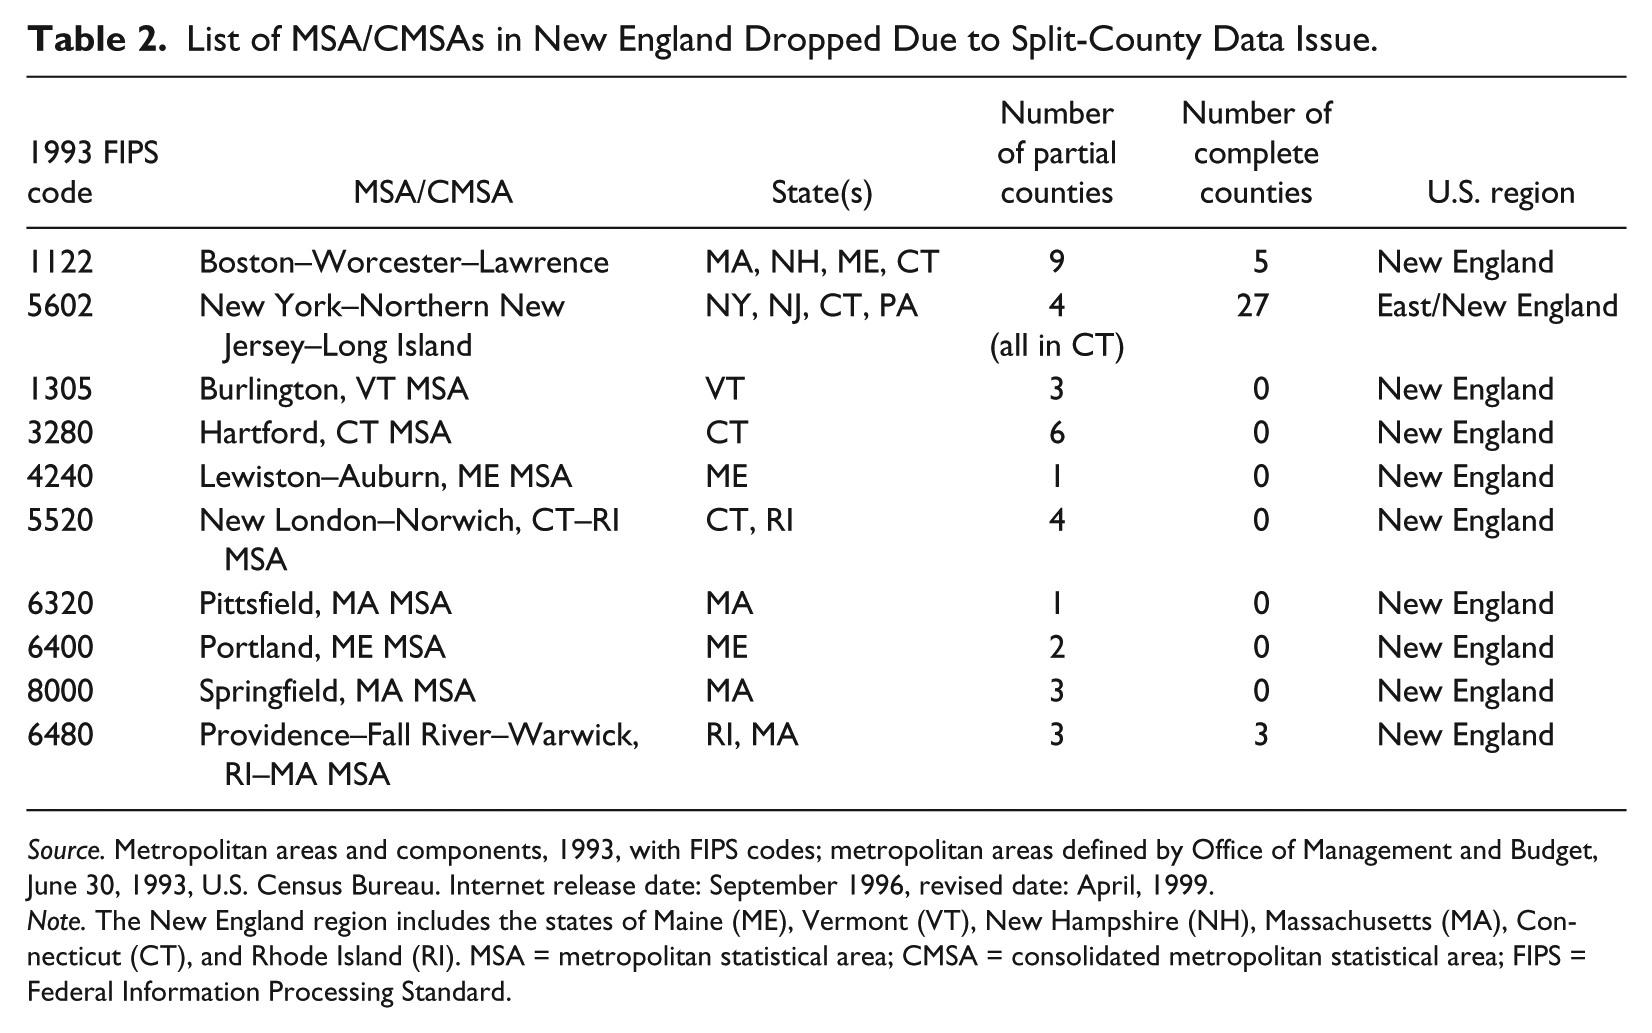
Source. Metropolitan areas and components, 1993, with FIPS codes; metropolitan areas defined by Office of Management and Budget, June 30, 1993, U.S. Census Bureau. Internet release date: September 1996, revised date: April, 1999.
Note. The New England region includes the states of Maine (ME), Vermont (VT), New Hampshire (NH), Massachusetts (MA), Connecticut (CT), and Rhode Island (RI). MSA = metropolitan statistical area; CMSA = consolidated metropolitan statistical area; FIPS = Federal Information Processing Standard.
We use the patent classification information to determine the industry that patents in a citation link belong to. There are 95 specific technology fields for our three technology categories. Using a concordance table between patent codes and the 1972 SIC codes from the USPTO website, we can match a patent to its relevant SIC industry. 6 However, this is not a simple task because the patent classification system does not mimic the SIC system adequately—matches are seldom one-to-one, and some matches are specified to a three-digit SIC code whereas others are specified to a two-digit SIC code.
As we match a patent in a citation link to an SIC category, we assign the citation link a weighting number, using data from the U.S. Census Bureau’s CBP database. The weighting number is the proportion of national subindustry employment in 1994 when matching the patent from a three-digit subindustry SIC code into a two-digit SIC industry one. For example, suppose a citing patent is classified in Class 218 in the patent system, which matches with SIC Class 361. Because subindustry 361 accounted for 5% of the national employment in the SIC 36 industry in 1994, we count this citation as only a 0.05 link in the SIC industry 36. The rationale is that the potential effect of knowledge spillovers depends on the size of the labor pool in that specific industry sector. Unfortunately, the necessary detailed information is not always available in the CBP database. For example, the USPTO does not specify the three-digit SIC codes for patents that match to the SIC Class 38 of “scientific and related instruments.” In these cases, we make our best matches by looking at the titles of these patent classes and those for the SIC 38 subindustries. Guided by the National Science Foundation’s reference of SIC classification, we can make the concordance between a patent class and a subindustry in SIC 38. 7 For every patent class in the sample, we sum the corresponding weighting numbers of the citation links in each two-digit SIC class that they match. 8
The NBER patent citations data file further groups patent classes into technology fields. We use these fields as an indication of the technological difference between the patents in each patent citation link. Specifically, we count the corresponding weighted industry citation link as knowledge spillovers through specialization if both the citing and cited patents belong to the same technology field; otherwise, the weighted citation link is counted as knowledge spillovers through diversity.
We then calculate G S and G D for each MSA/CMSA–industry pair based on the following definition:

where x S = number of weighted citation links of specialization per 1,000 industry employees in a certain MSA/CMSA and y S = number of weighted citation links of specialization per 1,000 industry employees in all MSAs/CMSAs.

where x D = number of weighted citation links of diversity per 1,000 industry employees in a certain MSA/CMSA and y D = number of weighted citation links of diversity per 1,000 industry employees in all MSA/CMSAs.
Thus, a value of G S greater than one indicates that the per-employee level of localized knowledge spillovers through specialization in that MSA/CMSA is higher than the national average. A value of G D greater than one suggests that the per-employee level of localized knowledge spillovers through diversity in that MSA/CMSA is higher than the national average.
We have 45 MSAs/CMSAs and eight two-digit SIC industries, giving a sample size of 360 MSA/CMSA–industry pairs. Dropping 31 zero observations of city–industry pairs, we have 329 remaining observations (see online appendix). 9
Empirical Model
We follow the model proposed by Glaeser et al. (1992) to test the effect of MAR and Jacobs knowledge spillovers on local industry employment growth. Suppose a firm in a city has a production function

Under neoclassical conditions, the wage rate is set equal to the marginal product of labor:

Rewriting Equation 4 in growth terms, we get

It is assumed that the level of technology At in a city–industry is the result of the joint influences of national and local components:

Thus, the growth of technology in the industry is jointly determined by the growth of national technology and local technology in the industry:

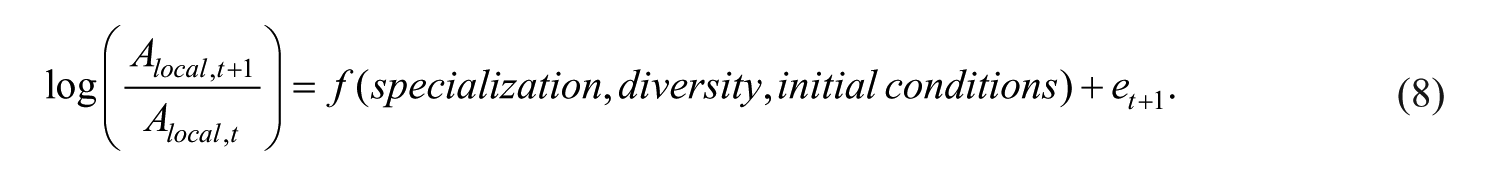
The growth of national technology is assumed to capture changes in the price of the product and trends in nationwide technology in the industry. The local technology growth, although exogenous to the firm, is assumed to depend on the various knowledge spillovers present in this industry in the city:
For our study, specialization is the variable G
S
, measuring the local density of patent citations within the same narrowly defined knowledge field; and diversity is the variable G
D
, measuring the local density of patent citations across different knowledge fields. Combining Equations 5, 7, and 8, and assuming that
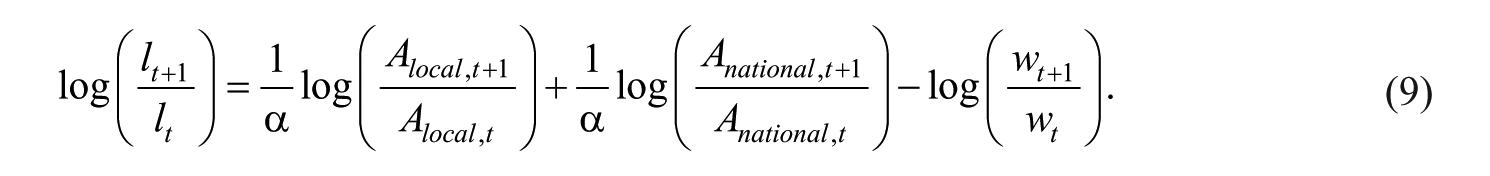
Equation 9 implies that, holding all else constant, local industry employment growth depends (a) positively on local technology growth, (b) positively on national technology growth, and (c) negatively on wage growth. The focus of our estimation is on the first term on the right-hand side of Equation 9, representing the local technology growth as a function of local knowledge spillovers from specialization, spillovers from diversity, and other initial conditions. The second term on the right-hand side represents the national technology growth, for which growth in the nationwide industry employment is used as a proxy to capture changes in the price of the product and trends in the nationwide industry technology. It is assumed that workers participate in a nationwide labor market so that wage growth will be a constant across city industries.
Following Glaeser et al. (1992), our baseline method of estimation is a pooled least squares model:

Growth in the local employment of industry j in city i is a deterministic function of (a) a constant term, which represents nationwide wage growth under the assumption that workers participate in a nationwide labor market; (b) growth in nationwide employment in industry j, a proxy for the growth in nationwide technology in industry j; and (c) local knowledge spillovers from specialization, G S , local knowledge spillovers from diversity, G D , and some initial city–industry conditions, X, in industry j and city i.
Over time, firms move to low-wage areas, from the Rust Belt to the Sun Belt (Crandall, 1993; Strauss-Kahn & Vives, 2009). In addition, previous empirical studies (Audretsch & Feldman, 1996; Glaeser et al., 1992; Koo, 2005) have pointed out that concentration of production is correlated with both knowledge spillovers and city growth. It is, therefore, important to control for the impact of production concentration when we try to explain growth by knowledge spillovers. Our control of initial conditions, thus, includes the initial wage in a city–industry, the initial employment level in a city–industry, regional dummies, and the average temperature in January in a city.
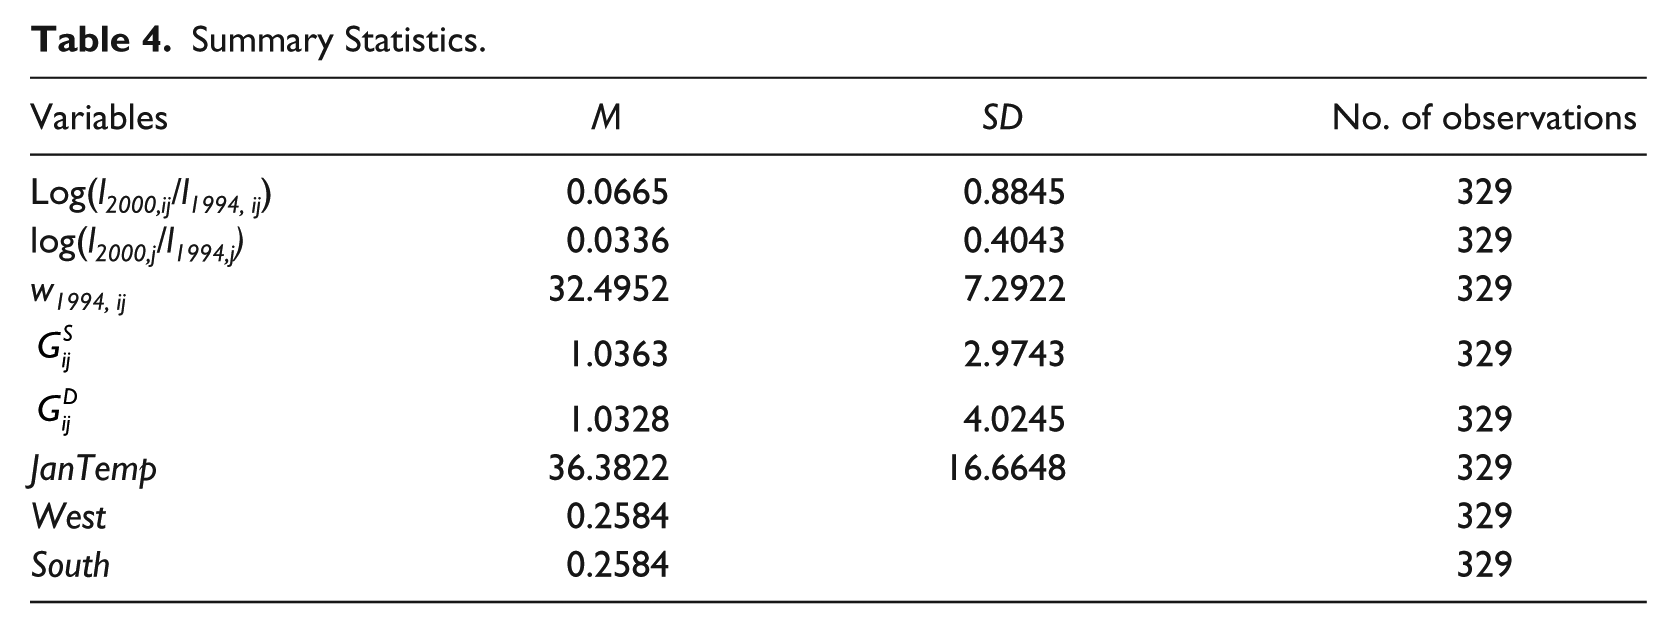
Data for these control variables are collected from the CBP database of the U.S. Census Bureau. The CBP database contains the information on employment, payroll, and number of establishments by two-digit industry for every county in the United States. Employment and wages are collected from the CBP database for each county component of the CMSA for 1994 and aggregated. CBP data for 2000 are based on North American Industry Classification System (NAICS) codes, so we collect the data by matching each two-digit SIC code in the sample with the closest NAICS code. Table 3 lists the variables in our analysis and the sources of data. Table 4 provides summary statistics of the variables.
Variables and Sources of Data.
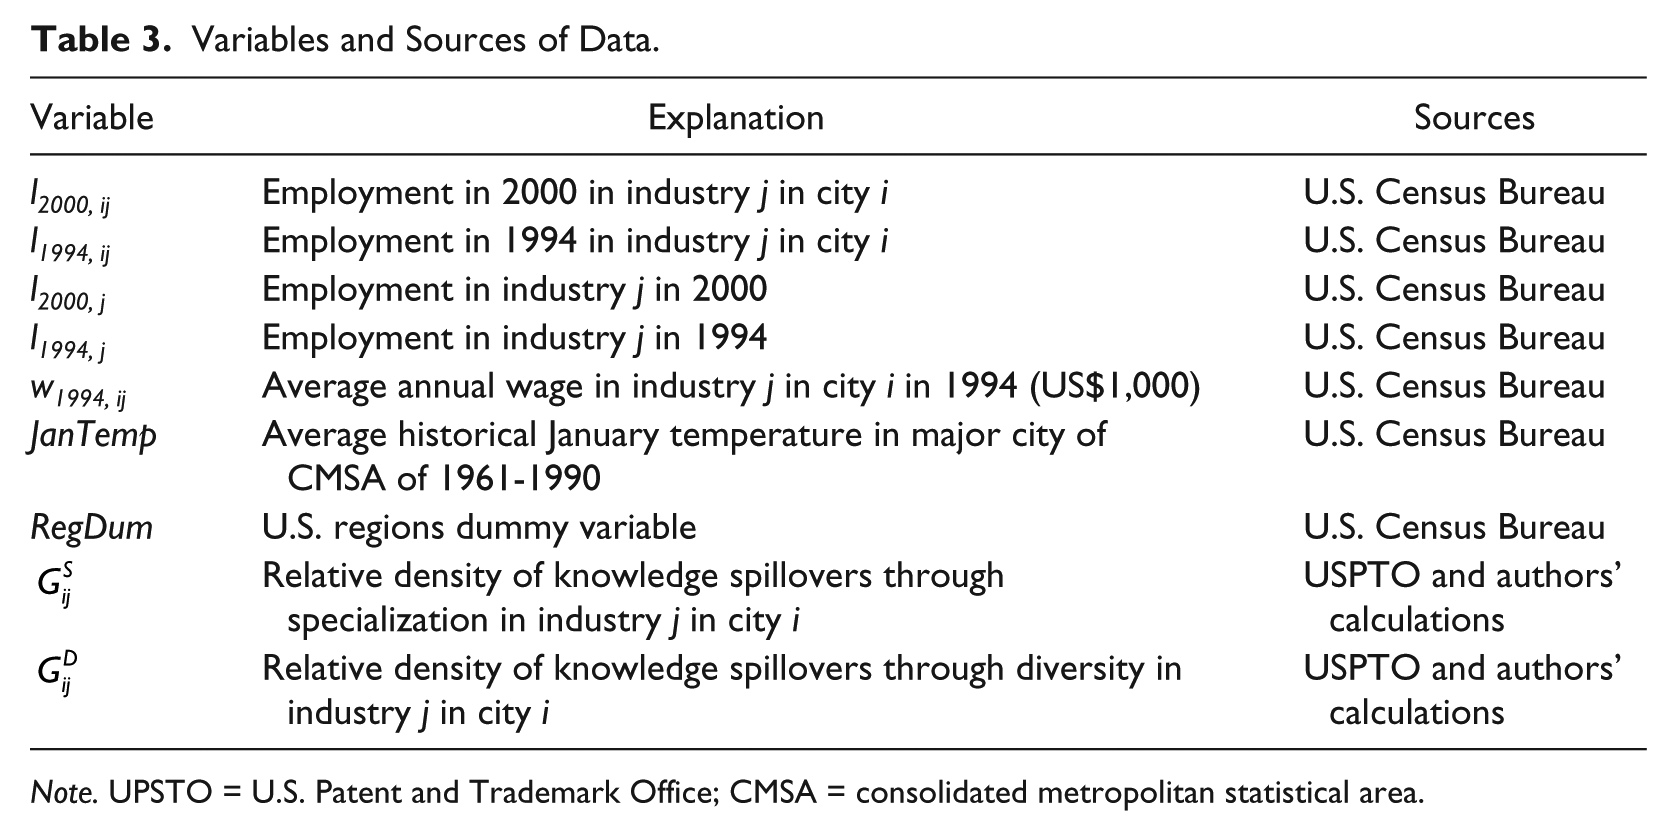
Note. UPSTO = U.S. Patent and Trademark Office; CMSA = consolidated metropolitan statistical area.
Summary Statistics.
Empirical Results
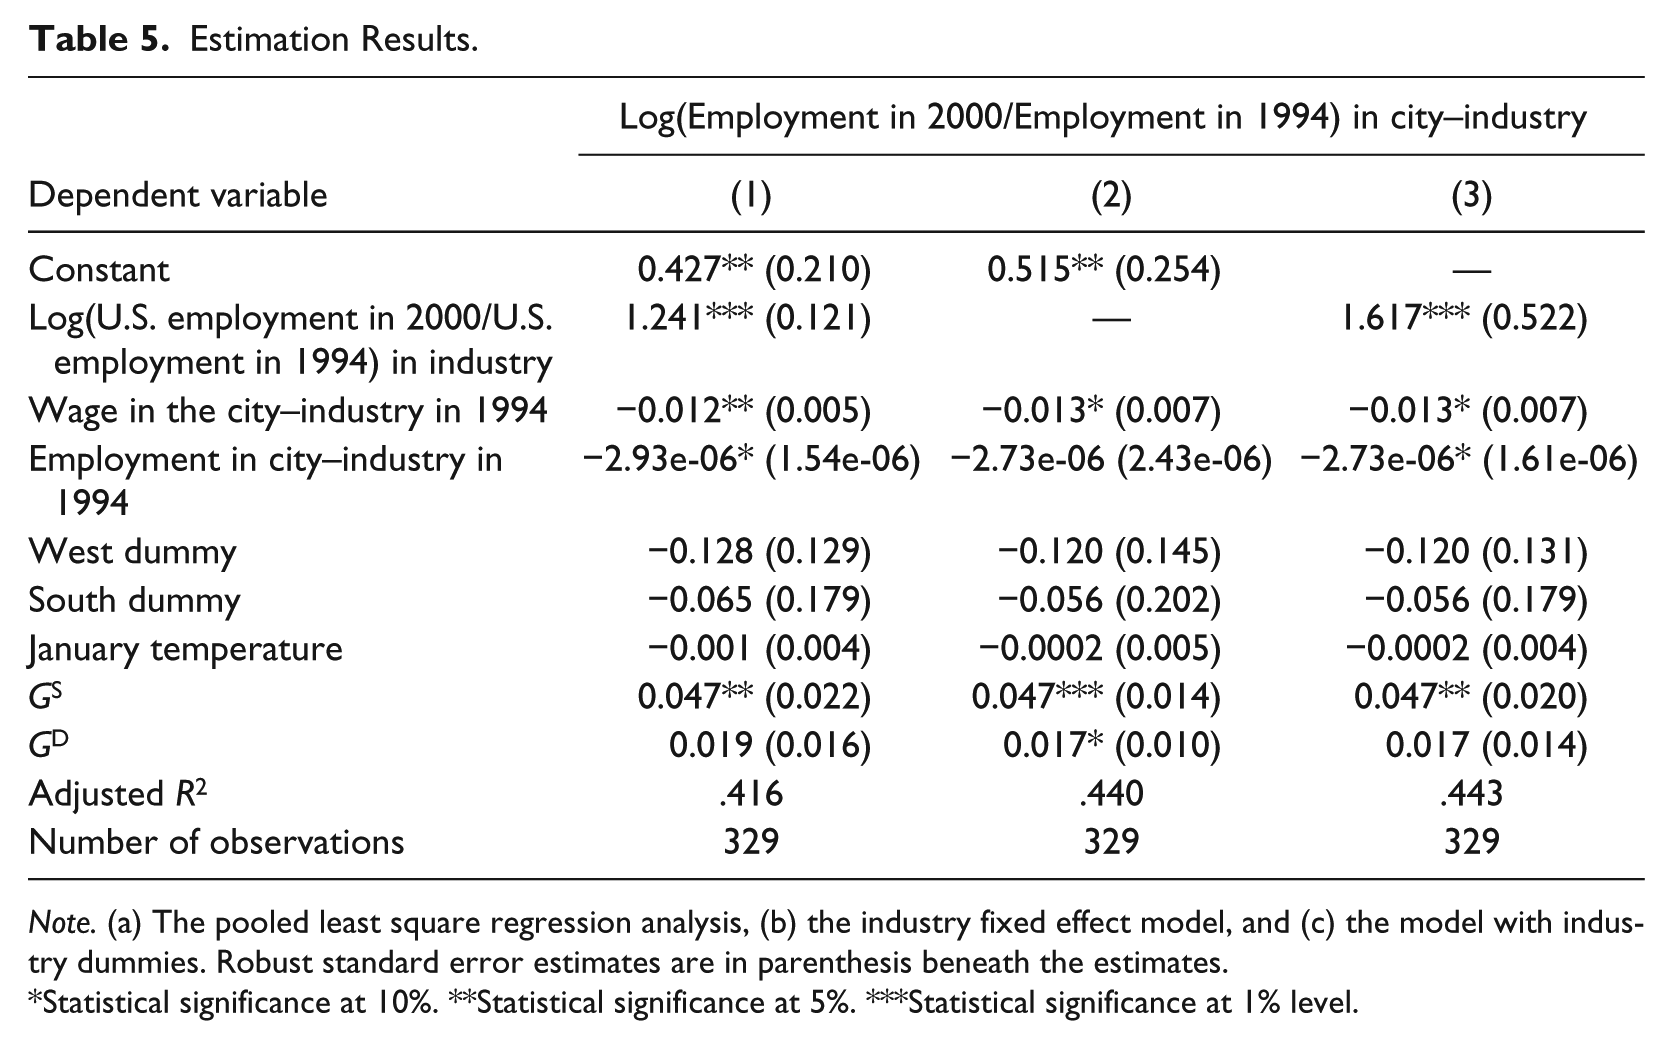
We use three specifications for our estimation. The first is a linear ordinary least squares model with no fixed effects for industries. The second is a linear model with industry fixed effects, for which the national industry growth rate in Equation 10 is dropped to avoid perfect multicollinearity. To test for the joint significance of industry effects, we conduct an F test and find the test statistic to be 25.37, and reject the null hypothesis of no industry fixed effects. Third, we estimate the regression with seven industry dummies but no constant. The results are similar across the three specifications, and are shown in Table 5.
Estimation Results.
Note. (a) The pooled least square regression analysis, (b) the industry fixed effect model, and (c) the model with industry dummies. Robust standard error estimates are in parenthesis beneath the estimates.
Statistical significance at 10%. **Statistical significance at 5%. ***Statistical significance at 1% level.
Most of the control variables have the expected sign and are statistically significant, though the regional dummies and the January temperature variable do not. A higher initial wage rate in a city–industry impedes subsequent employment growth in the industry. Growth in the national employment in an industry, which captures the shift in demand for a region’s output, is found to influence local industry employment growth positively, consistent with Glaeser et al. (1992). Moreover, the coefficient of national industry employment growth is greater than one, indicating that urban areas are affected more by factors shifting national industry employment growth than rural areas. A higher initial city–industry employment level leads to slower local employment growth later on, but this effect is statistically significant for the first and third models, but not for the industry fixed effects model. We find no statistically significant difference between the three regions—the Midwest, the South, and the West—in terms of the city–industry employment growth; also, the temperature in January does not seem to matter. Most of these findings are consistent with Glaeser et al. (1992).
Of more interest are our results concerning knowledge spillovers. In all three specifications, G S , our measure for local knowledge spillovers through specialization, helps boost local industrial employment growth. For a one standard deviation increase in GS (2.97), local industry employment grows by 14% over the 6-year period of our sample. The coefficients of G S are statistically significant across all three specifications, at either the 1% or 5% level. This is strong evidence in support of MAR spillovers. G D , knowledge spillovers from diversity, is also found to positively influence local industry employment growth. For a one standard deviation increase in G D (4.02), local industry employment increases by 6.8% over a 6-year period. However, the result is only significant at the 10% level for the industry fixed effects model and is not statistically significant in the other models, giving only weak evidence for Jacobs spillovers. In summary, the results show that knowledge spillovers from the same technology field help boost local growth, but spillovers across different technology fields do not. Therefore, industrial clusters that are tightly glued together by a specialized knowledge base have more potential for growth compared with those with a loosely defined common ground in technology.
Our results differ from those of Glaeser et al.’s (1992), who found evidence for Jacobs spillovers but not for MAR spillovers. In addition to using different (patent-based) measures of spillovers than Glaeser et al., our sample period 1994 to 2000 captures more of the medium-term changes in local industry employment than the long-term change captured in Glaeser et al.’s 30-year time period. With the rapid rate of current innovation, where new patents are typically “fresh” for only a few years, studying the medium-term effect of patent-based knowledge spillovers on the local industry employment growth not only makes sense but also forms a valuable complement to the existing literature that focuses on longer term horizons (Glaeser et al., 1992; Henderson, 2003; Zheng, 2010). Note also that Jaffe et al. (1993) found that the geographic localization of knowledge spillovers tends to fade over time. One plausible conclusion then is that, over a relatively short time period as in our study, the impact on local industry employment growth is stronger from spillovers from specialization than from spillovers from diversity. Over a longer time period as in Glaeser et al. (1992) though, the geographic localization of knowledge spillovers fades, the growth engine spreads out more among different locations, and, thus, knowledge spillovers from diversity become stronger.
Conclusion
In this article, we create unique measures for MAR and Jacobs knowledge spillovers based on patent citation data. We use these measures to test the Glaeser et al. (1992) model of local industry employment growth in 45 U.S. MSA/CMSAs for eight two-digit SIC industries over the period 1994 to 2000. Compared with previous measures in the literature, ours have the advantage of directly identifying knowledge flows rather than using ad hoc proxies for them.
We find strong evidence for MAR spillovers from specialization, but little for Jacobs spillovers from diversity, suggesting that regional specialization, not diversity, boosts local industry employment growth. Our results differ from Glaeser et al. (1992) who document evidence for Jacobs but not MAR spillovers. Taken together, our results and those of Glaeser et al. (1992) fit with the findings of Jaffe et al. (1993) that the geographic localization of knowledge spillovers fades over time. Our study indicates the need for careful measurement of local knowledge spillovers, which are treated in much of the literature as a black box. Given the conceptual importance tied to them, local knowledge spillovers require more rigorous analysis to identify what they are and how they work.
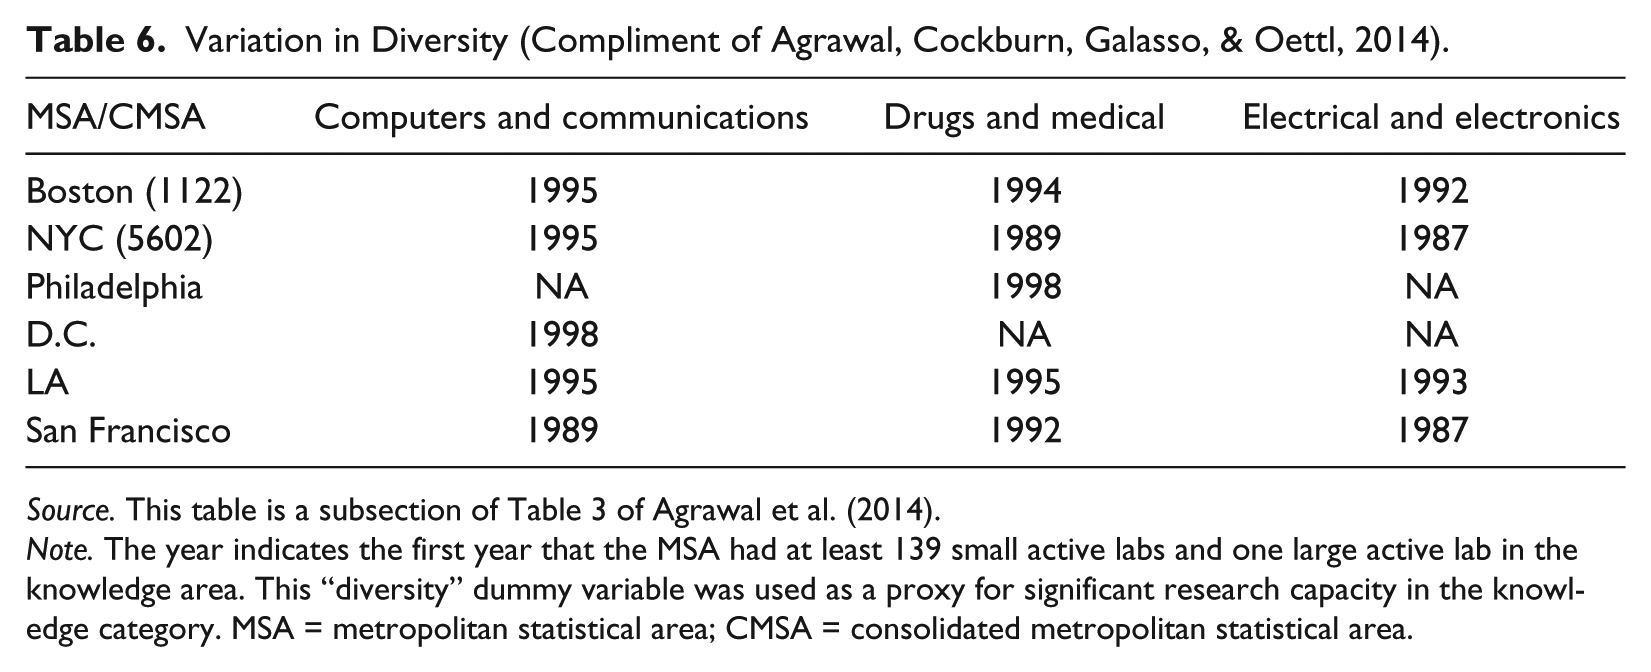
Some caveats remain. To what extent could the exclusion of certain East Coast MSAs/CMSAs affect our results? Agrawal, Cockburn, Galasso, and Oettl (2014) can shed some light on this question. Table 6 shows a subsection of Agrawal et al. (2014)’s Table 3. 10 Agrawal et al. (2014) use a dummy variable “diverse” to indicate the first year that an MSA/CMSA gained substantial research capacity in a certain knowledge area, defined as having at least one active large lab and 139 active small labs. As can be seen, Boston did not get significant research capacity in drug and medical products until 1994, and in C&C until 1995. Patents take on average about 3 years before approval by the USPTO, and can take considerably longer for innovations that are complex (see, for example, Popp, Juhl, & Johnson, 2004; Régibeau & Rockett, 2007). Such a time lag is particularly relevant for our chosen sectors, and indicates that our results should not be affected much because the patents used in our study were granted in 1994. Findings for the District of Columbia and Philadelphia in Agrawal et al. (2014) are also consistent with ours. These MSAs/CMSAs did not make it to our list of patent citation links and according to Agrawal et al. (2014), they did not gain significant research capacity in the relevant knowledge areas until as late as 1998. The exclusion of the New York MSA is more problematic, though, as the first sign of significant research capacity in D&M products appeared in 1989, and in E&E in 1987. Even with a significant patenting time lag, excluding the New York CMSA likely affects our results. However, as our main purpose is a case study to introduce a new measure of knowledge spillovers based on patent citation links, we believe that our message is successfully conveyed. It is our intention to pursue further research following this approach to investigate more comprehensively the effects of knowledge spillovers across the United States in all knowledge categories.
Variation in Diversity (Compliment of Agrawal, Cockburn, Galasso, & Oettl, 2014).
Source. This table is a subsection of Table 3 of Agrawal et al. (2014).
Note. The year indicates the first year that the MSA had at least 139 small active labs and one large active lab in the knowledge area. This “diversity” dummy variable was used as a proxy for significant research capacity in the knowledge category. MSA = metropolitan statistical area; CMSA = consolidated metropolitan statistical area.
Footnotes
Declaration of Conflicting Interests
The author(s) declared no potential conflicts of interest with respect to the research, authorship, and/or publication of this article.
Funding
The author(s) received no financial support for the research, authorship, and/or publication of this article.