
Abstract
We address the importance of emerging market economies for the global economy by testing for volatility spillovers between the United States and a number of emerging market economies. We use the methodology recently introduced by Diebold and Yilmaz and daily data, over the period from December 8, 2011, to March 21, 2018, on exchange-traded funds (ETFs), retrieved from Yahoo! Finance, for seven emerging market countries—China, Colombia, Greece, Mexico, Russia, South Africa, and South Korea. We find statistically significant volatility spillovers from emerging market economies to the United States, meaning that the growth prospects of emerging market economies are becoming extremely relevant for global economic growth.
Introduction
In the aftermath of the global financial crisis, there has been an increased focus on the role of emerging market economies in shaping global economic activity. Emerging market economies are those economies that have recently opened up to the flow of goods, services, and capital from the rest of the world. They are characterized as transitional economies, as they are in the process of moving from a closed economy to an open economy, and they vary in size from very big (such as, for example, China, India, Brazil, Russia, Mexico, Indonesia, and Turkey) to very small (such as, for example, Slovenia, Tunisia, and Vietnam).
According to the April 2017 International Monetary Fund (IMF) World Economic Outlook, emerging and developing economies, on average, accounted for 70% of global growth in output and consumption during 2000-2008. In the aftermath of the global financial crisis, with advanced economies experiencing a slow recovery, the contribution of emerging market and developing economies to global growth has been even higher, as can be seen in Figure 1, constructed using data from IMF’s World Economic Outlook database. Moreover, according to the 2016 IMF Global Financial Stability Report, changes in emerging market asset prices explain over a third of the volatility in global equity prices and exchange rates.
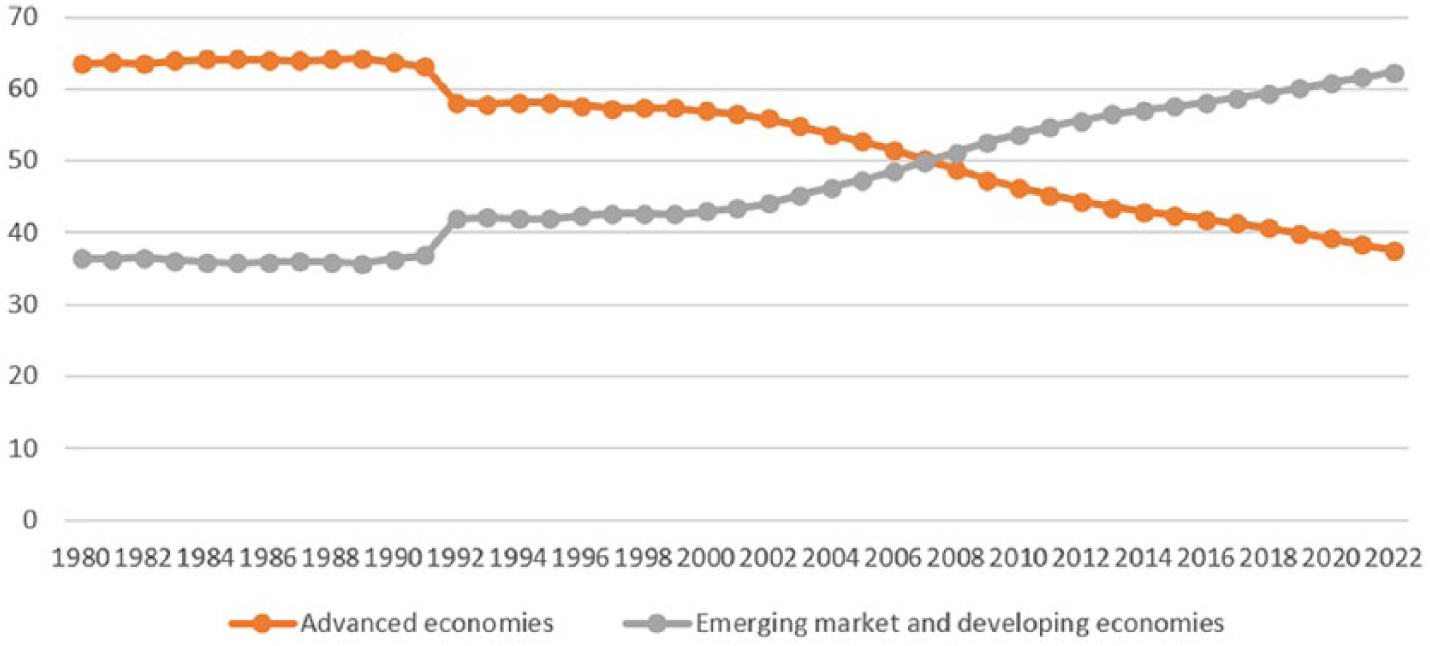
GDP based on PPP, share of world.
In a recent paper, Huidrom, Kose, Matsuoka, and Ohnsorge (2017) use a Bayesian vector autoregression model and provide estimates of growth spillovers from major emerging markets to other emerging and frontier markets and to advanced economies. They find sizable growth spillovers from the seven largest emerging market economies—China, India, Brazil, Russia, Mexico, Indonesia, and Turkey—which they label as EM7, akin to G7 (the Group of Seven major advanced economies)—to other emerging and frontier economies, but report modest and statistically insignificant growth spillovers from the EM7 to advanced economies.
In this article, we address the importance of emerging market economies for the global economy by testing for volatility spillovers between the United States and a number of emerging market economies. We use the United States as an indicator of the global economy, because as Kose, Lakatos, Ohnsorge, and Stocker (2017) put it,
developments in the U.S. economy, because of its size and international linkages, are bound to have substantial implications for the global economy. The United States is the world’s single largest economy (at market exchange rates), accounting for almost 22 percent of global output and over a third of stock market capitalization. It is prominent in virtually every global market, accounting for about one-tenth of global trade flows, one-fifth of global FDI stock, close to one-fifth of remittances, and one-fifth of global energy demand. (p. 1)
In testing for volatility spillovers between the United States and emerging market countries, we use daily data on exchange-traded funds (ETFs), over the period from December 8, 2011, to March 21, 2018. ETFs, first introduced in 1990, are formed when a basket of securities is purchased and a stock is created on this basket that is listed and traded on a stock exchange. They are indexed rather than actively managed and their value is based on the underlying net asset value of the securities held in the index basket.
In our investigation for volatility spillovers, we use the methodology recently introduced by Diebold and Yilmaz (2012), which is based on a generalized decomposition of variance for vector autoregressive systems. We find statistically significant volatility spillovers from emerging market economies to the United States, suggesting that the growth prospects of emerging market and developing economies are extremely relevant for global economic activity.
The rest of the article is organized as follows: In “Business Cycles in Emerging Market Economies” section, we discuss some business cycle facts in emerging market economies. In “The Data” section, we discuss the data and their properties. In “The Empirical Model” section, we briefly present the Diebold and Yilmaz’s (2012) methodology, and in “Empirical Evidence” section, the empirical results. The final section concludes the article.
Business Cycles in Emerging Market Economies
There are a number of structural features that differentiate emerging market economies from advanced economies. Those include procyclical monetary policy, procyclical capital flows, and procyclical fiscal policy.
In advanced economies, monetary policy has generally been countercyclical, in the sense that the central bank lowers interest rates and injects liquidity in the economy during a recession (when the output gap is negative), but increases interest rates and removes liquidity during an expansion (when the output gap is positive). In emerging market economies, however, other macroeconomic fundamentals, including financial sector development, speculative attacks on their currencies, and the credibility of monetary policy, have typically prevented the conduct of countercyclical monetary policy, exacerbating the negative effects of financial crises.
In the aftermath of the global financial crisis, however, there has been a shift in the conduct of monetary policy by emerging market economies, suggesting that monetary policy has evolved in these countries—see, for example, Frankel (2011) and Coulibaly (2012). In particular, during the global financial crisis, instead of tightening monetary policy to defend the value of their currencies and contain capital flight, central banks in emerging market economies loosened monetary policy considerably to cushion the effect of the global financial shock, in line with their counterparts in advanced economies.
In fact, a large number of emerging economies switched from exchange rate pegs to inflation targeting, following the success of inflation targeting in advanced economies, such as New Zealand, Canada, and the United Kingdom. Currently, there are 66 advanced, emerging, and developing economies around the world that target the inflation rate, and many other countries are moving toward this monetary policy framework.
Regarding the procyclicality of capital flows, according to intertemporal choice theory, countries should borrow during business cycle contractions, to smooth consumption and investment, and should repay their debts or accumulate net foreign assets during business cycle expansions. In reality, however, it does not work this way, and capital flows in emerging market (and developing) economies tend to be procyclical than countercyclical.
One interpretation of procyclical capital flows to transitional market and developing countries is that it results from the procyclicality of fiscal policy. In particular, when times are good, government receipts from taxes or royalties rise, and governments cannot resist the temptation or political pressure to increase spending and finance part of the deficit by borrowing from abroad. When times are bad, however, governments are forced to reduce spending, to repay some of the excessive debt they issued during the good times.
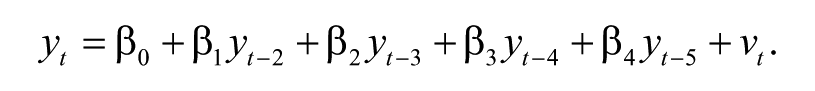
In recent years, however, there has also been a shift in fiscal policy in emerging market economies from being procyclical to being countercyclical. To provide some evidence on this, we use the Hamilton’s (2017) method for extracting cyclical components from time series, and present contemporaneous correlation coefficients between the cyclical component of government spending and that of real GDP.
In particular, with annual data, for a nonstationary time series,
The regression residuals,
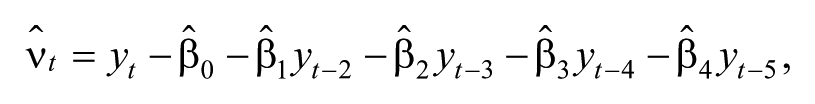
provide the cyclical component of the series. We can then investigate whether the cyclical component of government spending is correlated with the cyclical component of real GDP.
We report results for a group of countries (depending on data availability from the World Bank) in Panel A of Figure 2 (for the period before 2000) and in Panel B of Figure 2 (for the period after 2000). As can be seen, there is a shift from procyclical to countercyclical fiscal policy in emerging market economies.
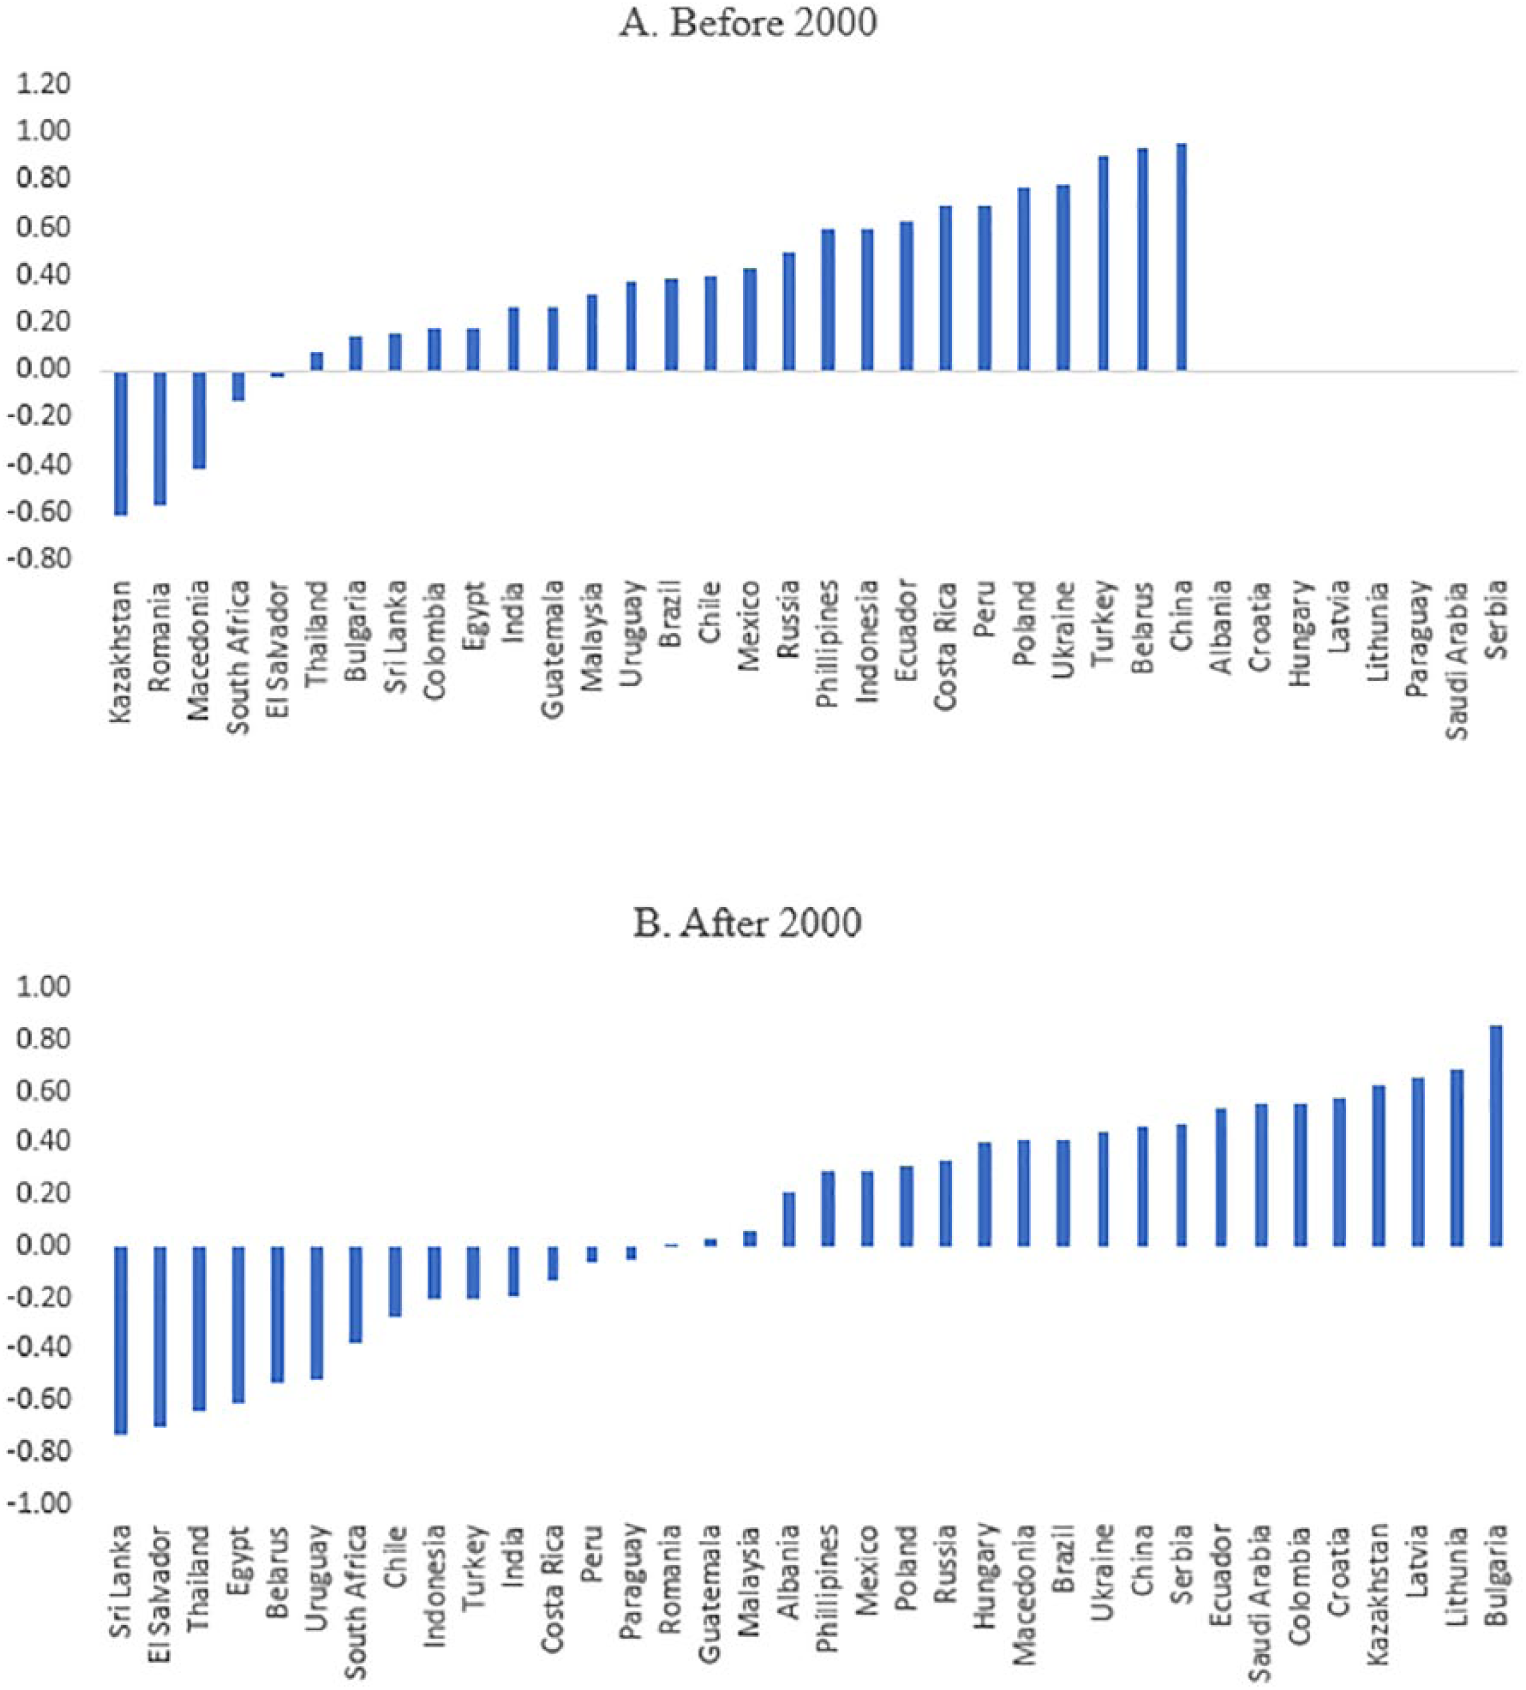
Cyclical behavior of government spending.
The Data
To investigate for volatility spillovers from emerging market economies to the United States, we use daily data, over the period from December 8, 2011, to March 21, 2018 (a total of 1,580 observations), on ETFs, retrieved from Yahoo! Finance, for seven emerging markets—China, Colombia, Greece, Mexico, Russia, South Africa, and South Korea.
For China, we use iShares China Large-Cap ETF (FXI); for Colombia, we use Global X MSCI Colombia ETF (GXG); for Greece, we use Global X MSCI Greece ETF (GREK); for Mexico, we use iShares MSCI Mexico Capped ETF (EWW); for Russia, we use Direxion Daily Russia Bear 3X ETF (RUSS); for South Africa, we use iShares MSCI South Africa ETF (EZA); for South Korea, we use iShares MSCI South Korea Capped ETF (EWY); and for the United States, we use iShares Dow Jones U.S. ETF (IYY).
We also use data on ETFs based on a collection of countries. In particular, we use the ETFs iShares MSCI BRIC ETF, the Direxion Daily MSCI Emerging Markets Bull 3X ETF (EDC), the iShares MSCI Emerging Markets ETF (EEM), the First Trust Emerging Markets AlphaDEX ETF (FEM), and the Vanguard FTSE Emerging Markets ETF (VWO).
All the series, except for First Trust Emerging Markets AlphaDEX ETF (NasdaqGM Real Time Price, Currency in US$) and Vanguard FTSE Emerging Markets ETF (Nasdaq Real Time Price, Currency in US$), are in NYSEArca Delayed price in US$, and we use closing prices in our estimation.
We conduct a battery of unit root and stationary tests in the natural logs of the series. In particular, we use the augmented Dickey–Fuller (ADF) test (see Dickey & Fuller, 1981) and the Dickey–Fuller generalized least squares (DF-GLS) test (see Elliot, Rothenberg, & Stock, 1996), assuming both a constant and trend, to determine whether the series have a unit root. The optimal lag length is taken to be the order selected by the Akaike information criterion (AIC) —see Pantula, Gonzalez-Farias, and Fuller (1994) for details regarding the advantages of this rule for choosing the number of augmenting lags. Moreover, given that unit root tests have low power against trend stationary alternatives, we also use the KPSS test (see Kwiatkowski, Phillips, Schmidt, & Shin, 1992) to test the null hypothesis of stationarity. Our results (not reported here) indicate that the logged series are nonstationary, or integrated of order one,
The Empirical Model
We follow Diebold and Yilmaz (2012) and use a generalized vector autoregressions (VAR) framework to investigate directional spillovers from emerging market economies to the U.S. ETFs market. In the general case with

where

where the

with
As in Diebold and Yilmaz (2012), we use variance decompositions which allow us to assess the fraction of the H-step-ahead error variance in forecasting
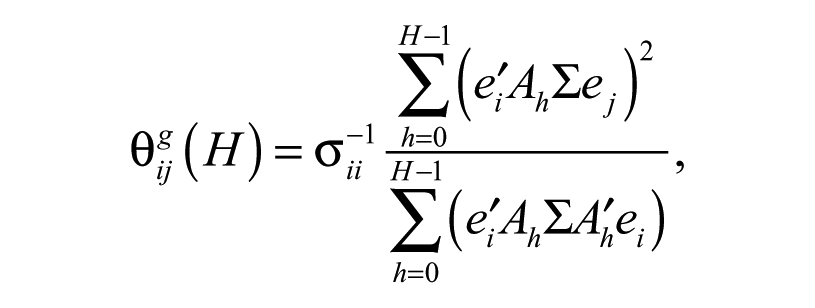
where

so that
Next, we construct the total volatility spillover index, measuring the contribution of spillovers of volatility shocks across all markets, as

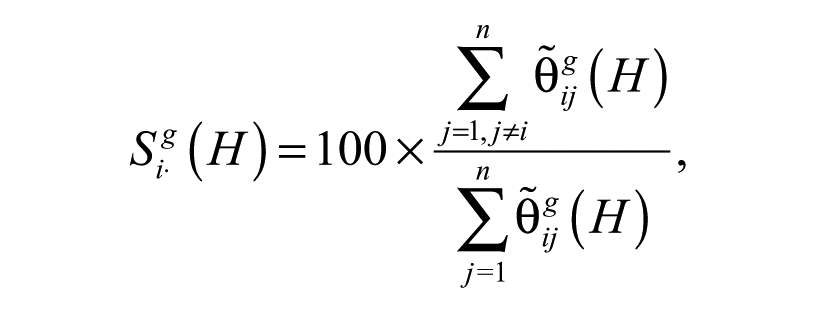
and measure the directional volatility spillovers received by market
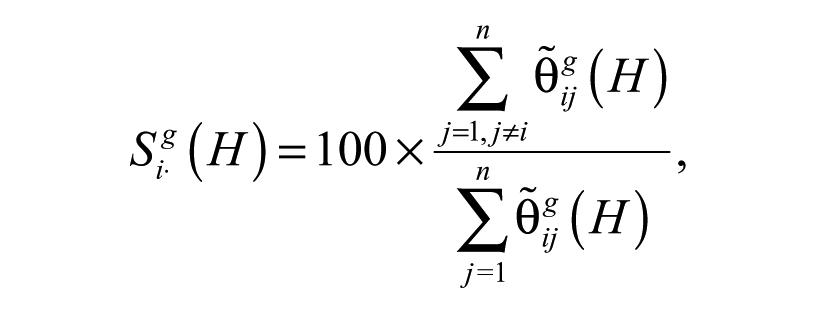
and those transmitted by market
Finally, the net volatility spillover from market

Empirical Evidence
We begin by conducting bivariate Granger causality tests between the United States and each of the seven emerging market economies. We use the first differences of the logarithms of the variables, optimally choose the lag length in the regression equation using the sequential modified likelihood ratio criterion, and report the results in Panel A of Table 1. We find unidirectional Granger causality from Greece and Russia to the United States; bidirectional Granger causality in the cases of China, Mexico, and South Korea; and unidirectional Granger causality from the United States to Colombia and South Africa. We also use the ETFs based on collections of emerging market economies—BRIC, EDC, EEM, FEM, and VWO—and report the results in Panel B of Table 1, in the same fashion as those in Panel A. As can be seen, in all five cases, we find strong bidirectional Granger causality.
VAR Granger Causality/Block Exogeneity Wald Tests.
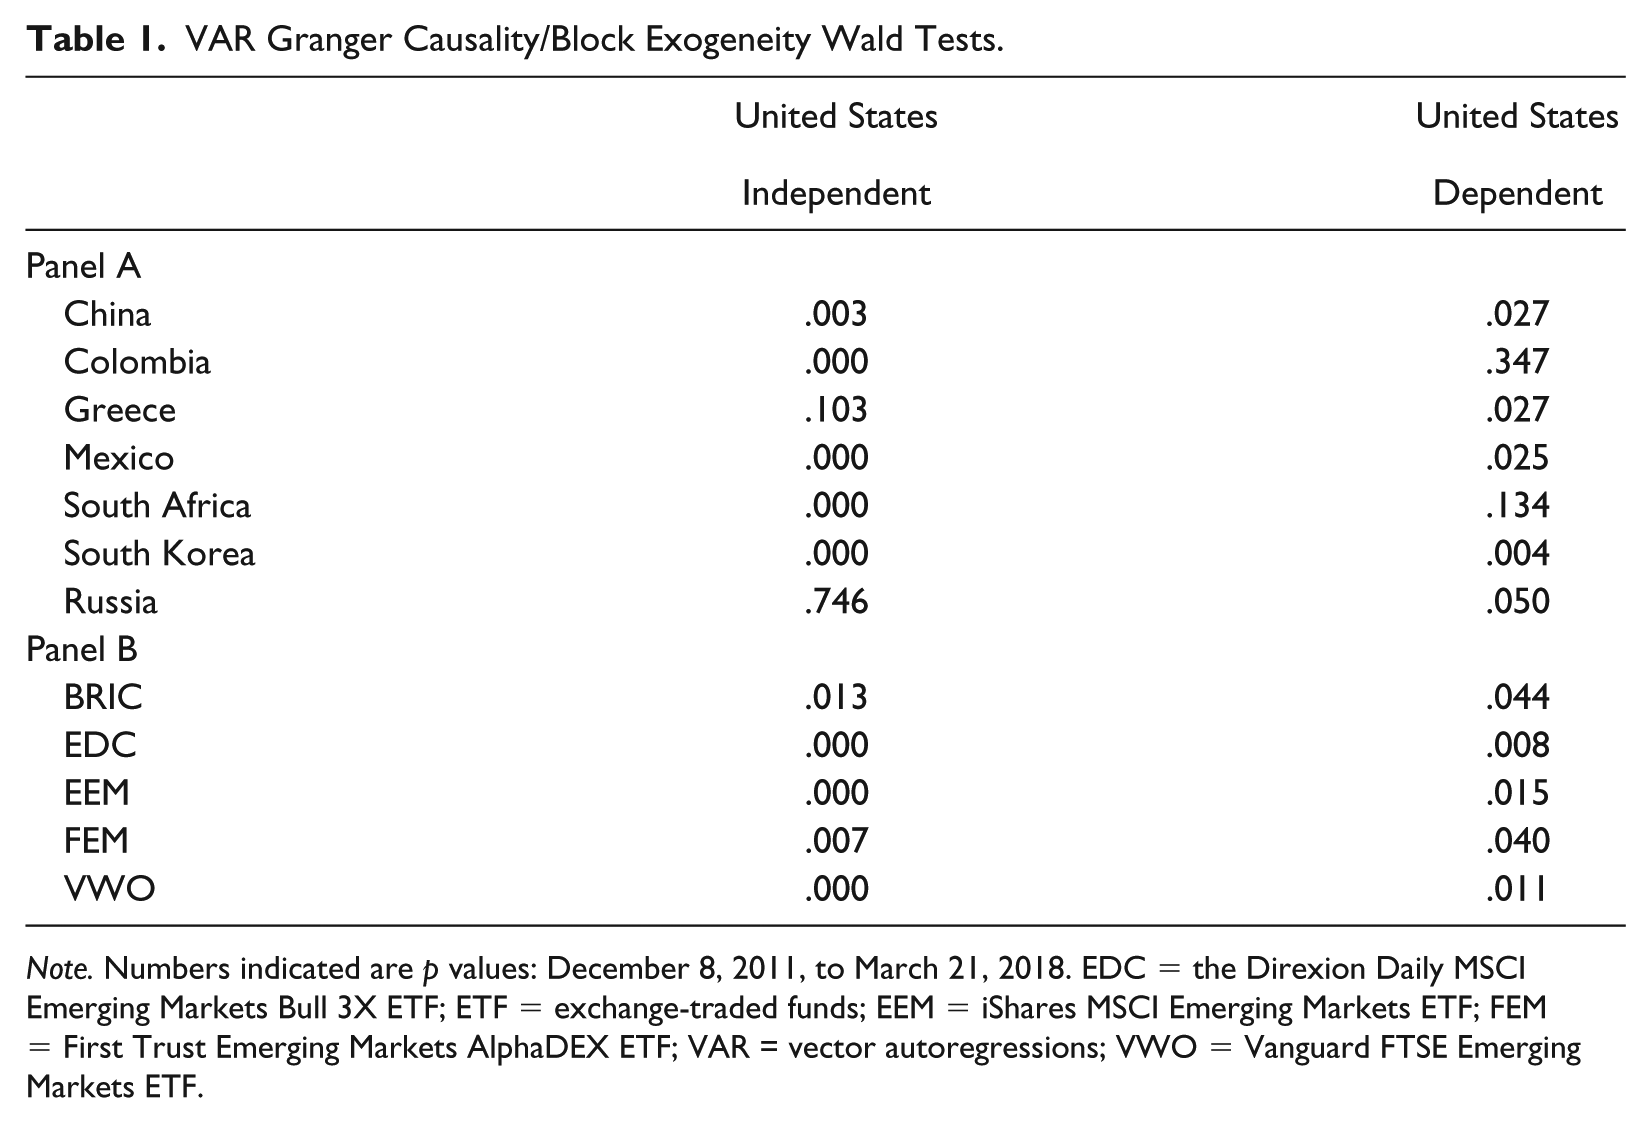
Note. Numbers indicated are p values: December 8, 2011, to March 21, 2018. EDC = the Direxion Daily MSCI Emerging Markets Bull 3X ETF; ETF = exchange-traded funds; EEM = iShares MSCI Emerging Markets ETF; FEM = First Trust Emerging Markets AlphaDEX ETF; VAR = vector autoregressions; VWO = Vanguard FTSE Emerging Markets ETF.
Next, we test for volatility spillovers between the United States and each of the emerging market countries, using the Diebold and Yilmaz (2012) methodology and a VAR lag length of 4. The results are reported in Table 2, with associated asymptotic p values, for bivariate relationships between the United States and each of the other countries. For the ETFs based on individual emerging market economies (see Panel A of Table 2), we find statistically significant volatility spillover effects from the United States to each of the other countries except for Russia, consistent with our Granger causality analysis. We also find statistically significant volatility spillovers at the 5% level from Greece to the United States, and at the 10% level from each of China, Mexico, Russia, and South Korea to the United States. Regarding the ETFs based on collections of countries, as can be seen in Panel B of Table 2, we find statistically significant volatility spillovers from the U.S. Dow Jones ETF series to each of EDC, EEM, FEM, and VWO, but not to BRIC. We also find statistically significant volatility spillovers from each of the five composite emerging economies-based ETFs to the U.S. Dow Jones ETF.
Bidirectional Volatility Spillovers Between Emerging Markets and the United States.
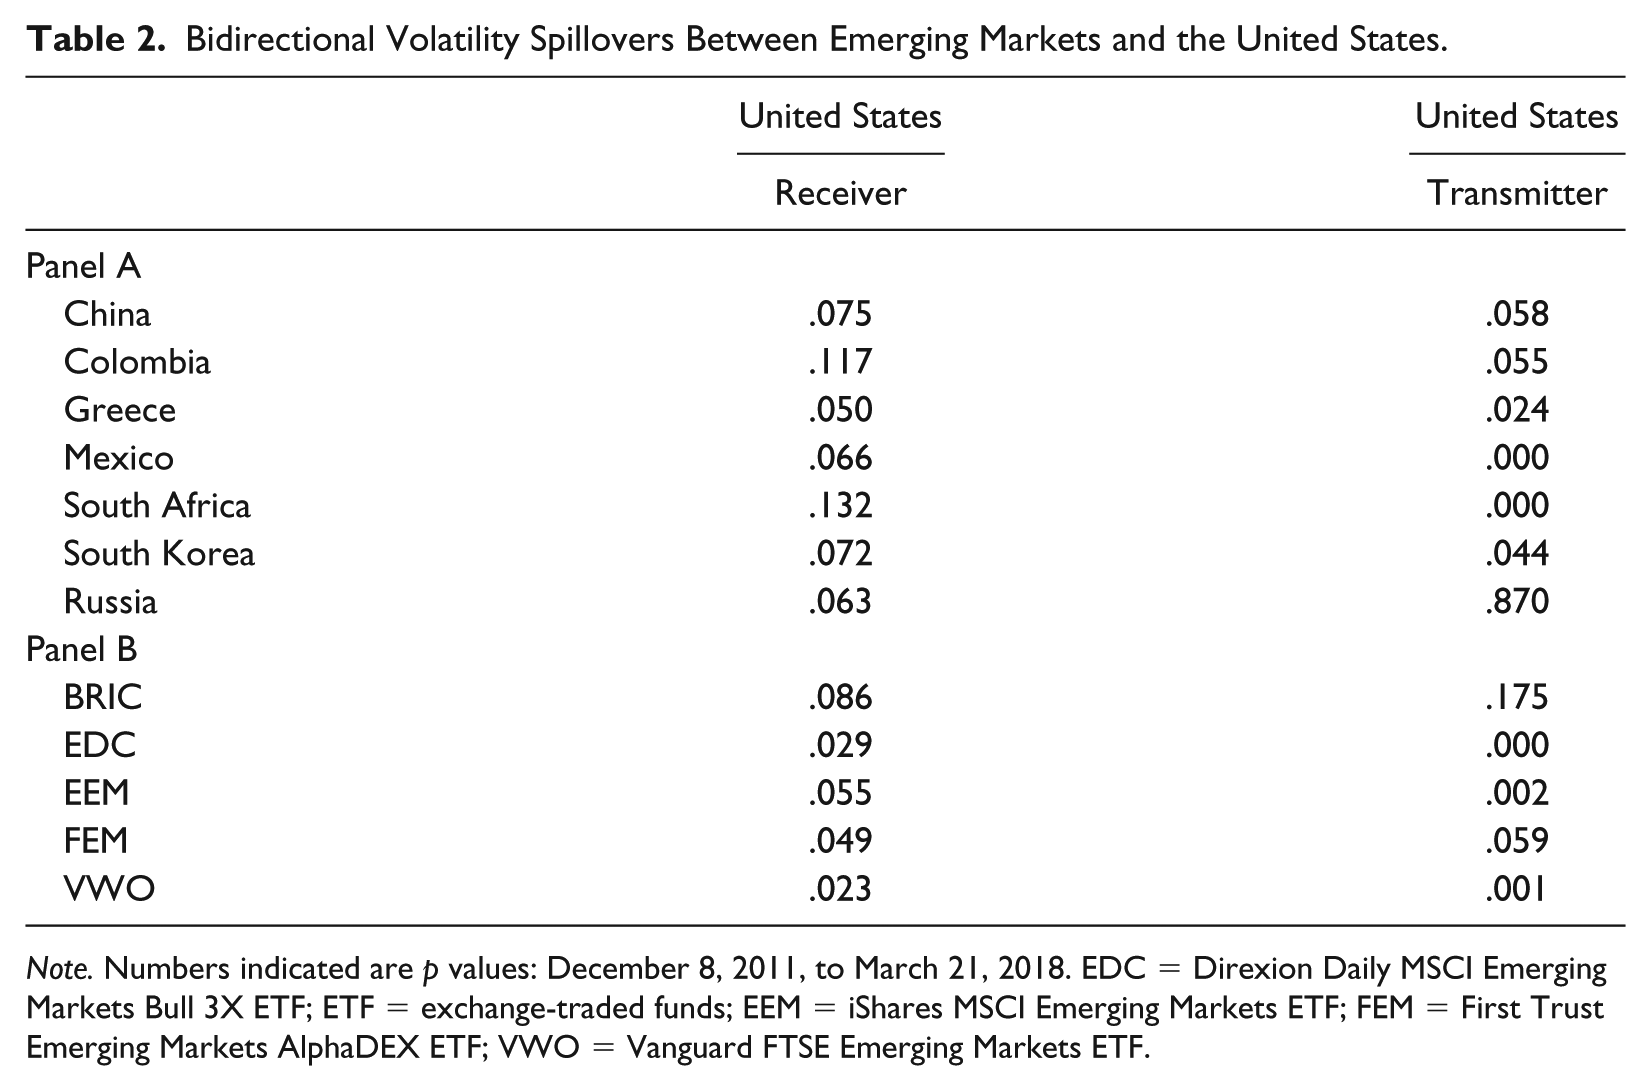
Note. Numbers indicated are p values: December 8, 2011, to March 21, 2018. EDC = Direxion Daily MSCI Emerging Markets Bull 3X ETF; ETF = exchange-traded funds; EEM = iShares MSCI Emerging Markets ETF; FEM = First Trust Emerging Markets AlphaDEX ETF; VWO = Vanguard FTSE Emerging Markets ETF.
In Figure 3, we show net pairwise volatility spillovers. As can be seen, there are high volatility spillovers from China, Greece, Mexico, Russia, and South Korea to the United States. We can also see high volatility spillovers from five composite emerging economies-based ETFs to the United States. These results are robust to different VAR lag length and forecast horizon specifications.
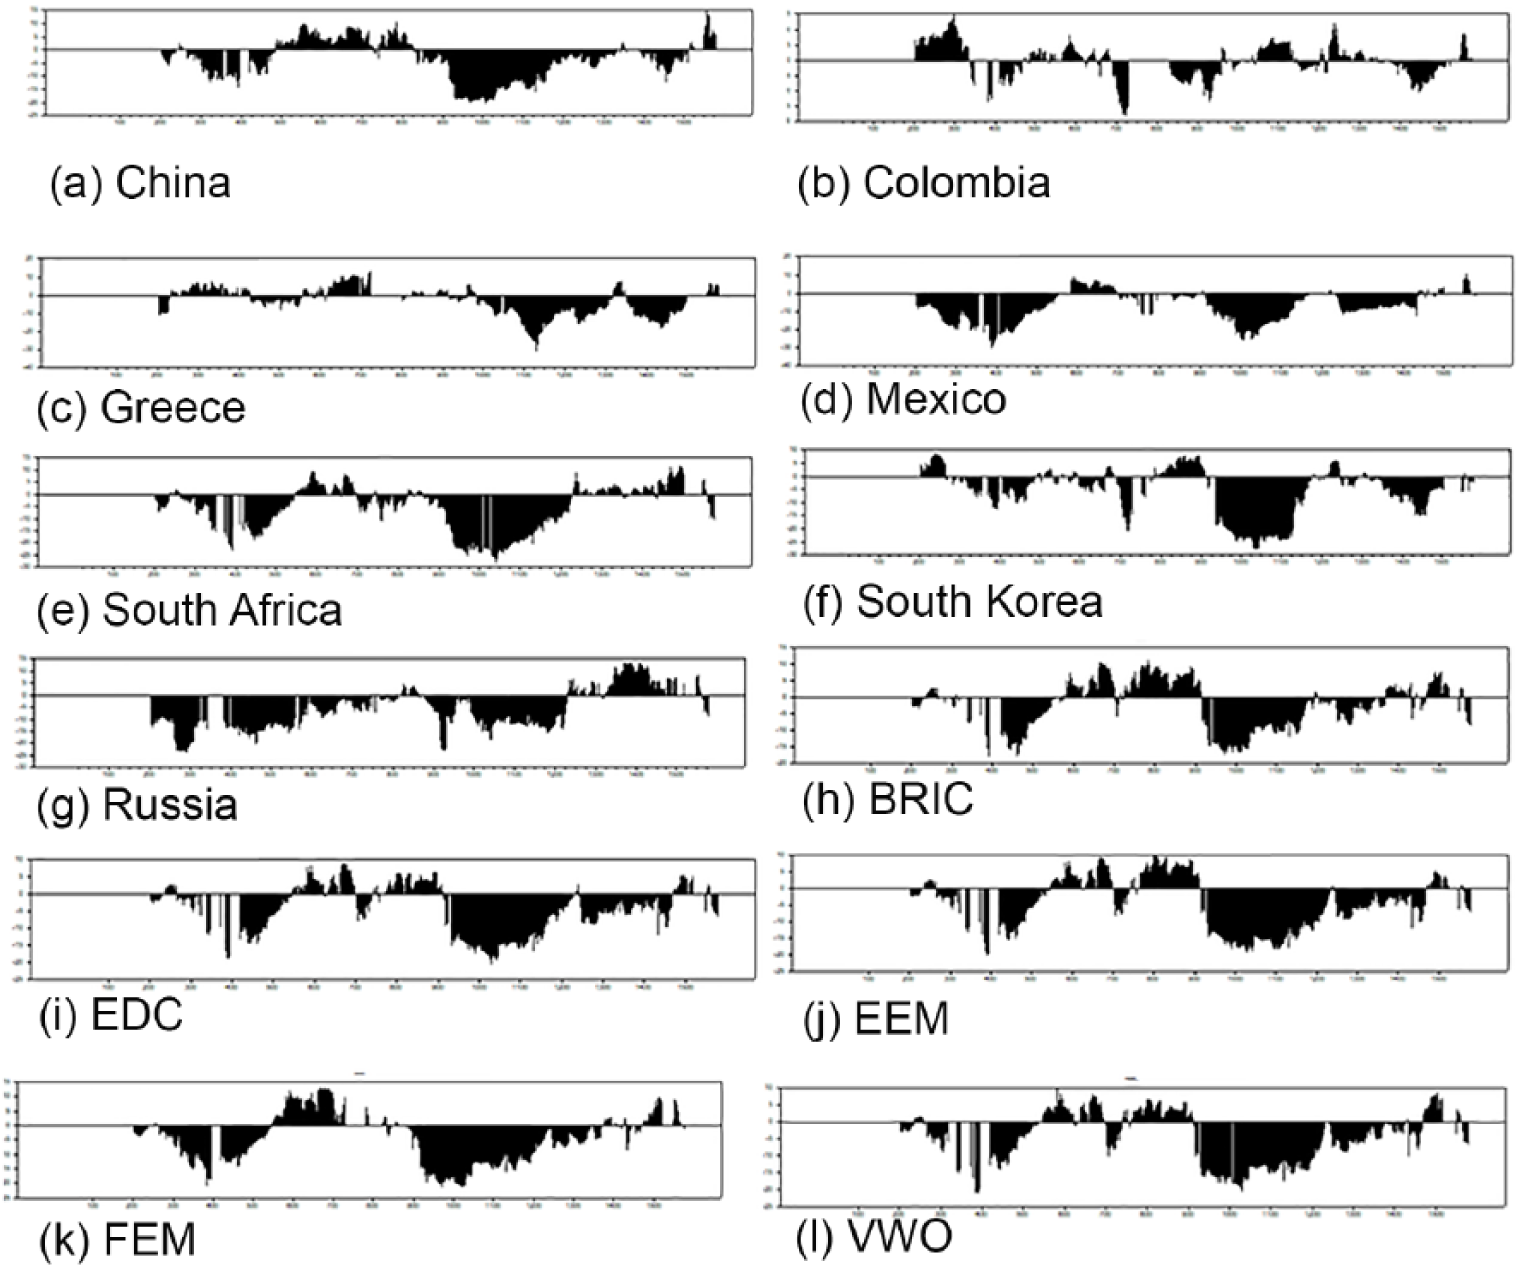
Net pairwise volatility spillovers.
Conclusion
We use daily data on ETFs, and the Diebold and Yilmaz’s (2012) methodology, to address the importance of emerging market economies for the global economy. In particular, we test for volatility spillovers between the United States and seven emerging market countries—China, Colombia, Greece, Mexico, Russia, South Africa, and South Korea. We find statistically significant volatility spillovers from emerging market economies to the United States, and conclude that the growth prospects of emerging market economies are becoming extremely relevant for global economic growth.
Footnotes
Acknowledgements
The authors would like to thank an anonymous referee and Bruno Sergi for comments that greatly improved the article.
Declaration of Conflicting Interests
The authors declared no potential conflicts of interest with respect to the research, authorship, and/or publication of this article.
Funding
The authors received no financial support for the research, authorship, and/or publication of this article.