
Abstract
Do faculty who teach more produce less research? We revisit this question with a better measure of research productivity, eschewing simple publication counts in favor of the impact of research measured by Google citations. Using original data, we pose this question in the broader context of other determinants of scholarly productivity. We find that heavier teaching crowds out research. Furthermore, faculty with more teaching duties tend to protect the quantity of their research more than the quality. We also find that faculty rank, promotion, experience, gender, the ability to win grants, and the ranking of the resident school are significant predictors of faculty research output.
Introduction
Does teaching get in the way of research? It has long been argued (e.g., K. J. Fox & Milbourne, 1999; Hesli & Lee, 2011; Maske et al., 2003; Snowball & Shackleton, 2018) that faculty with more teaching responsibilities are inhibited in their research pursuits. In contrast, some have suggested (Faia, 1976; Marsh & Hattie, 2002) that teaching is complementary to research, arguing that it can help discover scholarly gaps. In this article, we look for empirical evidence of the effect of teaching on research in a broader context of other determinants.
According to Snowball and Shackleton (2018), “there is surprisingly little research on the determinants of research productivity amongst academics employed in the higher education sector” (p. 119). Our study is intended to fill this gap, and it is distinguished from the related works 1 by the way we quantify faculty research output. M. F. Fox and Mohapatra (2007) note that most studies use the number of publications to measure research output and “do not take into account the ‘impact’ of the research, often accessed with citations” (p. 548). This is surprising as scholarly works, including those that pass rigorous peer review, vary greatly in length, complexity, amount and originality of data, technical accuracy, implications, and the overall impact within the field. We argue that a simple count of publications is an inadequate measure of both research output and the amount of effort expended in production of research. For this reason, we focus on scholarly impact as the only practical and quantifiable alternative to the number of publications. Using Google citation counts, we are able to attain a better gauge of the amount of research produced by faculty and how their research is impacted by the quantity of teaching. To our knowledge, this is the first study to do so in the context of the determinants of research output.
In view of some limitations of our data set, which are discussed below, the nature of our study is more exploratory rather than definitive. However, both the magnitude of the effects and their statistical significance indicate that our findings are substantial in contributing to a better understanding of the determinants of production of research by university faculty.
Variables and Data
This study is based on original data, collected primarily from curricula vitae (CV) of 575 tenure-track faculty in 105 psychology 2 departments in PhD-granting institutions in the United States, archived data from university course listings, and citation records from Google Scholar. 3
We quantify research output, our dependent variable, in two alternative ways: using the traditional measure based on the number of publications and an assessment of scholarly production based on the impact of published works. Our first dependent variable, Number of Publications, is taken as a simple count, that is, the sum, of all peer-reviewed journal articles produced by a faculty member in our sample during the period of 3 years between 2009 and 2011. The rationale for this time period is provided below.
Our alternative dependent variable, 5-Year Impact, is built by counting the number of citations accumulated by each faculty member over a period of 5 years following the publication of their work in peer-reviewed academic journals in the 3 years between 2009 and 2011.
Measuring research over 3 years is done to alleviate annual fluctuations in academic output. It is well known that both production and publication of research are a nonuniform process. Peer reviewed publications are subject to a variety of delays, from availability of data, to unexpected analytical, methodological or technical difficulties, to long lags in the editorial review. Therefore, the 3-year time period is used to smooth out the unevenness in our dependent variables. The 5-year post-publication period, used in the counting of the number of citations, is set to allow for adequate time for the publications to propagate in the literature. Citations do not appear immediately after a work is published; it takes time for the work to be discovered, appreciated, and used in subsequent works, which themselves need time to appear in print. The years between 2009 and 2011 were chosen because at the time of data collection (spring of 2017), 2011 was the latest year to allow for a 5-year lag.
In addition, our dependent variables are limited to only peer-reviewed academic journal articles and do not include books, textbooks, conference proceedings, unpublished monographs, study guides, and other non-refereed works. Each journal article was examined in Google Scholar to determine the number of citations attributed to it, starting with the year it was published and going until the fifth year after publication. Our regressand measured in this way captures not only the quantity of scholarly output but also its impact, often taken as an indicator of quality—an important dimension 4 that is missed in other studies.
Our key independent variable of interest, Teaching Load, is measured as the average number of courses taught per year. Some faculty listed the number of courses they taught every year on their CV. However, most of these data were gathered from detailed school archives.
Faculty CV were our main source of data (complemented with other sources, when data were missing) for the majority of the other important factors deemed to affect research productiveness. Faculty members going up for promotion and tenure naturally tend to step up their research output. Our variable that captures a change in academic rank is Promotion in 2009–2011. However, not only the anticipated ascension in rank is important but also the academic rank itself (i.e., assistant, associate, or full professor) can have a significant impact on the amount of research output. Feldman (1987), for example, finds that faculty in more senior academic ranks tend to produce more research, although he finds this positive relationship to be “generally weak” (p. 254). Furthermore, we include a dummy variable for faculty who had tenure by 2011, as it may have two competing effects on research: a drop in research activity thanks to job security after reaching tenure 5 and a sustained productiveness due to selection.
Experience or time in academia, measured as the number of years since receiving the terminal degree (PhD in this study), is likely to matter, as faculty grow their expertise in specific areas, develop technical finesse, grow professional ties, or take on administrative responsibilities. It is also possible that the effect of time in academia is nonlinear and may resemble a parabola. We account for this possibility too by including the square of experience (Diamond, 1986; Hall et al., 2007; S. M. Oster & Hamermesh, 1986).
Production of other scholarly work, such as books, book chapters, and textbooks, was included as well, as they can be expected to crowd out the production of journal articles, or, in some cases, be complementary to it. Research grants are likely to have a strong positive effect, as most grants culminate in published papers. Our figures on Grants are based on total dollar values of grants received during 2009–2011, as reported on faculty CVs, and divided by US$1,000 for a more convenient scaling. 6
Because schools differ in research reputation, we also allowed for the possibility that current school affiliation and faculty’s alma mater (where they have received their PhD) is consequential. Prestige of a faculty member’s resident department has been a significant factor in previous work (Blackburn et al., 1978; Porter & Toutkoushian, 2006). Prestige of the current affiliation and alma mater can also have a strong impact on a scholar’s intrinsic drive to be productive, not only because of selection, but also thanks to a catalytic, or possibly competitive, departmental culture. Data on the rankings of current and degree-granting schools were obtained from the National Research Council’s (NRC) 2010 report. A related factor, the size of the current department, was also included to account for the possibility that larger departments tend to have more resources for supporting research, are in a better position to attract top scholars, and have more graduate students who can assist with both teaching and research (Golden & Carstensen, 1992; Jordan et al., 1988; Kyvik, 1995).
We have also included a dummy variable to distinguish between public and private schools. Maske et al. (2003) note that public schools can be expected to produce more research because, as they note, many private schools tend to be smaller teaching colleges with less resources available for research. They also find significant differences in research output between men and women, even after controlling for experience and school ranking. Xie and Shauman (1998) offer a set of explanations for the inter-gender productivity gap and note that the gap has shrunk considerably over the past several decades. Thus, we include a binary variable to control for gender differences. Table 1 provides summary statistics of our data.
Summary Statistics.
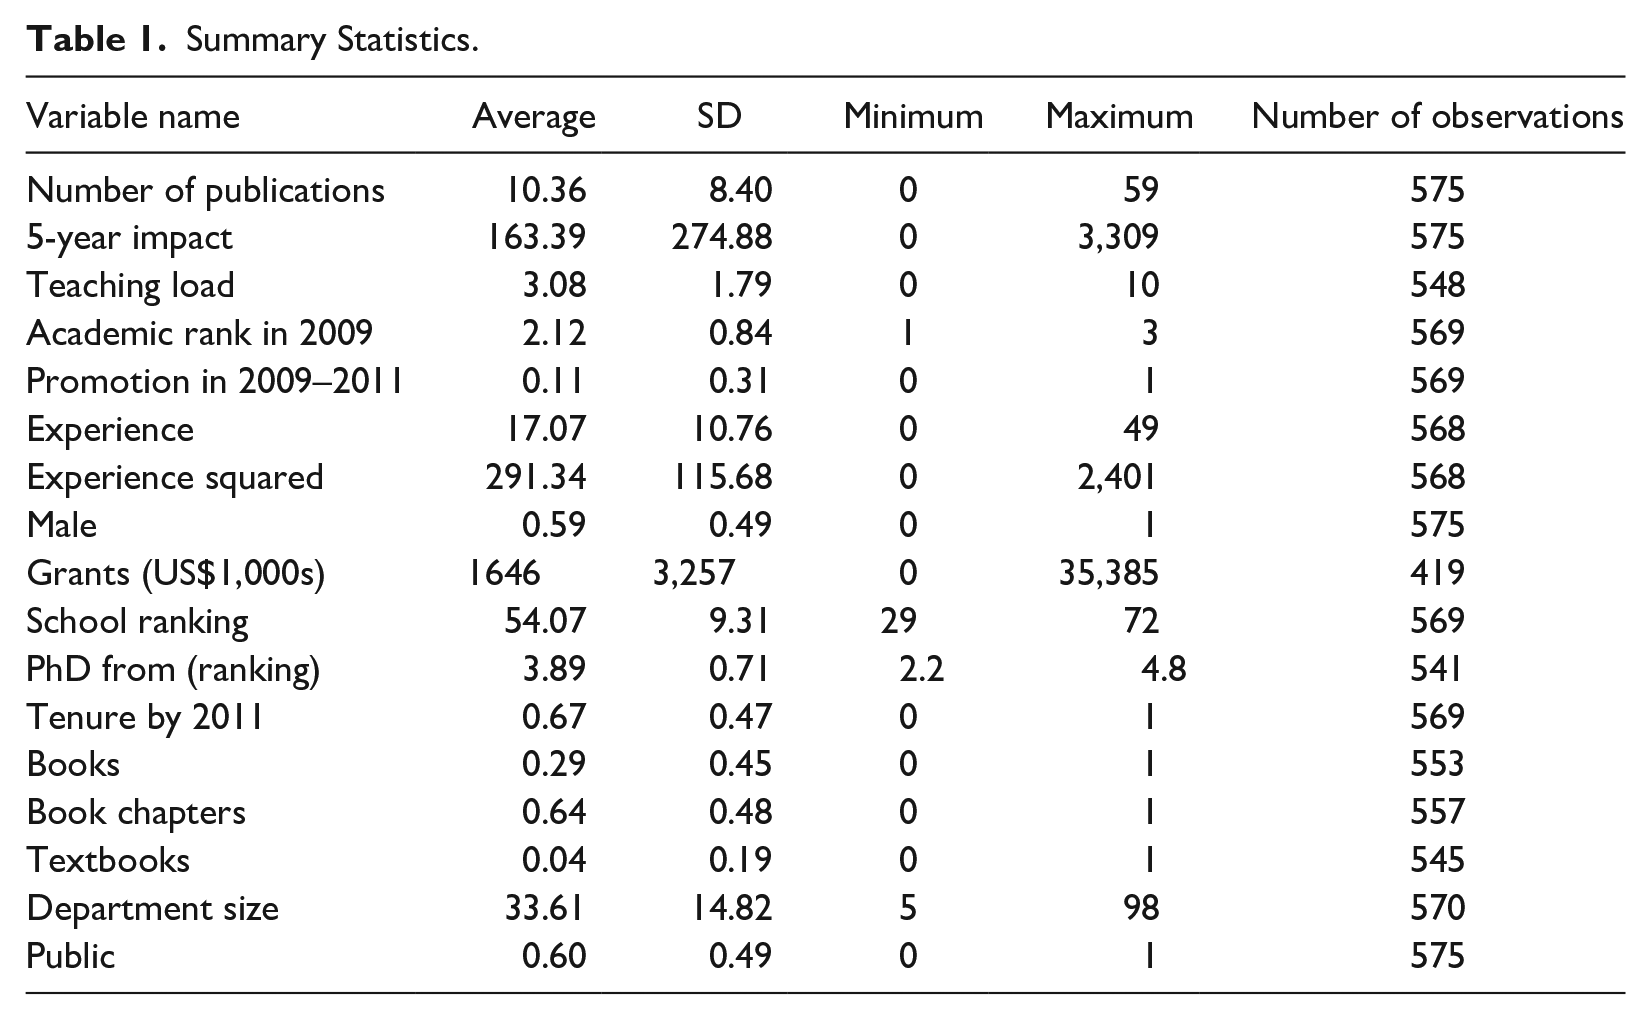
It should be noted that a number of factors could not be considered in our analysis because of the limitations of our data set. For example, we had no access to some important individual-level variables like creativity, work ethic, family duties, and health condition. 7 We also did not collect data on institution-level variables like class sizes, school funding, departmental collegiality, and the availability of teaching assistants. Furthermore, we chose to limit our sample to only the schools included in the NRC rankings because faculty CVs in unranked schools are posted online with far less consistency and are updated less frequently. The reliance on CVs as the main source of data may give rise to a selection bias because faculty with meager research have little incentive to showcase their CVs on departmental websites; although, in our sample fully 10% had two publications or less in the 3-year period. We also excluded nontenure track faculty and we ignored the service part of the academic triad. 8 Finally, our data on grants were based solely on self-reported figures in faculty CVs and may not capture the joint or multiyear nature of some of the awards and the prestige of the funding source.
Some variables in our data set included a small number of missing observations, with the exception of the variable Grants, where approximately one quarter of values were not available. Empiricists usually address the problem of missing observations by either using indicator variables, discarding data, re-weighting complete cases, or calculating available-case means. Little (1992) provides a comprehensive overview of statistical approaches for dealing with missing data, enumerates the (often significant) disadvantages of each approach, and singles out multiple imputation (MI), proposed by Rubin (1978), as one of the most preferable methods. Schafer and Olsen (1998) note that “unlike the ad-hoc methods, . . . MI solves the missing-data problem in a principled and statistically defensible manner” (p. 570). MI allows reconstruction of a complete data set by a process of substituting missing values with predicted values obtained from multiple rounds of auxiliary regressions, in which related variables are used as predictors. According to Wayman (2003), besides providing unbiased point estimates of missing values, MI allows restoration of the underlying distribution of a variable with missing data. Our multiple imputed data were obtained by estimating 10 rounds of linear, truncated linear, and chained logit regressions, where appropriate.
Before going on to discussing our regression results, we offer an at-a-glance summary of findings in previous works, so that the reader can quickly compare the results in this article to those in the related empirical literature. Table 2 provides a summary of the factors that were found to influence faculty research output in previous studies.
Summary of the Determinants of Research Output in Existing Empirical Literature.

Results and Discussion
As noted above, nearly all existing empirical studies use the number of publications as the dependent variable in regressions on the determinants of production of research by university faculty. We begin our analysis with a baseline model using the same “naïve” measure of research output, to see how evidence in our data compares with the findings in the existing literature. Our regressions are estimated with the least squares method with robust standard errors clustered on school level.
Table 3 reports the results of three baseline regressions, where the dependent variable, Number of Publications, is the sum of all referred journal articles published by a given faculty member between 2009 and 2011, inclusively. In specification (S2), we drop Grants to see if the lower quality of data for this variable has any effect on the remaining results; it does not. This may be because Grants is not strongly correlated with any of the other independent variables. Its median absolute value correlation in the multiple imputed data set is 10.9, with a maximum of 27 for Experience squared. In specification (S3), we retain only the variables whose coefficients are significant.
Baseline Results of Regressions on the Determinants of Research Output.

Note. Regressand: Number of publications. Number of observations: 575. Results are based on 10 multiple imputations. Robust standard errors, clustered on school level, are reported in parentheses. p value > F-stat = .000 in all regressions. *, **, *** represent 10-, 5-, and 1-percent significance levels, respectively.
Mean R2 based on Fisher’s z transformation.
Based on this “naïve” regressand, Teaching Load is, at best, a feeble predictor of research productivity. Its coefficient is negative across all three specifications, suggesting that the time spent on teaching does crowd out research. However, neither the size of the estimated coefficients, nor their significance are particularly strong. For a one-course reduction in Teaching Load, the number of published articles goes down by about two fifths of an article during the entire 3-year period. The coefficient of this variable is significant only at the 10% level, albeit consistently across all three specifications. This finding is in line with much of the existing empirical research that appears to suggest that the evidence for the negative effect of teaching on research is weak, at best.
The coefficient estimates of the remaining independent variables, particularly those that are significant, are consistent with expectations. More senior faculty produce noticeably more research. Faculty who were going up for promotion and tenure during the time frame of our analysis increase their research output substantially; this coefficient is very large and very significant. Time spent in academia appears to affect research in a nonlinear fashion: Research output tends to decline during the first 2.5 to 3 decades and then increases. Consistent with the existing literature, male faculty publish more peer-reviewed journal articles. Furthermore, the ability to win grants has a positive effect on research output and faculty in higher ranked schools have more publications. The statistical significance of the rest of the determinants is either weak, absent, or inconsistent across the alternative regression models, and therefore these regressors do not warrant further discussion.
The results of least squares regressions, where the dependent variable is 5-Year Impact, are presented in Table 4. Standard errors are again robust and clustered on school level. The coefficient estimates of Teaching Load in this table are markedly different from those in the preceding table with baseline estimates. Here in Table 4, the estimated effect of Teaching Load is negative, large, and statistically significant across all model specifications. These results indicate that for every additional course on a faculty member’s annual teaching load, their research garners about 13 fewer citations on average, or a drop of about 8%. This substantial decline in citations may occur due to (a) a drop in the number of publications, (b) a decline in citability, that is, a decline in the quality, relevance, or novelty of published articles, or (c) a combination thereof.
Results of Regressions on the Determinants of Research Output.
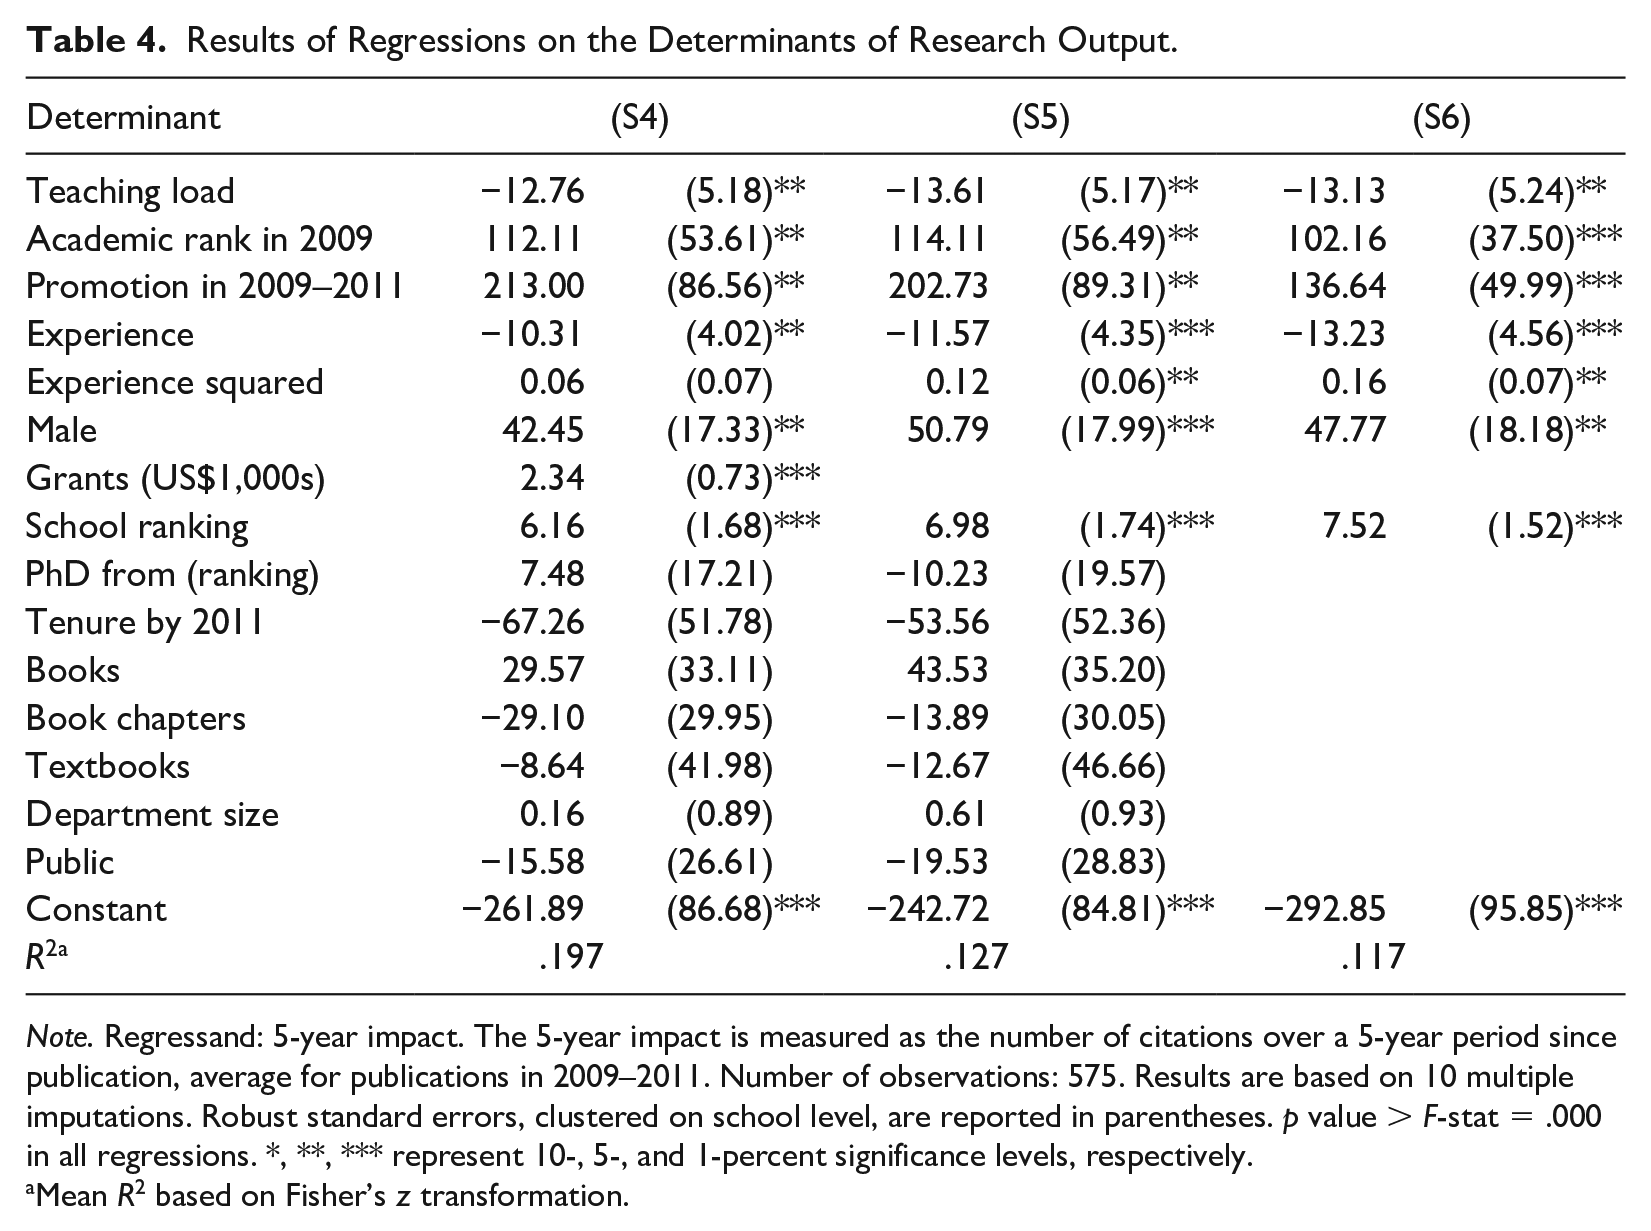
Note. Regressand: 5-year impact. The 5-year impact is measured as the number of citations over a 5-year period since publication, average for publications in 2009–2011. Number of observations: 575. Results are based on 10 multiple imputations. Robust standard errors, clustered on school level, are reported in parentheses. p value > F-stat = .000 in all regressions. *, **, *** represent 10-, 5-, and 1-percent significance levels, respectively.
Mean R2 based on Fisher’s z transformation.
The estimated coefficients of the rest of the determinants of research are similar across the two results tables. Curiously, however, while more than half of the other statistically significant coefficients in Table 3, namely 11 of 20, became less significant in Table 4, 9 the coefficient on Teaching Load became more statistically significant across all three model specifications. The question of why heavier teaching responsibilities have little effect on research output when the latter is measured as a simple count of publications, while having a strong effect when research is measured as impact, merits its own dedicated in-depth study. However, from the results found in this article we can infer that faculty with heavier teaching loads may be letting the teaching-research tradeoff affect the quality (here measured by citability), rather than the quantity of their research output. Tellingly, promotion and tenure (P&T) guidelines in top-tier schools stress the quality of research with the language like “research and creative activity of the highest possible quality” and “achieve national or international reputation.” In contrast, more teaching-oriented schools generally emphasize the quantity of research, for example, “publish 4 peer-reviewed academic journal articles or chapters in an academic book.” 10 This distinction may hold the key to explaining why previous studies that were based on the number of publications found weak or no association between teaching and research (Hattie & Marsh, 1996).
Going on to the rest of the regressors, a faculty member’s academic rank in 2009 emerges as a very important determinant of research output across all models: a one-step difference in academic rank is statistically significantly associated with an increase of over 100 citations in the ensuing 5-year period. Faculty who were promoted during our sample period saw their 5-year citation count grow by about 200 (between 137 and 213, depending on the specification), or a staggering 122%. This result is hardly surprising for faculty going up for tenure or promotion, particularly when the effect is accentuated by selection: Those who did not get tenure are not in the sample.
Similar to the results in the baseline regressions, the time spent in academia behaves as an upward-facing parabola, whose downward-sloping arm takes up most of the relevant region: The parabola turns upward after more than 40 years of experience. Thus, production of research begins to increase for people who chose to continue to work past the official retirement age, and therefore the positive turn of the curve may be explained by self-selection, driven by a group of highly productive and dedicated senior scholars.
Our results also corroborate the finding in the existing literature (e.g., Blackburn et al., 1978; Hesli & Lee, 2011; Mayer & Rathmann, 2018; Xie & Shauman, 1998) that male faculty produce more cited research. The ability to win grants is unsurprisingly an important factor. The coefficient on Grants is positive, large, and highly significant, as expected. Finally, research by faculty in higher ranked schools results in more citations: For a one-point increase in school score in the NRC rankings, the total count of citations goes up by about 7. 11
Addressing Endogeneity
We now briefly address the potential for a bias due to endogeneity. As mentioned above, we do not attempt to demonstrate that the influence of teaching on research is indubitably causal, as we do not have a suitable instrumental variable, let alone experimental data. We understand that the amount of teaching assigned to a faculty member can be endogenous to their research output. However, we submit that teaching load has a causal effect on production of research because we believe that the association cannot entirely be attributed to backward causality or an omitted third variable.
At the very basic level, teaching is time-consuming. For example, an additional three-credit-hour course may require six-to-eight extra hours per week spent on in-class meetings, weekly course preparation, grading, and office hours, which is a considerable amount of time not available for conducting research. Then, there are less direct but equally important factors explaining how teaching can displace research beyond the simple investment of time: Teaching competes with research in terms of focus, motivation, and momentum; it can lead to fatigue from having to balance research and teaching (and service); one can get stuck in a low-research equilibrium if a heavy early-career teaching interferes with scholarly productivity and professional networking; and finally, it can lead to an eventual abandonment of ambitions for becoming a recognized scholar and resignation to a primarily teaching-oriented career.
Furthermore, Angrist and Pischke (2009) point out that “correlation can sometimes provide pretty good evidence of a causal relation” (p. 113), and below we show that the relationship found in this article goes beyond a mere correlation. To this end, we assess whether unobserved factors are biasing our estimated coefficients using the methods developed by Altonji et al. (2005) and E. Oster (2019).
The Altonji method evaluates this bias based on how similar the estimated coefficients are from a model with a full set of controls to those from a model with no controls other than the regressor of interest. This can be done using the expression
Assessing the Bias From Unobservables Based on the Selection on Observable Characteristics.

Note. The entries in Columns (1) and (2) are calculated as follows:
Oster (2019) notes that the movement in the value of r2 has a large effect on the size of the bias from omitted variables in the Altonji method. To adjust for this effect, she suggests the use of a bounding factor
Conclusion
In academia, it is common for newly hired untenured faculty to receive one or two course reductions in the first year of employment. Why is this a common practice? It appears that this employment benefit is offered (or sometimes negotiated) in recognition that teaching gets in the way of research—the overriding factor for obtaining tenure and promotion. So in light of this, it is puzzling that empirical evidence on the negative effect of the amount of teaching on research is scanty, weak, and often mixed. This lack of evidence may have been partly due to inapposite empirical design and quantification of key variables. To investigate, we revisit this question with original data based on 575 tenure-track psychology faculty in U.S. universities. Furthermore, as a collateral benefit of including a set of control variables, while measuring the effect of the amount of teaching duties on the quality and quantity of research, we identify a list of other important determinants of faculty research output.
We find that teaching indeed crowds out research. However, when research output is measured unidimensionally as a simple number of publications without any regard to the quality thereof, the effect of the amount of teaching on research is noticeably weaker. We hypothesize that this happens because faculty with more teaching responsibilities choose to protect the quantity of published articles over their quality. A major empirical study or a groundbreaking theoretical scholarly work can easily take up far more time and effort than several smaller analyses. Therefore, it may be preferable for faculty with more teaching duties to shift the opportunity cost of teaching toward maintaining the number of publications on their CV by choosing to focus on lower-impact papers. This may be the reason why we find that the negative effect of teaching on research is strong when the latter is measured as impact rather than as simple count of publications.
We further establish that while causality is extremely difficult to show with nonexperimental data, the evidence of the strong negative effect of teaching on research is not entirely correlational and that causality, at least in part, runs from more teaching to less research.
Footnotes
Acknowledgements
We thank Amanda Barstow, Mykala Bethune, Demi Fink, Grace Halstead, Stefan Ragnarsson, and Sydney Rose for invaluable research assistance. We thank Ashley Kennedy for a review and useful feedback. We also thank the editors and anonymous referees for thorough critiques and helpful comments.
Declaration of Conflicting Interests
The authors declared no potential conflicts of interest with respect to the research, authorship, and/or publication of this article.
Funding
The authors received no financial support for the research, authorship, and/or publication of this article.