
Abstract
Are preferences for redistribution based on self-interest, ideology, or identity? This paper describes an experiment where participants play a game that requires both luck and skill for cash payoffs. At the end of the game, participants vote on the distribution of payoffs. Options range from full equality to unequal payments based on final rank. These votes are then analyzed; results show that self-interest, ideology, and identity all impact how participants vote. Those who do well are much more likely to vote for an unequal payoff while those who do poorly are likely to vote for an equal payoff. The degree of acceptable inequality, however, is influenced both by ideology (stated preferences over redistribution) and identity (race and age). The experiment also led to some changes in perspective, with those who did poorly in the game in particular being highly likely to shift their views in favor of redistribution.
In an age of high and increasing inequality, both academic work and political attention are increasingly focused on questions of redistribution. Surveys often indicate that people would prefer a more equal distribution of wealth than currently exists, yet political candidates do not usually campaign on greater redistribution. Are the survey results just cheap talk? Most models based on rational self-interest posit that one’s relative position in an income distribution is all that matters for preferences over redistribution. However, behavioral models suggest other factors such as ideology, political identification, and social norms may have a large impact.
This paper describes an experiment that provides insight into preferences for or against redistribution. Participants play a game that is based on both luck and skill for a monetary payoff. The game results in a clear ranking of players from top to bottom; at the end of the experiment, players vote on a distribution of payoffs based on this ranking. The results from the game and players’ votes are analyzed, along with survey data, to provide insight into the role of self-interest, ideology and identity on choices about redistribution. Specifically, what factors drive voting for a particular distribution and how does participating in such an experiment impact peoples’ stated preferences over redistribution?
Results show that self-interest, ideology, and identity all impact how participants vote. Those who do well in the game are much more likely to vote for an unequal payoff while those who do poorly are very likely to vote for an equal payoff. The degree of acceptable inequality, however, is influenced both by ideology (stated preferences over redistribution) and identity (race and age). The experiment also led to some changes in perspective, with those who did poorly in the game in particular being highly likely to shift their views in favor of redistribution.
Background
Basic rational choice theory provides a simple and clear prediction: preferences for redistribution should be driven entirely by self-interest (Walsh, 2015). We can thus expect the poor to support redistribution and the rich to oppose it. Evidence, however, is decidedly more complex. Mulé (2001) argues that there are two main explanations for voting preferences: rational choice theory and political sociology. On the political sociology side, Miles (2014) documents a long trend in American politics of low-income Republicans voting against their economic self-interest. Such votes may be based on lack of understanding (Fernbach et al., 2013) or are driven by identity and ideology more than self-interest (Gelman, 2009; Miles, 2014). Clausen, Tucker and Smith (2015) argue that many Americans are symbolic conservatives—meaning they identify with and wish to be seen as conservative—but operational liberals in their support for specific policies that are more liberal. A survey experiment described by Rothwell (2020) lends evidence for this argument, showing that American conservatives had strong stated views against redistribution but still acted similarly to those with more moderate views when given choices about it.
Kuhn (2010), however, finds evidence from voting in Austria that rational self-interest was a key driver of votes on redistributive policy. In experimental work McCannon (2014) found a strong relationship with individuals’ initial preferences on public intervention for redistribution and their subsequent willingness to share in a trust game. Esarey et al. (2010) found that individuals in an experiment with their own money at stake were largely driven by self-interest as well.
Peterson et al. (2012) argue that views on social welfare are driven by notions of who is deserving of benefits. This argument raises an important distinction between individuals’ preferences over redistribution in the abstract versus their votes on specific policies that impact them directly. Rawls (1999) famously elucidated this distinction in his arguments on the “original position,” suggesting that if individuals were to rationally pick a distribution before knowing their place in it they would choose a fair one, whilst after knowing their own position they would follow self-interest to oppose or support redistribution. In an experimental test of Rawls’ argument, Hoffman et al. (1994) found evidence of a “mixed principle” that “maximized the primary goods of the group as a whole subject to a constraint that the primary goods… of the worst-off individual in the group not be allowed to fall below a predetermined floor” (Hoffman et al., 1994 p. 463). Interestingly, Hoffman et al. (1994) also found that in their experiment individuals who had a better bargaining position were less likely to share. Thus, self-interest still played a large role even if coupled with some notion of providing a floor for those at the bottom of the distribution.
Preferences over redistribution are a complex phenomena driven by multiple factors and they may change over time in response to various experiences and knowledge. Chacoma and Zanette (2015) emphasize that opinion formation involves constant evolution, suggesting that we should not view preferences as fixed. Kuziemko et al. (2015) directly estimate how peoples’ preferences over redistribution change in response to new information. They found that information generates concern, but in most cases did not have a significant impact on support for particular polices.
This study contributes to the literature on voting and redistribution through an experiment that involves a game of both luck and skill with cash payoffs. We first survey participants about both their preferences over redistribution and their background. They then participate in a game that generates a clear rank from richest to poorest. Knowing this ranking and where they are in it, participants vote on the distribution of payoffs. Afterward they are surveyed again. This structure allows us to carefully analyze the determinants of votes for or against redistribution and test self-interest versus stated ideology and identity. It also allows us to measure and analyze changes in preferences over redistribution based on the experiment.
Methodology
Pre-Survey and Experiment
We conducted the first part of the experiment by advertising to individuals that they could make “up to $20” by participating in a research study on the campus of a small liberal arts university. Advertisements were mostly placed on and around the campus but were also placed on online forums that involved the greater community. People were asked to sign up for a time that was convenient for them and were then emailed a confirmation of that time. In all, 94 participants signed up for the study.
When the participants arrived at the test site they signed their names on a sign-in sheet and were assigned a participant number via the order they arrived. Thus, the first person to arrive for the day was participant one, all the way to participant 76 (18 people who signed up failed to show up). Once participants received their numbers they were assigned to one of two test rooms randomly. In the room they were asked to use their mobile phones to take a brief pre-test survey. 1 The survey asked the participants about their demographics, their opinions on redistribution of wealth, as well as questions on political beliefs and party identification.
After the survey the game, “Rich Man Poor Man,” was described. 2 The game initially ranks players from richest of the rich to poorest of the poor. The initial ranking was determined randomly; players were given placards to indicate their rank randomly as they entered the room. The game consists of playing cards in certain sequences and high cards are more valuable. However, before play begins the poor participants are mandated to give the rich participants their best cards. This meant that the rich were always at a starting advantage to the poor. The game involves skill in playing cards in effective combinations at the right time. However, there is also substantial luck involved in the starting position and in the deal. The first player to play all of their cards wins and is the richest of the rich for the next round, and so on until only one player, the poorest of the poor, remains. Each experimental group played through three rounds of the game.
After play concluded the participants were presented with four options for the distribution of payoffs. The participants saw these options as option A, B, C, and D. Distribution A was the most unequal distribution, offering $20 to the winner and $0 to the last place player while distribution D payed $10 to everyone. Distributions B and C were more equal than distribution 1 but still provided higher payoffs to winning players. 3 Participants were instructed to rank the distributions from their most preferred to least (from 1 to 4 where 1 is most preferred). These rankings were then summed and the lowest scoring (and thus most preferred) distribution determined the actual payoff distribution (in the event of a tie the actual distribution was chosen randomly). As the results were calculated participants were asked to complete a brief post-survey before they were paid; they then received cash payments based on their placement in the game and the distribution chosen by the group.
Data and Analysis
This analysis seeks to address two questions. First, what drives voting choices on a distribution of payoffs? Specifically, we test the likelihood that people vote based on their stated views about redistribution, their demographic characteristics, or based on their standing in the game. In other words, does where they stand depend on where they sit? Second, do people’s views on redistribution change after playing the game, especially if they moved up or down in the ranking?
To consider the first question, we first coded the voting results for analysis. Each participant ranked four distributions that ranged from highly unequal to perfectly equal. We coded the responses into three groups: those who ranked the unequal distribution first or second, those who ranked the equal distribution first or second, and those who ranked neither extreme distribution first or second. 4 Those three categorizations resulted in a ternary variable, which was used as the dependent variable for an ordered probit regression. The equal distribution was coded as zero, neutral as one and unequal as two so that the results can be interpreted as factors leading to greater support for less equal distributions.
Means and Factor Loadings.

The seven variables load primarily on one factor with the expected signs for an implicit measure of preferences in favor of redistribution. The correlation matrix of the seven factors shows only two correlations greater than 0.5 in magnitude. The indicators for agreeing that wealth inequality is a problem and agreeing that something should be done about it correlate at 0.62, and the indicator for agreeing that something should be done and having liberal views correlate at 0.50. Multiple other correlations are around 0.4, and none stand out as problematic for the analysis.
A Redistribution Factor Score was created from those results and is used as the measure of respondents’ preferences over redistribution. The post-game survey repeated the first five questions used in the factor analysis as well. Those results were used with the same factor loadings above to create a post-game measure of preferences that allows us to consider how preferences over redistribution changed after the experiment. 14 participants saw a decrease in their factor score after the experiment, indicating a change in preferences less in favor of redistribution, while 24 saw an increase in their factor score after the experiment.
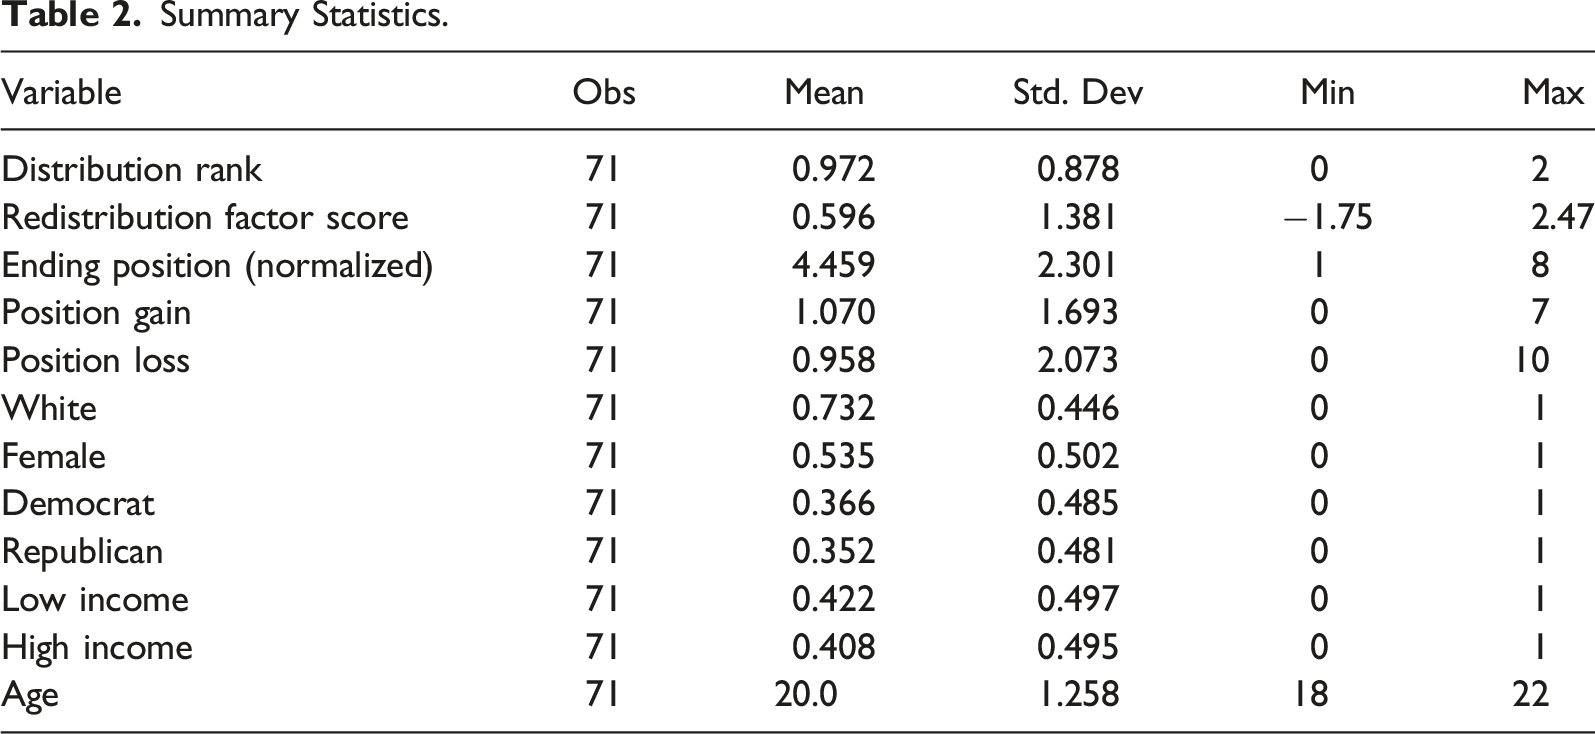
The survey also collected data on political identification and demographic characteristics. This data, along with results from the game, form the independent variables for analysis. The first independent variable is an ordinal variable for the participants’ ending position in the game. Nine groups participated in the experiment with sizes ranging from six to 11 participants per group. The most common group size was eight, so the ending position variable was normalized to size eight for comparison and analysis—that is, for smaller groups, the last place was assigned a value of eight, and in between placings were given larger intervals. For larger groups, the last place was again assigned a value of eight and in between placings were given smaller intervals. This provides a more accurate comparison as the key positions are the first, last, and middle spots. Individuals would compare themselves, and receive rewards, based on these relative rankings. 10
The second and third variables identify a participant’s gain or loss in position from the first round through the end of the third round. Thus if a participant moved from position eight to position four that individual would show a position gain of four. Indicator variables are included for white participants, female participants, those who identify themselves as Democrats or Republicans, and participants with high (>$100,000) or low (<$50,000) family income. Lastly, participants indicated their age.
Summary Statistics.
Regression Analysis of Voting Decisions
The ordinal distribution rank variable is the dependent variable for ordered probit estimations on voting decisions. As mentioned previously, this variable is coded as zero for individuals who ranked the equal distribution first or second, one for those who ranked neither the equal or least equal distribution first or second, and two for those who ranked the least equal distribution first or second. Positive coefficients can thus be interpreted as increasing the probability that an individual will rank a less equal distribution highly.
Ordered Probit Estimates on Distribution Rank.

Regression results indicate that three broad factors impacted participants’ voting decisions. First, the outcome of the game had a strong effect, which ties directly into participants’ self-interest. This is shown most directly by the strong significant negative estimated coefficient on ending position; the lower people ranked in the game the more likely they were to vote for an equal distribution. Similarly, those who lost position in the game were also estimated to be significantly more likely to vote for an equal distribution. Surprisingly, those who gained position in the game were also more likely to vote for an equal distribution, controlling for ending position.
Second, individual views on redistribution also had a significant effect. The Redistribution Factor Score had a negative estimated impact, indicating that those with views more in favor of redistribution were more likely to vote for an equal payoff distribution. Participants who identified as Republicans, however, were more likely to vote for an equal distribution, controlling for age, race, and views on redistribution directly. This effect was weaker than others however and is marginally insignificant in the second model. Lastly, age and race both had strong estimated coefficients, suggesting that who people are also impacted their votes. Specifically, older white participants were more likely to vote for an unequal distribution. All participants were 18–22 years old, so significant impact of age likely reflects differences in years in college. It is interesting that that difference is significant, which may indicate that college experiences are a formative time for individual beliefs.
To explore these estimates further, we consider some visuals to compare the different dimensions that impacted votes. First, we estimate the probability that individuals vote for each distribution by their ending position in the game (rounded to integer values for this comparison) and by their views on redistribution. For Figures 1,2, and 3 below, we considered cases of individuals “For Redistribution,” meaning having a Redistribution Factor Score one standard deviation above the mean, individuals at the mean Redistribution Factor Score, and individuals with a Factor Score one standard deviation below the mean, or “Against Redistribution.” The figures thus allow some comparison of the impacts of individual views versus position in the game on voting probabilities.
11
Probability of voting for equal distribution. Probability of voting for neutral distribution. Probability of voting for unequal distribution.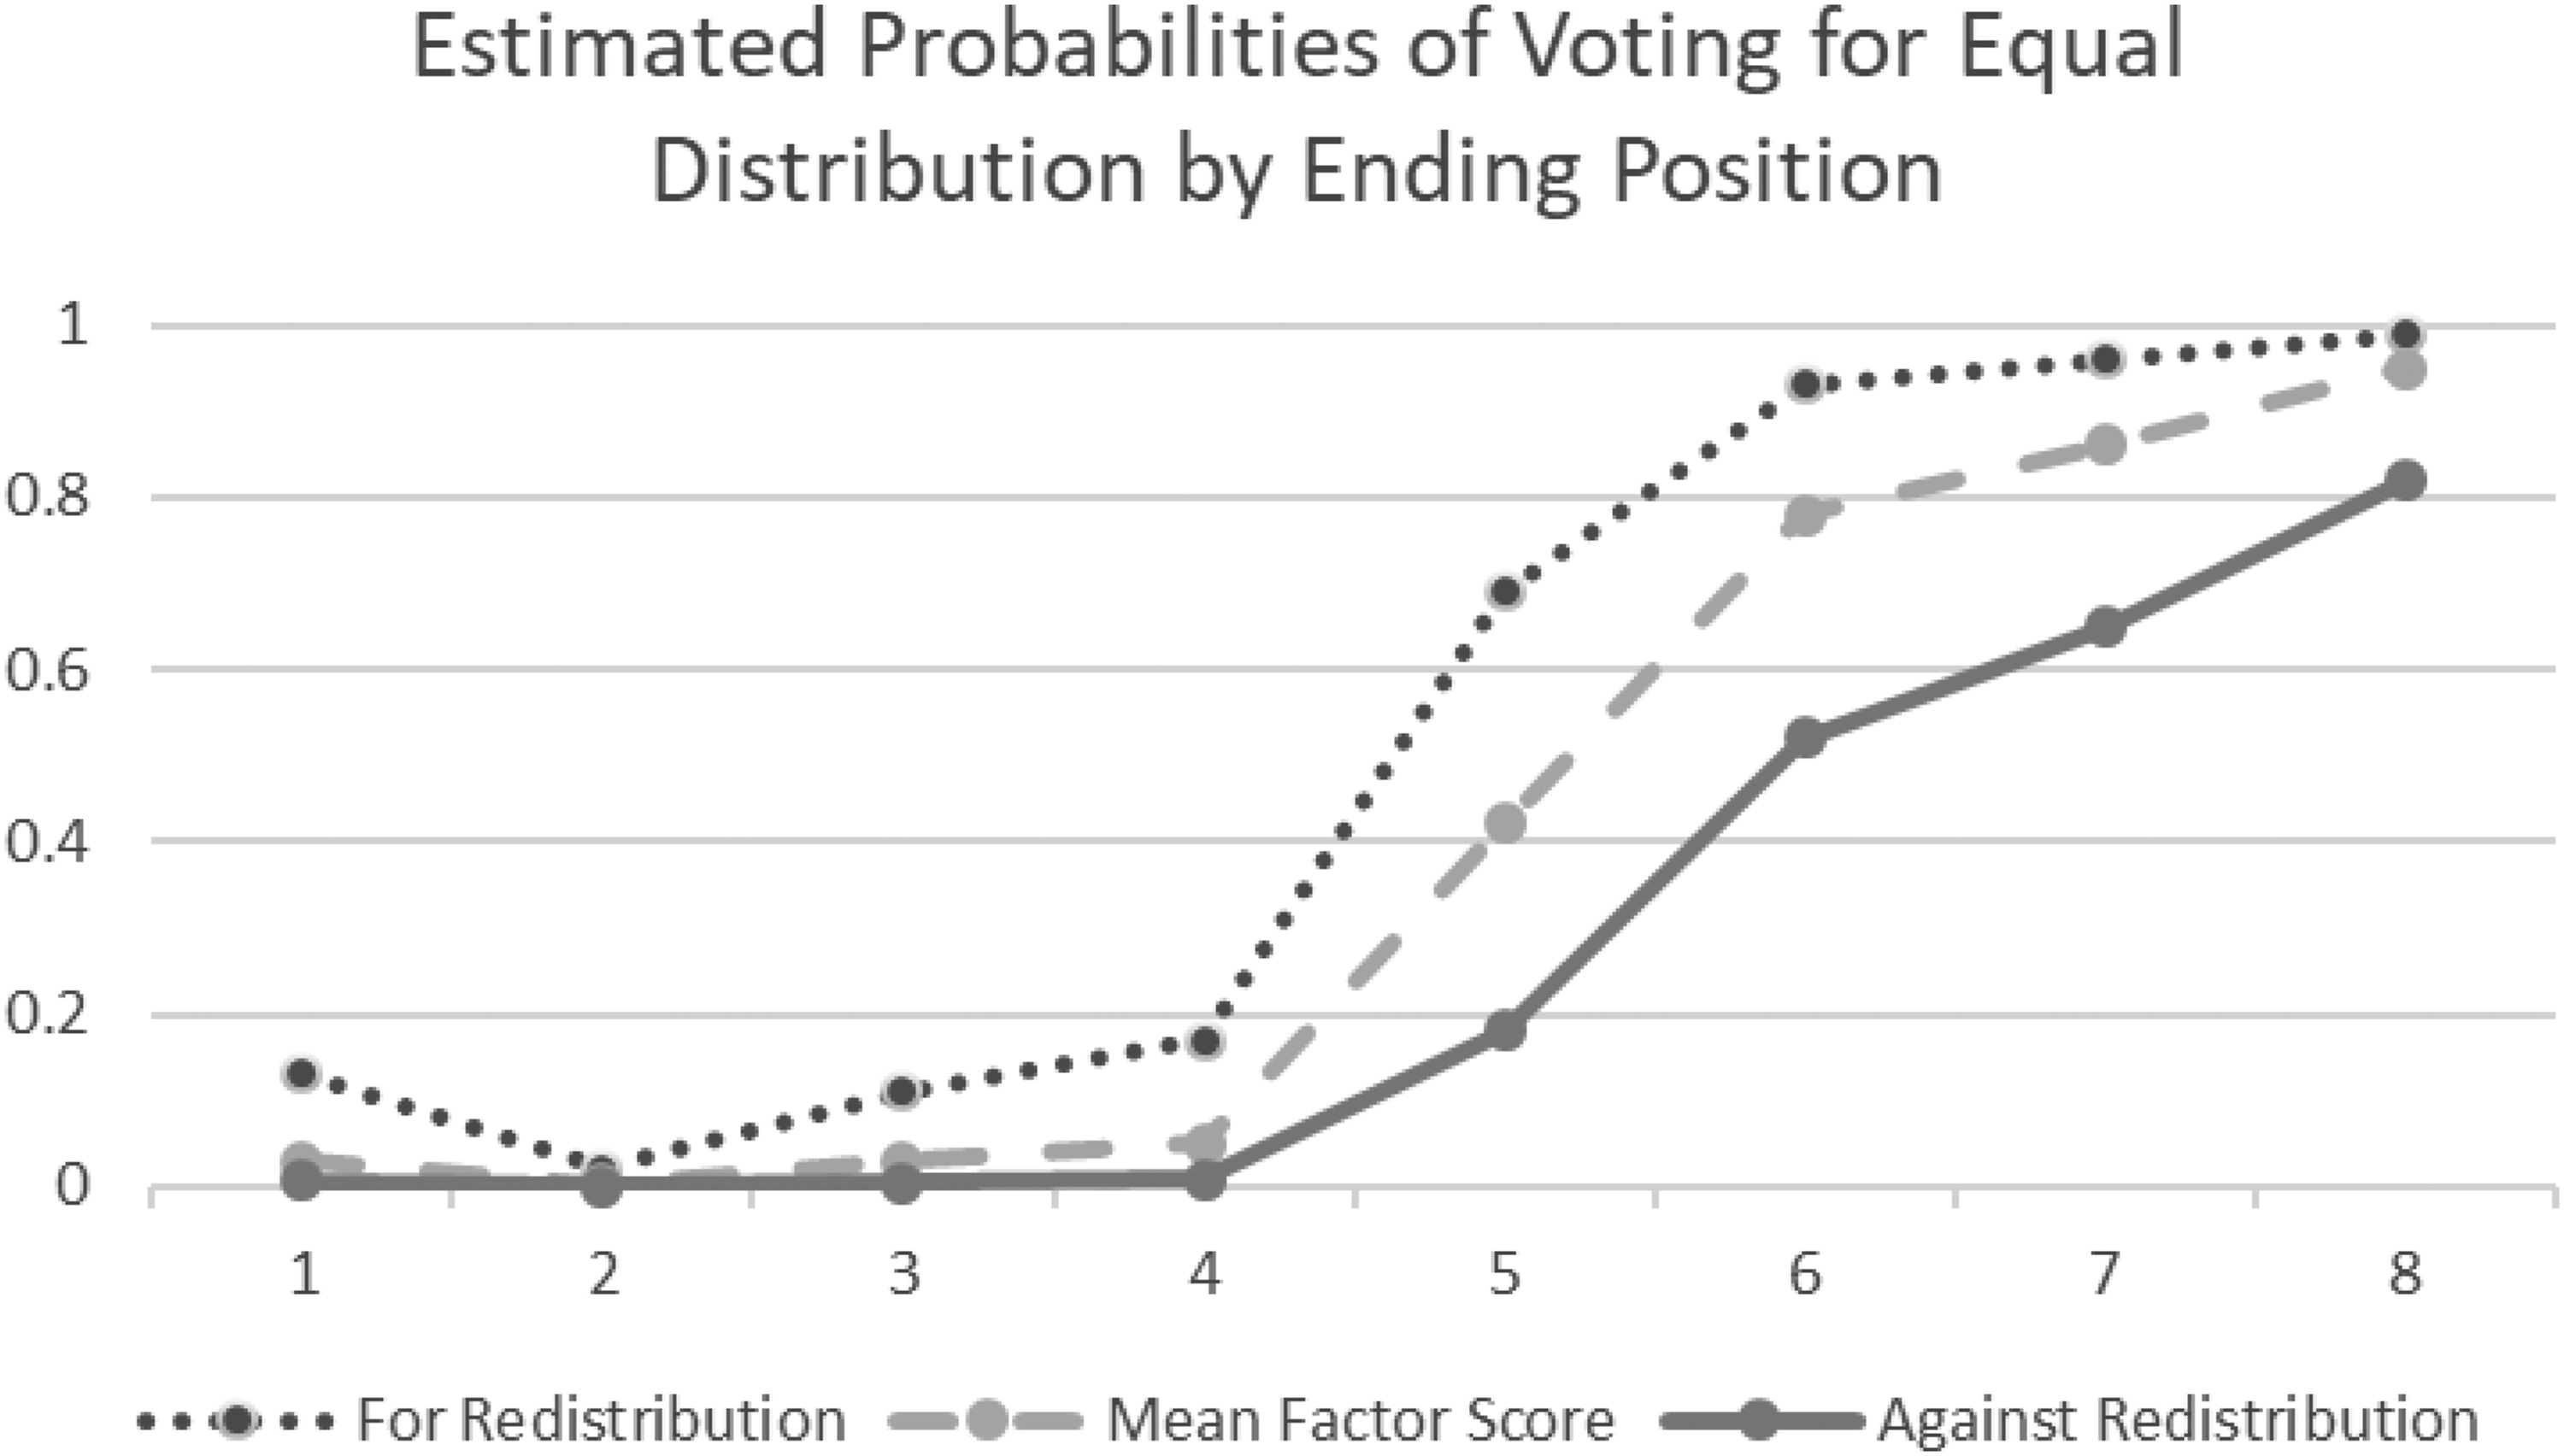

We see in Figure 1 that individuals who finished in the top half of the game were very unlikely to vote for the equal payoff distribution. If they finished in the bottom half, however, the probability of voting for the equal distribution is high and gets larger for each worse position. Individual views on redistribution mitigate this somewhat; those who are against redistribution in principle are less likely to vote for the equal distribution, but if they finish in last place we estimate an 80% chance they would do so anyway. Those who are in favor of redistribution, however, have over a 70% change of voting for the equal distribution if they finish in fifth place out of eight, and that probability approaches one as their rank worsens.
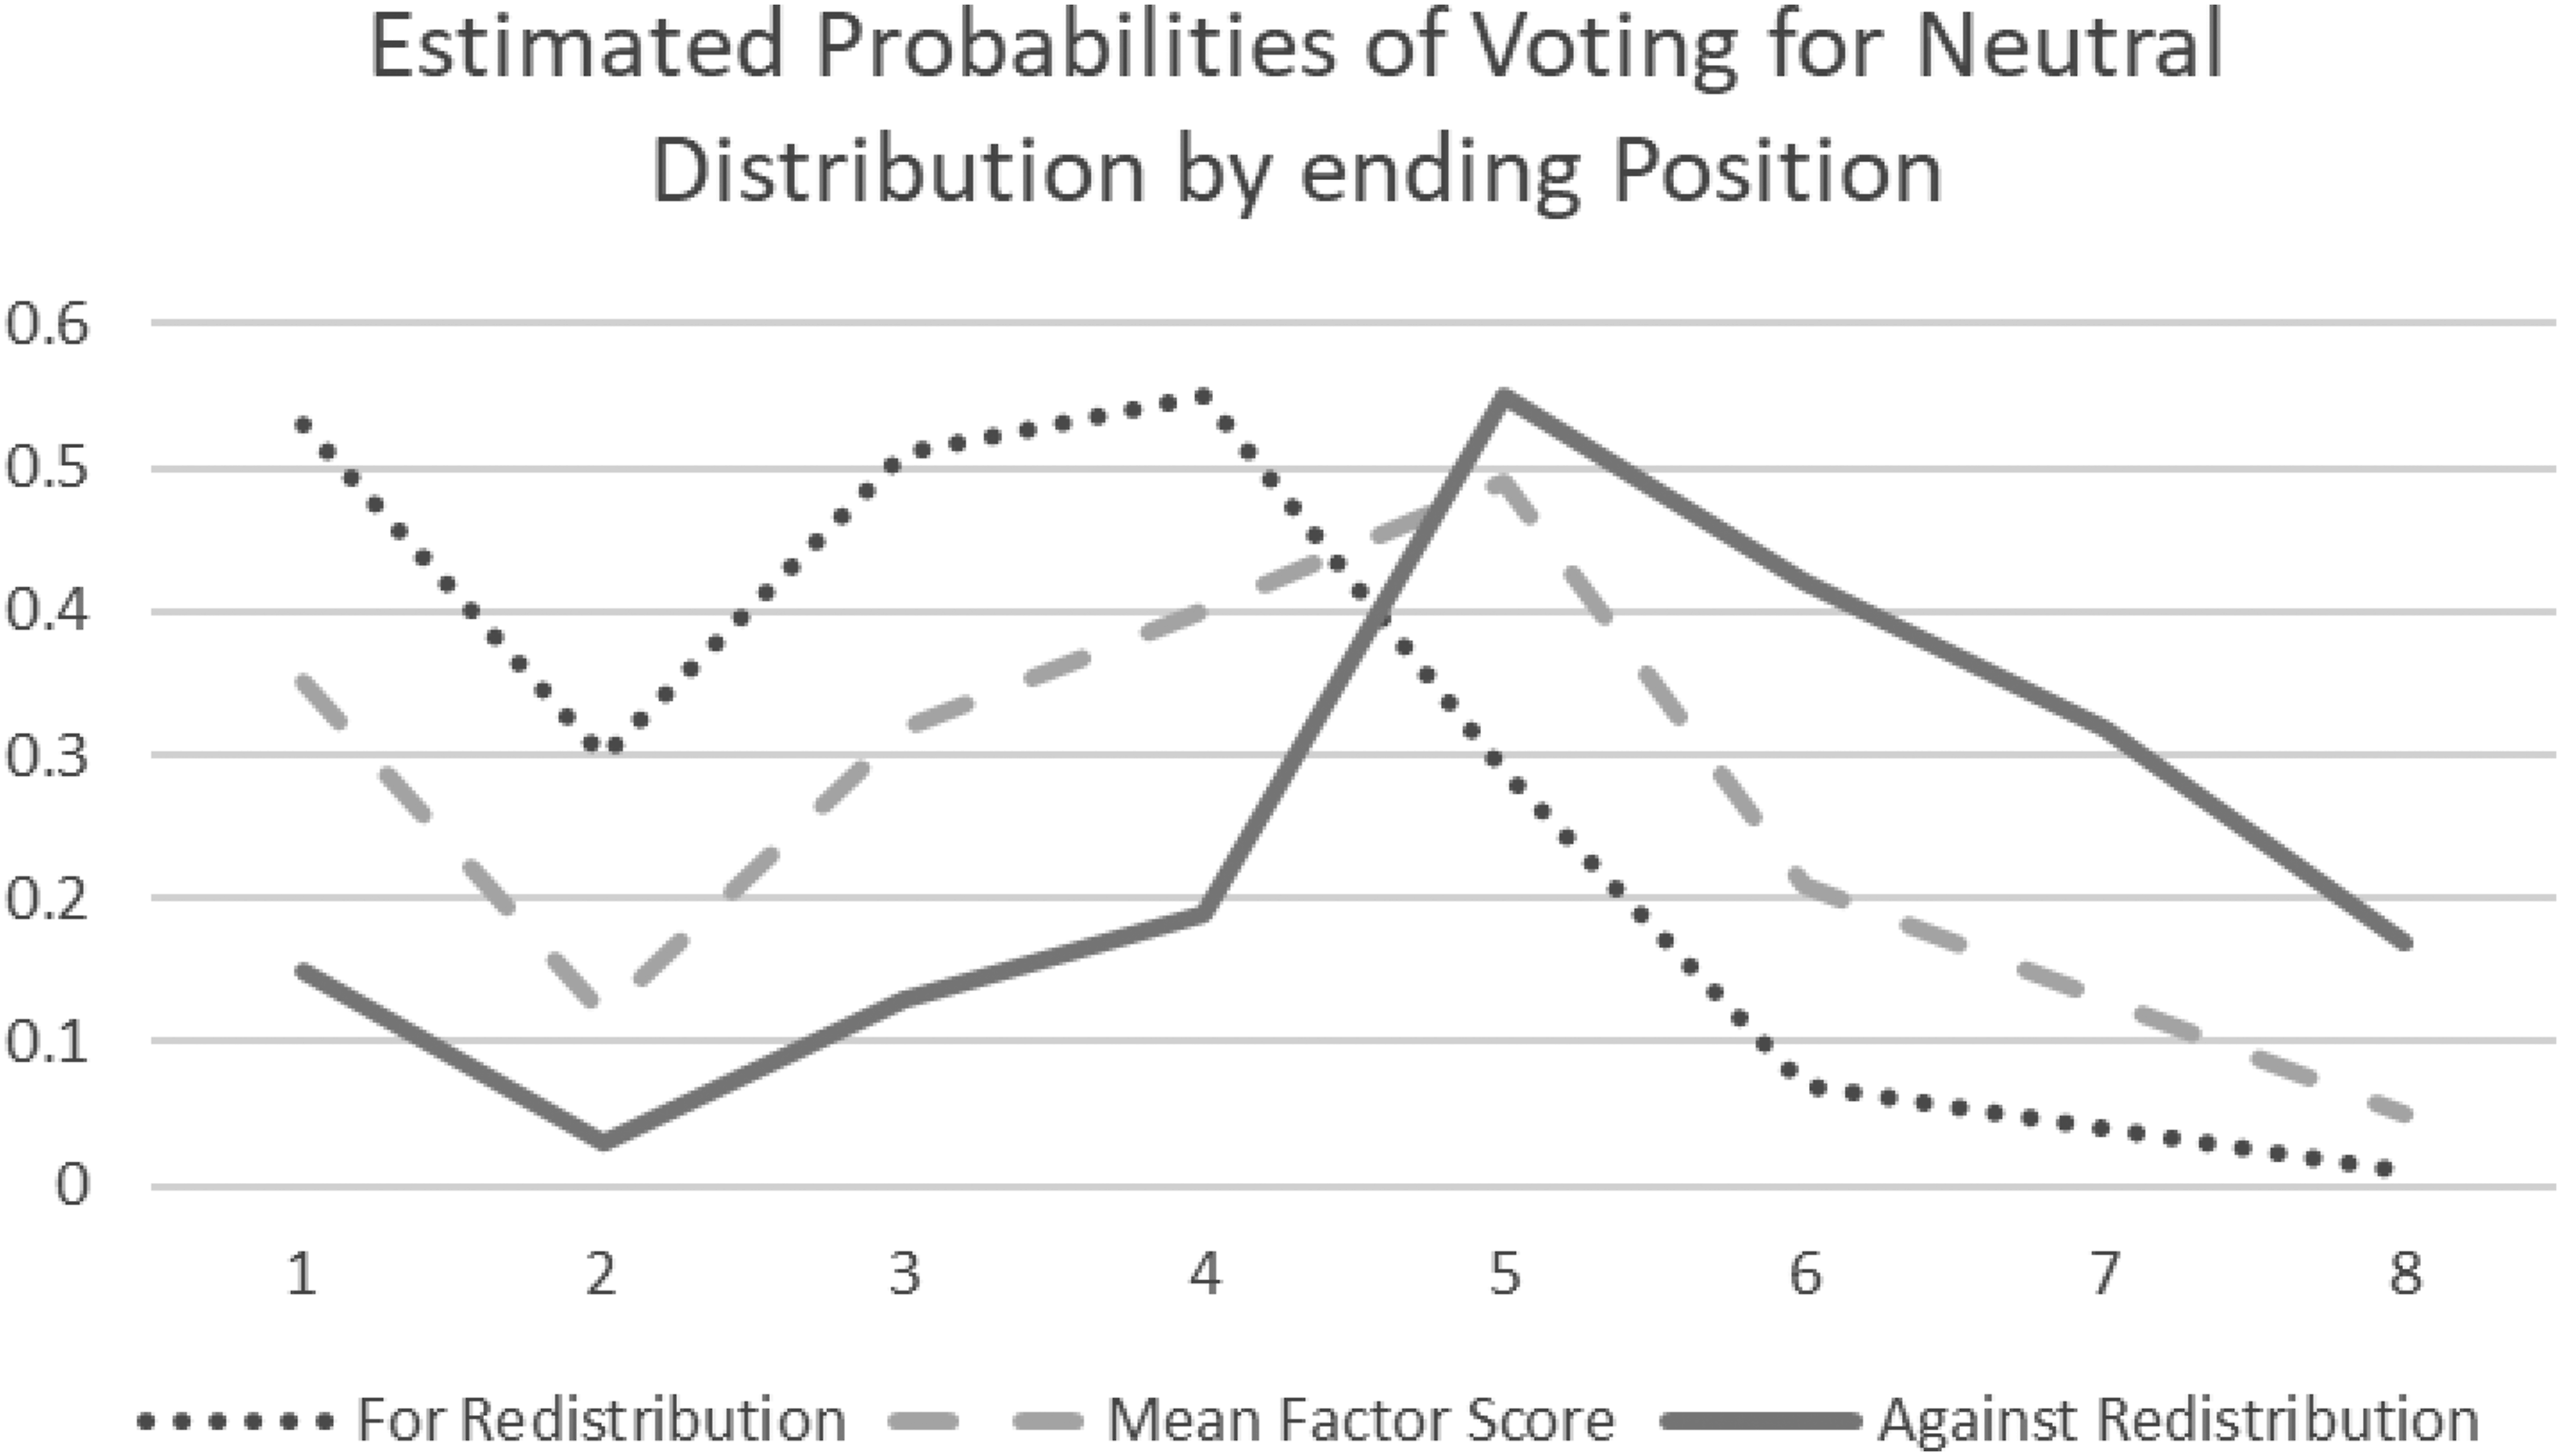
Figure 2 shows the estimated probabilities that individuals would vote for a neutral distribution. The impacts of individual preferences over redistribution are clear here. Individuals against redistribution who finish in the top half of the game are unlikely to vote for a neutral distribution. That probability increases substantially, however, if they finish fifth out of eight, before declining again. These results suggest that those against redistribution might see a neutral distribution as a good choice if they do poorly in the game but do not finish last, which suggests some balancing of self-interest and preferences over redistribution.
Somewhat similarly, individuals for redistribution have around a fifty percent chance of voting for a neutral distribution is they do well in the game, but that probability quickly drops below ten percent if they rank sixth or lower. It seems that those in favor of redistribution will consider a neutral distribution when doing well but quickly shift to an equal one if they do poorly.
Lastly, across all individuals we see that the probability of voting for a neutral distribution is higher for those who win than for those who finish in second place. Interestingly, this effect is mirrored in Figure 3, which shows the estimated probabilities of voting for the unequal distribution. These probabilities are highest among people who finish second, although the overall trend is that individuals are more likely to vote for the unequal distribution if they do well in the game. This “second-place effect” is interesting. Prior research indicates that rich voters may vote for redistribution (against their self-interest) if they think a majority already favors redistribution (Höchtl et al., 2012). It is possible that those in first place are more sensitive to social perceptions/pressures, which results in a higher likelihood of first place participants voting for redistribution than second place participants.
Figure 3 shows similar differences by preferences over redistribution. Individuals against redistribution are highly likely to vote for the unequal distribution if they finish in the top half of the game, while those against redistribution only have a greater than fifty percent chance of voting for the unequal distribution if they finish second. The probabilities drop precipitously for anyone who finishes in the bottom half, however.
Figures 1,2, and 3 show clearly how self-interest drives voting decisions in the game. The strong prediction is that no one who finishes in the top half of the game will vote for the equal distribution and no one who finishes in the bottom half of the game will vote for the unequal distribution. Individual preferences play a role in the subsequent choice. Of those who finish in the top half of the game, individuals strongly against redistribution are much more likely to vote for the unequal distribution, while those with preferences for redistribution are more likely to vote for a neutral distribution. Similarly, of those who finish in the bottom half of the game, individuals in favor of redistribution are quite likely to vote for the equal distribution, while those against redistribution are more likely to opt for a neutral distribution.
Figure 4 below shows similar estimates of voting probabilities by race, presenting the probabilities that individuals vote for the equal distribution by their ending position in the game. Like in Figure 1 above, no one in the top half of the game is likely to vote for the equal distribution. Of those in the bottom half, however, non-white players are more likely to vote for the equal distribution. Similar results are found for the neutral and unequal distributions (not shown). White players are more likely to vote for the unequal distribution if they finished in the top half of the game. Probability of voting for equal distribution by race.
Just over seventy percent of participants in the game were white, and the indicator for being white was a consistently significant factor in estimates of voting probabilities. These results are consistent with the work of Bloeser and Williams (2020), who find that racial resentment may drive whites to vote against redistribution, particularly if they do not view it as likely to help them directly. This interpretation is supported by the estimates; the indicator for being white remains significant even while controlling for party affiliation, group effects, and preferences over redistribution.
Regression Analysis of Opinions on Redistribution
The second question considered in this experiment is whether playing a game that combines luck and skill for a monetary payoff changes participants’ views on redistribution. This question is analyzed based on changes in the Redistribution Factor Score. The game itself is balanced in that for every person who moves down, someone else moves up. It is interesting then that the mean change is positive; participants were more likely to alter their views in favor of redistribution. 12
Ordinary Least Squares Estimates on Change in Redistribution Factor Score.
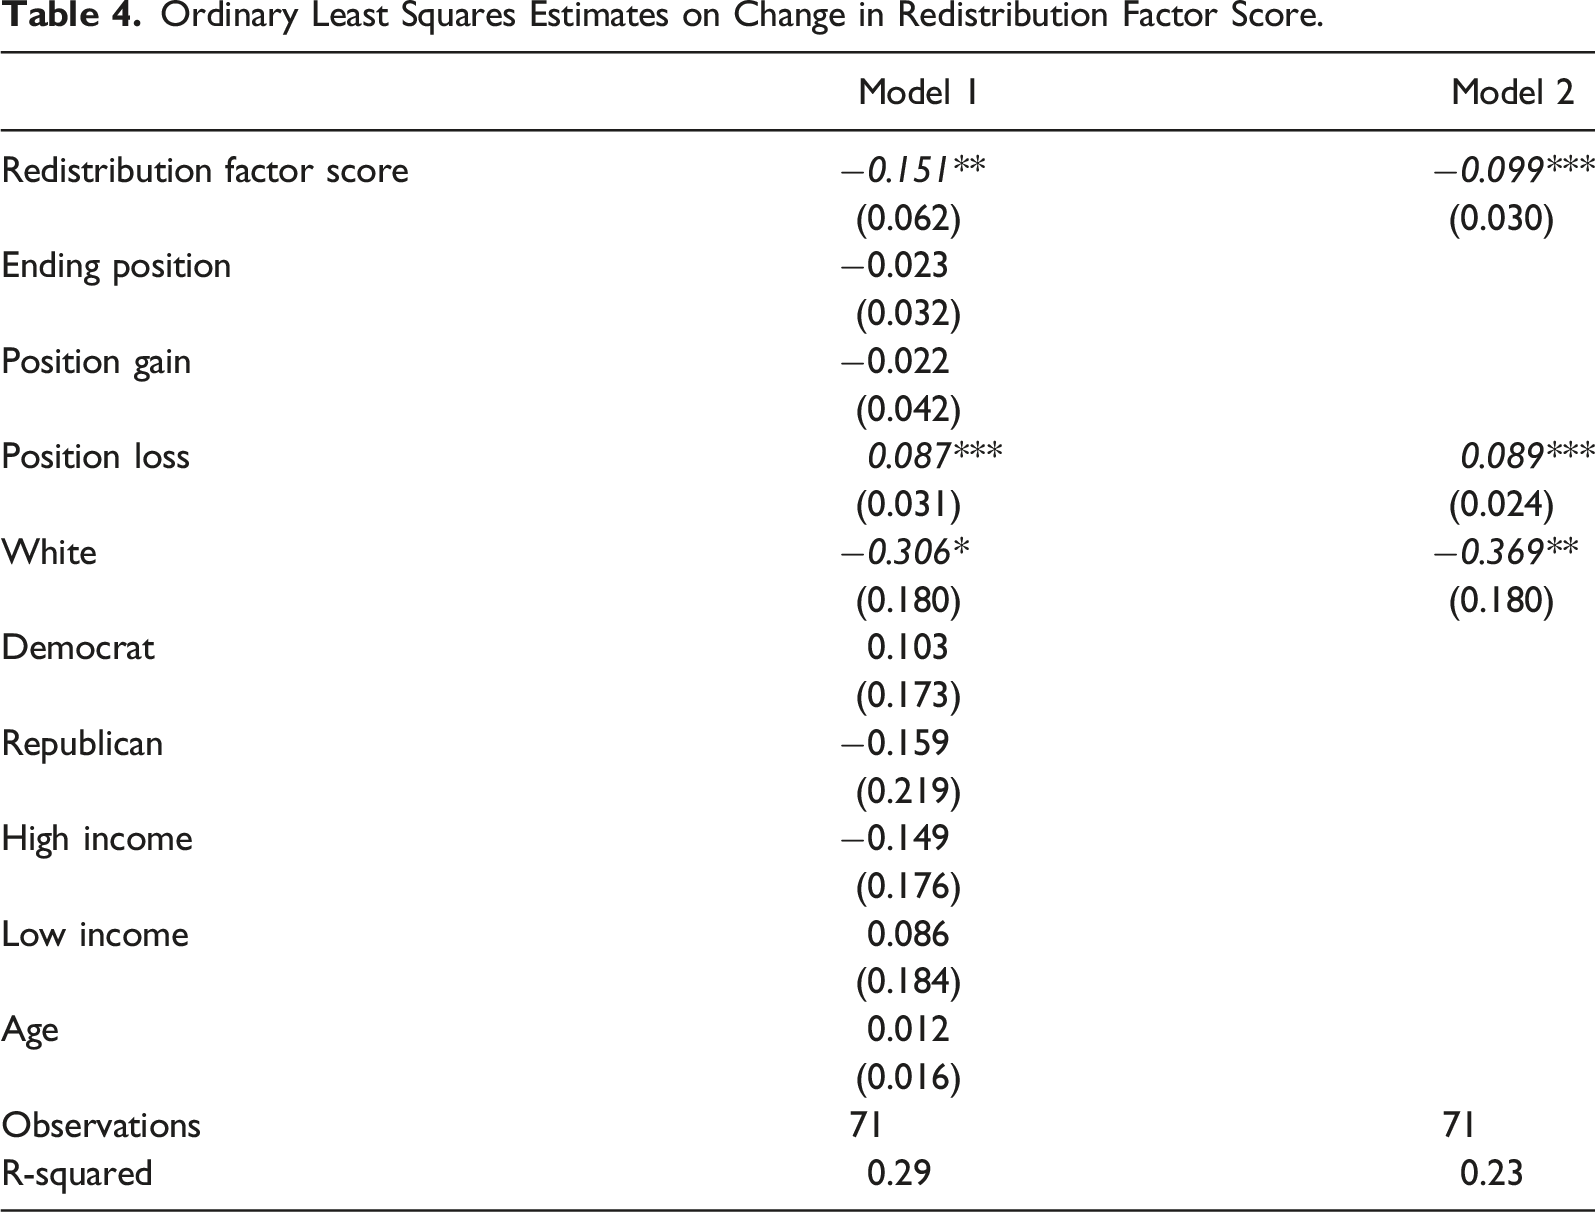
Results from Table 4 show clearly that three factors are significant determinants of changing views. Individuals’ initial scores are estimated to negatively impact the change, suggesting that those who were initially less in favor of redistribution would be more likely to change their views in favor, and in vice versa. Race is also a significant variable; white participants were less likely to change views in favor of redistribution.
Lastly, losing position in the game is estimated to significantly increase views in favor of redistribution. Notably, gaining position in the game did not have the opposite effect, and the specific ending position was also insignificant. The key factor in predicting change then was moving down in the game over the three iterations. This result may stem from something similar to loss aversion, where participants feel and respond to losses in status more acutely than they do gains.
Conclusion
We find that subjecting someone to a game that demonstrates social mobility and distribution of wealth for even as short of an hour can influence their opinions towards distribution of wealth. This result is in line with previous literature such as Chacoma and Zanette’s (2015) research showing that particular events can shift individual opinions. The maximum payoff in our game for any distribution was $20 and the minimum was zero. If we could influence people’s opinions with such small amounts of cash, it would be interesting to study what could be done with larger sums.
When we look at the factors that cause people to rank one distribution system over another, self-interest is always significant. As Mulé (2001) noted, rational choice is one of the reasons individuals support redistribution. Our results support this assertion; when someone was placed in a situation where they were better off voting for a distribution that favored them, they usually did. In our experiment, individuals who finished in the top half of the game were very unlikely to vote for an equal distribution, while those who finished in the bottom half were similarly unlikely to vote for the most unequal distribution.
However, multiple factors beyond self-interest were significant as well. Views on redistribution, as measured through a Redistribution Factor Score, had a strong impact on how people voted. These views seemed to mitigate whether individuals voted for a neutral distribution versus either extreme one.
In addition to self-interest and views on redistribution, race and age were significant determinants of how people voted, with older and white participants more likely to vote for unequal distributions. The evidence here thus suggests that multiple factors—self-interest, views on redistribution, and basic demographic factors—all impact voting decisions redistribution.
Additionally, the experiment showed evidence that people can and will change their views. More people changed views in favor of redistribution rather than against after playing the game. It is not clear if this is a general result or if it is particular to this game and/or this experiment. More research along these lines is needed. One key driver of changes in views was losing position in the game; both the ending position and any gains in position were insignificant, suggesting that losing status provided stronger impetus towards altering views. This finding is interesting in light of other research showing that racial resentment has a large impact on views towards redistributive policy, particularly when those surveyed did not benefit directly (Bloeser & Williams, 2020). Conversely, individuals who benefit directly from redistributive policies were more supportive of them, which is somewhat similar to the results here.
Supplemental Material
sj-pdf-1-aex-10.1177_05694345221075601 – Supplemental Material for Do Actions Speak Louder than Words?
Supplemental Material, sj-pdf-1-aex-10.1177_05694345221075601 for Do Actions Speak Louder than Words? by Alan Green and Daniel Humphrey in The American Economist
Footnotes
Declaration of Conflicting Interests
The author(s) declared no potential conflicts of interest with respect to the research, authorship, and/or publication of this article.
Funding
The author(s) received no financial support for the research, authorship, and/or publication of this article.
Supplemental Material
Supplemental material for this article is available online.
Notes
Author Biographies
References
Supplementary Material
Please find the following supplemental material available below.
For Open Access articles published under a Creative Commons License, all supplemental material carries the same license as the article it is associated with.
For non-Open Access articles published, all supplemental material carries a non-exclusive license, and permission requests for re-use of supplemental material or any part of supplemental material shall be sent directly to the copyright owner as specified in the copyright notice associated with the article.