
Abstract
In an educational field experiment, I study the role of peers’ study habits (a social norm nudge) and for-credit assignments (a market incentive) on student study effort and learning outcomes. I randomize students in a large-enrollment introductory economics course into one of four treatments: for-credit practice problems only, information about successful peers’ study habits only, for-credit practice problems paired with peer information, and control. The 2x2 experimental design allows me to assess whether peer information and for-credit incentives act as complements or substitutes. I find that for-credit alone works significantly better than peer information alone to improve study effort. Interestingly, peer information works better for men than women. The interaction of the study incentives works best to improve study effort for women. The findings of this study inform micro-targeted educational choice architecture which could help narrow gender performance disparities in economics courses.
Introduction
The gender gap in the field of economics has been a concern for economists and education specialists for many years. In particular, while some STEM fields have been able to close their gender gaps, the number of men economics majors is still significantly higher than the number of women majors at the undergraduate level. In part, this is due to the gender gap in performance; research shows that women respond more strongly than men when they receive a low grade in an economics class (relative to their other classes). In turn, women move away from the major while men persist toward economics degrees (Ahlstrom & Asarta, 2019). Thus, one way to close the gender gap for economics majors would be to close the gender gap in performance in introductory courses. Historically, women have scored lower in economics classes than men, but there may be ways to reverse this trend.
This paper investigates the effectiveness of two classroom interventions in a large (>250 students) introductory economics class. The first intervention, a social norm nudge, provides students with information about their peers’ study efforts. The second intervention, a market incentive, provides students with extra credit points if they meet certain study goals. I use a two-by-two experimental design that allows me to distinguish the effects of the nudge and the market incentive as well as analyze the interaction effect on both men and women. Importantly, students who are not assigned to the extra credit treatment in the experiment are given the opportunity to earn extra credit later in the term (to ensure fairness for all students in the class); this also allows me to determine whether the social norm effect persists.
Not surprisingly, I find that the market incentive has a higher impact on study effort than the nudge. However, the nudge by itself significantly increases study effort for men, and the effect persists after the nudge is removed. Interestingly, women are not affected by the nudge. This suggests that economics instructors who provide only nudge incentives to their students may be exacerbating the gender gap in their classrooms. On the other hand, the coupling of the market incentive and nudge works better for women when it comes to study intensity, and thus, instructors who provide extra credit (or another form of course credit) may be helping women. After the experiment is complete, the gender gap in exam performance is eliminated.
Behavioral nudges have been growing in popularity among researchers and policymakers even before Richard Thaler won the Nobel Prize in Economics in 2017. For example, field experiments have demonstrated the impact of nudges on incentivizing household energy conservation (Allcott, 2011; Ferraro & Price, 2011; Holladay et al., 2019; Schultz et al., 2007). In educational settings, instructors have used nudges to encourage student engagement and learning outcomes. These nudges can range from simple grade information (Smith et al., 2018) to information on career outlooks and relative grade distributions (Li, 2018).
There is also a growing body of work which looks at factors that influence college students’ study behaviors and their academic success (Angrist et al., 2009). Researchers have investigated how different mechanisms, such as requiring homework, affect student performance and retention rates (Chevalier et al., 2018; Grove & Wasserman, 2006). Randomized controlled trials are gaining in popularity in education studies (Wozny et al., 2018). Grodner and Rupp (2013) studied the role of for-credit assignments on learning outcomes in a field experiment and found that assigning grade weights to homework benefits college students’ learning outcomes. Lei (2013) also showed that offering small amounts of extra credit is sufficient to incentivize students to complete optional assignments. Further, Archer (2018) found that allowing multiple attempts for online homework problems can significantly increase learning outcomes as measured by exam scores. However, multiple attempts can also increase “guessing” and thereby crowd out study effort (Rhodes & Sarbaum, 2015).
This paper is at the intersection of these strains in the existing literature. The behavioral nudge strain examines various channels that can induce changes in study behavior; the mechanism design strain examines learning achievements through various for-credit or pecuniary incentives. However, little is known about the interaction of behavioral nudges and market incentives. Using a randomized controlled trial experimental design, I study the impacts of a social norm nudge and for-credit coursework and their interaction on students’ study habits, specifically highlighting the differences by gender. The findings of the experiment inform course design to increase student study effort, which is key to achieving learning outcomes; Allgood et al. (2015) state, “Perhaps the most effective way that [instructors] can increase student learning is to . . . increase student study time or effort.”
Additionally, this paper draws attention to ways that instructors can effectively deploy interactive study software, especially in economics courses. According to Asarta et al. (2021), the majority of introductory courses in the field are still taught using traditional “chalk and talk” lectures, but instructors are slowly moving toward adaptive learning platforms, among other pedagogy techniques, to complement their lectures. Further, Miller and Schmidt (2021) find that adaptive learning assignments positively affect student learning, but this depends on students’ willingness to consistently complete the assignments. Thus, it is important that instructors find effective ways to implement software learning platforms and motivate students to participate, especially in large sections. This paper provides insight into students’ study effort using one of the most popular online adaptive learning platforms for introductory economics courses.
The paper proceeds as follows. The Experimental Design section details the experimental design, including the treatments and procedures. The Results section highlights the results, and the Discussion section concludes. References and the appendix follow.
Experimental Design
The experiment is conducted in a large Introduction to Microeconomics course at an R1 university on the east coast of the United States. The three-credit course is taught face-to-face for 3 hours per week; additionally, the students complete weekly required assignments in the adaptive online learning software (Pearson MyLab). The students are mostly first-semester freshmen, and 43% are women. (Although I did not have any demographic information about the students prior to the experiment, I obtained the information from the Registrar’s Office after the semester was completed, including gender, year in college, High School GPA, and domestic vs. international student.). At the beginning of the semester, all students complete a consent survey to receive grade and performance information via email.
The objective of the experiment is to incentivize students to study the course material by completing optional practice problems in a special component of the online learning software called the “Study Plan.” (The optional practice problems are in addition to the weekly required assignments.) All students have access to the Study Plan at any time; however, many of them do not regularly use it. The treatments in the experiment include a social norm nudge, where students are told how many practice problems their successful peers are completing in the Study Plan, and a market incentive, where students can earn extra credit points for completing practice problems. The Study Plan otherwise does not have any direct grade impact for students. However, the data shows that students who engage with the Study Plan earn higher exam scores. (The results sections provides more details about exam scores.)
The course has three exams. After Exam 1, the students are randomly assigned to one of four treatments based on their Exam 2 score (i.e., within each grade range—A, B, C, etc.—students are randomly assigned to the four different treatment bins, so that each treatment contains an approximately equal number of students with each letter grade). The experiment takes place between Exam 2 and Exam 2 and focuses primarily on one module of material (“Module 1”). Thus, the treatments focus on incentivizing the students to complete practice problems in the Study Plan related to Module 1. Since some students receive extra credit for completing the problems, whereas others do not, the students who are not assigned to an extra credit treatment initially are able to earn extra credit in a subsequent module (“Module 2”). Although Module 2 is not part of the primary experiment, I am able to analyze that data for persistent effects of the norm treatment.
The students are not aware that they are participating in an experiment (i.e., the experiment is a natural field experiment (Harrison & List, 2004).) Instead, they are told that they may participate in an extra credit opportunity to earn 50 extra course points (out of 2500 total points possible). Students who are not in the initial extra credit treatments are told, “In order to manage the grading efficiently [in a large course], half of the students in this class received the extra credit opportunity this week. . . the other half of the students (including you) will receive the extra credit opportunity next week.” The purpose of this statement is to reduce student complaints during the experiment; it would not be ethical to offer extra credit to only a portion of the class.
Importantly, the randomization in this experiment is done at the individual student level, rather than the section level (i.e., all of the students in the experiment are registered for the same section and randomized into treatment based on their Exam 1 scores, as described above, rather than assigning different sections of the course to different treatments). This conscious design choice has several advantages. It avoids any issues related to section-specific effects, such as the time of day the section meets and the type of students who register for a particular section (e.g., athletes avoiding practice times). It also avoids any instructor effects; even if the instructor for multiple sections is the same, they may not teach the second or third section in an identical way, even unintentionally. On the other hand, one disadvantage of randomizing within a section is that students may communicate with each other and feel slighted about the conditions of their assigned treatment. However, I minimize this problem by providing the students with a reasonable explanation for their differing extra credit opportunity timelines: grading burden in a large section, as stated above. No students in the course expressed any concerns about this arrangement.
Communication with the students occurs via “email campaigns” from the instructor using Gmail’s Mail Merge service. All experiment instructions, reminders, and results are sent via this system. Thus, I am able to customize each email for each student; the emails always begin with the student’s first name (e.g., “Hello Alyssa”) and include individual performance information (e.g., “You worked 10 practice problems in the Study Plan for Chapter 6, and you answered 80% correctly”). This system allows me to communicate quickly with >250 students and helps to capture students’ attention by using their individual names and grades.
In total, there are 268 students registered for the course at the time of the experiment, and they all remain registered until the experiment is completed. Thus, exactly 67 students are assigned to each of four treatments. Table 1 illustrates the two-by-two experimental design. This procedure allows me to conduct a clean test of each incentive separately as well as the interaction of the incentives. Treatment 0 serves as the baseline control group. As stated previously, students in Treatments 0 and two have the opportunity to receive extra credit for a different section of material (Module 2) after the first part of the experiment is completed.
Experimental Design.

Social Norm Nudge Treatment
Nudges have been shown to affect behavior in a variety of circumstances. In particular, social norms, where a person is compared to their peers or neighbors, can encourage people to copy the behavior of others. In this treatment, I provide students with information about the study efforts of their successful peers, as well as a reminder of their own study efforts, to see if it increases uptake of student participation in the Study Plan. I use a reference module completed ahead of Exam 1 and the Exam 1 scores to create the social norm. Students in the Social Norm treatments (Treatments 2 and 3) are provided with the following information: Good to know: Students who scored 450 points or higher on Exam 1, and who actively worked the practice problems in the Study Plan, on average worked 26 problems in the Study Plan for Chapter 4, and they answered 90% of the problems correctly. Prior to Exam 1, you worked [X] problems in the Study Plan for Chapter 4, and you answered [X] percent of these problems correctly.
At the beginning of the semester, the students completed a survey about a variety of course elements, including their desired grade in the course. Ninety-five percent of the students in this course responded that they expect to get a grade of B or higher; the majority of students wanted A’s. Since the A-range was the goal for many, I use the A students as the reference point for the social norm (i.e., 450 points is the cutoff for an A on Exam 1). Then, each student’s own performance on the same section of the Study Plan is stated, so that each student is reminded of their performance relative to their peers’. (I am able to customize each student’s email with their problems worked using the aforementioned Mail Merge system.) Students in the Social Norm treatments receive this information, as well as specific instructions on how to access the Study Plan, with the initial email campaign and a reminder email campaign a few days later.
The social norm nudge most likely affects the study behavior of students who scored fewer than 450 points (less than an A) on Exam 1. (Students who scored As might already use successful study strategies and thus might not change their behavior in response to the nudge.) Note that 87% of students scored below 450 points on Exam 1, with 41% scoring in the B-range, 24% scoring in the C-range, and 22% scoring in the D- and F-range.
Extra Credit Treatment
Market incentives, such as monetary payments, usually work better than nudges to motivate behavior; I test whether that is true in the classroom setting. In this case, the market incentive is extra credit points added to a student’s overall grade in the course. The extra credit opportunity is all-or-nothing; the students must meet multiple standards to receive the extra credit points. If a student completes the required number of practice problems with the threshold correctness rate, they earn 50 extra credit points, which is equivalent to 2% of the overall course grade. Students in the extra credit treatments are sent the following information via email: There is an opportunity to earn 50 extra credit points in your Economics 101-010 class. To receive the 50 extra credit points, you have to: 1. Actively work at least 25 problems in the Study Plan for Chapter 6. 2. Achieve an average correctness rate of 85% on the problems you work in the Study Plan for Chapter 6. 3. You must meet these requirements by 11:59p.m. on Friday, October 19. At the end of the semester, the extra credit points will be added to your total points in this course.
By including both a quantity and quality requirement for the extra credit, students must seriously engage with the Study Plan (i.e., they cannot simply randomly answer enough questions to meet the quantity threshold, because they must also meet the correctness rate threshold for all questions they answer). These instructions, as well as specific information about how to access the Study Plan, are sent to students with the initial email campaign and a reminder campaign a few days later.
Experiment Timeline
The experiment consists of multiple email campaigns. Emails are sent to all students in the class for the first two campaigns (to avoid students talking with each other and thinking they missed important emails). For students who are not receiving extra credit with the current campaign, a different email is sent to let them know their extra credit opportunity is coming soon and (if the student is in Treatment 2) the social norm nudge information. Table 2 illustrates the experiment timeline; examples of the emails sent to students are in the appendix.
Experiment Timeline.
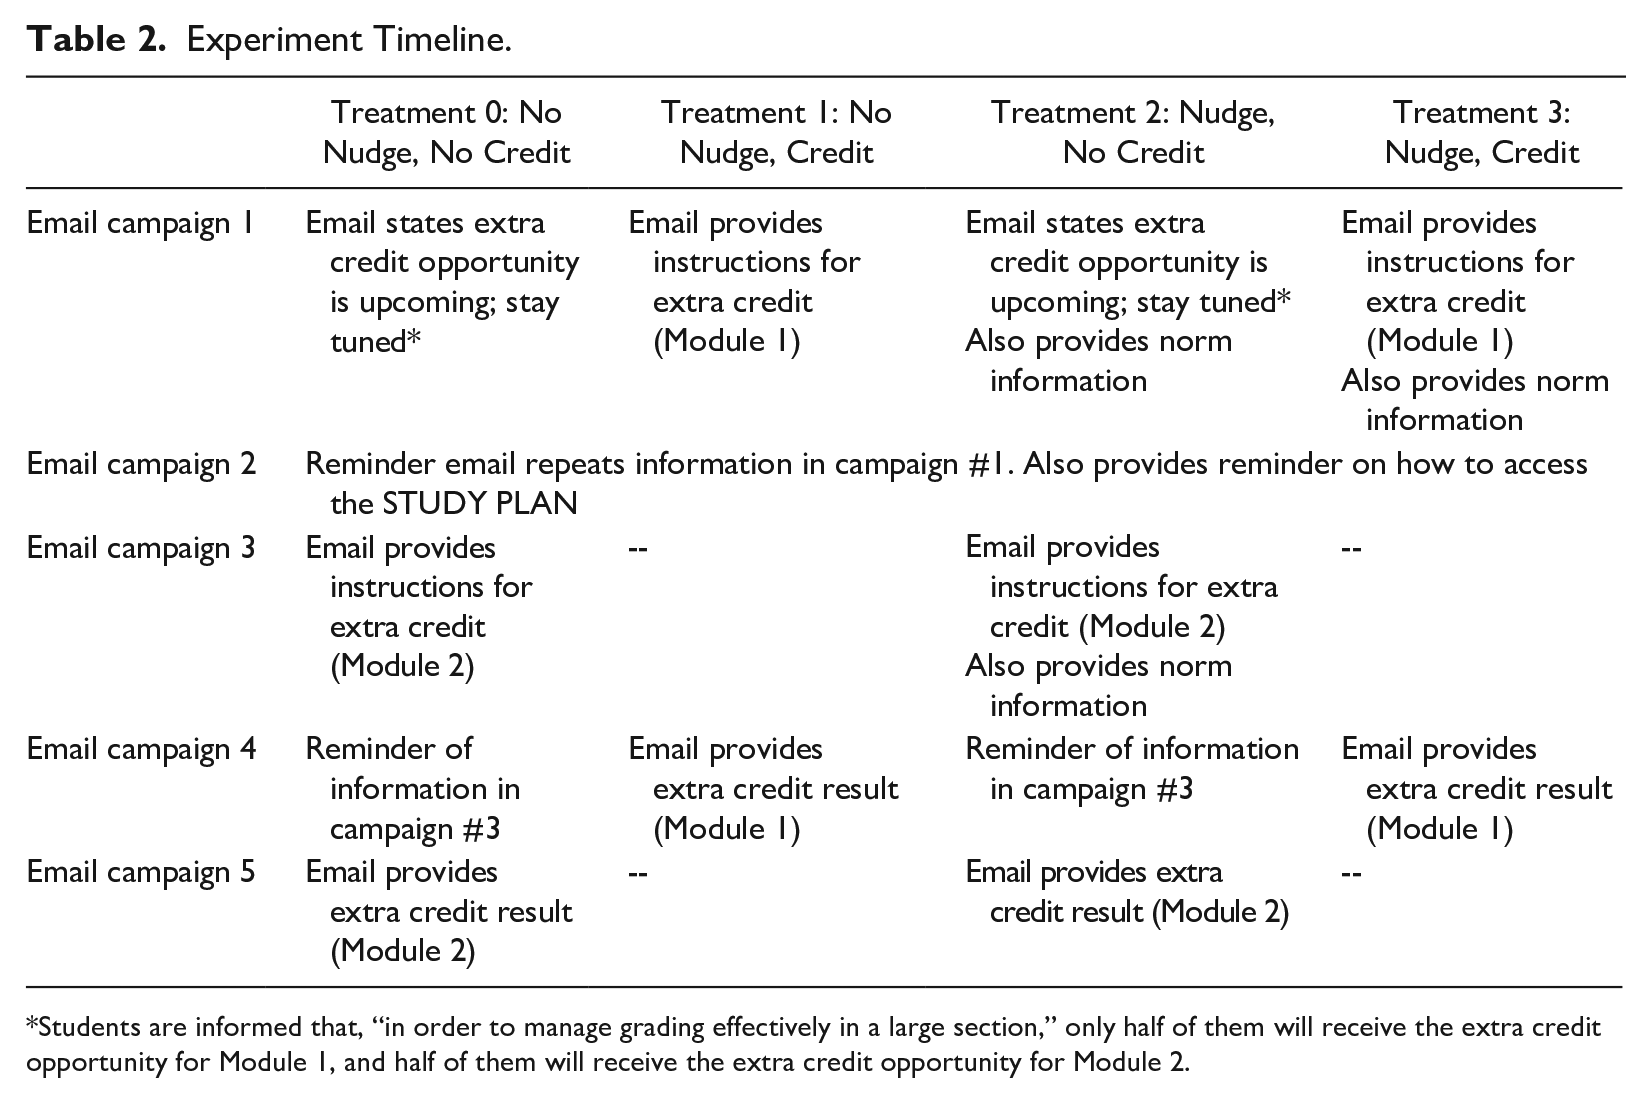
Students are informed that, “in order to manage grading effectively in a large section,” only half of them will receive the extra credit opportunity for Module 1, and half of them will receive the extra credit opportunity for Module 2.
Note that the experiment only officially comprises Campaign #1 and Campaign #2. This is a clean way to compare student behavior across treatments; I compare all treatments using the Study Plan data for Module 1. However, I also analyze the Module 2 data; although this is not a clean comparison across treatments, it can tell us how students respond to the removal of extra credit from Module 1 to Module 2 (for Treatments 1 and 3) and whether the norm effect persists after students are no longer reminded of norm information.
After a student’s due date for the extra credit occurs, they are sent a final email that contains their results, stating: You worked [X] practice problems in the Study Plan for Chapter [X] and you achieved an average correctness rate of [XX] percent on the problems you worked. Thus, you [do/don’t] receive 50 extra credit points.
This concludes the experiment. However, students are still able to work problems in the Study Plan at any time. It would be unethical to prevent students from accessing the Study Plan. Thus, I cannot connect the specific treatments in this experiment to the Exam 2 results. (A student could have worked Module 1 problems in the Study Plan after the experiment was complete. Although that student would not receive extra credit, they would still benefit from the extra knowledge gained before the exam.)
Instead, when I review the Exam 2 results, I compare students who engage with the Module 1 Study Plan at any time before Exam 2 (regardless of treatment) to students who do not engage with the Module 1 material in the Study Plan. I find that engaging with the Study Plan increases students’ performance on the Module 1 questions on the exam. However, this is not the primary objective of the experiment. Since we know that Study Plan engagement is beneficial for students, this experiment aims to test which intervention (social norm nudge or market incentive or both) has the biggest impact on students’ study efforts.
Hypotheses
I analyze two different measures of Study Plan utilization. The first one, engagement, is based on a student’s propensity to start the Study Plan (i.e., solve at least one problem). The second, study intensity, is based on the number of problems a student works in the Study Plan. Given the experimental design, I expect that students in the market incentive only treatment (Treatment 1) utilize the Study Plan for Module 1 more than students in the control treatment (Treatment 0). Likewise, if the social norm nudge is effective, I expect that students in the norm-only treatment (Treatment 2) utilize the Study Plan more than students in the control treatment (Treatment 0).
Hypothesis
(H0: Probability (T1) = Probability (T0); Ha: Probability (T1) > Probability (T0)).
Hypothesis
(H0: No. problems (T1) = No. problems (T0); Ha: No. problems (T1) > No. problems (T0)).
Hypothesis
(H0: Probability (T2) = Probability (T0); Ha: Probability (T2) > Probability (T0)).
Hypothesis
(H0: No. problems (T2) = No. problems (T0); Ha: No. problems (T2) > No. problems (T0)).
Conditional on the predictions above, I expect that the interaction of the market incentive and the norm nudge (Treatment 3) results in an even higher Study Plan utilization than either incentive by itself. This gives Hypotheses 3a and 3b below. I cannot predict whether there will be a gender gap for any of the treatments, but I do test this for each hypothesis. I also test the effects of the various demographics listed above.
Hypothesis
(H0: Probability (T3) = Probability (T1, T2); Ha: Probability (T3) > Probability (T1, T2)).
Hypothesis
(H0: No. problems (T3) = No. problems (T1, T2); Ha: No. problems (T3) > No. problems (T1, T2)).
Results
In this section, I describe the primary treatment effects (for Module 1), gender effects including the persistence of the norm effect in Module 2, and an analysis of the exam performance data before and after the experiment. First, Table 3 shows the demographic data for the sample, including the following: 43% are women students, 10% are international students, and the average high school GPA is 3.65. “Total Credit Hours” contains each student’s number of earned college credits; thus, it is a more detailed quantitative measure of year in college (freshman, sophomore, etc.).
Descriptive Statistics of Demographic Data by Experimental Treatment.

Notes: Standard deviations in parentheses. There are 60 (64, 64, 63) students with reported High School GPAs in treatment T0 (T1, T2, T3); missing values are replaced with the mean High School GPA. The random assignment of students to treatment (stratified by Exam 1 letter grades) created nearly identical distributions in terms of demographics. There are no statistically significant differences between treatments for gender and High School GPA (Wilcoxon rank-sum tests). There are two minor differences for international students and credit hours, but neither of these variables end up being statistically significant in the results. (T0 contains 10.4% more international students than T1 (Wilcoxon rank-sum test, p = 0.056), and on average, students in T0 have taken 7.9 fewer total credit hours than students in T3 (Wilcoxon rank-sum test, p = 0.044).).
Effectiveness of Study Incentives
Table 4 and the accompanying Figure 1 illustrate the treatment effects on students’ propensity to engage with the Study Plan. (If a student completed at least one problem in the Study Plan for Module 1 during the required time frame, they are coded as a “1”; otherwise “0”.) As stated before, nothing prevented students from completing problems in the Study Plan after the experiment was complete. However, for this first part of the analysis, I limit the data to student engagement with the Study Plan only during the time frame of email Campaigns #1 and #2. This ensures a clean comparison across treatments. Table 4 shows the results of a linear probability estimation; Model 1 estimates the average treatment effect for a student regardless of gender, whereas Model 2 separates the average treatment effect for men and women. The market incentive (i.e., “Credit”) is clearly more effective than the nudge (i.e., “Norm”) overall and for each gender.
Effect of Treatment on Propensity to Engage with Study Plan for Module 1.

Notes: Linear probability model; the dependent variable is a binary variable that equals one if the student worked at least one problem in the Study Plan, and zero otherwise. Robust standard errors are in parentheses. The constant in Model one captures the average treatment effect for a domestic student in T0 (with 0 total credit hours and a High School GPA of 0). The constant in Model two captures the average treatment effect for domestic men students in T0 (with 0 total credit hours and a High School GPA of 0). *p<0.10, **p<0.05, ***p<0.01.
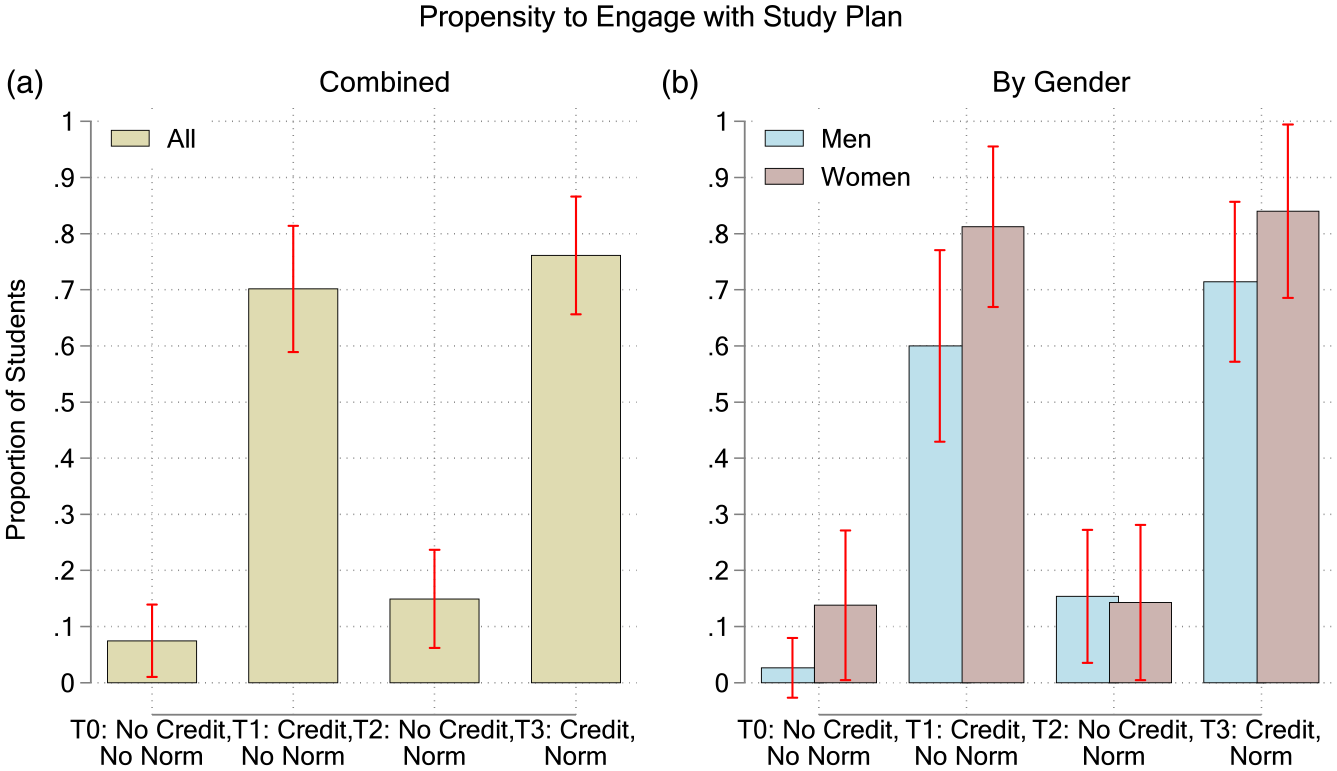
Propensity to engage with the Study Plan for Module 1, by treatment, regardless of gender (panel (a)) and by gender (panel (b)). The whisker bars denote the 95% confidence intervals.
In Model 1, students in Treatment 1 (Credit, No Norm) and Treatment 3 (Credit, Norm) are more likely to engage with the Study Plan than students in Treatment 0 (No Credit, No Norm) by 61% and 66%, respectively (p < 0.001 in both cases). These results hold for Model 2 as well, where the treatment effects are separated by gender. Therefore, I can reject the null for Hypothesis 1a (the market incentive increases engagement) for each gender and all students combined. However, Treatment 2 (No Credit, Norm) is not significantly different from Treatment 0 for all students combined. (I will discuss the gender effects later.) Thus, I cannot reject the null for Hypothesis 2a (the social norm nudge increases engagement) for all students combined.
While students in Treatment 3 are 59.6% more likely to engage than students in Treatment 2 (p < 0.001), Treatments 1 and 3 are not significantly different from each other, as determined by the post-estimation tests at the bottom of the table. Therefore, I cannot reject the null for Hypothesis 3a (the interaction effect). Notice that High School GPA is positively correlated with a student’s likelihood of engaging with the Study Plan. (For every one GPA point, students are, on average, 17.3% more likely to engage (p = 0.032).) On the other hand, total credit hours and a student’s international status have no impact on the propensity to engage.
Table 5 and the accompanying Figure 2 illustrate the treatment effects on study intensity, which is measured by the number of practice problems a student works in the Study Plan. Again, Model 1 estimates the average treatment effect for a student regardless of gender using an Ordinary Least Squares (OLS) estimator, whereas Model 2 separates the average treatment effect for men and women, also using OLS. The market incentive is again more effective than the nudge overall and for each gender. For example, students in Treatment 1 and Treatment 3 work more practice problems in the Study Plan than students in Treatment 0 by 23.7 problems and 21.8 problems, respectively (p < 0.001 in both cases). Therefore, I can reject the null for Hypothesis 1b.
Effect of Treatment on Number of Problems Worked for Module 1.
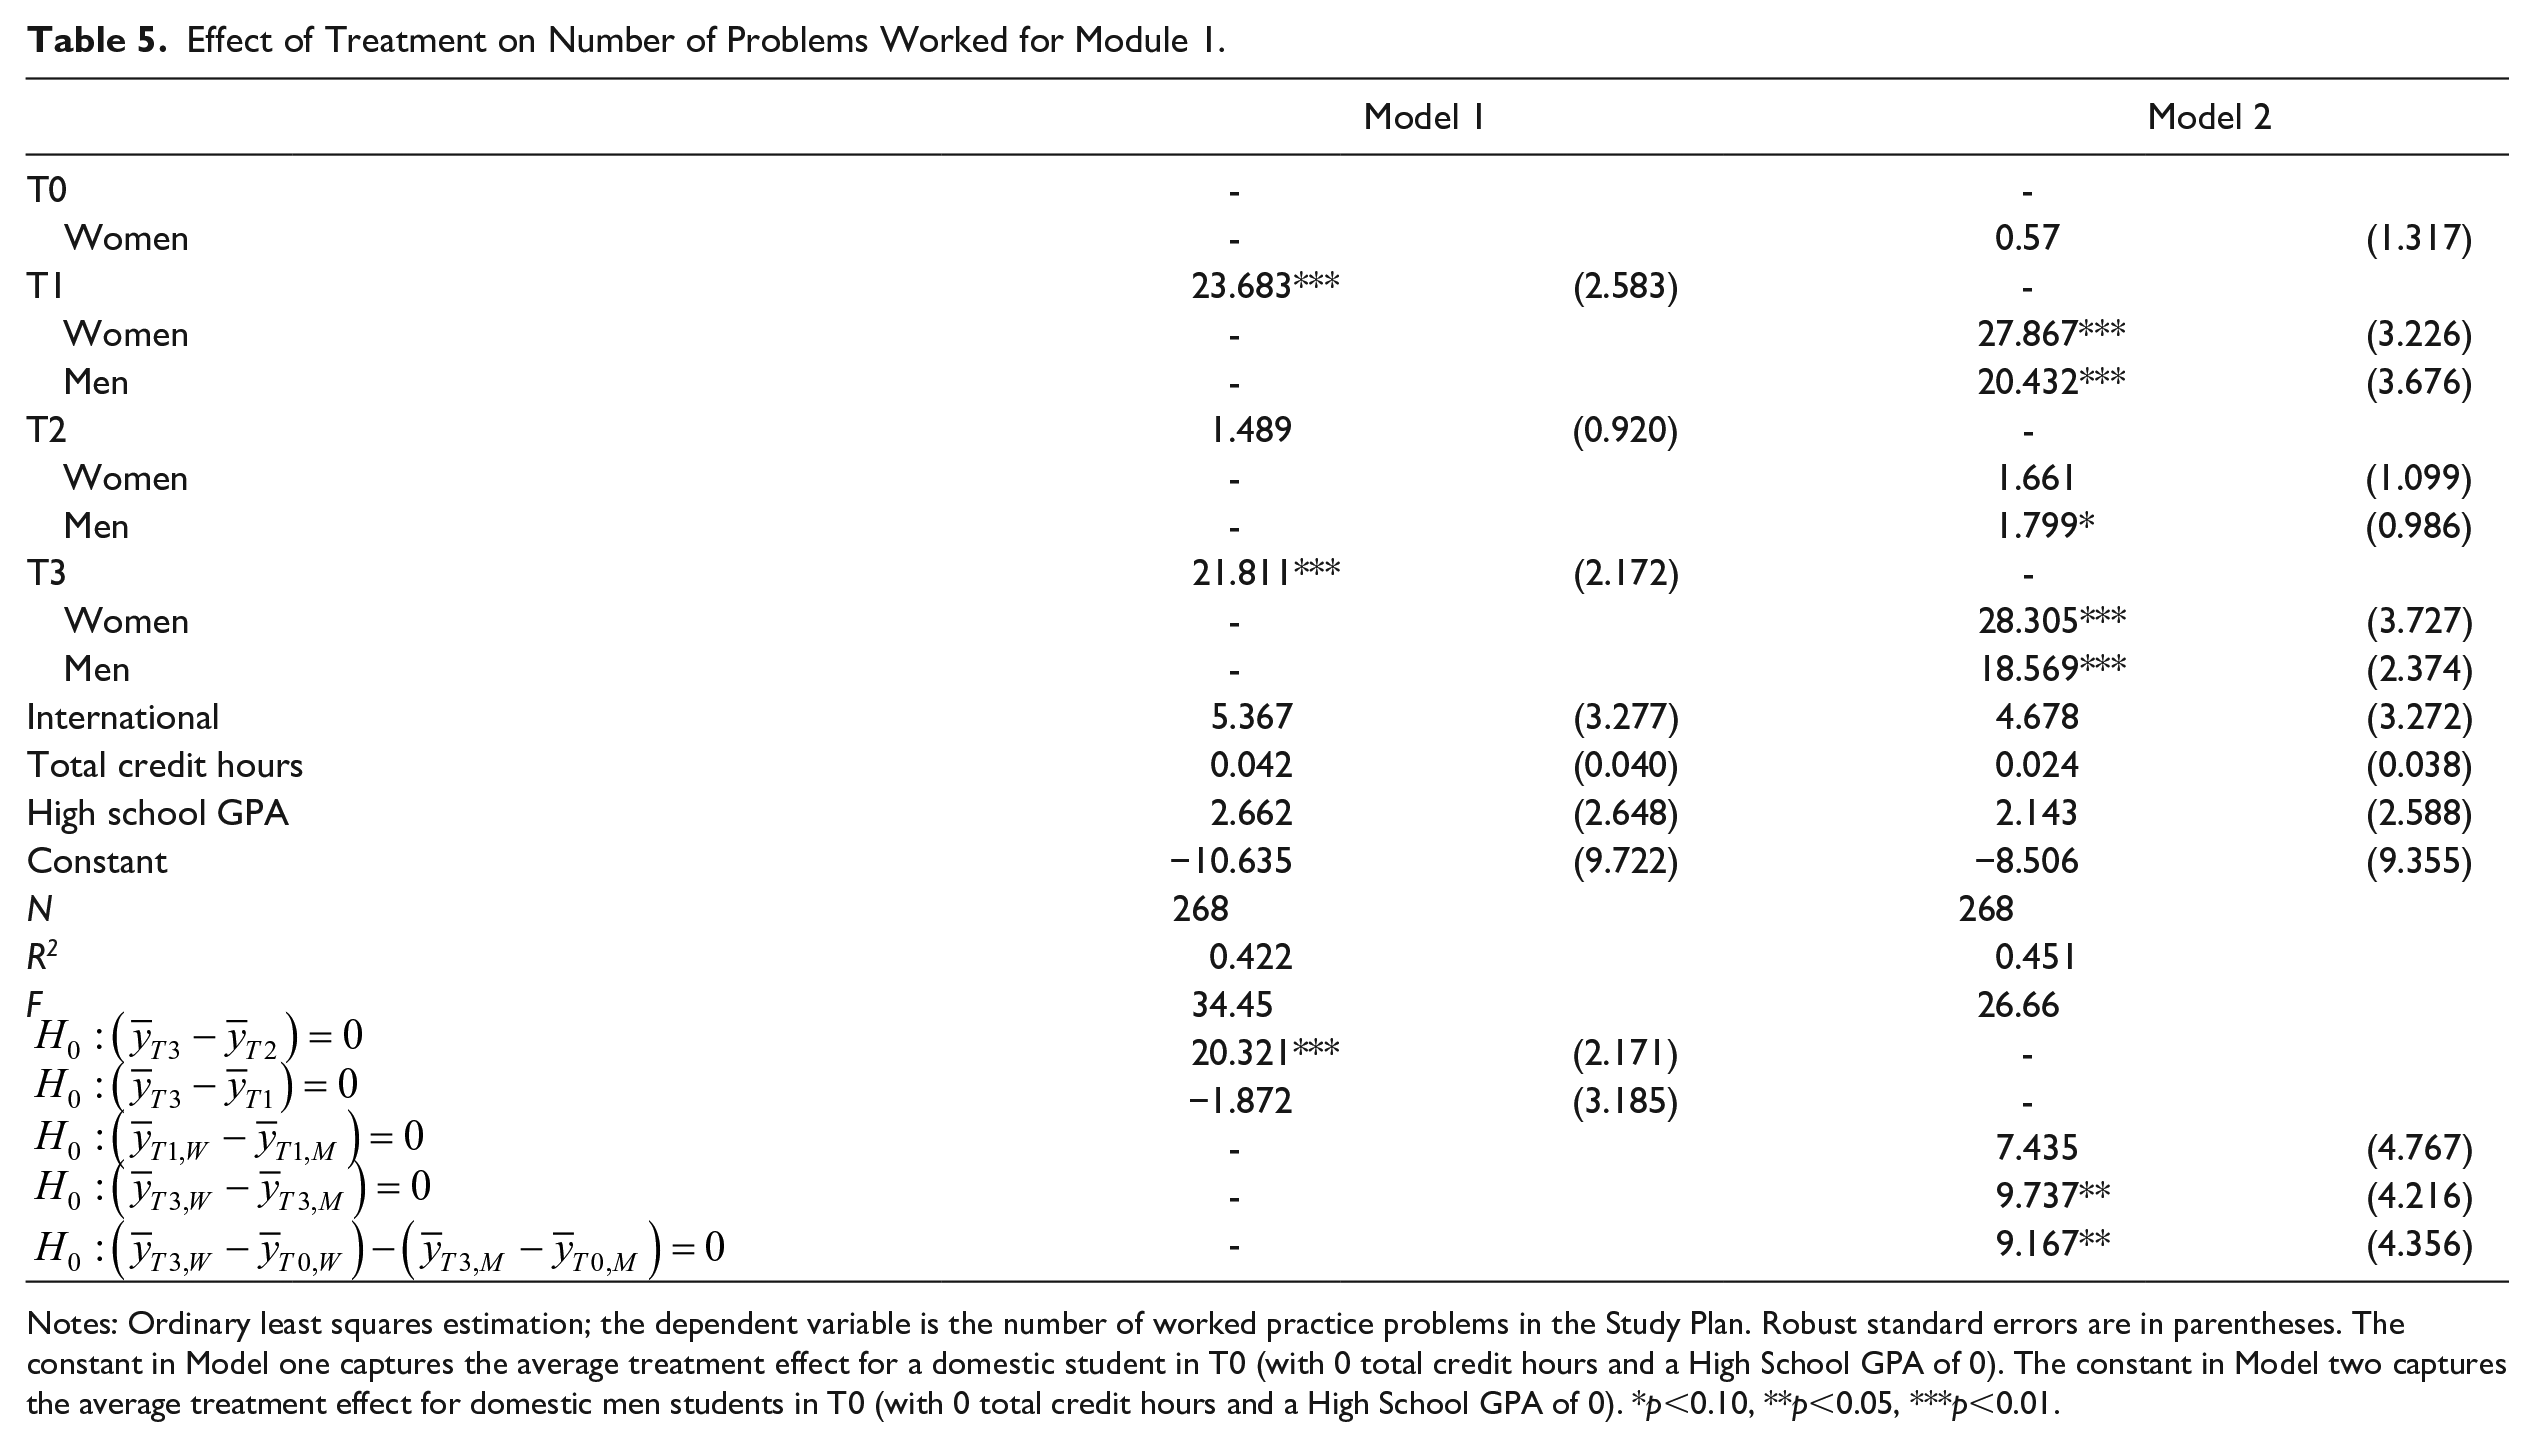
Notes: Ordinary least squares estimation; the dependent variable is the number of worked practice problems in the Study Plan. Robust standard errors are in parentheses. The constant in Model one captures the average treatment effect for a domestic student in T0 (with 0 total credit hours and a High School GPA of 0). The constant in Model two captures the average treatment effect for domestic men students in T0 (with 0 total credit hours and a High School GPA of 0). *p<0.10, **p<0.05, ***p<0.01.

Average number of worked Study Plan problems for Module 1, regardless of gender (panel (a)) and by gender (panel (b)). The dotted line denotes the minimum number of worked problems (25) to receive the extra credit points. The whisker bars denote the 95% confidence intervals.
However, Treatment 2 is not significantly different from Treatment 0 for all students combined; I cannot reject the null for Hypothesis 2b. (I will discuss the gender effects later.) Likewise, I cannot reject the null for Hypothesis 3b; while students in Treatment 3 work 20.3 more problems than students in Treatment 2 (p < 0.001), Treatments 1 and 3 are not significantly different from each other.
Result
Result
Gender Effects
As Figure 1 illustrates, it appears that women are more likely to engage with the Study Plan than men in Treatment 0 (No Credit, No Norm), Treatment 1 (Credit, No Norm) and Treatment 3 (Credit, Norm). The difference is weakly statistically significant for Treatment 1, but not Treatments 0 and 3. Table 4 provides the results of a post-estimation test for men versus women in Treatment 1; women are 21.5% more likely to engage (p = 0.052). However, this result does not hold up when the default gender gap, which is seen in Treatment 0, is taken into account. (That is, a difference-in-difference post-estimation test of [Treatment 1, Women – Treatment 0, Women] – [Treatment 1, Men – Treatment 0, Men] is not statistically significant.) Thus, the default gender gap carries over into Treatment 1.
Interestingly, though, the gender gap is statistically significant in Treatment 3 for the number of problems worked (Figure 2), even when taking the default gender gap into account. Table 5 provides the result of a difference-in-difference post-estimation test that shows women work 9.2 more problems than men (p = 0.036) in Treatment 3, net of the gender difference in Treatment 0. Thus, the combination of the market incentive and the social norm nudge is more beneficial for women than men.
Result
Figures 1 and 2 illustrate that men’s study effort appears to increase in response to the social norm nudge alone (i.e., Treatment 2, Men is higher than Treatment 0, Men for both measures of study effort). While these effects are only weakly statistically significant, it is notable that the social norm alone affects men but not women. (Men in the norm-only treatment (Treatment 2), are, on average, 12.1% more likely to engage with the Study Plan than men in Treatment 0 (p = 0.058). Likewise, men in Treatment 2 work, on average, 1.8 more problems than men in Treatment 0 (p = 0.069).) Therefore, I can reject the null for Hypotheses 2a and 2b for men only.
To test whether the norm effect for men persists after the norm information is removed, I turn to the data on Module 2 (i.e., in the time frame of email Campaigns #3–5). Note that students in Treatment 3 no longer received any norm information after email Campaign #2, students in Treatment 1 never received any norm information at all, and students in Treatments 1 and 3 both received the extra credit opportunity for Module 1 but not Module 2. Therefore, in the period of data that I am analyzing, Treatment 1 becomes “No Credit, No Norm,” and Treatment 3 becomes “No Credit, Norm.” Table 6 and the accompanying Figure 3 demonstrate that the norm effect for men is present during this time period (Module 2). Table 6 shows the results of a linear probability estimation; Model 1 estimates the average treatment effect for a student regardless of gender, whereas Model 2 separates the average treatment effect for men and women. The dependent variable is whether a student worked at least one problem in the Module 2 Study Plan (i.e., the same as Table 4, but with the Module 2 data). Men in Treatment 3 (No Credit, Norm) are 12.6% more likely to engage with the Study Plan (p = 0.016) than men in Treatment 1 (No Credit, No Norm). The effect is not statistically significant for women.
A comparison of Figures 1 and 3 shows that students who received the extra credit opportunity initially decreased their engagement with the Study Plan after the extra credit was removed. Thus, while the social norm seems to have a lasting impact on men, the market incentive has little (if any) lasting impact on either gender. (It is possible that a repeated market incentive would lead to better habit formation, and this remains to be answered in future research.)
Effect of Treatment on Propensity to Engage with Study Plan for Module 2.

Notes: Linear probability model; the dependent variable is a binary variable that equals one if the student worked at least one problem in the Study Plan, and zero otherwise. Robust standard errors are in parentheses. The constant in Model one captures the average treatment effect for a domestic student in T0 (with 0 total credit hours and a High School GPA of 0). The constant in Model two captures the average treatment effect for domestic men students in T0 (with 0 total credit hours and a High School GPA of 0). *p<0.10, **p<0.05, ***p<0.01.
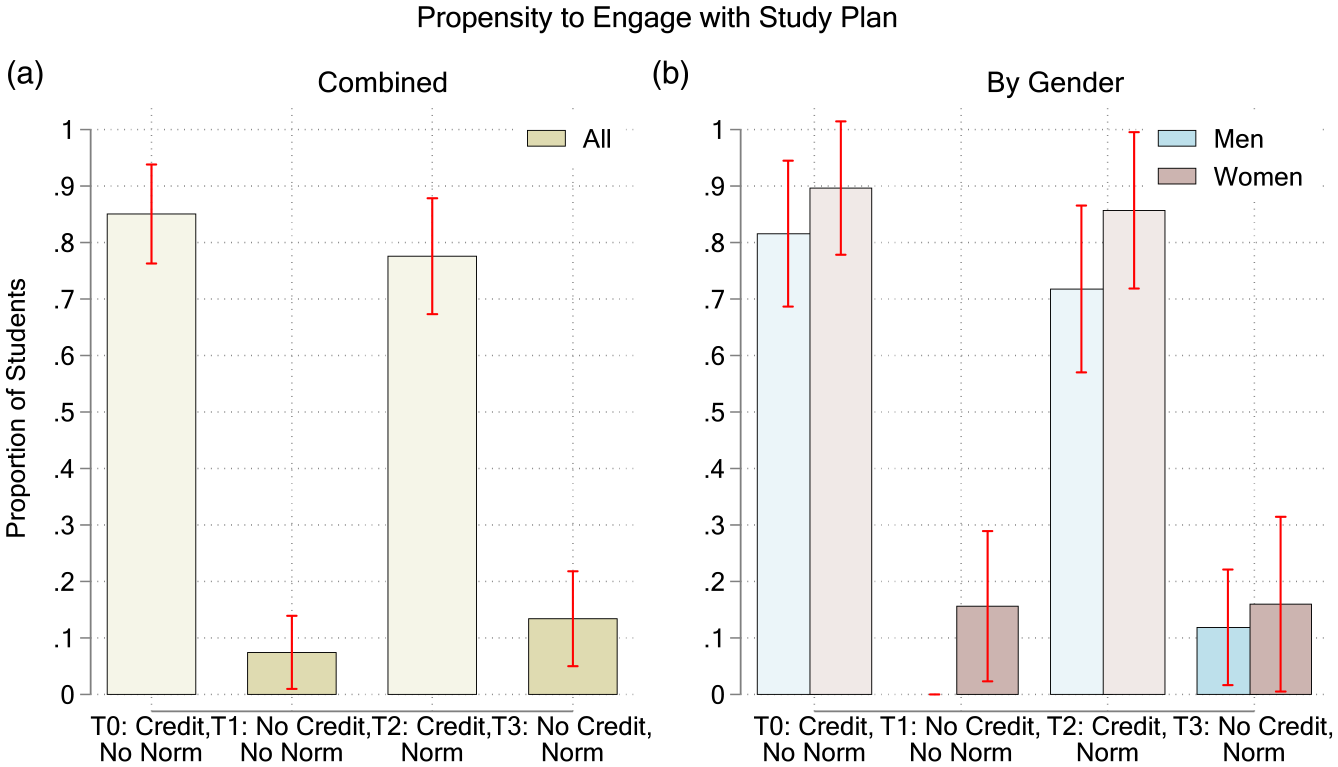
Propensity to engage with the Study Plan for Module 2, regardless of gender (panel (a)) and by gender (panel (b)). The whisker bars denote the 95% confidence intervals. The bars in T0 and T2 are shaded lighter to indicate that these groups were not treated with the market incentive during the initial stage of the experiment (Module 1), but they do receive the market incentive in this Module 2 data.
Result
Result
As stated in the Experimental Design section, students who scored a grade of A (450 points or higher) on Exam 1 are less likely to alter their study strategies in response to the social norm nudge. Therefore, as a robustness check, I replicate the main estimations in Tables 4 and 5 using a restricted sample that excludes students who scored 450 points or higher. Tables B1 and B2 show the results of the restricted sample estimations. There are no major differences between the restricted sample and the full sample, indicating that the results are robust. (There are a few minor differences in p-values and the magnitudes of some coefficients, but all the results are still significant.)
Exam Performance
I turn now to the students’ exam performance. First, I determine whether the Study Plan leads to better learning outcomes, measured by students’ performance on Exam 2 questions covering Module 1 and Module 2 data. As stated previously, I cannot tie the experiment treatments directly to the Exam 2 data, because students are still able to work problems in the Study Plan after the experiment is complete. (It would be unethical to prevent students from accessing the Study Plan.) For example, a student could have worked Module 1 problems in the Study Plan during the week before Exam 2; although the student would not receive extra credit, they might still benefit from the extra knowledge gained before the exam.
Instead, when I review the Exam 2 results, I compare all students who engage with the Module 1 Study Plan at any time before Exam 2 (regardless of treatment) to students who do not engage with the Module 1 material in the Study Plan. I find that engaging with the Study Plan (weakly) increases students’ performance on the Module 1 questions on the exam. Table 7 shows the average correctness rate for Module 1-related and Module 2-related questions on Exam 2, by Study Plan engagement. Thus, the Study Plan seems to be effective for learning. The increased learning effect is not significant for the Module 2 material. However, the Module 2 material was a particularly difficult topic, and Module 2 occurred closer to Exam 2; therefore, students may not have benefitted as much as from Module 1, since the Study Plan was not completed as far in advance. Future research could investigate this further with a larger sample size, which could potentially affect the statistical significance.
Exam 2 Performance on Module 1 and Module 2 Questions, by Study Plan Engagement.
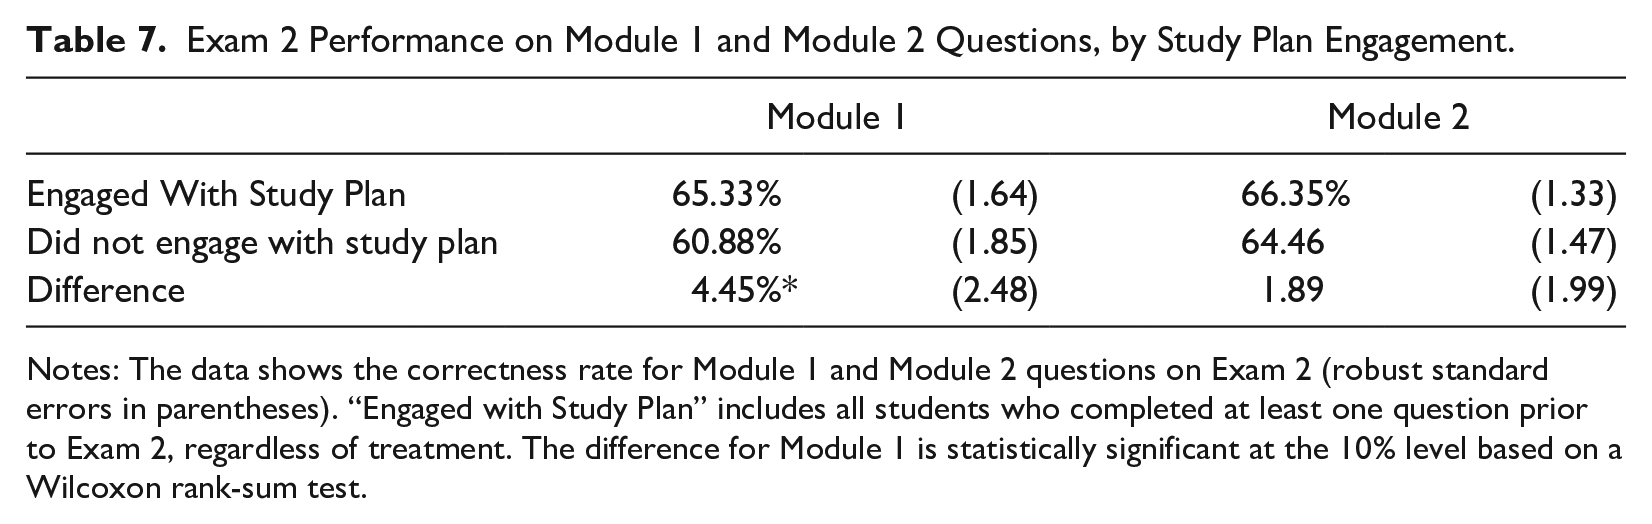
Notes: The data shows the correctness rate for Module 1 and Module 2 questions on Exam 2 (robust standard errors in parentheses). “Engaged with Study Plan” includes all students who completed at least one question prior to Exam 2, regardless of treatment. The difference for Module 1 is statistically significant at the 10% level based on a Wilcoxon rank-sum test.
Result
Second, I investigate the gender gap in exam performance. On Exam 1 (pre-experiment), women students scored 6.66% lower than men on average. This difference is statistically significant at the 1% level (Wilcoxon rank-sum test; p < 0.001). On Exam 2 (post-experiment), women scored 2.18% lower than men on average; however, this is not statistically different from zero (Wilcoxon rank-sum test; p = 0.24). Therefore, the gender gap closed between Exam 1 and Exam 2.
Table 8 shows the estimation results from an OLS model, where the dependent variable is the difference between a student’s Exam 2 and Exam 1 percentage scores. The results show that women improve their exam scores, on average, by 4.02% more than men (p = 0.014). Although I cannot draw a causal link between the experiment and the exam scores, I did find that women worked more problems than men in response to Treatment 3 (Credit, Norm). Thus, this intervention could be partly responsible for closing the gender gap in exam score, and a course design that uses this intervention could be helpful in introductory economics.
Effect of Demographics on Exam Score Improvement.
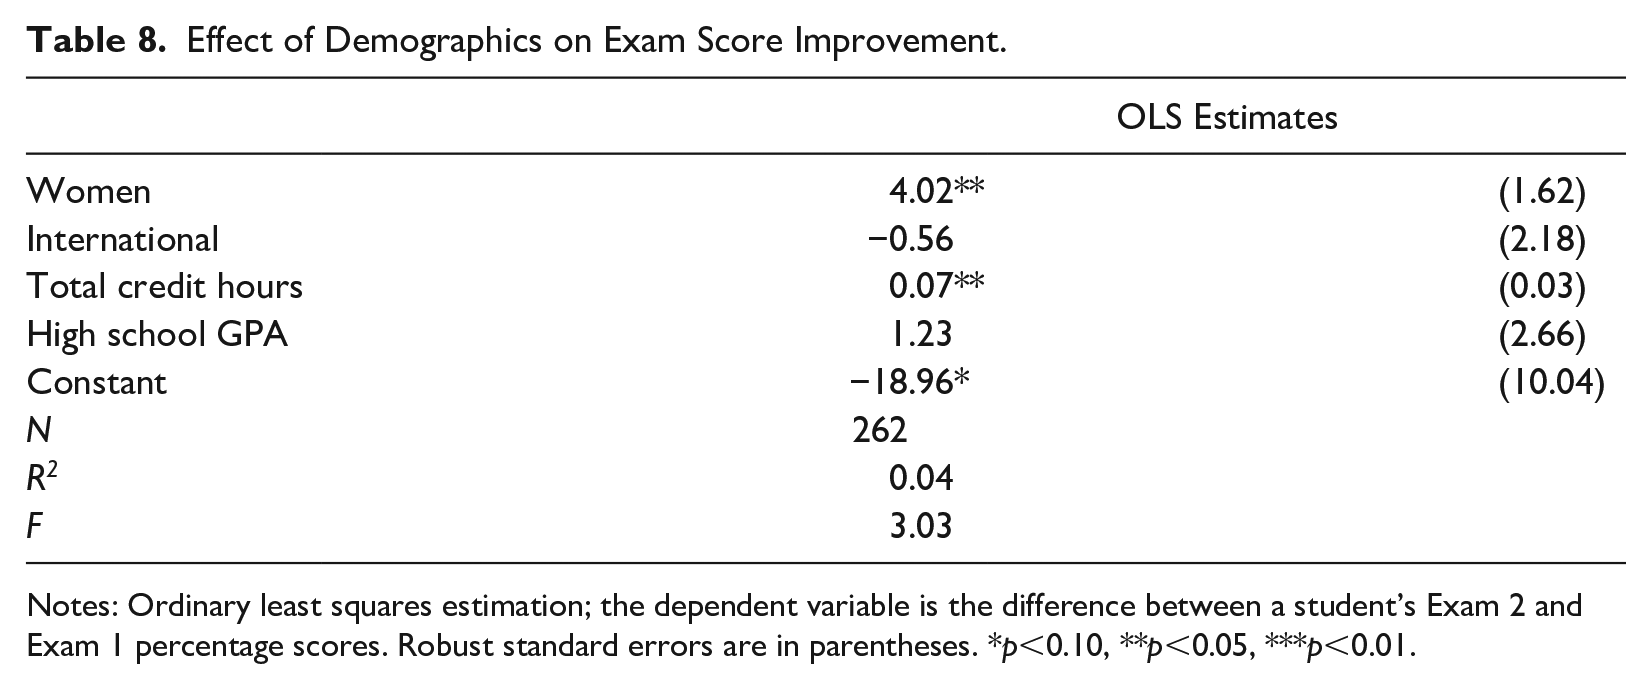
Notes: Ordinary least squares estimation; the dependent variable is the difference between a student’s Exam 2 and Exam 1 percentage scores. Robust standard errors are in parentheses. *p<0.10, **p<0.05, ***p<0.01.
Discussion
This paper investigates the effectiveness of two classroom interventions, a social norm nudge and a market incentive, in a large introductory economics class. I use a randomized controlled trial to rigorously distinguish the effects of the nudge and the market incentive. My experimental design also allows me to analyze the interaction effect of the interventions as well as the impact of various demographics. Given the ongoing gender disparity in the economics field, I pay special attention to the different reactions that men and women have to the treatments.
I find that the market incentive has a higher impact on study effort than the nudge for all students. Thus, for-credit assignments are most beneficial if an instructor can incorporate them. However, the nudge by itself significantly increases study effort for men, and the effect persists after the nudge is removed. Interestingly, women are not affected by the nudge. This suggests that economics instructors who provide only nudge incentives to their students may be exacerbating the gender gap in their classrooms. This result is in line with a recent field experiment, in which Clark et al. (2020) found that men responded to a behavioral, task-based study-goal intervention, whereas women did not, which “increased the gender gap in performance.” Thus, instructors should exercise care when implementing behavioral interventions such as nudge architecture. One limitation of my study is that my nudge provides only social comparison information to students; other nudges, such as framing effects, could be examined in future work.
I also find that the combination of the market incentive and the nudge works better for women than for men when it comes to study intensity (i.e., the number of practice problems students choose to complete). This result holds even when taking the default gender gap into account. (By default, women work more practice problems than men.) Thus, instructors who provide extra credit (or another form of course credit) coupled with a nudge may be helping women. Although I cannot directly tie my experimental treatments to students’ exam results, after the experiment is complete, the gender gap in exam performance is eliminated.
Future work could investigate nudges and market incentives (and, importantly, their interaction) in terms of learning outcomes in a more rigorous way than the current study. It is difficult to design an experiment that cleanly separates students’ opportunities for course credit and is simultaneously fair to all students enrolled in the course. (If one group receives a for-credit opportunity and another does not, then some sort of grade compensation must occur.) Still, given the promising nature of the market incentive and nudge combination in this paper, it may be worth further investigation, both in terms of study effort and learning outcomes and exam performance.
Footnotes
Appendix
Acknowledgements
The University of Delaware Institutional Review Board determined this study to be of Exemption Category one according to federal regulations.
Declaration of conflicting interests
The author(s) declared no potential conflicts of interest with respect to the research, authorship, and/or publication of this article.
Funding
The author(s) received no financial support for the research, authorship, and/or publication of this article.