



Abstract
Thailand is the world’s second largest exporter of sugar, and under the 10-Year Cane and Sugar Strategy (2015–2024), the Thai government has granted an expansion of 13 new sugarcane factories. While most research focuses on the environmental consequences of sugarcane production, this paper examines the potential socioeconomic impact of a proposed sugarcane factory on a nearby (base) village by comparing it to a similar (treatment) village within the same region near an existing sugarcane factory. We find that treatment villagers have higher household income mainly due to their sugarcane-based village economy. They also disclose better perceived environmental quality while results for perceived health status are mixed. Yet, base villagers report higher perceived quality of life, likely due to factors beyond the socioeconomic conditions investigated in this study. Thus, the presence of a sugarcane factory, while socioeconomically favorable, may compromise other aspects of village life that contribute to its overall quality.
Introduction
Thailand is the world’s second largest exporter of sugar, annually exporting over seven million tons—close to 75% of domestic production (Sriroth et al., 2016). Under the 10-year Cane and Sugar Strategy (2015–2024), the Thai government approved the construction of 13 new sugarcane factories to add to the country’s existing 55 factories (Manivong & Bourgois, 2017). As Thailand develops its bioeconomy, there is a shift toward the industrialization of agriculture by increasing the use of agrochemicals, mechanizing farming, and investing into technology to maximize sugarcane byproducts such as biofuel and bioelectricity (Waramit, 2012). Leading this change is Mitr Phol Group, Thailand’s largest and the world’s fifth largest producer of sugar (Mitr Phol Group, 2017).
In 1994, Mitr Phol built a sugarcane factory in Phu Viang district of Khon Kaen province. As of May 2019, it intends to build another factory in nearby Ban Phai district as part of its plan to expand business across the Northeast region, which already has 21 factories—the biggest number out of all regions (The Isaan Record). While there is much research that focuses on the environmental consequences of intensive sugarcane farming, this paper examines the socioeconomic implications of constructing a sugarcane factory in Ban Phai district on the nearby village of Mueang Phia.
The study compares the socioeconomic conditions of Mueang Phia (base village) to that of Ban Kaeng (treatment village) in Phu Khieo district, Chaiyaphum province. The latter was chosen primarily because it is located near another Mitr Phol sugarcane factory in Phu Khieo district. Additionally, Mueang Phia and Ban Kaeng display important similarities in terms of population, number of households, regional geography (terrain, tree cover, access to water, vegetation, etc.), and climate. However, a notable difference is that the distance between Ban Kaeng to the existing Phu Khieo factory is much farther than the distance between Mueang Phia and the proposed Ban Phai factory site. 1 This difference is accounted for when analyzing the data.
First, we find that average household income is significantly higher in the treatment village than in the base village, due to a specialization in sugarcane farming in the treatment village. Second, treatment villagers perceive higher environmental quality, despite potential environmental harm from sugarcane production. Third, treatment villagers perceive lower overall health, even though they have higher ratings for the various physical, mental, and emotional aspects of health. Finally, despite lower economic and environmental indicators, base villagers are happier with their overall quality of life as compared to treatment villagers. Thus, the presence of a sugarcane factory, while socioeconomically favorable, may compromise other aspects of village life that contribute to its overall quality.
The next section is a literature review. The subsequent section discusses the methodology and data collection. The fourth section describes the raw data and adjusting the sample for analysis. The fifth section provides the analytical results for mean difference tests and the regression framework. The sixth section contains the text analysis. The final section concludes with a summary and possible future research. The appendix has tables.
Literature Review
Sugarcane in Thailand
Sugarcane is an important crop for Thailand’s bioeconomy. It is mainly supplied as a raw material for the sugar industry, but it has a wide variety of other uses such as ethanol fermentation from molasses, electricity generation from bagasse, paper products from pulp, fertilization from vinasse, and polylactic acid (PLA) or bioplastic (Sriroth et al., 2016; Waramit, 2012). The Thai government has adopted a holistic approach to promoting sugarcane production through direct and indirect policy instruments including ethanol-focused energy development plans to reduce dependence on fossil fuels imports (DEDE, 2015), agricultural land zoning to indicate suitable land for sugarcane cultivation (Boonyanam, 2018), and the Cane and Sugar Act of 1984 to establish the revenue-sharing system between farmers and mills as well as provide subsidies for sugarcane prices (NaRanong, 2013). The transition to sugarcane and biofuel offers development opportunities to the poorer and more rural Northeast region of Thailand—locally known as Isaan—by creating additional employment and developing infrastructure (Lakapunrat & Thapa, 2017).
Three major strengths of Thailand’s sugarcane industry are 1) strong government policy on crop zoning, 2) centralized organizations for growers, millers, and government, and 3) collective knowledge from research institutes (Sriroth et al., 2016). On the other hand, Thailand is one of the less successful countries in adopting new technologies (Iamratanakul, 2014). This problem combined with an inadequate labor force has led to sugarcane farmers burning their crops before manual harvesting to avoid the serrated leaves of the cane stalk. Furthermore, productivity per hectare is still relatively low compared to other sugar producers and exporters (Chunhawong et al., 2018). Many studies assess the production and harvesting practices of sugarcane in Thailand (see Pongpat et al., 2017; Pornprakun et al., 2019; Tukaew et al., 2015; Ullah et al., 2019), while others focus on the progress of adopting machinery among sugarcane farmers (see Chaya et al., 2018; Usaborisut, 2018). Reducing production costs will allow Thailand to remain competitive in the sugar market and expand its related industries.
Sugarcane is also the primary input crop for ethanol production in Thailand. The commercialization of ethanol and other forms of bioenergy, which is driven by government policy and production targets, has fueled the expansion of sugarcane plantations across the Northeast region (Gheewala et al., 2019; Kumar et al., 2013; Lakapunrat & Thapa, 2017; Waramit, 2012). However, this expansion has raised significant concerns over the environmental sustainability of extensive sugarcane farming (Gheewala et al., 2014; Hartemink, 2008; Silalertruksa et al., 2017). The importance of sugarcane to the development and promotion of Thailand’s bioeconomy is a central aspect of the industry as it contextualizes the relevance of constructing new sugarcane factories.
For rural households, the introduction of a sugarcane factory offers economic opportunities outside of traditional food crops such as rice. In a survey of 230 sugarcane farmers in Nong Bua Lamphu province, Lakapunrat & Thapa (2017) find that rice farmers converted up to 75% of their land to cultivate sugarcane for reasons such as financial attractiveness of the crop, accessibility to knowledge and resource services, and reasonable distance to a factory. In contrast, Prasara-A & Gheewala (2016) surveyed 87 farm owners and laborers across three Northeastern provinces and revealed that working conditions of jobs in sugarcane farming tend to be poorer than of those in rice farming. A case study by Sawaengsak & Gheewala (2017) surveyed 105 sugarcane farmers in three sites across Nakhon Ratchasima province and identified nine social and socioeconomic topics that were most important to the farmers: labor use, labor cost, production cost, access to knowledge on sugarcane production, access to monetary support, access to natural resources, land rights, land use, and income. A laundry list of other environmental and socioeconomic issues from sugarcane production includes chemical contamination from current farming practices, processing and storing sugarcane waste, traffic and pollution from trucks transporting sugarcane, water stress and deprivation from increased irrigation, land grabbing, health impacts on livestock, and contract farming (Aaron et al., 2019).
The few available studies on the socioeconomic impact of sugarcane farming in Thailand are naturally focused on sugarcane farmers themselves. While this direct examination allows for closer analysis of the benefits and drawbacks of sugarcane farming, it tends to neglect the community-wide impact that sugarcane plantations and a sugarcane factory can have on a nearby village. This study fills this gap in knowledge by attempting to capture the differences between a village that has not adopted sugarcane farming into its economic system and one that has already been integrated into the sugarcane supply chain. The survey achieves this community-wide perspective by including households that work in all sectors of the economy—agriculture, industry, service, and other. Moreover, the overall community impact of the sugarcane factory is further evaluated by exploring social aspects of the two villages such as perceived environmental quality and health status, which draw from the literature of subjective well-being (SWB) and are not covered in previous studies of the sugarcane industry in Thailand.
Subjective Well-Being
There is a growing body of research in economics that examines the well-being of people beyond income. Often described as happiness or SWB, this multidimensional indicator encompasses a range of economic, social, environmental, health, and psychological factors that are measured both objectively and subjectively (Conceição & Bandura, 2008). Governments have begun to consider SWB as a possible measure to appraise and inform public policy (Dolan & Metcalfe, 2012), because well-being research offers an alternative method to evaluate the benefits from public goods as well as insight into areas that involve suboptimal consumer behavior (Odermatt & Stutzer, 2017).
The literature investigates the relationship between SWB and income to understand how economic status affects individual happiness. In his seminal paper, Easterlin (1974) observes the relationship between self-reported happiness and income and found that, in a cross-section of time, happiness increases with income but has rapid decreasing returns after a certain income threshold (a curvilinear relationship). However, in the same study, happiness over time was essentially flat and irresponsive to sustained increases in GDP per capita, and this became known as the “Easterlin paradox.” The basic explanation offered by Easterlin (1995) is that happiness is based on relative, not absolute, income, and that humans adapt to changes in income over time.
An important part of SWB research emphasizes the role that perceptions play in happiness, particularly for aspects of life such as environment and health. For instance, Sulemana et al. (2016) use survey data from both African and developed countries to discover that people are less happy if they perceive their local environment to be poor, while global environmental problems reduce happiness only among respondents from developed countries. Zhang et al. (2017) find that bad air quality in China lowers short-term happiness but does not greatly affect overall life satisfaction. This finding contributes to the Easterlin paradox by demonstrating that the long-term emotional impact of unfavorable circumstances is attenuated through a process known as hedonic adaptation (Frederick & Loewenstein, 1999).
In addition to perceptions of the environment, self-assessments of health have been found to be reliable and stable measures of health with even some predictive power (Shields & Shooshtari, 2002). In the study by Hunt et al. (1981), four groups of elderly people were differentiated according to their perceived health status which also accorded with their objective health status, supporting the view that perceptions of individual health are realistic. According to Sironi & Wolff (2021), social isolation influences the deterioration of perceived health status. Moreover, Sun et al. (2016) find that SWB varies strongly with perceived health status and that anxiety/depression is most important for SWB.
Drawing from the literature of subjective well-being, this study explores villager perspectives of environment and health alongside measurements of household income to compare the overall quality of life of two villages in Northeast Thailand.
Methodology and Data
Research Design
The ideal experimental design to evaluate the socioeconomic impact of a sugarcane factory on a village would be a longitudinal study covering a treatment village (with a sugarcane factory) and a control village (without a sugarcane factory) both before and after the opening of the plant. Under the assumption that “all other things are equal” between the two villages, the effects of the factory could then be estimated via a “difference-in-difference” technique.
Given limited resources and time, an abridged version of the experiment had to be designed. Therefore, the experimental design for this study is to conduct a representative survey in a village without a sugarcane factory (base village), then repeat the survey in a village with a sugarcane factory (treatment village), and lastly compare village means on a number of socioeconomic indicators. The crucial identifying assumption is that any changes over time in the two villages are due only to the presence of a sugarcane factory near one of them. However, there may be other socioeconomic differences between the two villages not captured in the data. For this reason, the empirical findings should be interpreted as describing correlations rather than causal relationships between the socioeconomic indicators.
Collecting the Data
The base village is known as Mueang Phia and is located in Ban Phai district of Khon Kaen province, approximately 54 kilometers from the provincial capital of Khon Kaen. The village has 635 households, of which 94 were interviewed (sample size of 14.8%). To facilitate effective decision-making in choosing households for interview, a community map was requested from the local subdistrict health office, and the village was divided into equally sized sections along intra-village roads. A certain number of households were then randomly chosen from each section to ensure that a representative sample of the entire village was generated, and that sampling biases were avoided within the village.
The treatment village is named Ban Kaeng and is located in Phu Khieo district of neighboring Chaiyaphum province—about 95 kilometers from the base village. More importantly, Ban Kaeng is around 15 kilometers away from the Mitr Phol Phu Khieo Sugar Refining Mill. The village has 784 households, of which 80 were interviewed (sample size of 10.2%) using the same sampling method as in the base village.
For each village household, we conducted one-on-one interviews with the primary male or female of the household. 2 Guided by the designed questionnaire, 3 the interviews were conducted in Thai, and the responses were recorded in Thai then translated into English. The field research took place over 29 days in Thailand with approximately equal time spent in the base and treatment villages. In practice, villagers were approached in their homes and interviews were conducted on the spot. 4
Given our target of surveying 100 households per village, the final sample includes a total of 174 responses—94 in the base village and 80 in the treatment village. For both villages, permission to conduct research was obtained from the village leader. Additionally, most nights were spent in the village as a “homestay” to build upon relationships with villagers from previous visits. 5 All of the logistical coordination was arranged through a Thai “fixer” who conducted the interviews and served as live interpreter for stakeholder interviews. 6 On top of that, additional field staff were hired and trained to assist in conducting interviews in the base village while the fixer and I gathered data in the treatment village.
In both villages, survey response rates vary between indicator groups. The lowest response rate is with economic indicators (income and expenses), while questions about perceived environmental quality and perceived health status received an average response rate of 89% and 98%, respectively. The high response rate with environmental and health indicators likely has to do with the multiple-choice structure of the questionnaire which allowed for simplicity and speed in participant responses.
Evaluating Socioeconomic Impact
Socioeconomic impact is a two-dimensional measurement, and the economic dimension is measured by household income. Villagers generate income from a variety of activities such as farming crops, fruits, and vegetables, raising livestock, fishing, scavenging wildlife, cooking food to sell, running a market stand, and so forth. These activities are aggregated into four sectors: agriculture, industry, service, and other. Gathering income data was challenging largely because agricultural households had no knowledge of the monetary value of their output. Therefore, households were asked to share information on the quantity produced and market price of their products, from which their monthly agricultural income is imputed. 7 Similarly, income earned from “other” sources such as scavenging is imputed using quantity and price calculations. Lastly, data is collected on two expense categories: water and health.
The social dimension focuses on determining villager satisfaction for two aspects of life pertaining to the establishment of a sugarcane factory: perceived environmental quality (PEQ) and perceived health status (PHS). The PEQ questionnaire was inspired by an opinion survey on community perception of air quality conducted in Clarkston, Washington (Medalia & Finkner, 1965), while the PHS questionnaire was taken from the SF-36 Health Survey (Ware & Gandek, 1998) and reduced to correspond with this project.
Descriptive Statistics
Economic Indicators
The economic indicators comprise of income and expenses. The four sectors of the village economy (agriculture, industry, service, and other) are further divided into subcategories. Agriculture consists of farming rice, sugarcane, and fruits and vegetables as well as raising livestock. Industry is divided into sugarcane factory employment and other. Service is separated into public and private activities. The “other” sector is comprised of households that produce an income from scavenging the surrounding rivers, lakes, and forests, as well as retired workers. Finally, household expenses include water and health, and outlays for water are subdivided into potable and nonpotable expenses. Appendix Table A1 contains the precise definition of each economic indicator. Appendix Tables A2 and A3 present the summary statistics for income and expense variables. 8
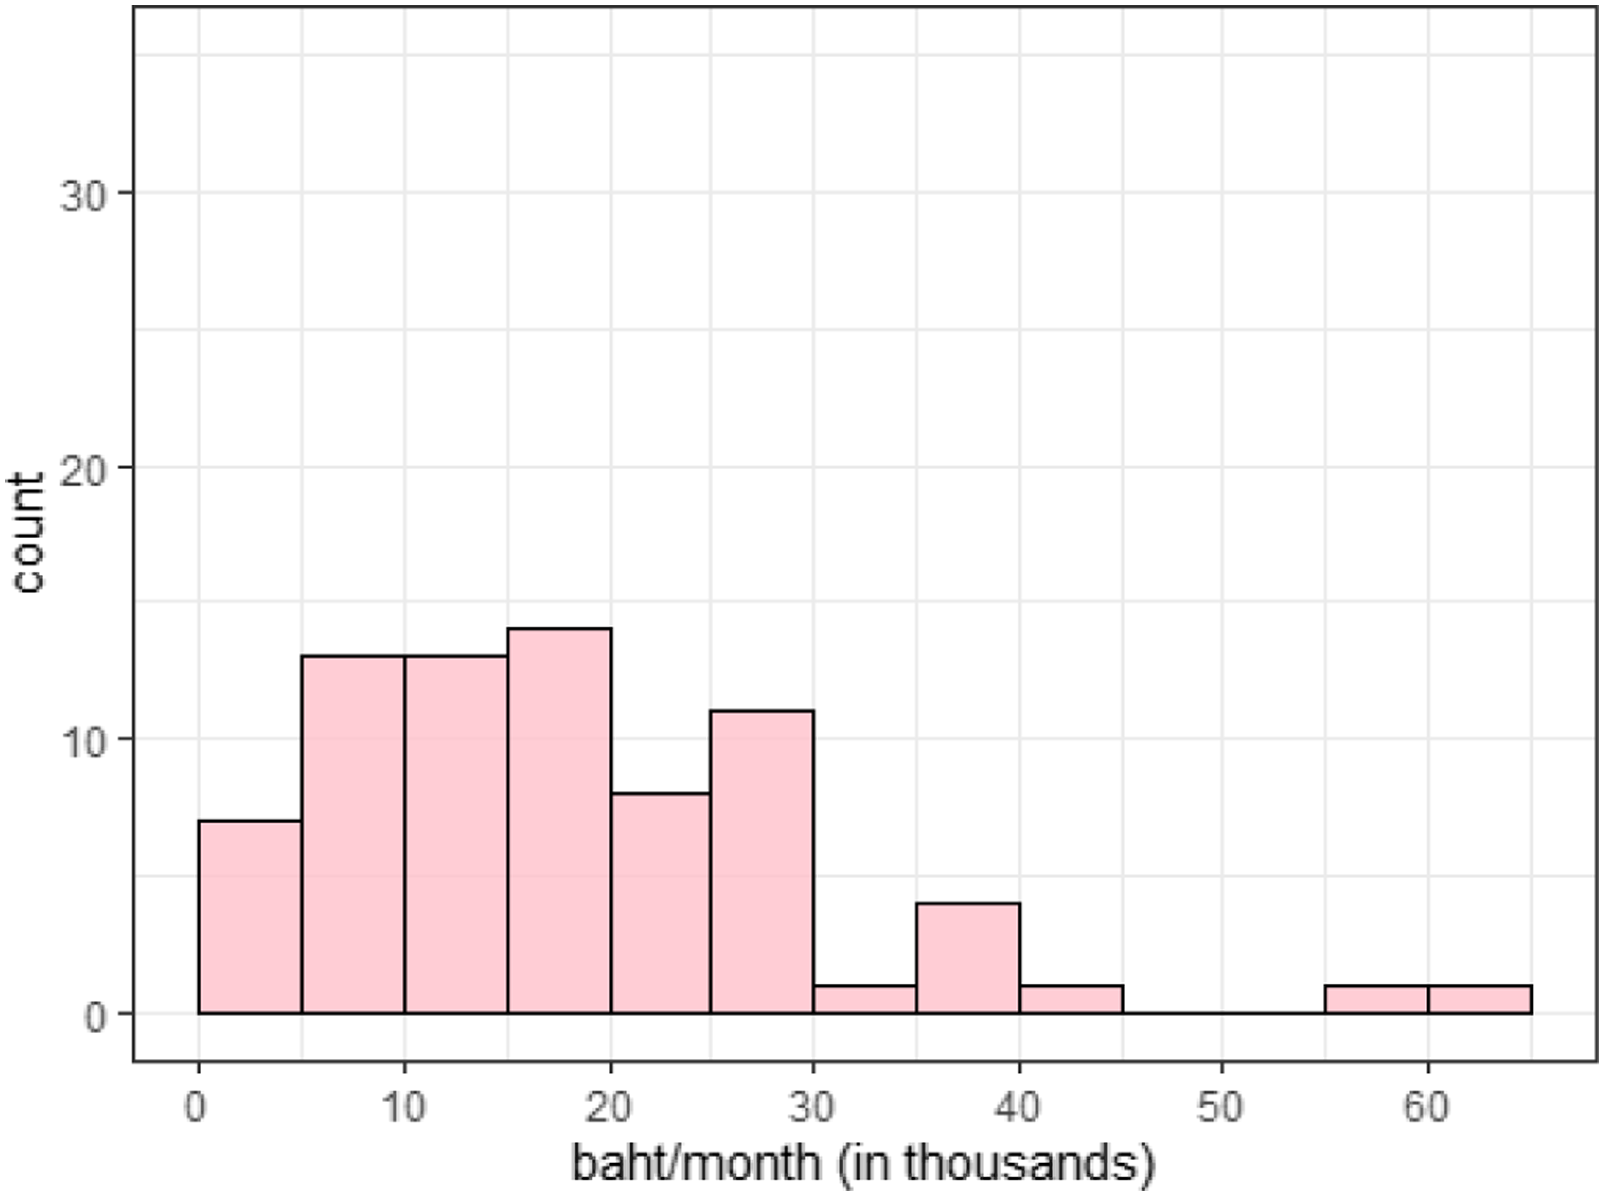
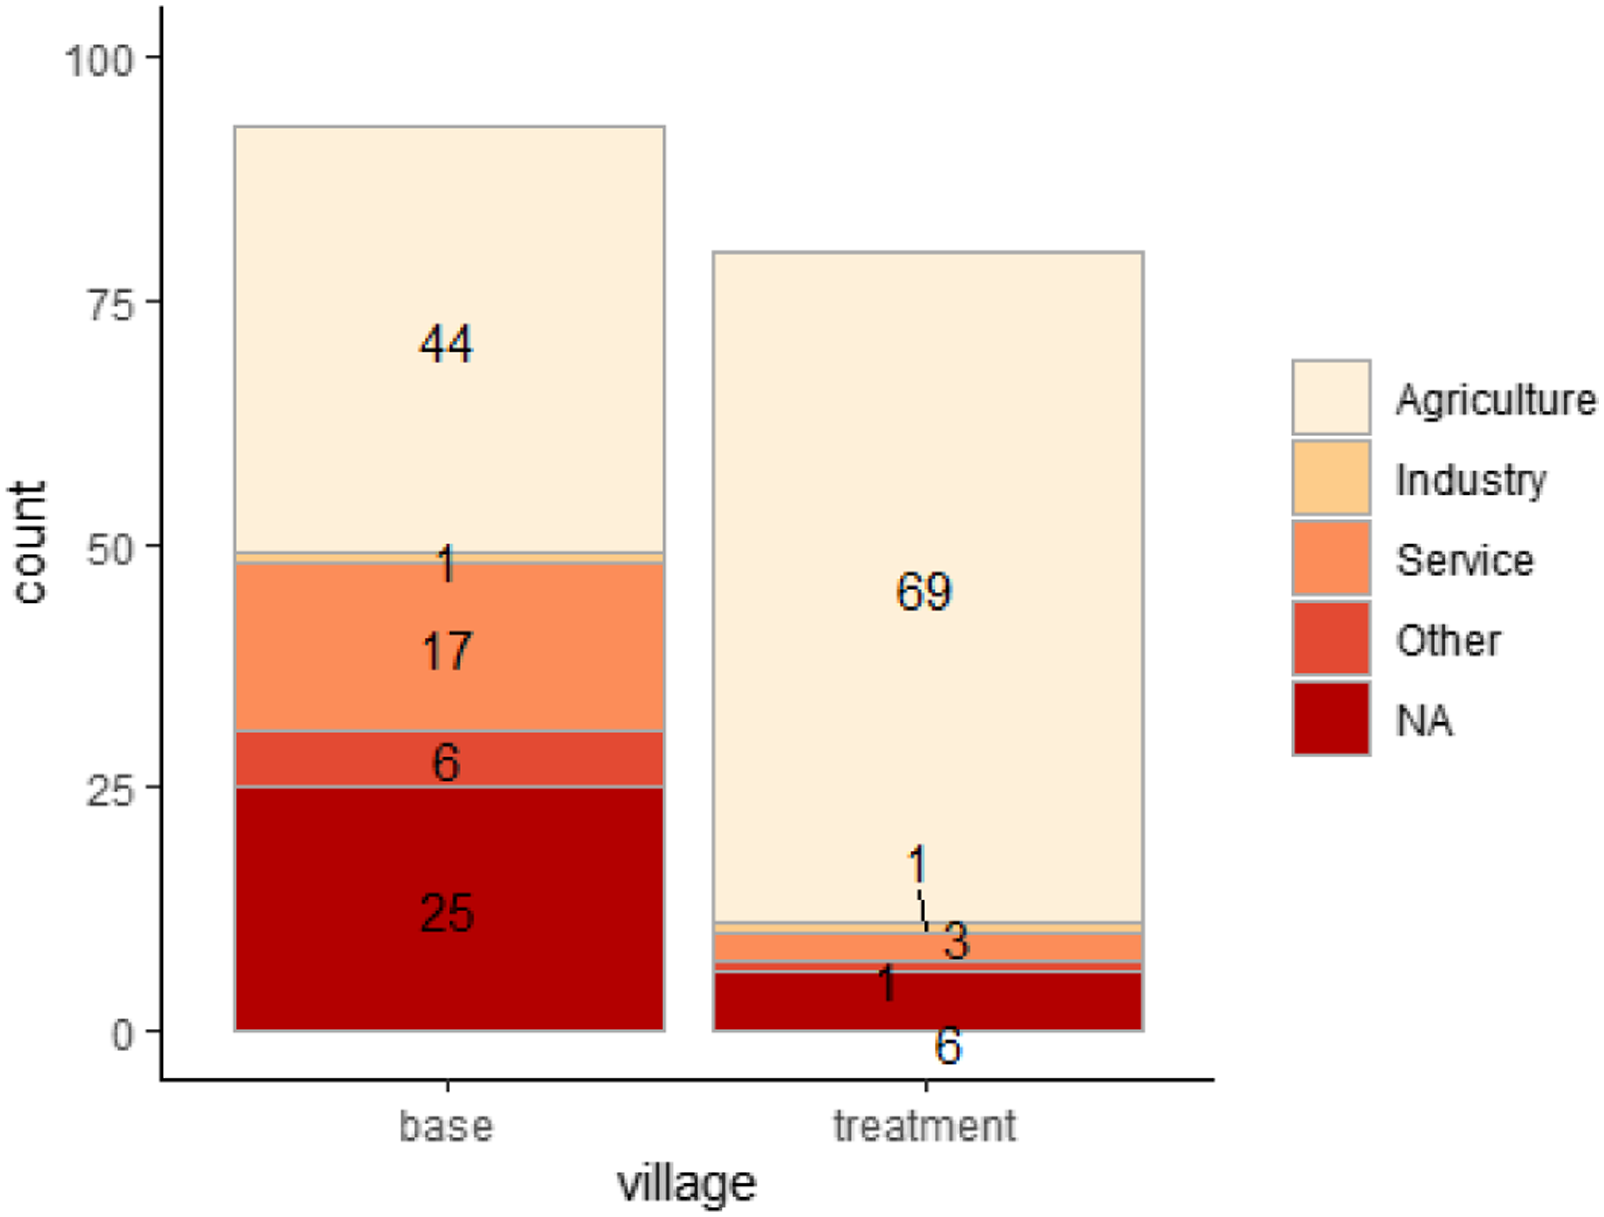
Figures 1 and 2 display the income distributions of total monthly household income in the base and treatment villages, respectively. The visual difference in income distributions suggests potential structural differences between the two village economies. Figure 3 reveals these structural differences by categorizing households according to their largest source of income. While the base village has a greater proportion of households that depend on service sector jobs than the treatment village, both villages clearly heavily rely on the agriculture sector for their main sources of income. Income Distribution of Base Village. Income Distribution of Treatment Village. Main Sources of Household Income.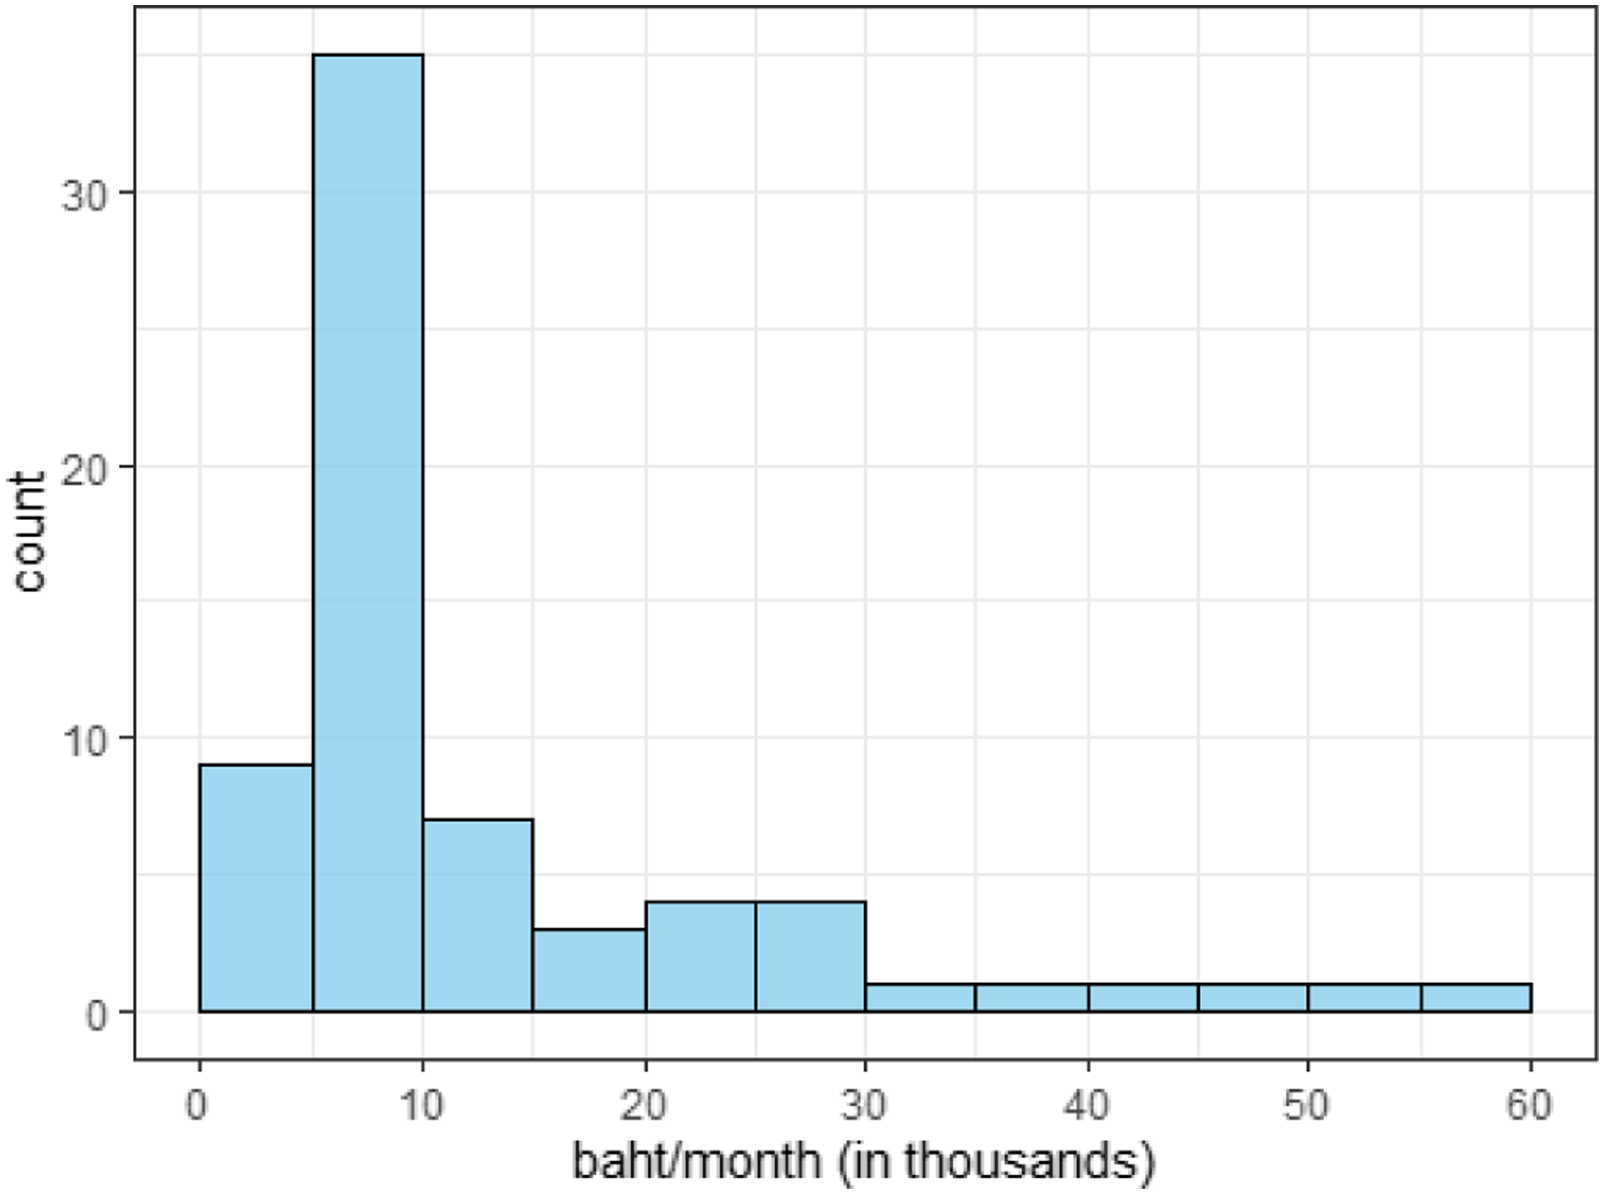
Since most households work in agriculture, Figure 4 applies the same method to categorize all households with any agricultural income according to their main source of agricultural income. The difference of rice and sugarcane as primary agricultural crop plainly indicates a structural difference in the agriculture sectors of the two villages. Furthermore, the lean toward sugarcane farming in the treatment village can be linked to the presence of the nearby sugarcane factory. Main Sources of Agricultural Income.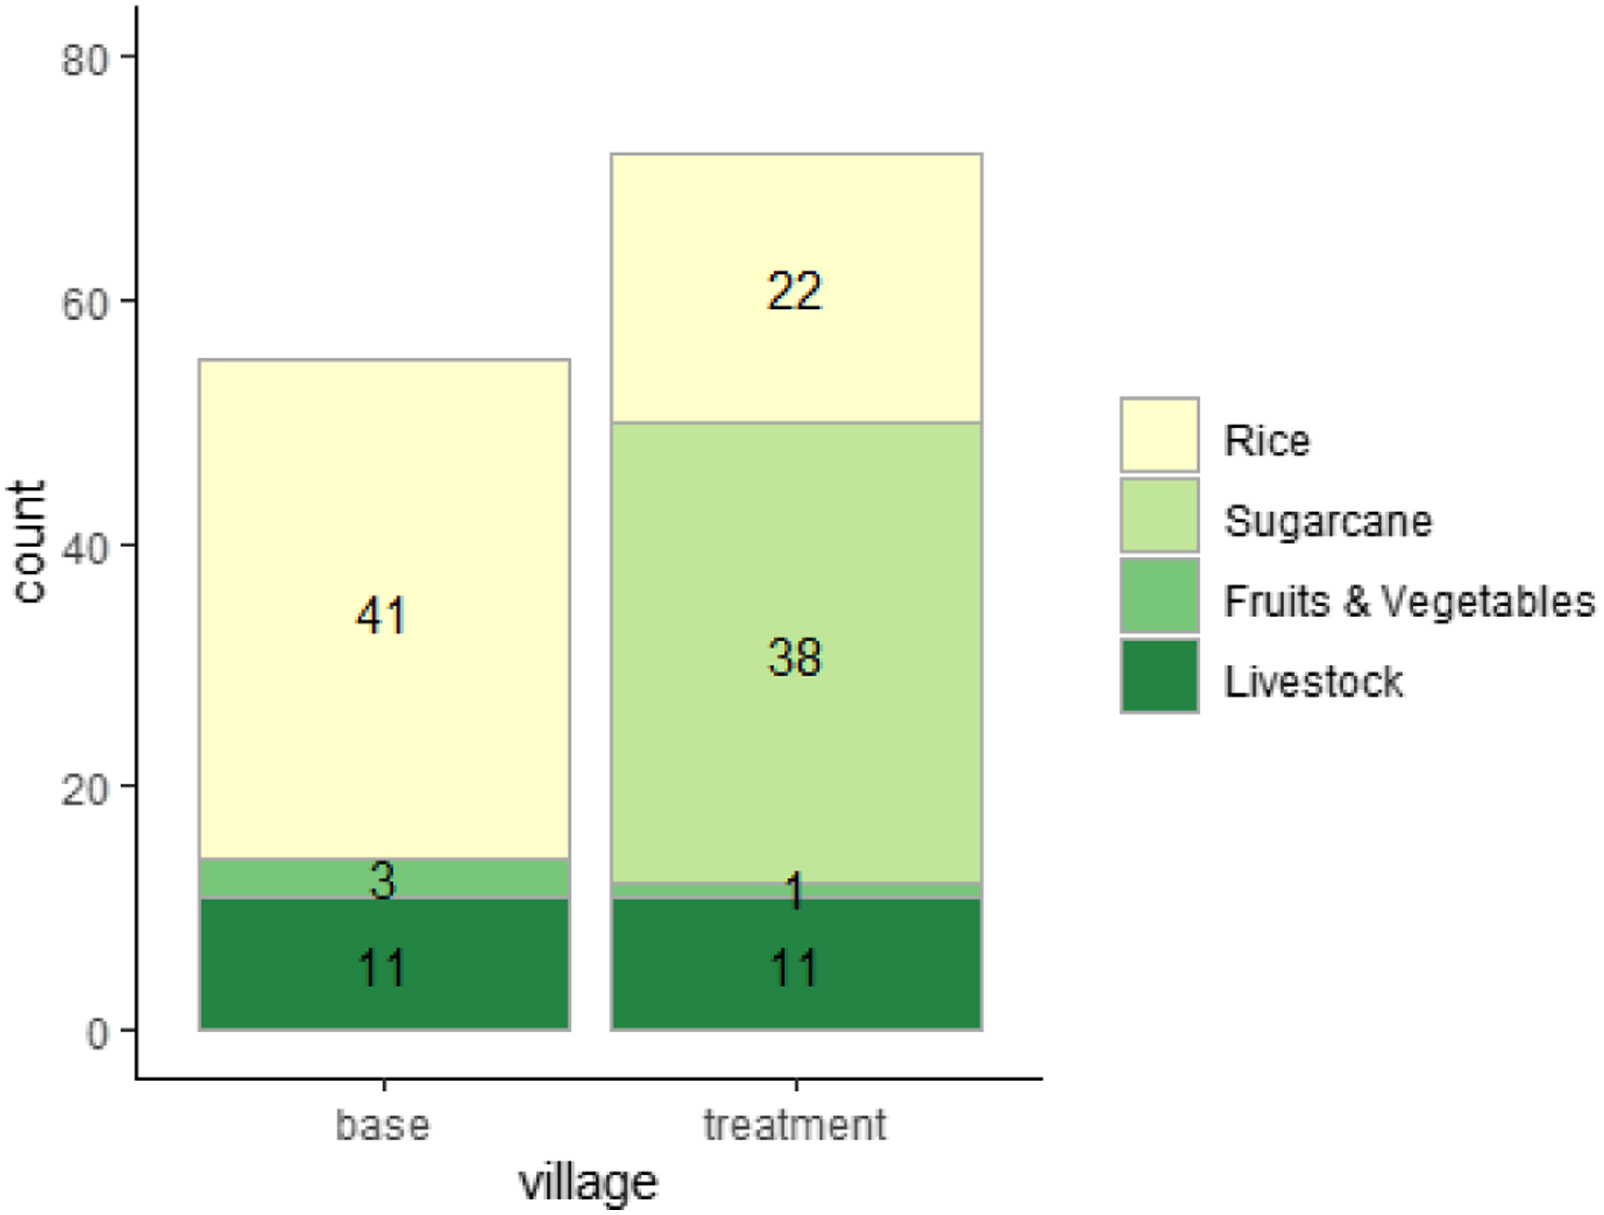
Social Indicators
The social indicators are organized into three categories: perceived environmental quality (PEQ), perceived health status (PHS), and perceived quality of life (PQL). The PEQ category rates the quality of the surrounding environment based on villager perceptions and concerns. PHS indicators measure villager health from self-assessments and ability to conduct daily affairs. The PQL measure captures aspects of life beyond income, environment, and health. Appendix Table A4 provides detailed variable definitions. Appendix Tables A5–A7 present the summary statistics for PEQ, PHS, and PQL variables.
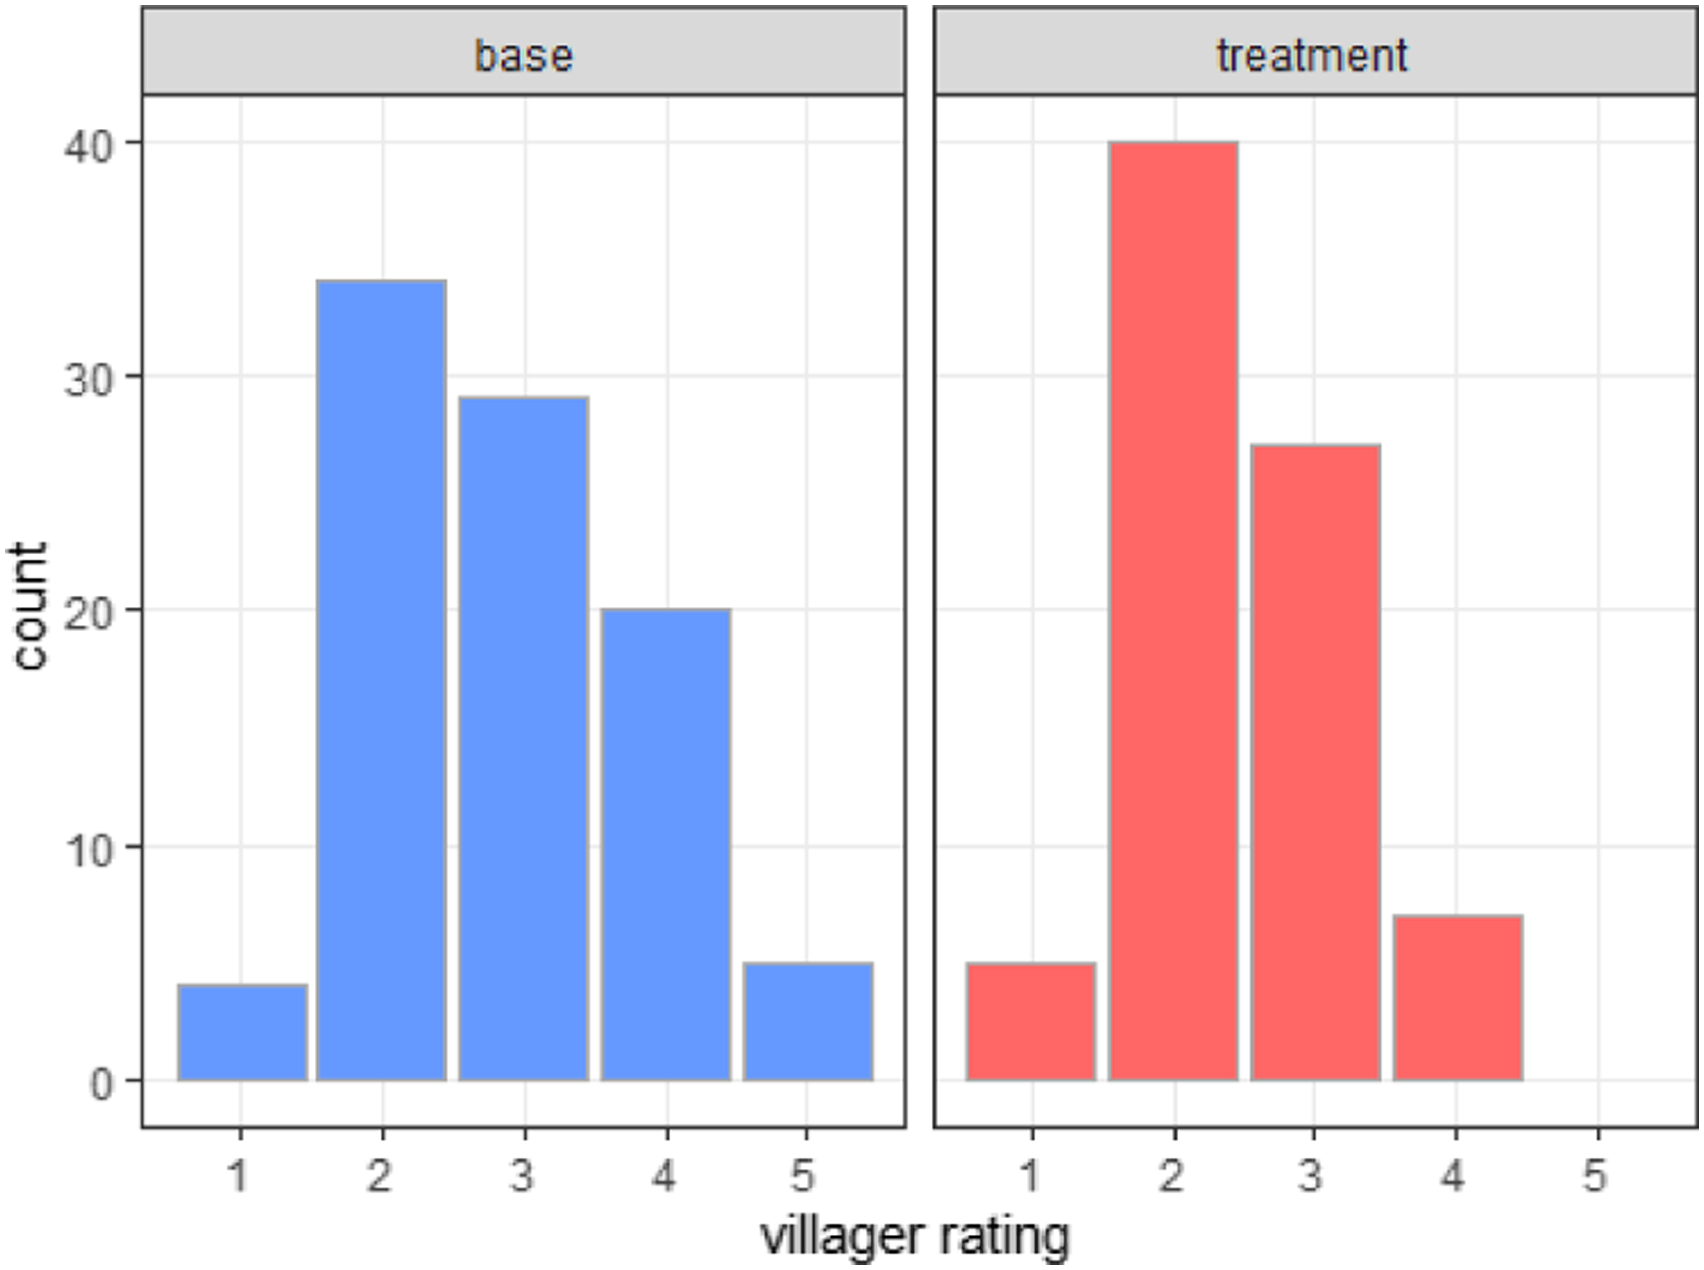
The first PEQ variable asked villagers to rate the extent to which pollution has been a problem. Figure 5 shows that most base villagers rated the overall pollution situation as “continuously been a problem” (4), whereas the most common response from treatment villagers was “less of a problem” (2) passably followed by “not been a problem” (1). To evaluate PHS, villagers were asked to rate their present overall health on a scale of Poor to Excellent (1–5). Figure 6 displays that most villagers rated their overall health as Fair (2). However, the base village has at least 20 or more counts of Good (3) and Very Good (4), whereas the treatment village has far fewer counts of Very Good (4) and zero counts of Excellent (5). Perceived Overall Pollution by Village. Perceived Overall Health by Village.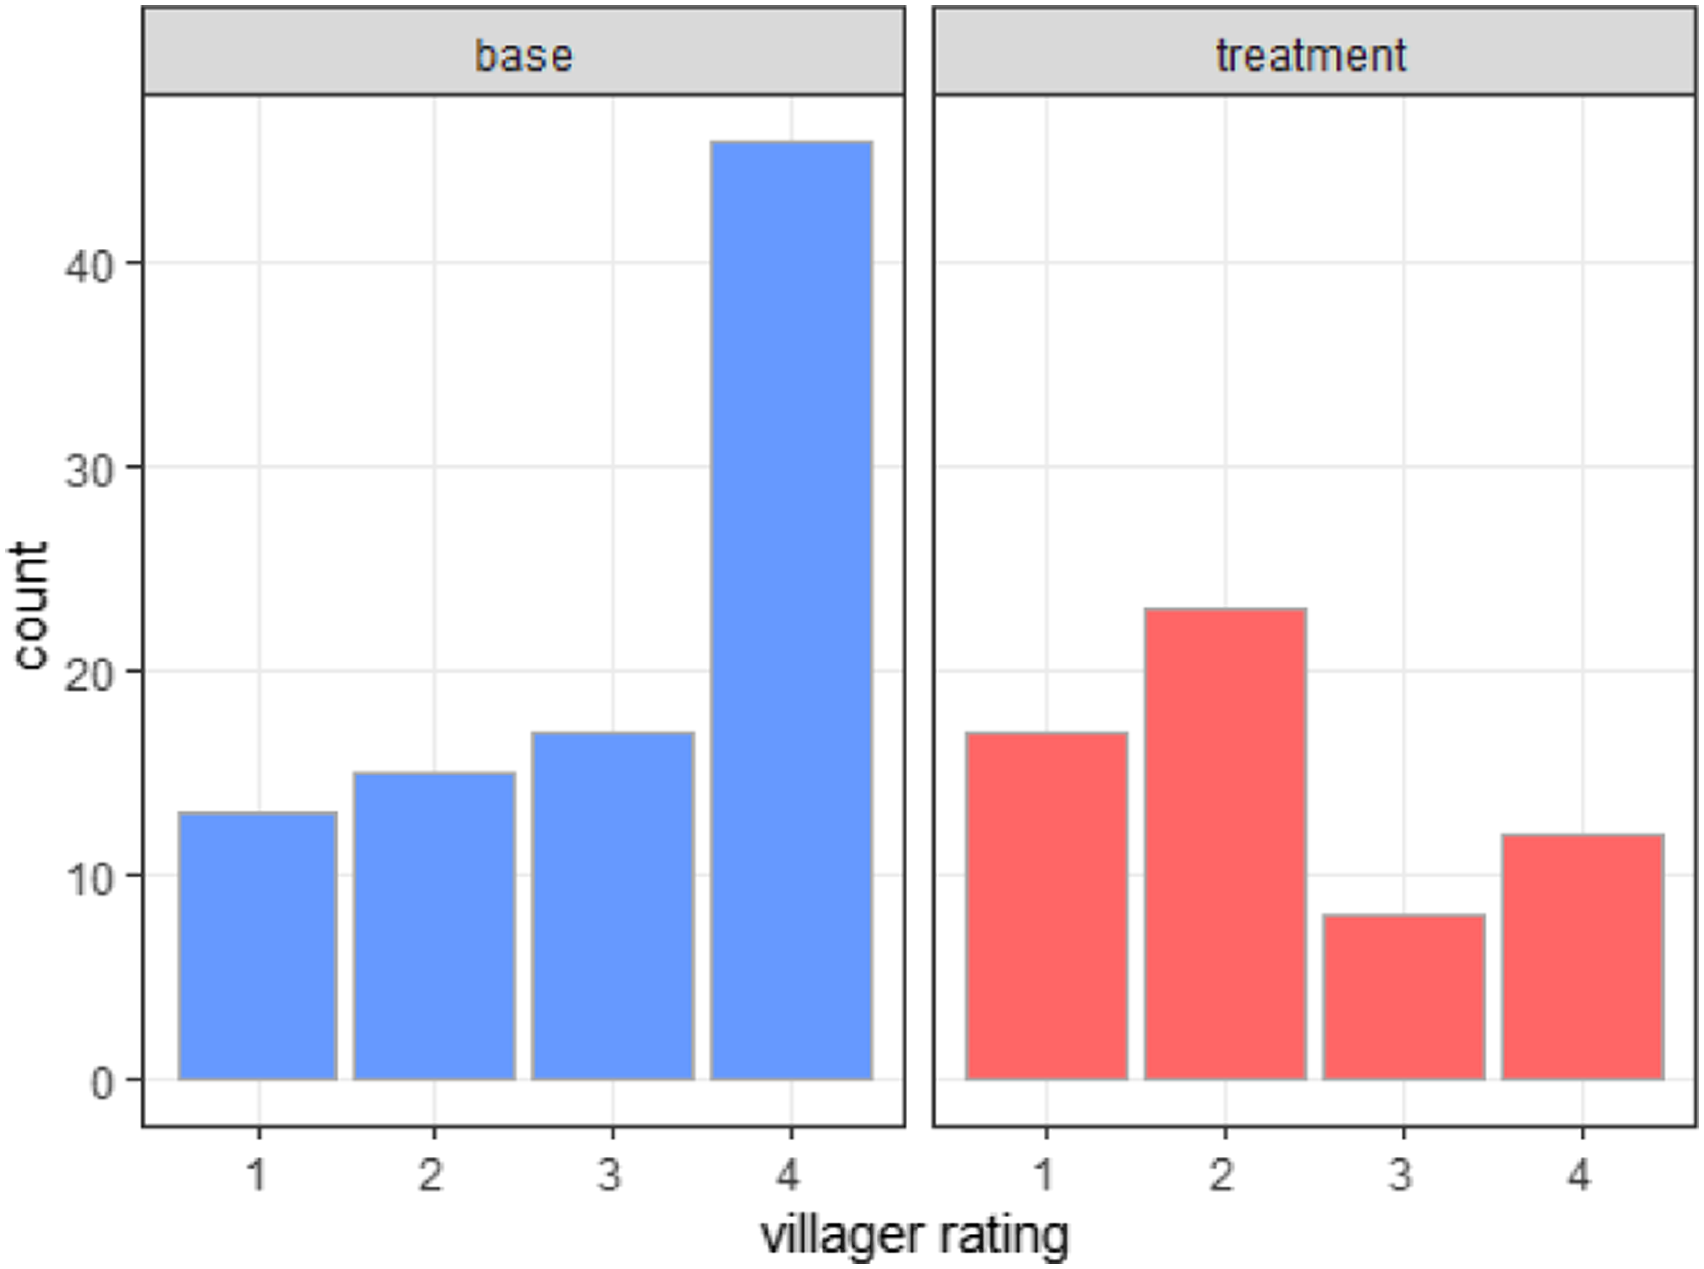
The final social indicator of PQL is a single variable derived from the question of, “How would you rate your village as a place to live?” The broad nature of the question allowed villagers to consider a large set of factors that include income, environment, and health, but also other aspects of village life such as community, location, history, or whatever was most important to the villager at the time. Figure 7 reveals that the base village has majority ratings of Excellent (3) while the treatment village has plurality ratings of Good (2) closely followed by Excellent (3). The high ratings from base villagers signify agreeable satisfaction with life in the base village, likely due to a combination of many factors. Perceived Quality of Life by Village.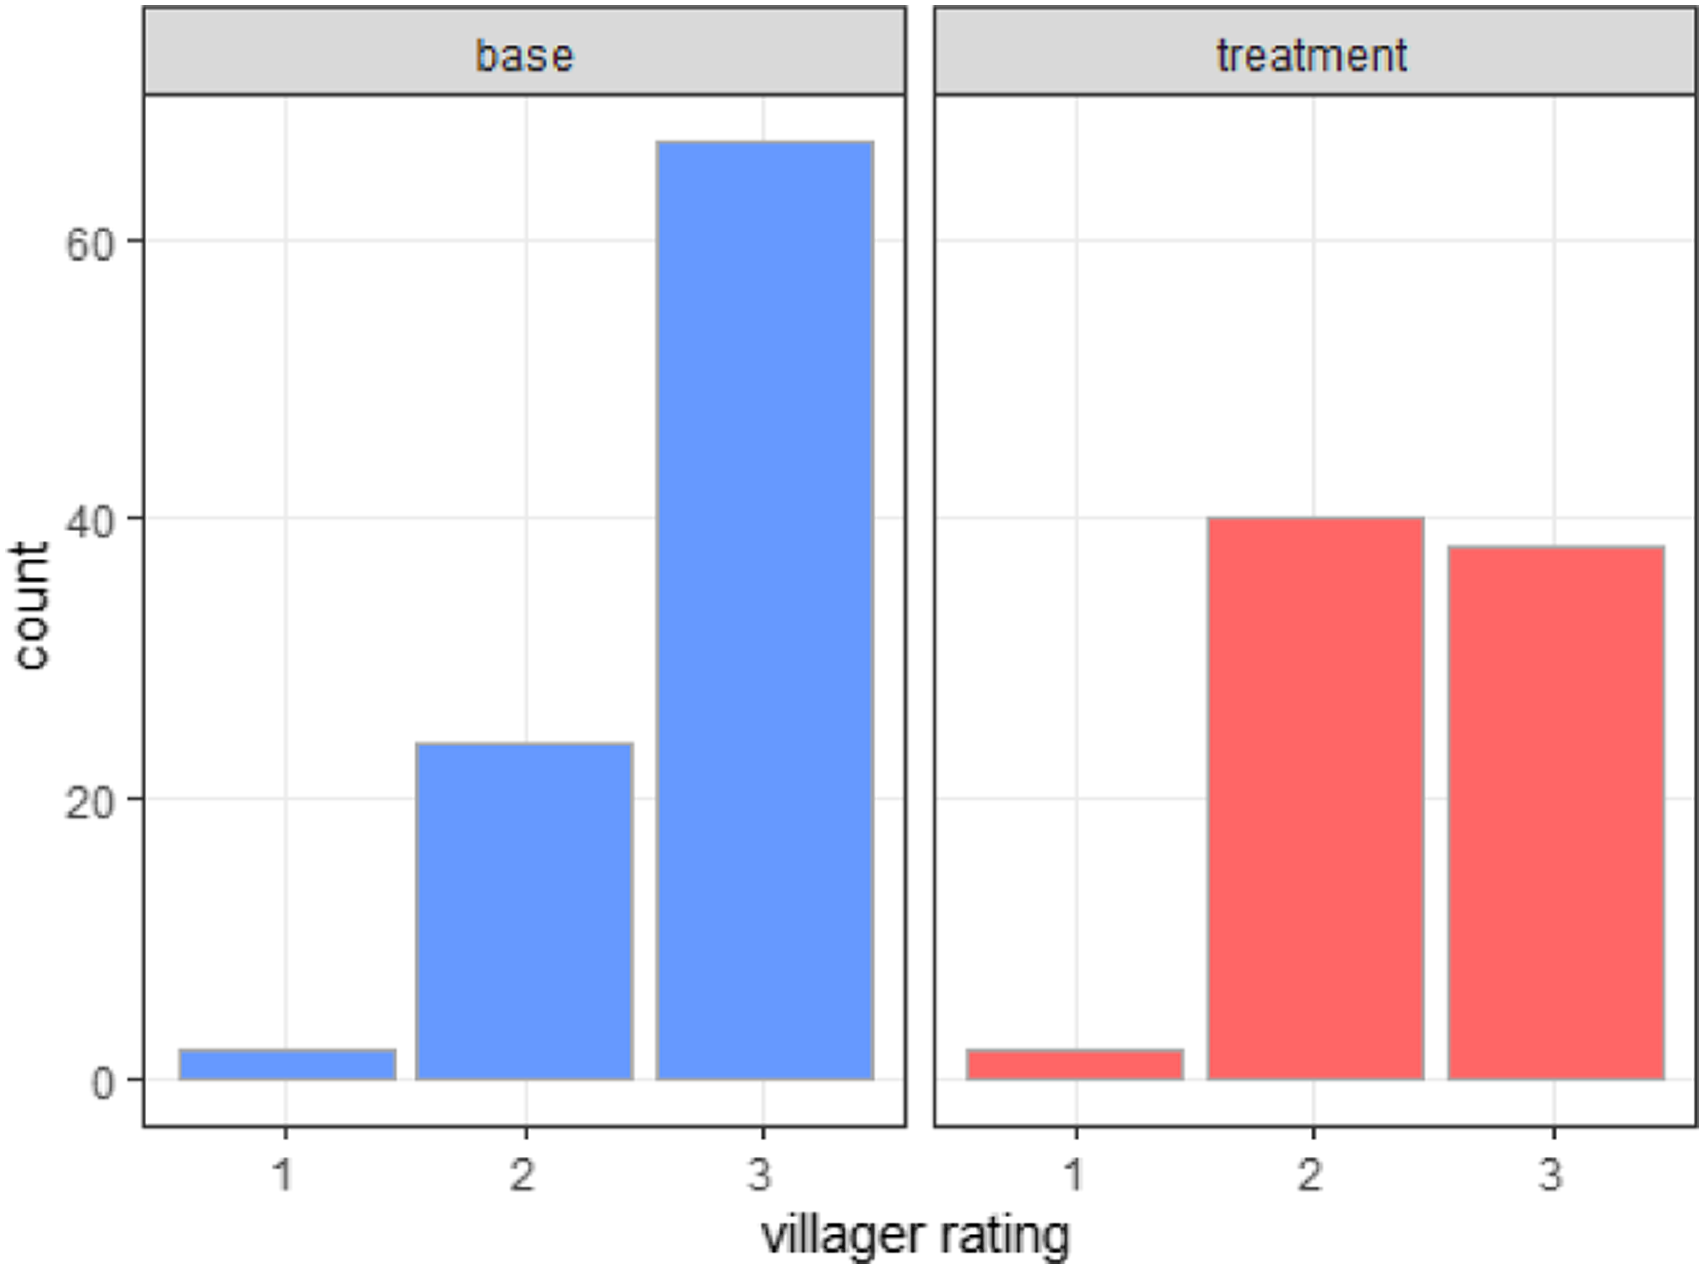
Adjusting the Sample
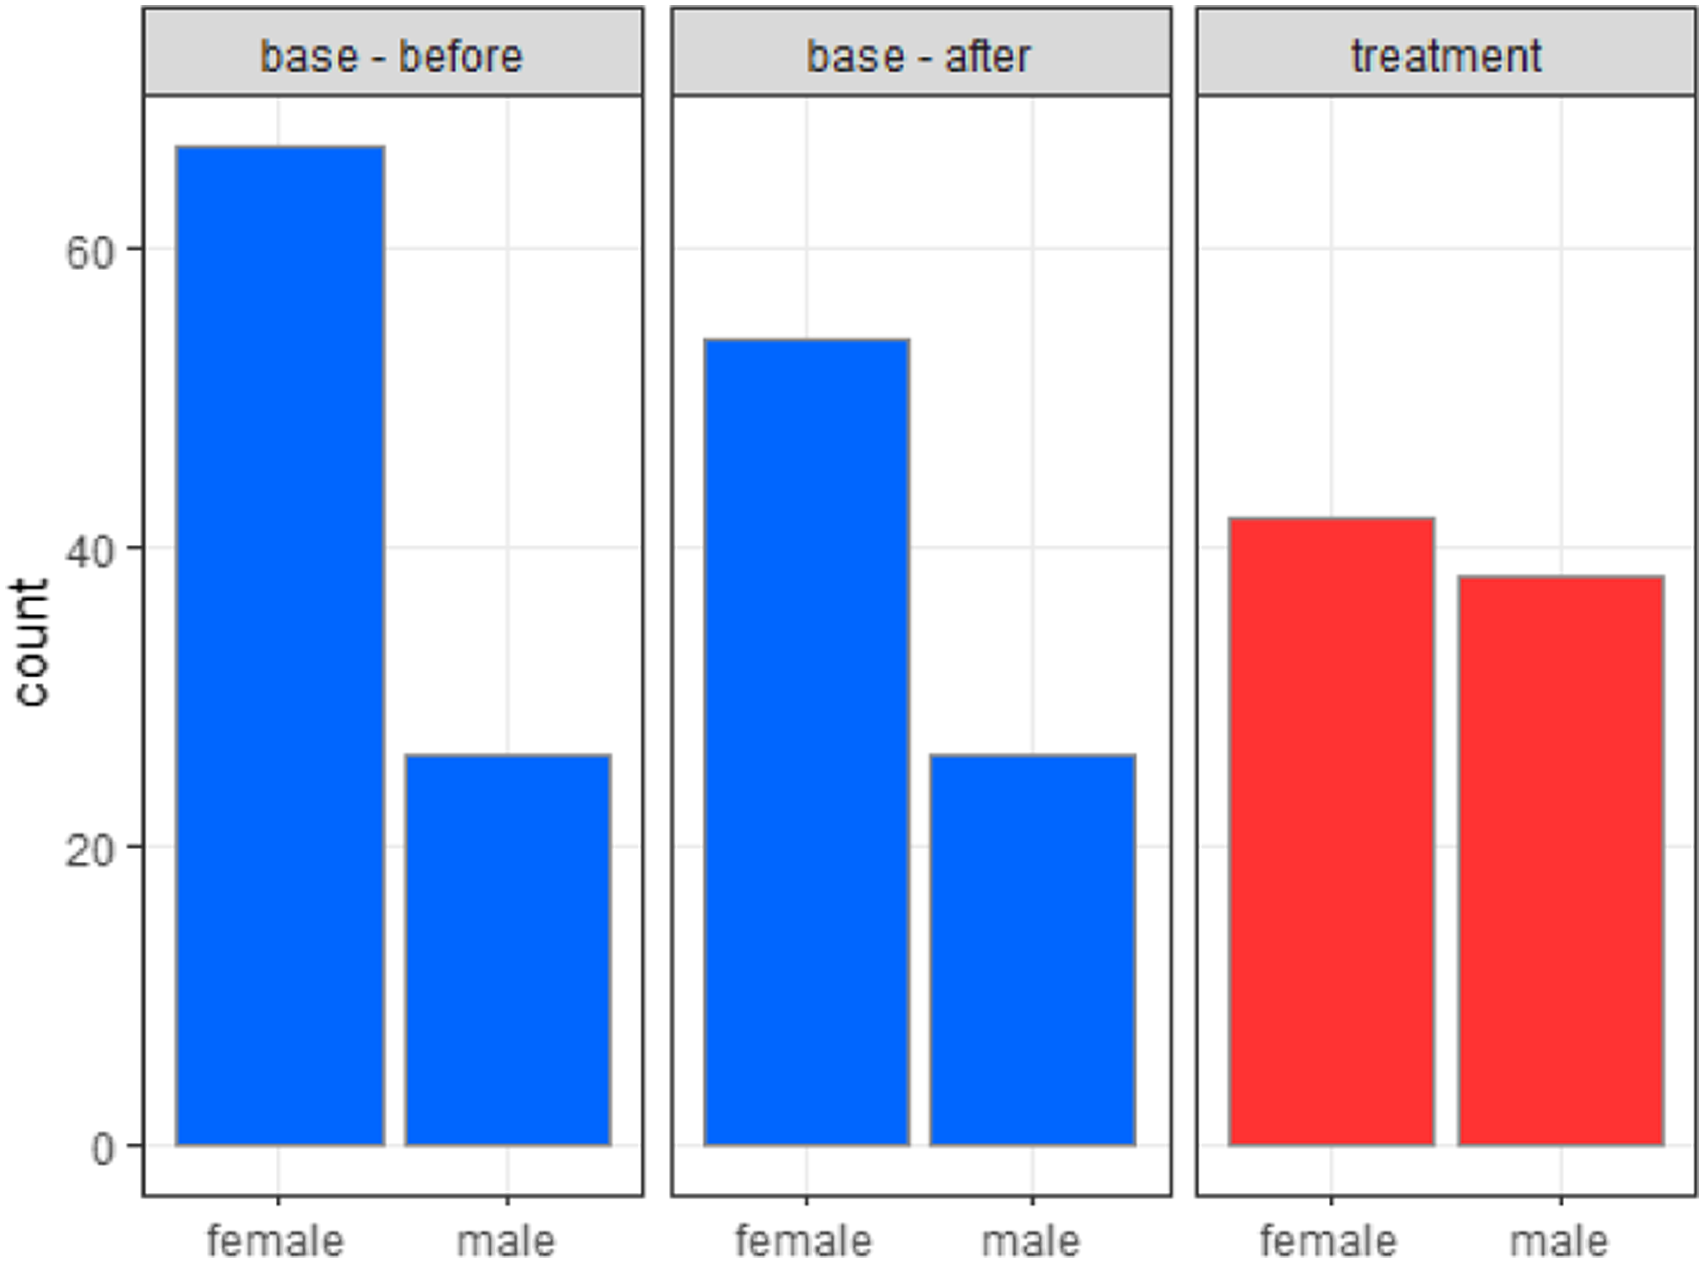
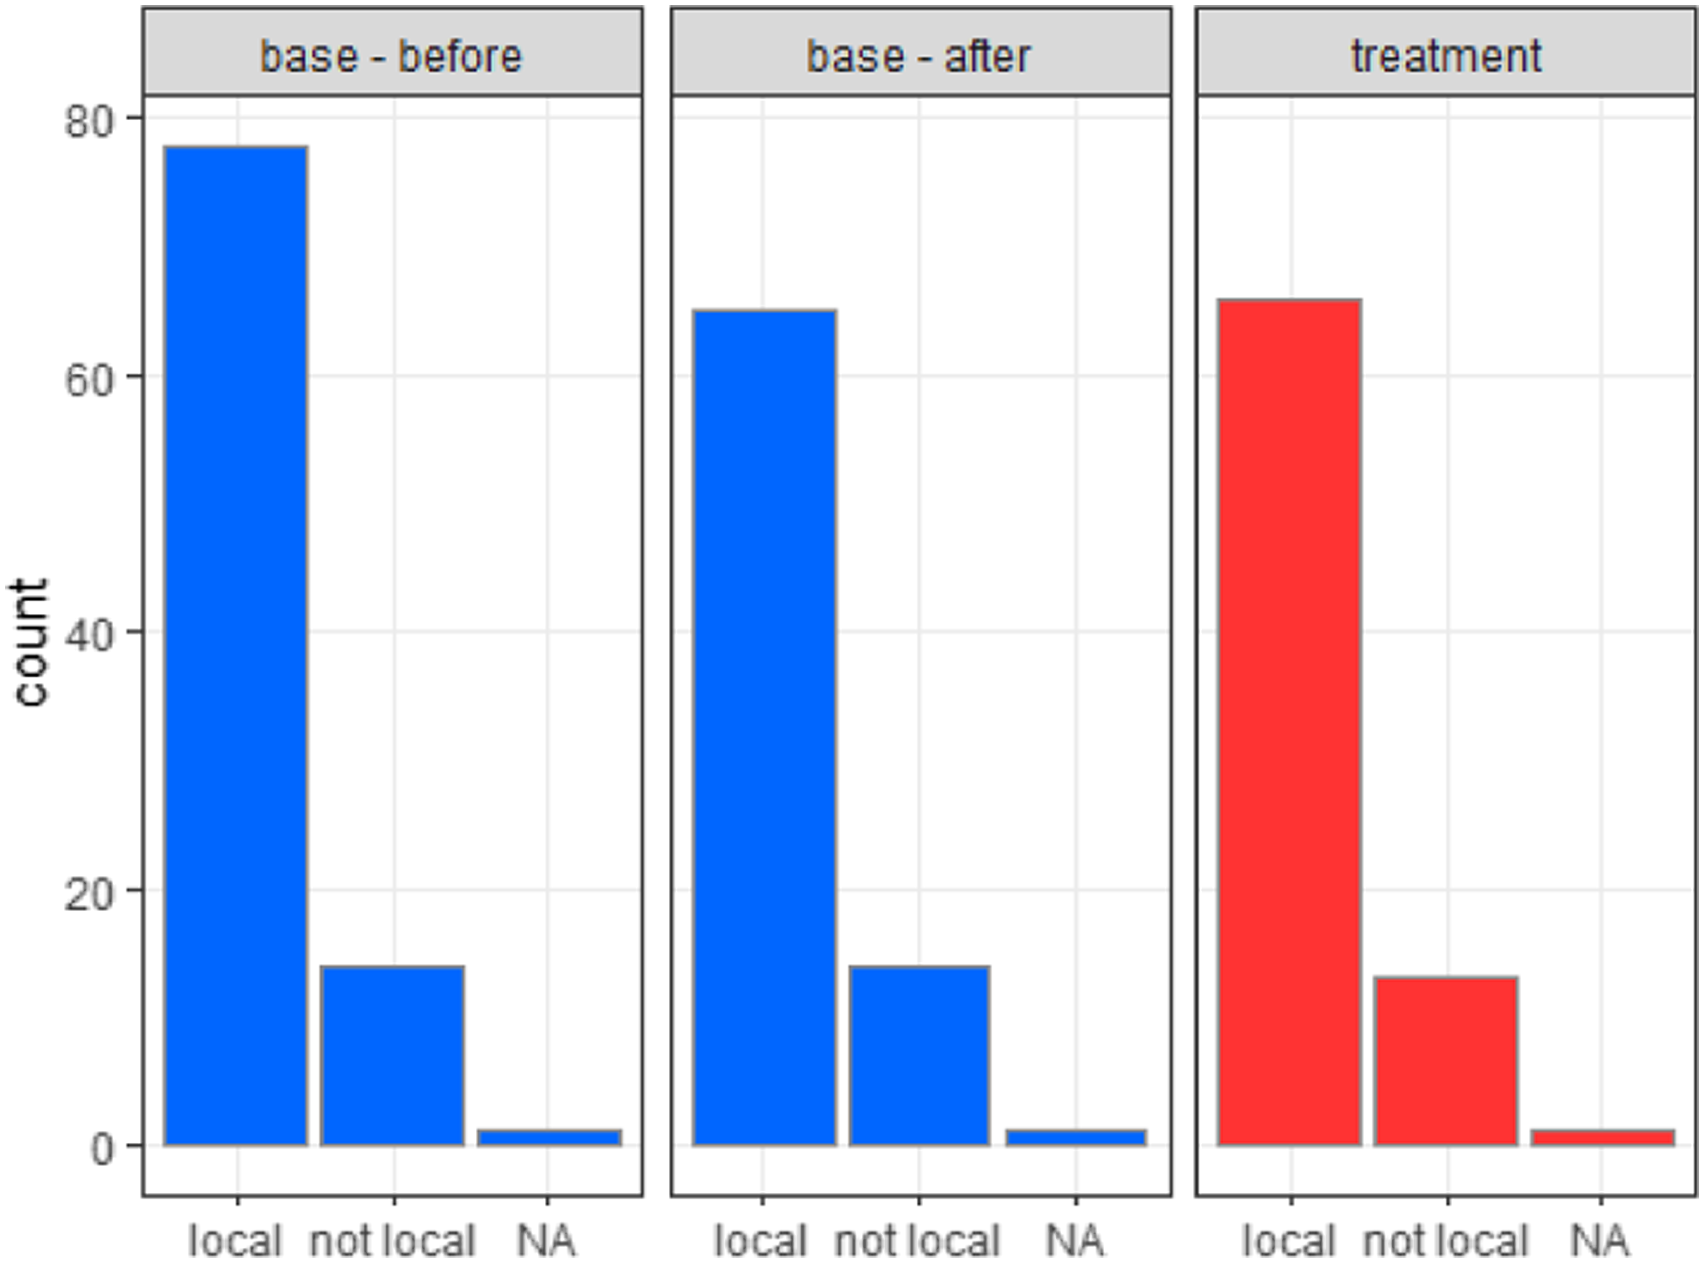
Given differences across villages in certain demographic variables, the base village sample is adjusted with respect to age cohort, gender, and birthplace to make it more similar to the treatment village sample.
9
In particular, the base village has a higher number of respondents in the age cohorts of 20, 40, 60, and 70, a higher proportion of females, and a higher number of respondents born in the village. Since the base village sample is larger by 13 observations, 13 village-born females—none from cohort of 20, seven from cohort of 40, two from cohort of 60, and four from cohort of 70—are removed from the sample randomly.
10
Figures 8, 9, and 10 show the distributions of these demographic variables for the base village before and after the adjustment as well as those of the treatment village. Appendix Table A8 presents the summary statistics of all four demographic variables for the adjusted sample. Additionally, Appendix Table A9 displays a correlation matrix of key socioeconomic indicators and demographic variables. The data analysis is conducted with this adjusted data set of 160 total responses—80 from each village. Adjusting the Sample by Age. Adjusting the Sample by Gender. Adjusting the Sample by Birthplace.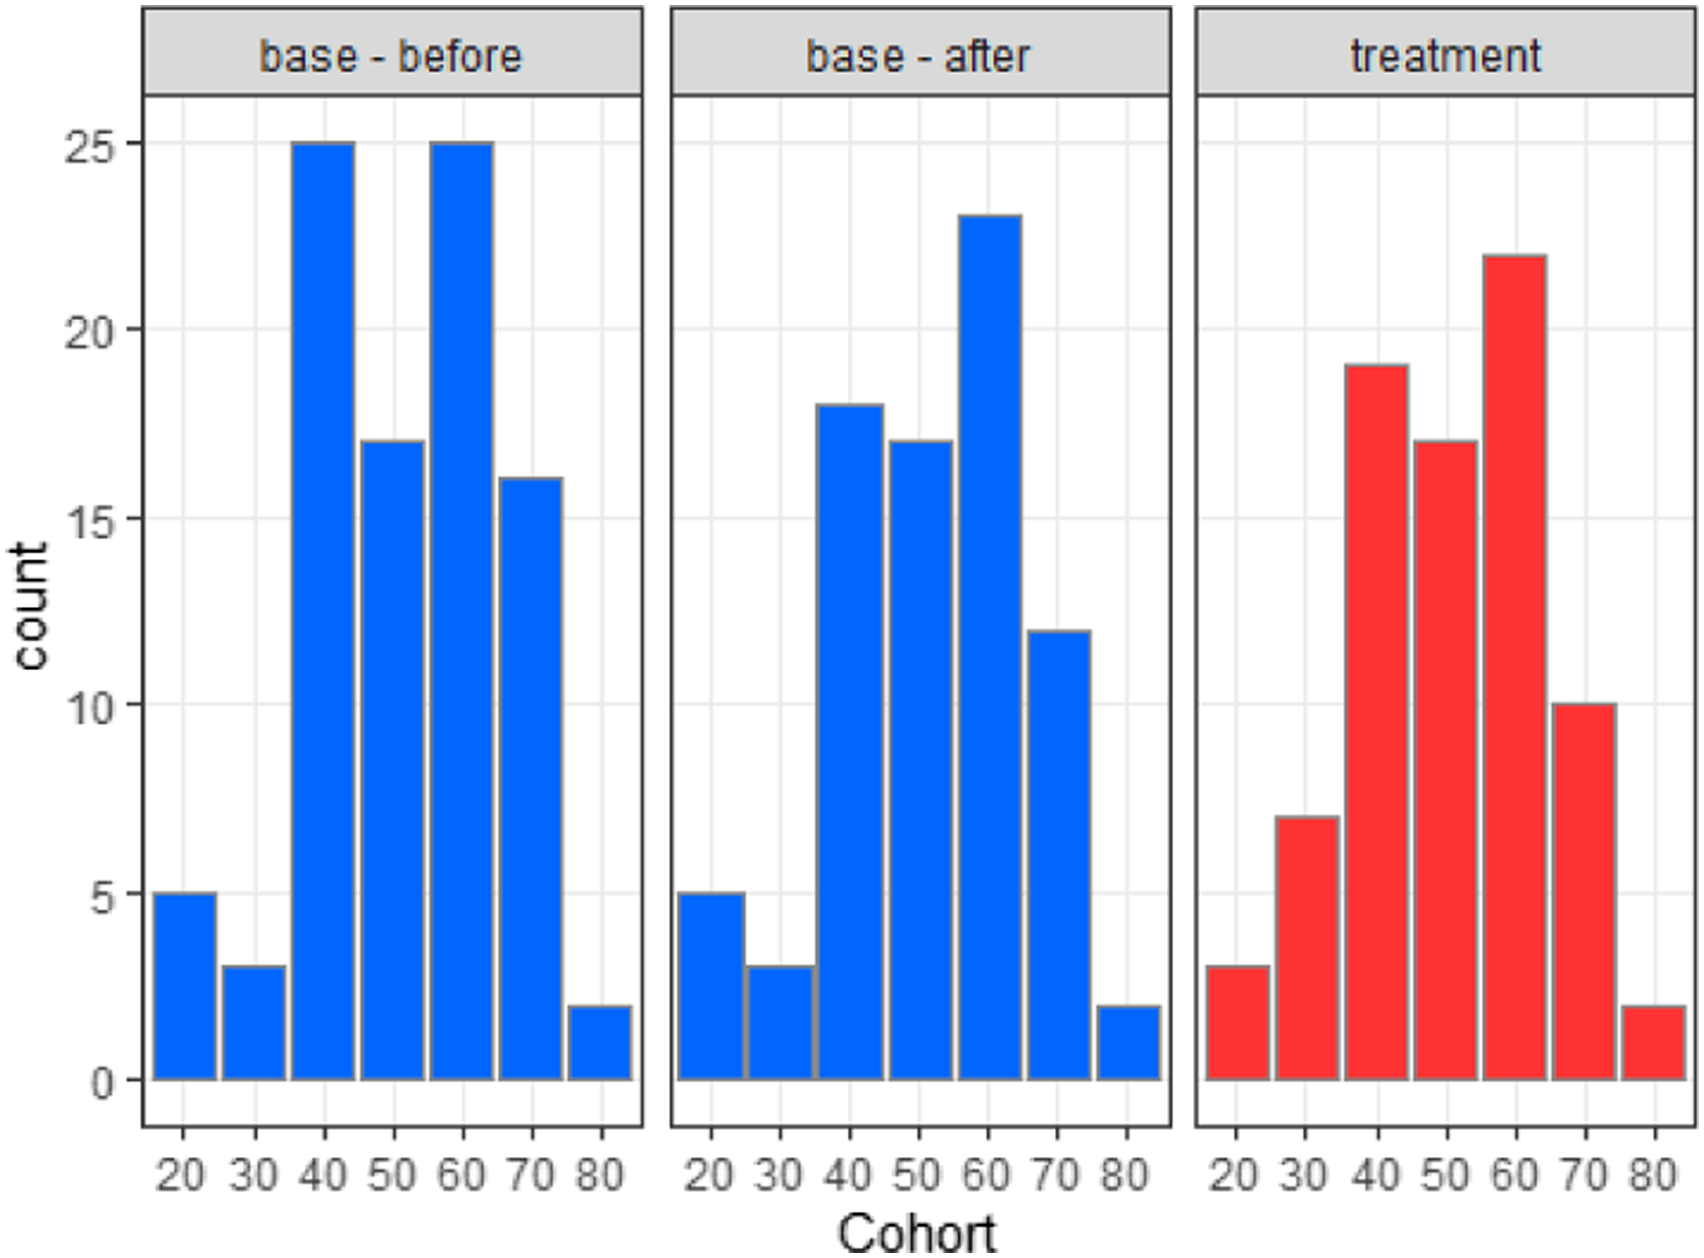
Results
This section presents the results for the mean difference tests and regression analysis. First, the mean differences of the four demographic variables are compared. By doing so, it is possible to demonstrate that the two villages are demographically similar, and thus, any significant mean differences for the socioeconomic indicators are due only to village location, that is, proximity to a sugarcane factory. Appendix Table A10 shows the mean difference tests of the demographic variables.
We find that the ratio of male-to-female villagers is lower by 15 percentage points in the base village (10% significance level). In addition, the average education level of base villagers is higher than that of treatment villagers by almost half an education level (1% level).
11
The other variables of age and birthplace have small mean differences that are not statistically significant. Since two mean differences of the demographic variables are significantly large, we control for all demographics as well as other relevant factors in the linear regression framework, which is of the following form

Income
Average household income in the base village is 5463 baht/month less than in the treatment village (1% significance level). Appendix Table A11 displays the mean difference tests for the income variables.
In the agriculture sector, treatment village households make on average 7060 baht/month more than base village households (1% significance level). At a more disaggregate level, income earned from rice, fruits & vegetables, and livestock are not significantly different between villages. Therefore, the driver behind the agricultural income gap must be sugarcane farming. The prevalence of sugarcane farming in the treatment village can naturally be attributed to the presence of the nearby sugarcane factory.
In the service sector, 12 the opposite is true in that base village households earn on average 6645 baht/month more than treatment village households (5% significance level). Average incomes earned from private service jobs are not significantly different between villages, so the higher overall service sector income in the base village must come from households working in the public sector. 13
Next, the difference in household income between villages is examined within the linear regression framework. Appendix Table A12 contains a baseline regression with the treatment village dummy and four demographic control variables (age, gender, birthplace, and education), a second regression where sector dummies for the industry, service, and other sectors are included, and a third regression with more disaggregate dummies for each sector. The regression analysis confirms the findings that treatment village households earn more than base village households, even after controlling for demographics. In addition, the regression results show that, compared to rice farmers, sugarcane farmers and livestock growers earn significantly more income. However, sugar mill workers and public service employees earn substantially more than agricultural workers, by a factor of 2–3.
Expenses
Average household water expenses are higher in the base village than in the treatment village by 291 baht/month (1% significance level). More specifically, base village households spend on average 61 baht/month more on potable water (5% level) and 235 baht/month more on nonpotable water (1% level) than treatment village households. 14 For the final economic indicator, regular household health expenses are higher in the treatment village than in the base village, but the mean difference is not statistically significant. Appendix Table A13 presents the mean difference tests for the expense variables.
Household expenses of water and health connect the economic indicators to the social indicators in that water expenses are related to environmental quality and health expenses are tied to individual health status. The expectation is that water expenses and PEQ are negatively correlated because lower environmental quality would necessitate greater expenditures for access to clean water. On the other hand, health expenses and PHS have a bidirectional relationship in that greater health expenses can improve individual health, but lower health status can also demand greater health expenses.
Perceived Environmental Quality
The difference of village means for all environmental quality indicators convey that base villagers perceive worse environmental quality than treatment villagers, and these mean differences are statistically significant at the 1% level. Appendix Table A14 displays the mean difference tests for the PEQ variables.
This result is surprising given the expectation that the presence of a nearby sugarcane factory would be detrimental to the surrounding environment of the treatment village and consequently reduce treatment villager PEQ. However, this expectation hinges on the assumption of close proximity between village and factory. In the case of the treatment village, the actual distance to the sugarcane factory is almost 15 kilometers, thus greatly minimizing any negative pollution impact. In comparison, the base village is located less than one kilometer from the intended sugarcane factory site, thereby exposing base villagers to future pollution externalities at a much larger scale.
We investigate potential factors that can explain the mean differences in PEQ within a regression framework. First, overall pollution is regressed against the treatment village dummy and demographic control variables, then additional controls for water pollution, air pollution, and traffic are included, as shown in models 1 and 2 of Appendix Table A15. We find that air pollution and traffic increase villager perceptions of overall pollution. This result is likely driven by the location of the base village situated along a busy main road and prone to pollution from vehicle emissions and noise. In contrast, the treatment village, surrounded by sugarcane fields far from the factory, experiences sparse traffic and less pollution. 15
Last, we add household income as a control variable in the regression (see model 3 of Appendix Table A11). While income appears to be negatively associated with overall pollution levels, the relationship is not statistically significant. 16
Perceived Health Status
For PHS variables, the mean difference tests provide mixed results (see Appendix Table A16). Base villagers have higher ratings for the overall health indicator than treatment villagers (1% level). However, the mean differences of the remaining seven variables all point in the opposite direction, with three of them being statistically significant. Therefore, despite having higher ratings for the physical, mental, and emotional aspects of health, treatment villagers perceive lower overall health as compared to base villagers.
A possible explanation considers health changes over time. Specifically, base villagers feel that their overall health is the same as the previous year, whereas treatment villagers feel that their overall health is slightly worse (10% significance level). In addition, environmental factors such as perceived levels of pollution can also impact villager perceptions of overall health.
We examine perceived overall health in the regression framework, and the results are shown in Appendix Table A17. Model 1 contains the baseline regression with the treatment dummy and demographics, model 2 adds the PHS variables with significantly large mean differences as relevant controls, and model 3 adds perceived overall pollution as well as its interaction with the treatment village dummy. 17
In model 3, we see that there is no longer a difference in perceived health between the villages (the treatment dummy coefficient is insignificant). Interestingly, we find that an increase in perceived pollution lowers perceived health in the treatment village but improves it in the base village.
Again, the different geographies of the villages may provide an explanation. The more pristine environment of the treatment village has kept treatment villagers to be more sensitive to the negative effects of pollution on their perceived overall health. 18 In contrast, base villagers appear to have adjusted their health perceptions to the more compromised environment of the base village, and this phenomenon might be explained by hedonic adaptation (Frederick & Loewenstein, 1999) as mentioned in the literature review section.
Perceived Quality of Life
For the PQL variable, Appendix Table A18 reveals that base villagers perceive higher quality of life as compared to treatment villagers (1% significance level). Given initial findings that base villagers have lower average income as well as lower PEQ, this result is striking.
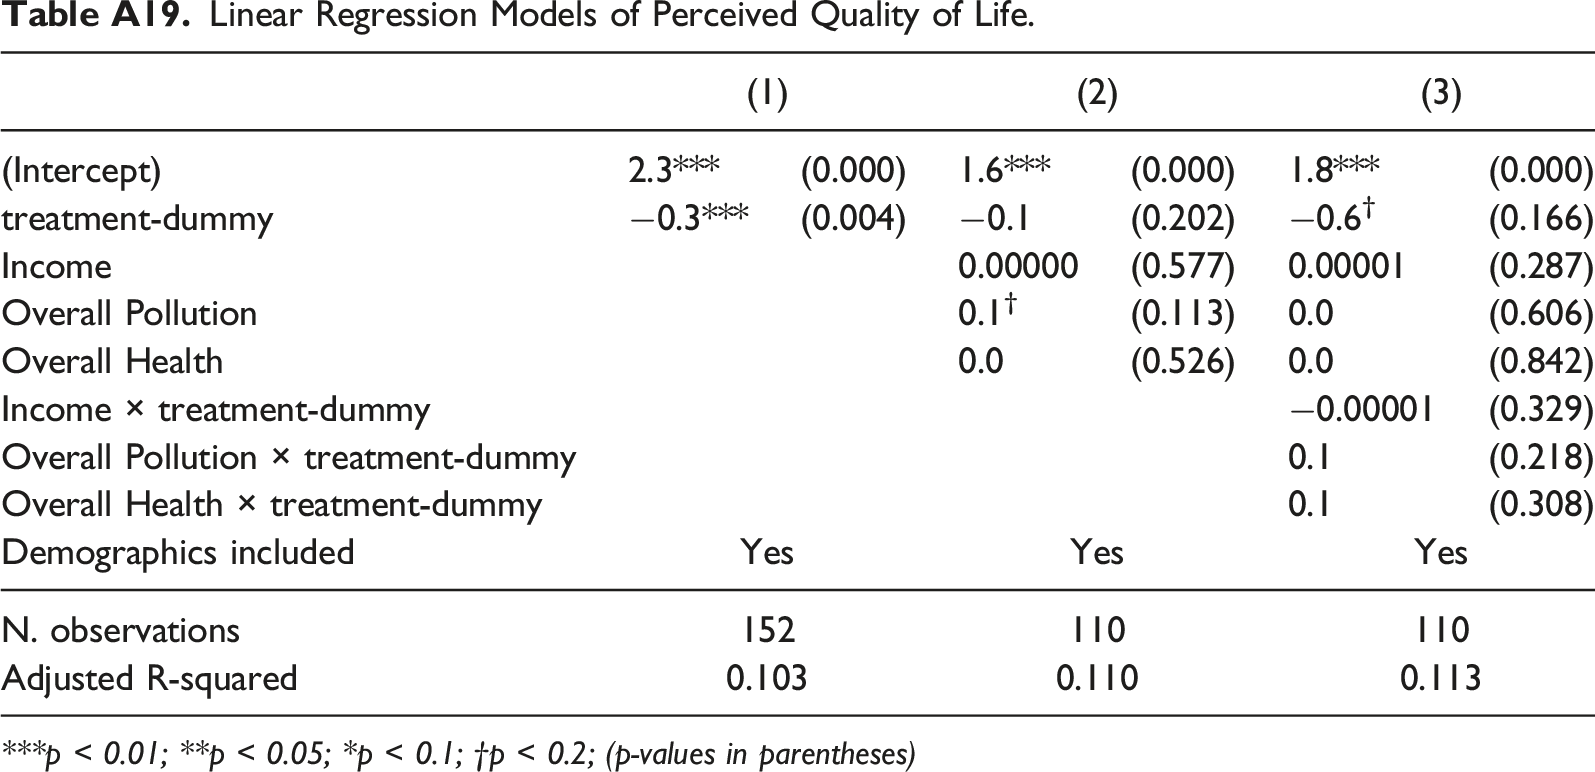
The determinants of PQL are analyzed within the regression framework (see Appendix Table A19). Model 1 includes the baseline regression, model 2 adds income, overall pollution, and overall health, and model 3 adds the interaction terms between those variables and the treatment dummy.
We note that base villagers rate a higher quality of life in all three models (with marginal significance in models 2 and 3). Also, income and overall health have the expected positive coefficient sign but are not significant (models 2 and 3). Surprisingly, the coefficient on overall pollution is positive and marginally significant (20% significance level) in model 2. However, in model 3, the positive effect of overall pollution on quality of life holds for both villages, but the effect is not statistically significant. 19
The absence of explanatory power in the PQL regressions signals that aspects of life beyond income, overall pollution, and overall health are necessary to understand why base villagers have higher PQL than treatment villagers. This finding is supported by the adjusted R-squared values in Appendix Table A12 where, despite the addition of these socioeconomic variables, the values only slightly increase from 10% in model 1 to 11% in models 2 and 3. 20 Possible omitted variables may include more intangible aspects of village life such as local culture and history. This notion is explored in the subsequent text analysis.
Text Analysis
Text analysis is conducted to discover why base villagers might perceive higher quality of life than treatment villagers. Throughout each interview, villagers freely responded to several open-ended questions, and their responses were translated from Thai to English. 21 Then, basic text analysis was applied to gauge the overall response from each village.
The analysis is performed using the R programming language, chiefly the tidyverse (Wickham et al., 2019) and tidytext (Silge & Robinson, 2016) packages. 22 Common words of natural language, referred to as “stop words,” are filtered out using the onix lexicon provided in the tidytext package. 23 Next, responses are separated by village, and words that appear five or more times are filtered and sorted in descending order of frequency. These steps are repeated for “bigrams”—two-word pairs—for comparison.
One of the questions asked to villagers was, “What are some things you like about living in your village?” Figures 11 and 12 present the results for individual words and bigrams, respectively. Text Analysis (words). In response to the question, “What do you like about your village?” Text Analysis (bigrams). In response to the question, “What do you like about your village?”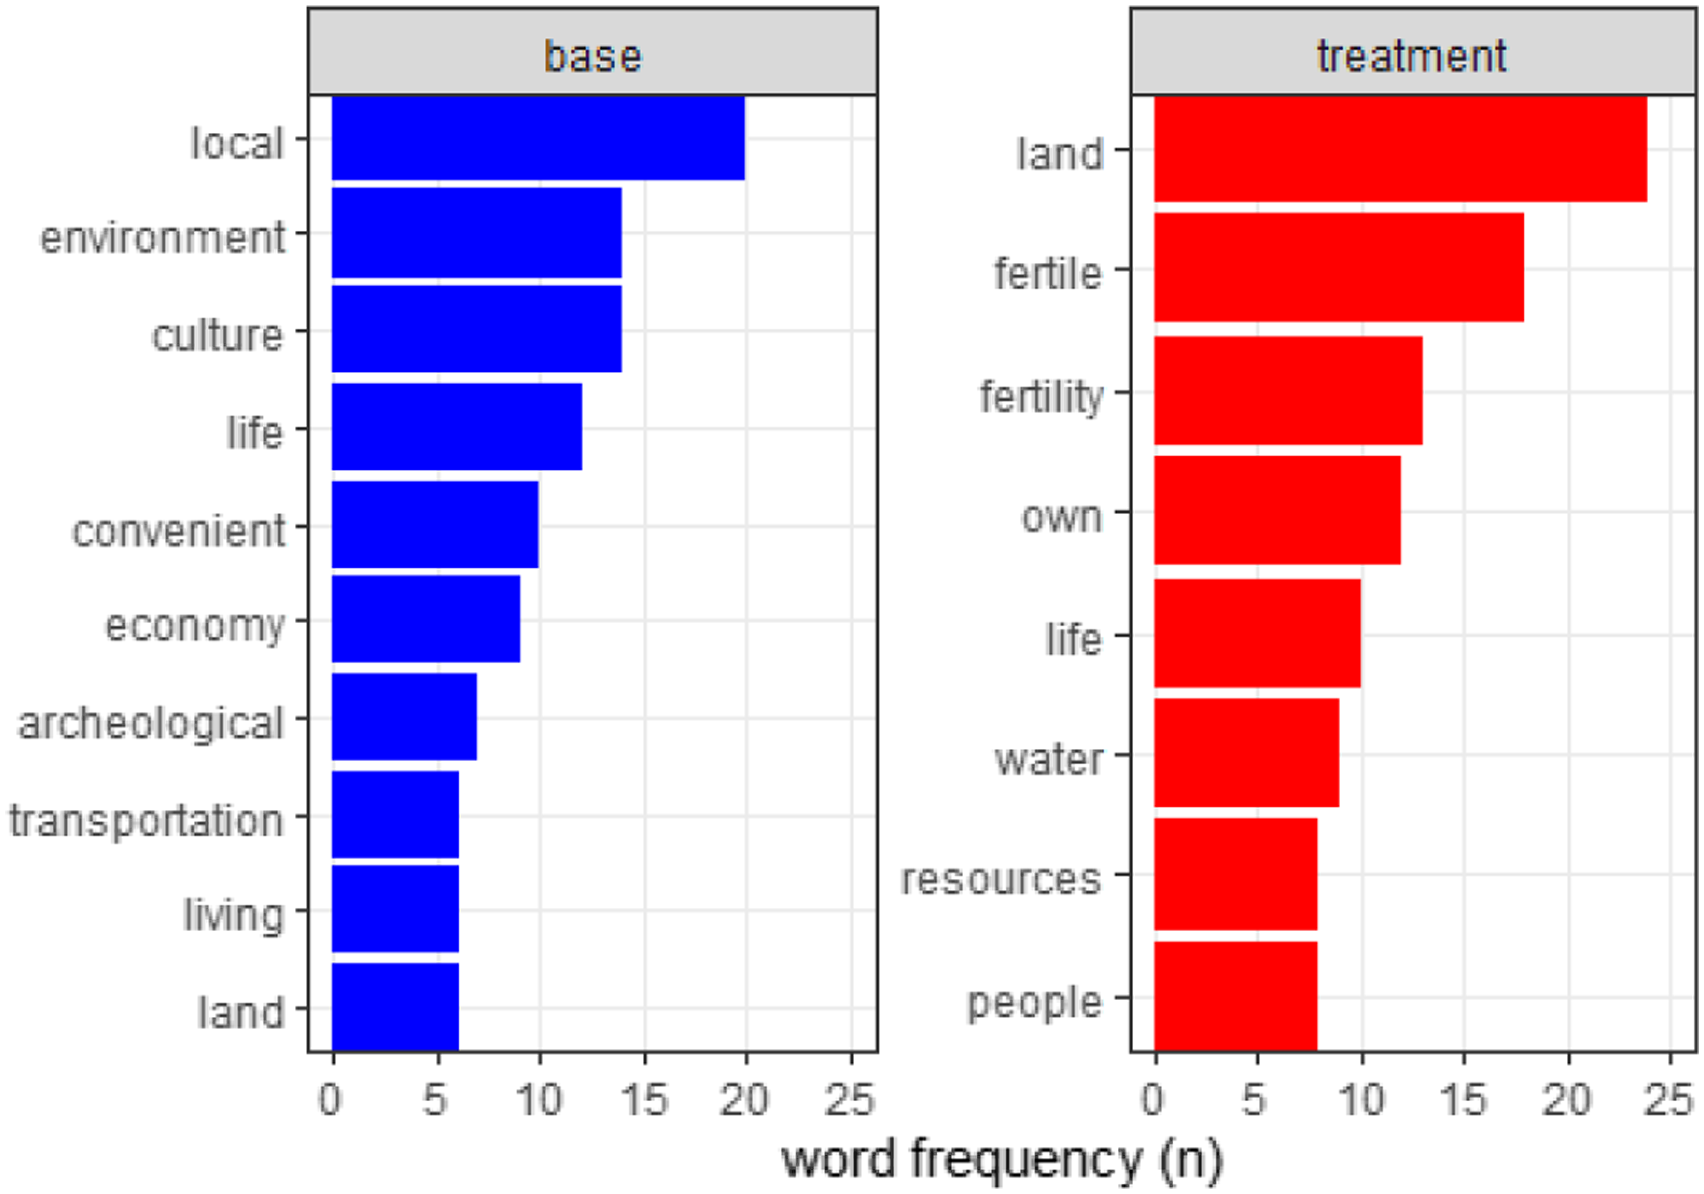
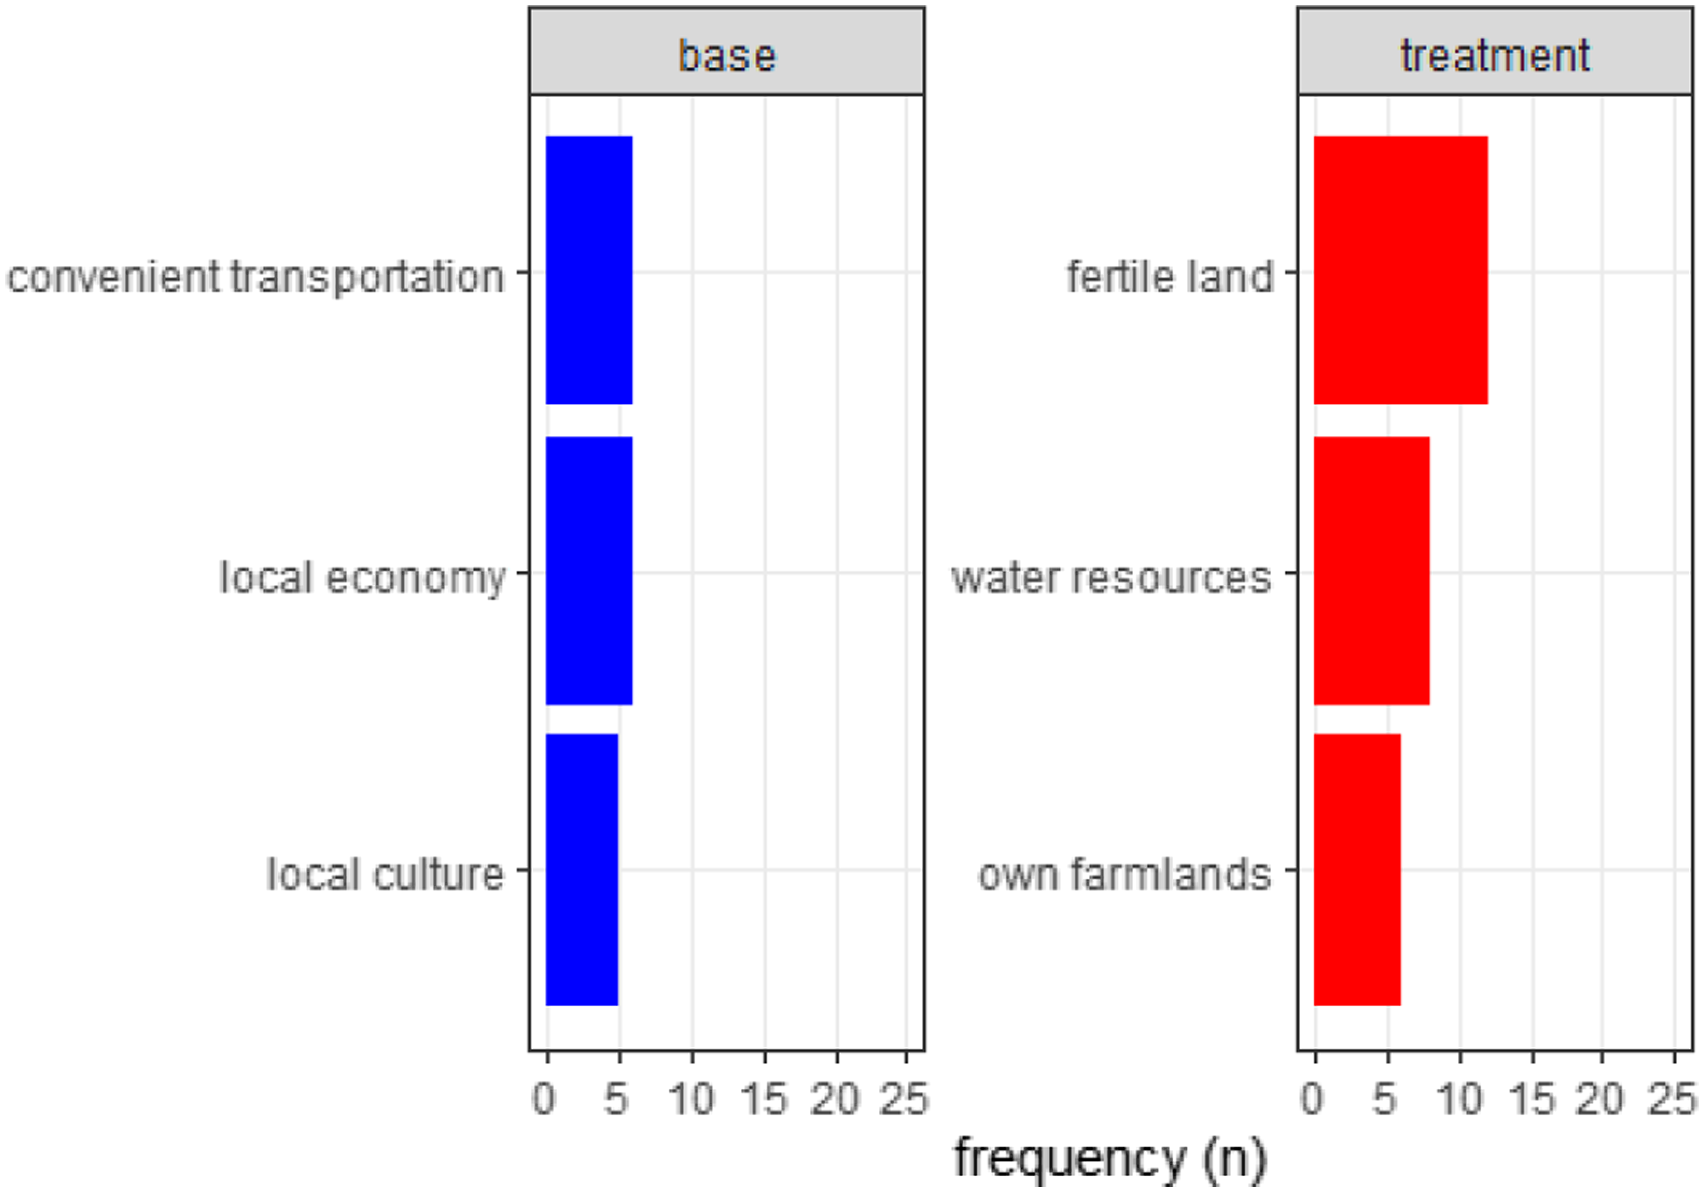
The top two base villager bigrams of “convenient transportation” and “local economy” likely refer to the ability to earn income from private service jobs. The base village is adjacent to a busy main road that leads into the district town. Having such infrastructure nearby provides villagers with access to bigger markets and more private service opportunities. 24
Base villager responses also convey a strong sense of connection to the “environment” (second most common individual word, see Figure 11), despite previous results demonstrating that base villagers report lower PEQ. This connection is underpinned by the results of the last PEQ variable: 80% of base villagers prefer protecting the environment over economic growth, whereas only 30% of treatment villagers made the same choice (see Appendix Table A10). The overwhelming majority of base villagers prioritizing the environment indicates that it plays an important role in their life, or perhaps since the status of the village environment is more precarious, they have greater appreciation for it.
In contrast, treatment villager responses in both individual words and bigrams show that they are happy with the quality and availability of the land and water resources that enhance their farmlands. Since agriculture is the predominant source of income for most treatment villagers, the importance of an environment conducive to an agricultural livelihood is justifiable.
An interesting result from the text analysis is the base villager responses of “local culture” (ranked third among bigrams, see Figure 12) and “archeological” (ranked seventh among individual words, see Figure 11). The word “archeological” refers to a local museum located on the temple grounds of the base village containing artifacts dug up from the 12th century, and some base villagers evidently speak highly of this rich history. This result provides candidates for potential extraneous factors or omitted variables in the regression analysis (see model 3 in Appendix Table A12). It may also explain why base villagers report a higher PQL rating than treatment villagers (see Appendix Table A18) even though the economic and environmental indicators are in favor of the treatment village.
Conclusion
This research examines the potential socioeconomic impact of a proposed sugarcane factory on a nearby (base) village by comparing it to a similar (treatment) village located within the same region but near an existing sugarcane factory. Similar studies in Thailand assess how sugarcane farming has directly affected farmers and agricultural workers, but this study widens the perspective to the village community by shedding light on the structural changes of the socioeconomic fabric of a village once it becomes a part of the sugarcane supply chain. In addition, this research broadens the social dimension of socioeconomic impact as compared to previous studies by exploring perceived environmental quality and health status as relevant dimensions of village life.
The key findings show that average household income is higher in the treatment village than in the base village, and this difference is motivated mainly by the higher income earned from specializing in sugarcane farming by treatment villagers. Despite the potential environmental harm from sugarcane farming (e.g., burning before harvesting), treatment villagers still report better perceived environmental quality compared to base villagers. For perceived health status, treatment villagers rate their physical, mental, and emotional aspects of health higher than base villagers, yet ratings of overall health are lower for treatment villagers. Finally, despite base villagers having lower household income as well as worse perceived environmental quality, it is base villagers who perceive higher quality of life as compared to treatment villagers.
The regression analysis reveals that overall health is negatively correlated with higher levels of overall pollution for treatment villagers, as expected, but the opposite holds in the base village. Apparently, base villagers have adapted to living with higher pollution levels, which may explain the positive correlation between perceived overall health and pollution in their survey responses.
The reason base villagers have higher perceived quality of life than treatment villagers may be linked to confounding factors not included in the regression analysis. More specifically, the text analysis illustrates that base villagers value their local culture and archeological sites, and these less tangible yet relevant factors in the base village evidently contribute more positively to quality of life for base villagers.
Regarding future research, the direct extension of this project would be the creation of the longitudinal study, mentioned in the methodology section, by repeating the survey in both villages a couple years after the construction of the sugarcane factory near the base village. In doing so, the base village becomes the treatment village, the treatment village takes on the role of control village, and a true difference-in-difference analysis can be performed to derive a more accurate measure of the socioeconomic impact of the sugarcane factory.
Furthermore, a revised survey would include additional questions pertaining to perceived quality of life that capture less tangible facets of life such as local culture and history. Such an investigation would use varying degrees of self-evaluation and external measurement to build upon the literature of SWB.
Supplemental Material
Supplemental Material - Evaluating the Potential Socioeconomic Impact of a Proposed Sugarcane Factory on the Village of Mueang Phia, Thailand
Supplemental Material for Evaluating the Potential Socioeconomic Impact of a Proposed Sugarcane Factory on the Village of Mueang Phia, Thailand by Hideo Ishii-Adajar by The American Economist
Footnotes
Acknowledgments
I would like to thank two anonymous referees for their useful comments, Dr. Osang for his guidance, Dr. David Doyle and Dr. Brandon Miller for their academic support, Dr. Adam Neal for his engagement, Praves Hongjanya for his fixer and translation work, CIEE Khon Kaen for the invaluable connections, and my parents for their patience and understanding. Additionally, I extend my appreciation to Dr. Shabbir H. Gheewala, Dr. Viroj NaRanong, the Office of Cane and Sugar Board, the Office of Agricultural Economics, and the manager at the sugarcane factory in Khon Kaen for allowing me to interview them during the field research.
Declaration of Conflicting Interests
The author(s) declared no potential conflicts of interest with respect to the research, authorship, and/or publication of this article.
Funding
The author disclosed receipt of the following financial support for this article: The field research was funded by the Richter International Fellowship and Engaged Learning Fellowship of Southern Methodist University.
Author’s Note
This paper is an extension of my senior distinction thesis in economics completed under the mentorship of Dr. Thomas Osang at Southern Methodist University.

Supplemental Material
Supplemental material for this article is available online.
Notes
Appendix
Linear Regression Models of Perceived Quality of Life.
| (1) | (2) | (3) | ||||
|---|---|---|---|---|---|---|
| (Intercept) | 2.3*** | (0.000) | 1.6*** | (0.000) | 1.8*** | (0.000) |
| treatment-dummy | −0.3*** | (0.004) | −0.1 | (0.202) | −0.6† | (0.166) |
| Income | 0.00000 | (0.577) | 0.00001 | (0.287) | ||
| Overall Pollution | 0.1† | (0.113) | 0.0 | (0.606) | ||
| Overall Health | 0.0 | (0.526) | 0.0 | (0.842) | ||
| Income × treatment-dummy | −0.00001 | (0.329) | ||||
| Overall Pollution × treatment-dummy | 0.1 | (0.218) | ||||
| Overall Health × treatment-dummy | 0.1 | (0.308) | ||||
| Demographics included | Yes | Yes | Yes | |||
| N. observations | 152 | 110 | 110 | |||
| Adjusted R-squared | 0.103 | 0.110 | 0.113 | |||
***p < 0.01; **p < 0.05; *p < 0.1; †p < 0.2; (p-values in parentheses)
Author Biography
References
Supplementary Material
Please find the following supplemental material available below.
For Open Access articles published under a Creative Commons License, all supplemental material carries the same license as the article it is associated with.
For non-Open Access articles published, all supplemental material carries a non-exclusive license, and permission requests for re-use of supplemental material or any part of supplemental material shall be sent directly to the copyright owner as specified in the copyright notice associated with the article.
