
Abstract
We measure the regulatory burden Dodd-Frank imposes and the regulatory relief the Economic Growth, Regulatory Relief, and Consumer Protection Act (EGRRCPA) affords. We analyze burden and relief on various measures of bank performance. And we emphasize community-bank holding companies (BHC). Based on data in the Consolidated Financial Statements for Holding Companies (FR-Y9C) reports from 1991 to 2019 and a model of a price-taking intermediary, we parsimoniously specify each performance measure as a function of BHC-specific observable variables, BHC-specific unobservable heterogeneity, Dodd-Frank regulation, and EGRRCPA relief. On balance, we find Dodd-Frank reduces loans per assets and loans per employee, while it increases non-interest expenses. Meanwhile, EGRRCPA provides some regulatory relief. For example, for mid-sized community BHCs, the implementation of EGRRCPA increases return on assets by roughly 23 basis points annually.
Keywords
Introduction
In the decade since the Dodd-Frank Wall Street Reform and Consumer Protection Act (hereafter, Dodd-Frank) passed into law on July 21, 2010, many lawmakers and regulators have sought to ease the act’s regulatory burden on banks in general and community banks in particular. To date, the Economic Growth, Regulatory Relief, and Consumer Protection Act (EGRRCPA), passed into law on May 24, 2018, stands out as the most intentional and comprehensive effort in this regard. The act’s provisions address issues specifically related to Dodd-Frank, as well as other regulatory matters. At least three of the act’s six titles address Dodd-Frank rules, implemented years after the original act passed, pertaining to mortgage loans, real-estate appraisals, escrow requirements, and capital-adequacy requirements. And, EGRRCPA specifically targets community banks—essentially, those institutions with 10 billion dollars or less of total assets. The act permits these institutions to meet a simple community bank leverage ratio—tier-1 capital over average consolidated assets—instead of conventional ratios based on the risk composition of assets; and the act exempts these institutions from the Volcker Rule—which prohibits banks from trading, investing in, or sponsoring, with their proprietary accounts, hedge funds or private equity funds—and reduces the reporting requirements and examinations these institutions otherwise face. The act also intends to relieve regulatory burdens on relatively large institutions otherwise subjected to enhanced prudential regulation.
In this paper, we measure the combined effects of the regulatory burden Dodd-Frank imposes and the regulatory relief EGRRCPA affords. We focus on depository institutions and, in particular, community banks. Generally, community banks practice relationship, as opposed to transactional, banking in small, local markets. As such, community banks rely heavily on interpersonal relationships. About one third of U.S. counties rely exclusively on community banks, which provide a crucial source of financial services to households and small businesses. Over 90% of depository institutions in the United States are community banks. Although its framers intended Dodd-Frank to ensure the safety and soundness of the very largest and systemically important financial institutions, community bankers and impartial observers alike reason the act has likely increased the regulatory burden on community banks, requiring these banks to incur additional compliance costs and perhaps surrender business opportunities. Moreover, community-bank advocates reason that any regulatory burden Dodd-Frank imposes—intentionally or otherwise—on community banks is, at best, misplaced because community banks could neither cause nor propagate a financial crisis and, at worst, welfare reducing because regulatory burden could reduce community-banking output to sub-optimal levels.
For the most part, the regulatory-burden literature has emphasized Dodd-Frank as a whole. In this paper, we emphasize the effects on various measures of bank performance of Dodd-Frank as a whole, of a subset of its subsequent mortgage and capital-adequacy rules, and of EGRRCPA. To be sure, EGRRCPA seeks, in part, to address the regulatory burdens that this very subset of Dodd-Frank rules potentially imposes. Based on data from the Consolidated Financial Statements for Holding Companies (FR-Y9C) reports from 1991 to 2019 and a model of a price-taking firm—in our context, a bank-holding company (BHC)—we parsimoniously specify each of four performance measures—namely, expenses per assets (including non-interest expenses), loans per assets, loans per employee, and (pre-tax) return on assets—as a function of BHC-specific observable variables, BHC-specific unobservable (fixed-effect) heterogeneity, and Dodd-Frank-regulation and EGRRCPA-relief dummy variables. We estimate our models across five groups of BHCs, which we define based on asset size.
We find that, on balance, Dodd-Frank as a whole reduces loans per assets and loans per employee, while it increases non-interest expenses, notably for relatively small BHCs. Meanwhile, the effects of the subsequent Dodd-Frank rules vary by BHC size. These rules increase the loan share of assets for all except the largest BHCs and, for the most part, increase employee productivity, particularly at community BHCs. We reason these results obtain because the rules effectively lead banks to increase their asset shares of relatively high-yielding loans (as opposed to, say, relatively low-yielding cash reserves). Indeed, we find that while the asset share of real-estate loans does not respond to subsequent Dodd-Frank rules, the shares of agricultural, commercial-and-industrial, and household loans do respond positively and significantly. Additionally, these subsequent rules increase the non-interest expenses of the smallest community BHCs. In any case, regulatory burden, measured as Dodd-Frank or its subsequent rules, does not significantly affect return on assets.
Meanwhile, on balance, EGRRCPA provides some regulatory relief. The effect of the act on non-interest expense is significant and negative for mid-sized community BHCs. And, though on balance, the supply of loans relative to assets falls in response to the regulatory relief, community BHCs respond by reducing real-estate loans and increasing agricultural and household loans. In similar fashion, the regulatory relief increases the production of loans per employee for community BHCs in the contexts of commercial-and-industrial and household loans. Finally, and quite interestingly, the effect of EGRRCPA on return on assets is positive and significant for all except the smallest BHCs, suggesting that, in the context of profitability, EGRRCPA affords many banks regulatory relief. For example, for mid-sized community BHCs, the implementation of EGRRCPA increases return on assets by roughly 23 basis points annually. Moreover, this relief rises with BHC size and independently of community-BHC status: for example, for relatively large community BHCs, the relief rises to roughly 48 basis points annually; and for the largest (systemically important) BHCs, the relief rises to roughly 85 basis points annually.
Community Banking and Regulatory Burden
Generally, community banks generate revenue from loans they make to households and small businesses in sectors such as agriculture, real estate, and retail (Hein et al., 2005). Community banking relies heavily on interpersonal relationships and the so-called soft information these relationships reveal. Thus, perhaps not surprisingly, about one third of U.S. counties rely exclusively on community banks; rural communities are particularly reliant in this way (Council of Economic Advisors, 2016; Marsh & Norman, 2013). According to Lux and Greene (2015), community banks supply about 77% of loans to the agricultural industry, 46% of loans to the commercial real-estate industry, and 51% of loans to small businesses.
Although, in principle, the banking model—relationship or transactional—and not the size of the intermediary defines community banking, regulators typically identify a community bank according to the book value of its total assets. Frequently, federal regulatory agencies—and economists more generally—define a community bank as a depository institution with less than $10 billion of total assets; occasionally, regulators and researchers apply a lower balance-sheet threshold of less than $1 billion of total assets and consider exceptions based on special-case features including, for example, the extent to which an institution engages in basic (relationship) banking activities and its geographical footprint.
Distribution of Banking-Industry Assets across Bank Size as of March 31, 2021.

Source: Federal Deposit Insurance Corporation.
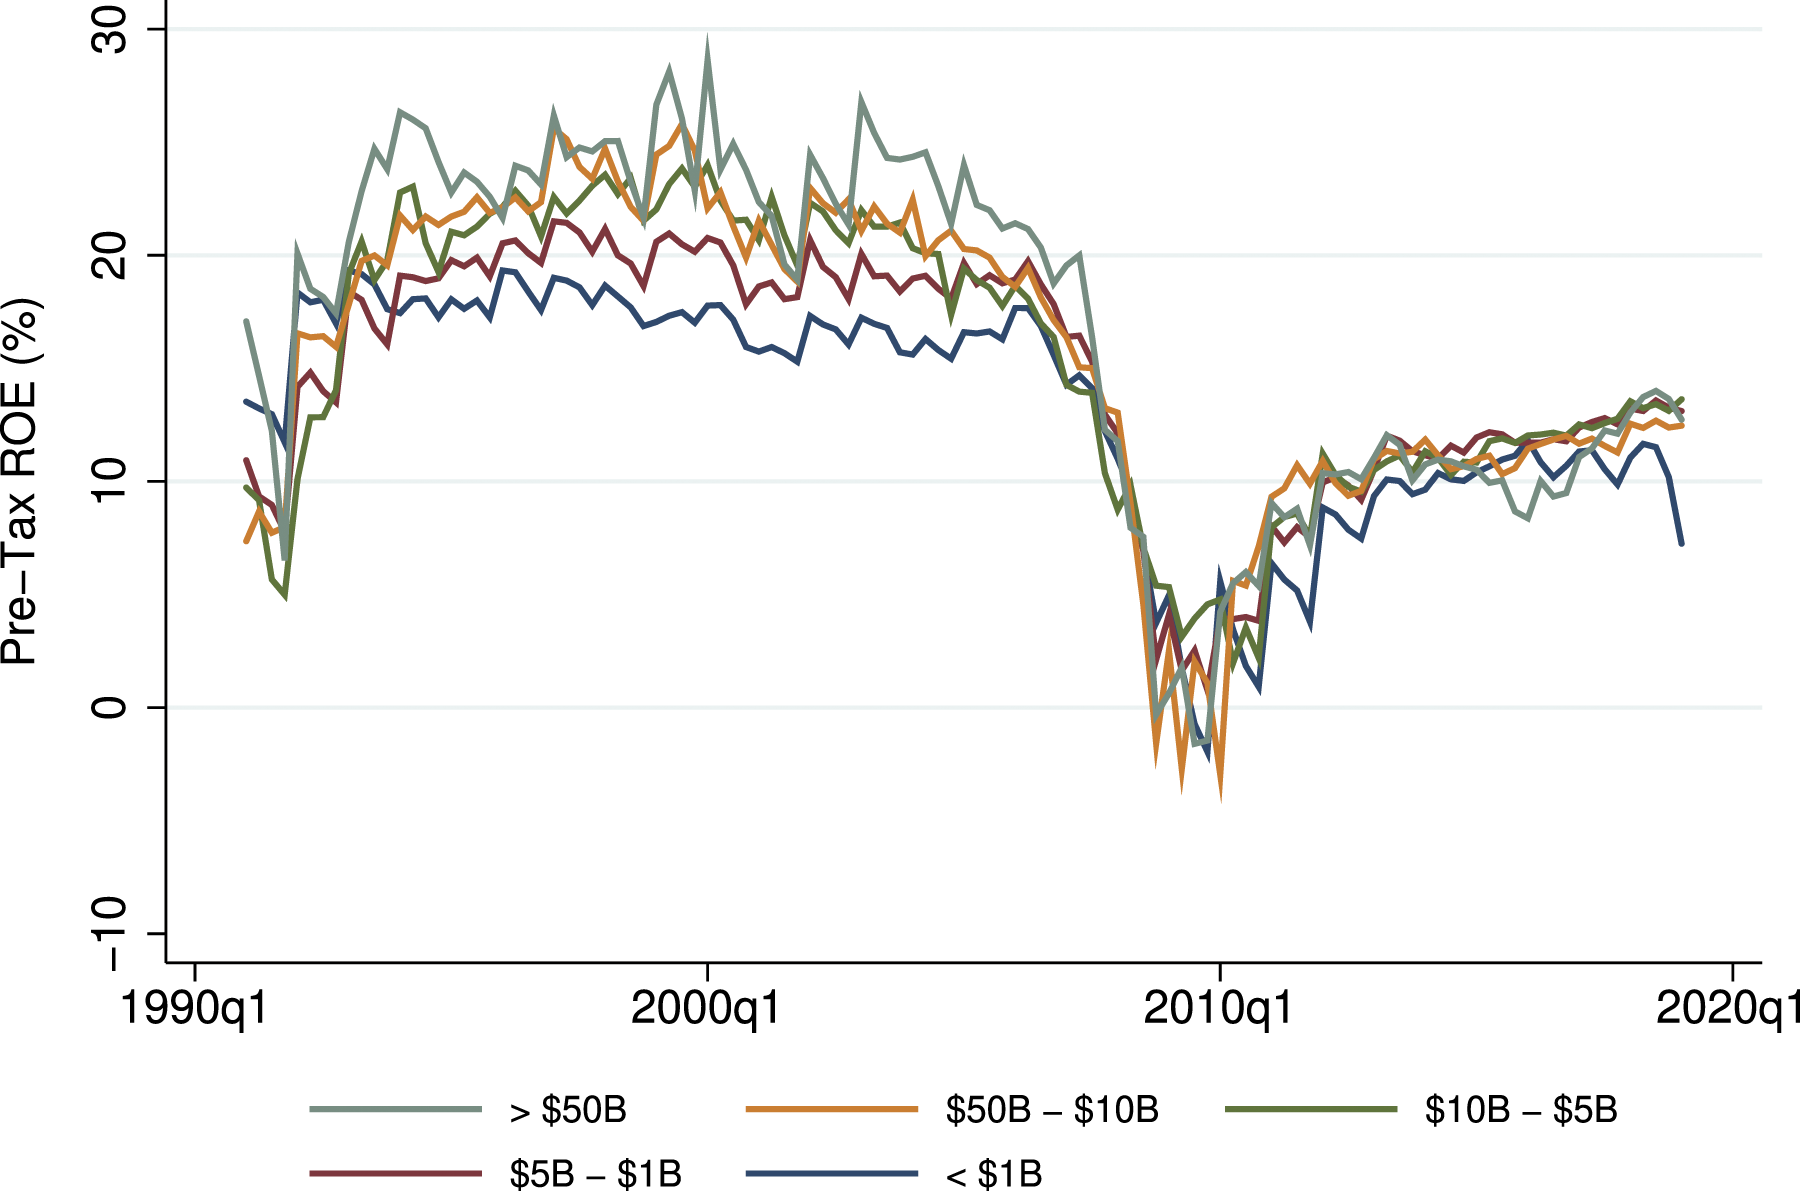
Qualified loans and local deposits are the main ingredients of community-bank asset transformation. Nevertheless, community banks have not been immune to systemic fragilities. As Figures 1 and 2 illustrate, during the 2008 financial crisis, all BHCs suffered dramatic declines in profitability; average annual pre-tax return on assets (Figure 1) and pre-tax return on equity (Figure 2) fell for all BHCs. Since the crisis, BHCs of all types have not, on average, earned their pre-crisis return on assets or equity. In any case, average annual community-BHC profitability (as measured by return on assets and return on equity) has long trailed the industry average. Quarterly pre-tax return on assets, bank-holding companies, 1991–2019. Source: Federal Reserve Board of Governors FR-Y9C reports. Quarterly pre-tax return on equity, bank-holding companies, 1991–2019. Source: Federal Reserve Board of Governors FR-Y9C reports.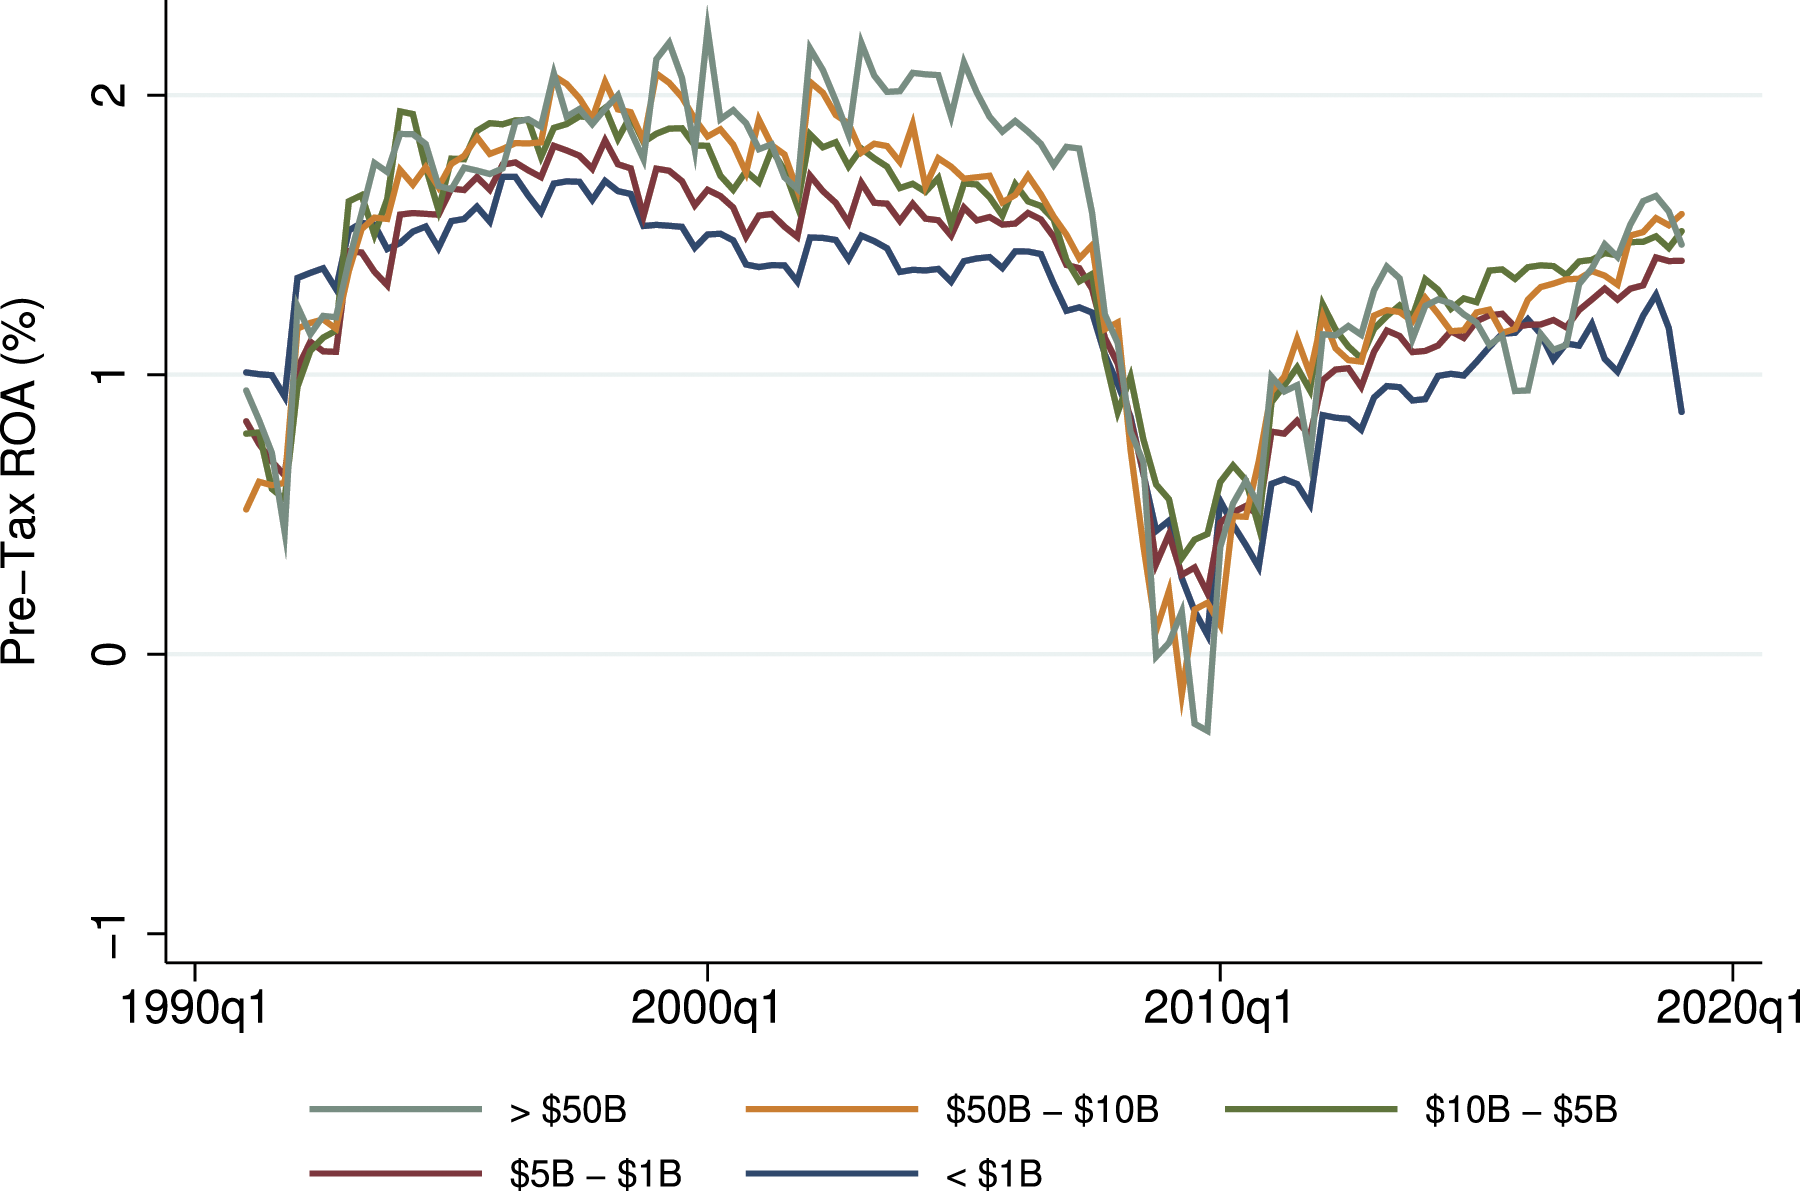
Debates about whether and to what extent financial regulation burdens financial intermediaries—community banks or otherwise—are not new, of course. For example, well before the most-recent financial crisis, the Federal Financial Institutions Examination Council (1992) estimated that annual compliance costs represented up to 14% of total non-interest expenses of the U.S. banking industry. Later, studying U.S. commercial banks and thrifts from 1992 to 2005, Dolar and Shughart (2007) concluded the Patriot Act imposed 45% higher compliance costs as measured by non-interest expenses; while Title III of the act fell most heavily on relatively small institutions. Meanwhile, studying 615 commercial banks in 74 countries from 2000 to 2004, Pasiouras et al. (2009) conclude that the three pillars of Basel II increased intermediation costs, while stricter capital requirements reduced profitability. Indeed, such investigations have gone beyond depository institutions. For example, Franks et al. (1997) conclude that, on average, compliance costs accounted for about 2% of net operating costs of UK securities firms and about 5% of net operating costs of UK investment-management firms.
Not surprisingly, this debate has grown since the 2008 financial crisis and, more specifically, the passage of Dodd-Frank. For example, Marsh and Norman (2013) argue that, although the most significant regulations under Dodd-Frank had not gone into effect by 2013, the act had already imposed significant compliance costs on community banks, thus putting community banks at a further competitive disadvantage to large banks. According to Federal Reserve 10th District community banks surveyed in 2014, mortgage regulations are the most expensive and time consuming. Survey respondents expected the number of their full-time employees to increase by 37% in the 3 years following the survey; and nearly 90% of respondents expected training expenses and technology upgrades to increase (Federal Reserve Bank of Kansas City, 2014). A survey of 200 community banks conducted by the Mercatus Center at George Mason University revealed similar regulatory burdens: for example, over 25% of respondents expected to hire additional compliance or legal personnel in the 12 months following the survey; about 37% of respondents had already hired new staff in order to meet the Consumer Financial Protection Bureau regulations, especially its mortgage rules; 94% of respondents reported that, in the wake of Dodd-Frank, they would not add products or services, and some reported they would discontinue some residential mortgages, mortgage servicing, home equity lines of credit, over-draft protections, and credit cards; and about 83% of respondents reported their compliance costs increased more than 5% since the passage of Dodd-Frank (Peirce et al., 2014).
In any case, regulatory-compliance costs for U.S. depository institutions are not matters of public record, in part because banks do not separately report the non-interest expenses associated with their compliance efforts. Thus, measuring (as opposed to surveying) the efforts banks expend to comply with regulations is not straightforward. Most researchers reason that if these efforts impose significant costs or otherwise shape the performance features of asset transformation, then these burdens should reflect themselves in various financial-statement measures of bank performance. For example, Hogan and Burns (2019) find a statistically significant increase in banks’ non-interest expenses, which include regulatory compliance costs, after the passage of Dodd-Frank. Meyer and Neely (2016) conclude that compliance costs comprise more than 8% of total non-interest expenses at U.S. banks with $100 million or less of total assets, and 3% of total non-interest expenses at banks with between $1 billion and $10 billion of total assets. Cyree (2016) concludes, in part, that major regulatory changes affect the banking industry; though, these effects are conditional on the type of regulation. For example, the author concludes that pre-tax return on assets of community BHCs fell significantly in relation to the Ability-to-Repay and Qualified Mortgage standards of Dodd-Frank, while they rose significantly in relation to the Patriot Act. And, based on Federal Reserve community-bank data from 2012, Feldman et al. (2013) estimate that hiring one additional employee to respond to an increase in regulation reduces return on assets by 23 basis points for community banks with less than $50 million of total assets, rendering nearly 13% of this bank group unprofitable all else equal.
The Dodd-Frank Act and the EGRRCPA
The notion that regulatory burden varies across bank size—and, thus, that the burden may fall disproportionately on community banks—is based on the principle of economies of scale: the average cost of producing banking services falls [rises] as production (and thus bank size) rises [falls]. Simply put, large banks benefit from economies of scale because they can spread their fixed costs—including, perhaps, regulatory-compliance costs—across a large quantity of production (i.e., assets); the inability of small banks to do the same results in their greater regulatory burden in the form of, say, less productivity, higher explicit costs, and lower profitability (Brewer & Russell, 2016; Cyree, 2016; Feldman et al., 2013; Pasiouras et al., 2009).
Evidence that economies of scale generally shape average cost of production in banking abounds. For example, between 1984 and 2008, the number of commercial banks in the U.S. fell by more than 50% (from 14,482 to 7086), while average commercial-bank assets increased five-fold (Wheelock & Wilson, 2012). During much of this time, banks enjoyed increasing returns to scale; thus, as banks supplied additional services, their profits rose (Berger & Mester, 2003; Hughes & Mester, 2013). Put differently, then, banks spread their fixed costs across more services and lowered average cost accordingly (Hein et al., 2005). Demonstrating the extent to which institutions are disproportionately burdened or relieved by regulation associated with Dodd-Frank and EGRRCPA, conditional on the sizes of the institutions, is another matter—and the focus of this paper.
The Dodd-Frank Act
More than a decade has passed since Dodd-Frank became law in July 2010 in response to the financial crisis of 2008. The act, which addresses many issues that policymakers reason contributed to the financial crisis in 2008, is perhaps the most comprehensive financial regulatory reform of the 21st century. By all accounts, the authors of the bill intended to target the largest financial institutions—those that pose the greatest systemic risks. For example, the act establishes the Financial Stability Oversight Council (FSOC) to monitor the U.S. financial system and to identify systemic risks; the Secretary of the Treasury chairs the fifteen-member FSOC. Additionally, the act creates the Consumer Financial Protection Bureau (CFPB) to supervise banks and large non-banks such as credit-reporting agencies and debt-collection companies. The responsibilities of the CFPB include ensuring consumers are provided clear information and protected from unfair, deceptive, or abusive practices, monitoring compliance with federal consumer law, and ensuring consumer financial law is enforced appropriately and financial products and services are delivered transparently and efficiently (Government Accountability Office, 2015). Community banks are not examined by the CFPB; though, these banks are subject to the rules written by the CFPB.
Thus, for the most part, its framers did not intend Dodd-Frank to apply to community banks; in many instances, the act explicitly exempts institutions with $10 billion or less of total assets. In any case, by some accounts, the act (and the rules the act subsequently enables) burdens community banks by raising operating and opportunity costs. A bank incurs operating costs when it complies with regulations; for example, when it trains more staff, spends more time reviewing loan applications, and hires more compliance officers. Meanwhile, it incurs opportunity costs when it surrenders business opportunities in order to comply with regulations. Thus, in addition to increasing costs, regulatory compliance likely alters asset transformation—specifically, loan production—and profitability.
According to the 23rd real-estate lending survey of the American Bankers Association, the primary drivers of increased compliance costs are time allocation, technology costs, and loss of efficiency (American Bankers Association, 2016). As early as 2011, Marty Reinhart, president of a $100-million community bank in Wisconsin said the following about the effect of Dodd-Frank on residential mortgage lending: Extra forms with early disclosures and having to register and finger print mortgage loan officers, adds to costs associated with this type of lending. It creates delays, additional cost and confusion on the part of the borrower. A typical mortgage file will have more than 100 pages by the time the loan is closed (Reinhart, 2011).
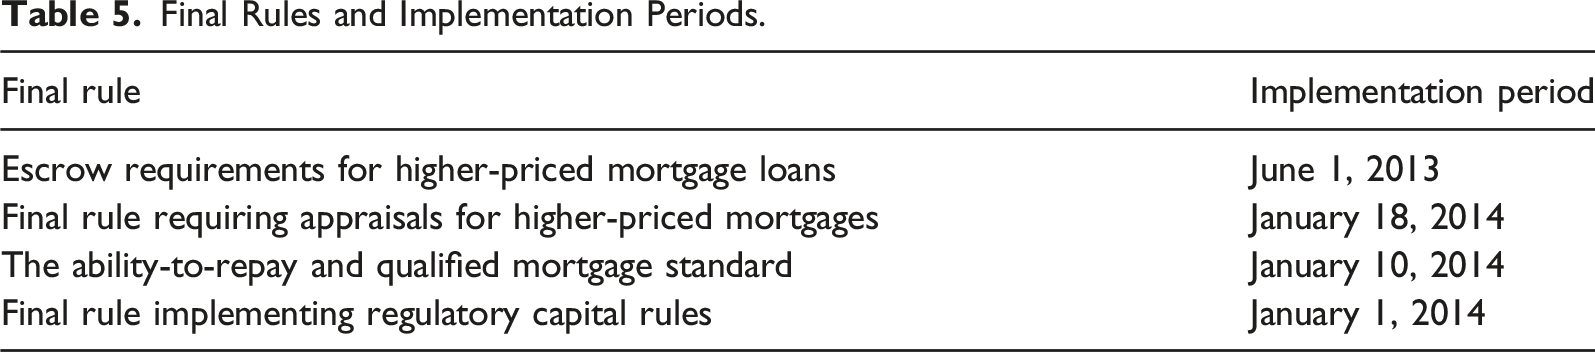
In any case, several rules associated with Dodd-Frank were implemented in the years following its passage in July 2010. Based on analyses of the American Bankers Association (2012), the Congressional Research Service (Hoskins & Labonte, 2015), and the Government Accountability Office (2015), and responses from surveys conducted by the ABA (2016) and Peirce et al. (2014), we reason four of these rules, implemented between June 2013 and January 2014, are potentially most consequential for traditional depository institutions including, of course, community banks. To be sure, EGRRCPA seeks, in part, to address the regulatory burdens that these very rules potentially impose. Next, we briefly describe these rules and, then, we discuss how EGRRCPA pertains to each.
Escrow requirements for higher-priced mortgage loans (Regulation Z). This rule took effect on June 1, 2013. The final rule requires creditors to establish and maintain an escrow account for 5 years (instead of 1 year) for first-lien higher-priced mortgage loans. The purpose of this final rule is to ensure that customers set aside funds to pay property taxes, premiums for homeowner’s insurance, and other mortgage-related insurance required by the creditor. The final rule exempts small creditors that operate predominately in rural or underserved areas and meet certain other criteria.
Final rule requiring appraisals for higher-priced mortgages (Regulation Z). This rule took effect on January 18, 2014. The final rule requires creditors to obtain appraisals meeting certain standards for mortgages that have an annual percentage rate that exceeds the average prime offer rate. The creditor must provide the borrower a statement regarding the purpose of the appraisal and, within 3 business days before the mortgage is final, a free copy of the appraisal.
The Ability-to-Repay and Qualified-Mortgage standards under the Truth in Lending Act (Regulation Z). This rule took effect on January 10, 2014. The Ability-to-Repay and Qualified Mortgage standards require lenders to make a good-faith determination that the borrower has the ability to pay back a loan. The creditor must consider different underwriting factors such as the borrower’s current employment status, debt to income ratio, assets, and credit history in order to determine the borrower’s ability to repay. Creditors are also required to make qualified mortgage loans, which must meet additional underwriting and pricing standards and comply with the ability to repay. A qualified mortgage loan requires that a borrower’s debt-to-income ratio does not exceed 43%.
Final rule implementing regulatory capital (Regulations H, Q and Y). This rule took effect on January 1, 2014. The final rule implements higher minimum capital requirements, including a new common equity tier-1 capital requirement. This rule also establishes criteria to define common equity tier-1 capital. And the rule imposes restrictions on regulatory capital instruments; for instance, under certain conditions, trust preferred securities and cumulative perpetual stock are categorized as tier-1 capital. Additionally, the rule requires a capital-conservation buffer equivalent to 2.5% of risk-weighted assets and composed of common equity tier-1 capital. Regulators reason these capital rules improve the banking system’s risk profile and overall resilience.
EGRRCPA
In the decade since Dodd-Frank was passed, many lawmakers and regulators have sought to ease its regulatory burden on banks in general and community banks in particular. To date, the Economic Growth, Regulatory Relief, and Consumer Protection Act, signed into law by President Donald Trump on May 24, 2018, stands out as the most intentional and comprehensive effort in this regard. The act’s provisions address issues specifically related to Dodd-Frank, as well as other regulatory matters. Regulatory relief is a principal feature of the act. According to the Congressional Research Service (CRS), most changes proposed by the act fall into one of five categories, which the CRS identifies as, “(1) mortgage lending, (2) regulatory reform for ‘community’ banks, (3) consumer protection, (4) regulatory relief for large banks, and (5) regulatory relief in securities markets” (Perkins et al., 2018).
Several sections associated with three of the act’s six titles—namely, Title I, Title II, and Title IV—potentially pertain in material ways to the performance of depository institutions in general and community banks in particular. These titles address, in part, the regulatory burdens imposed by Dodd-Frank rules that we discuss above: namely, the ability-to-repay rule, the appraisal rule, the escrow-requirement rule, and the capital-adequacy rule.
Title I of the act relaxes mortgage-lending rules that define qualified mortgages in the context of the Ability-to-Repay Rule (Section 101), waives independent appraisals on federal-government-related mortgages that underwrite assets located in rural areas (Section 103), and exempts banks (and credit unions) from some reporting requirements associated with the Home Mortgage Disclosure Act (Section 104) and certain escrow requirements (Section 108).
Title II of the act specifically targets regulatory relief to community banks. The title permits community banks to meet a community-bank leverage ratio instead of now-conventional risk-based capital and leverage ratios (Section 201), exempts these institutions from the Volcker Rule (Section 203), reduces reporting requirements for institutions with assets valued at $5 billion or less (Section 206), and reduces the frequency of examinations for institutions with assets valued at $3 billion or less (Section 210).
Finally, Title IV of the act offers regulatory relief to relatively large institutions—those with assets valued between $50 and $250 billion—otherwise subject to so-called enhanced prudential regulation. The title exempts banks with assets valued between $50 and $100 billion from most enhanced regulation; meanwhile, though banks with assets valued between $100 and $250 billion remain subject to stress testing, these institutions are subject to enhanced regulation only at the discretion of the Federal Reserve System (Section 401).
Conceptual Framework
Direct and indirect regulatory-compliance costs or regulatory relief from these costs are not matters of public record, in part because banks do not separately report the non-interest expenses associated with their compliance efforts; and, in any case, we cannot readily observe—and, thus, readily account for—how compliance efforts shape bank performance. Nevertheless, if these efforts impose significant burdens, and if the cessation of these burdens affords regulatory relief, then these burdens and relief should reflect themselves in various financial-statement measures of bank performance. Our measures of bank performance are expenses per assets (including non-interest expenses per assets), loans per assets, loans per employee, and pre-tax return on assets.
To specify the drivers of each performance measure and, thus, to inform our econometric specifications, we model a depository institution—and, more specifically, a BHC—as a representative price-taking firm that engages in simple asset transformation: that is, the firm sources liabilities and uses them to acquire assets. Specifically, we assume the firm produces loans (L) by combining depositors’ financial capital (K), employees’ labor services (E), and the firm’s (idiosyncratic and unobservable) total-factor productivity (c). Thus, we model the firm’s loan production as specified generally in equation (1)
The firm minimizes cost and maximizes profit. Its cost minimization problem is specified in equation (2), where W
K
and W
E
are the factor prices of depositors’ financial capital (K) and employees’ labor services (E), respectively

The firm’s profit-maximization problem is specified in equation (4), where P is the rate of return (price) the firm receives on its loans
This model yields estimable and relatively parsimonious specifications of expenses per assets, loans per assets, loans per employee, and (pre-tax) return on assets; these specifications are based on the model’s relationships between factor inputs, factor prices, costs, and profits, which we express generally in equation (5) through (9), where lower-case notation denotes a natural logarithm and a subscript identifies assets (A) or employees (E) as the normalizing variable—the denominator in each case: for example, we define l
A
as the log of loans (L) as a share of assets (A). Additionally, we assume firm unobserved heterogeneity (c); and, we test for it in our corresponding (fixed-effect) panel regressions. Finally, we focus on these dependent variables because we reason these measures of efficiencies (l
A
and l
E
), operating costs (c
A
), and returns (π
A
) best reflect regulatory burdens, which we endeavor to estimate in this paper. Equations (5) and (6) represent loan production functions normalized by assets (A) and employees (E)

Equation (7) represents the cost function, which, as a practical matter, captures total expenses registered on the income statement, normalized by assets (A)
Equation (8) represents loan supply, normalized by assets
Finally, equation (9) represents (pre-tax) return on assets
Figure 3 illustrates loans as a share of total assets (l
A
) for community and non-community BHCs. We can think about this measure two ways: through the lens of the loan production function (equation (5)) or the loan supply function (equation (8)). According to equation equation (5), all else equal, loans as a share of assets rise as depositors’ financial capital as a share of assets (k
A
) rises, as labor services of full-time equivalent employees as a share of assets (e
A
) rise, or as assets (a) fall. Meanwhile, according to equation (8), loans supplied as a share of assets rise as the factor price of depositors’ financial capital as a share of assets Loans per assets (l
A
), bank-holding companies. Source: Federal Reserve Board of Governors FR-Y9C reports.
Figure 4 illustrates loans as a share of full-time-equivalent employees (l
E
). According to equation (6), all else equal, loans as a share of employees rise as depositors’ financial capital per employee (k
E
) rises or as the level of employees (e) falls. As a measure of productivity, we expect loans as a share of employees fall as regulatory burden rises if regulatory-compliance efforts require more labor inputs (employees) to produce the same output (loans). For example, to the extent that loan-originator compensation requirements increase loan-origination efforts, the implementation of this rule lowers mortgage lending per employee (Government Accountability Office, 2015). As with loans as a share of assets, we expect this measure rises as regulatory burden rises to the extent that regulatory-compliance efforts lead banks to produce more loans as a share of assets. In any case, Figure 4 reveals that the smallest BHCs are generally the least productive in the context of loan production. Loans per employees (l
E
), bank-holding companies. Source: Federal Reserve Board of Governors FR-Y9C reports.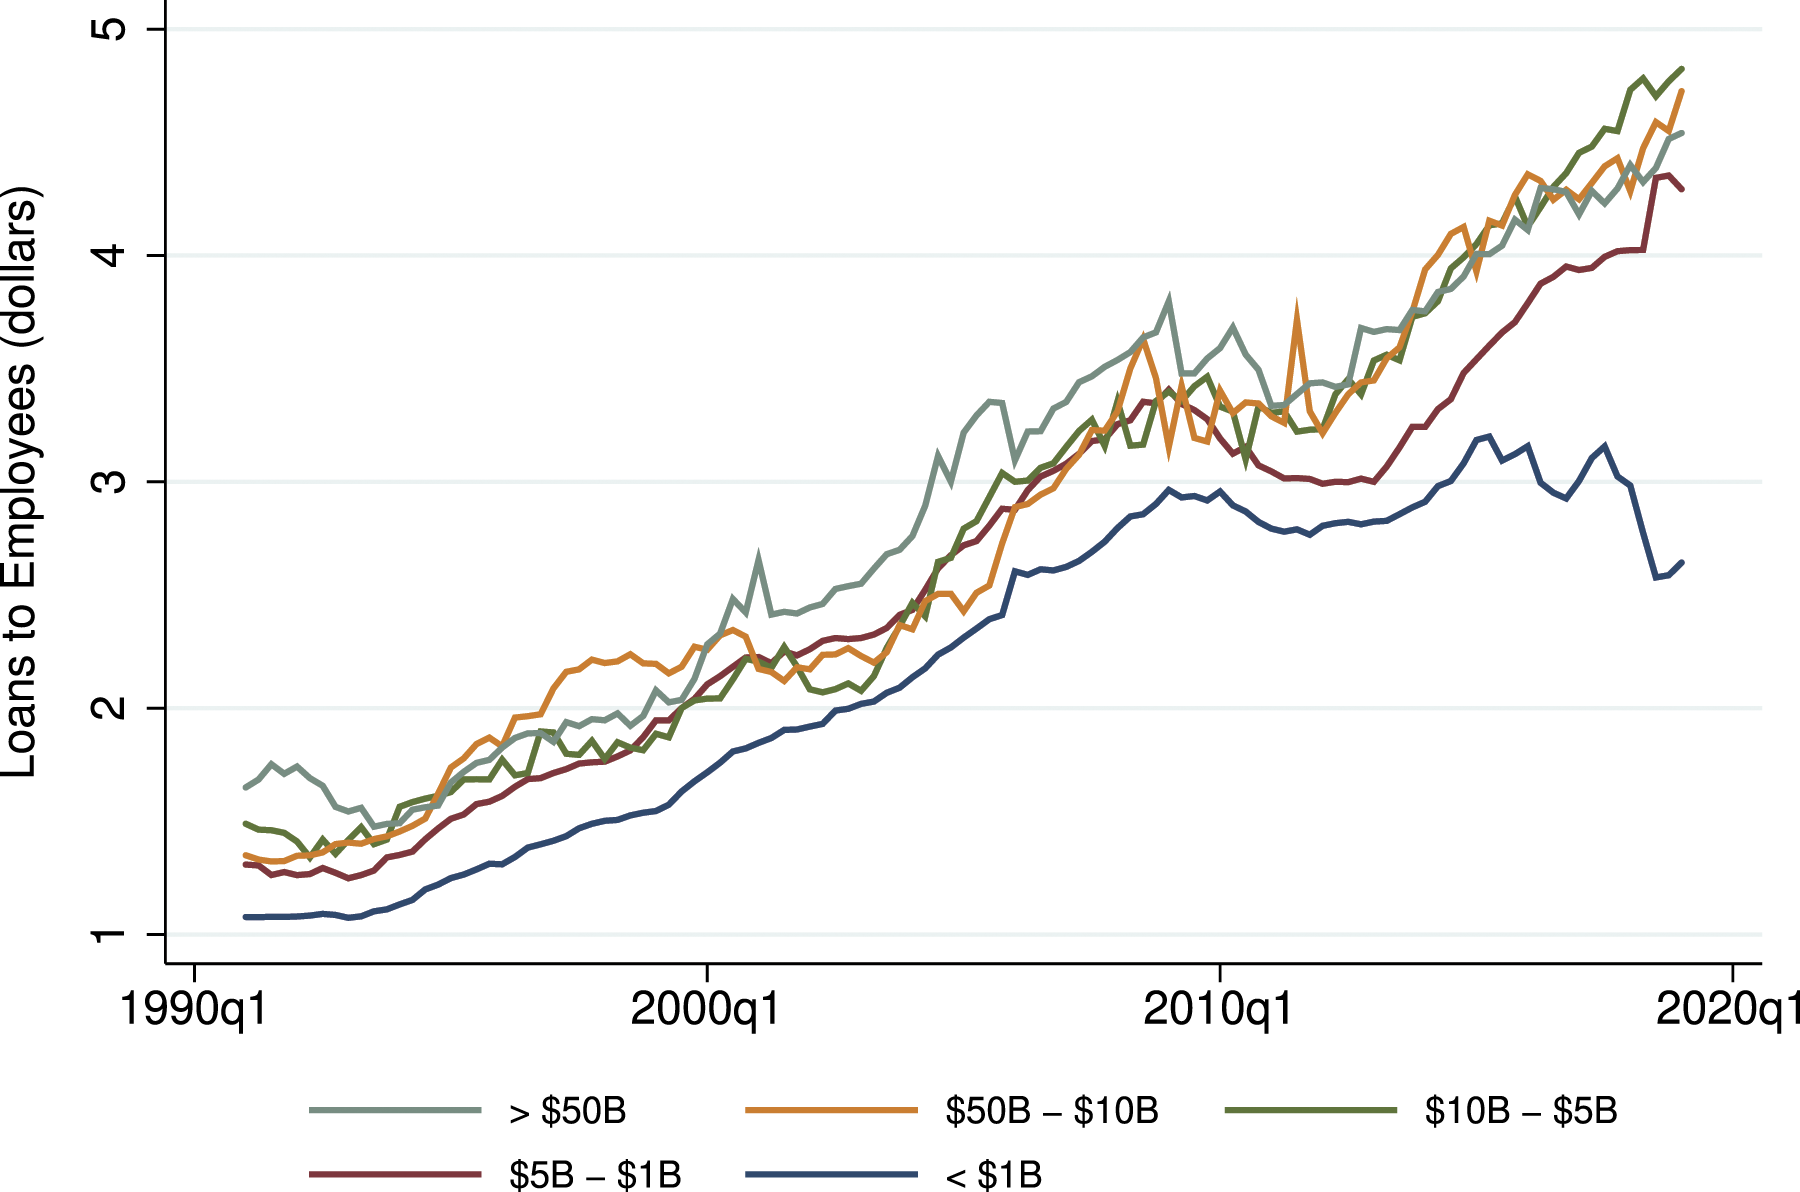
Figures 5 and 6 illustrate total expenses as a share of assets (c
A
) and non-interest expenses as a share of assets (oexp
A
). According to equation (7), all else equal, total expenses as a share of assets rise as the factor price of depositors’ financial capital per assets Total expenses per assets (c
A
), bank-holding companies. Source: Federal Reserve Board of Governors FR-Y9C reports. Non-interest expenses per assets (oexp
A
), bank-holding companies. Source: Federal Reserve Board of Governors FR-Y9C reports.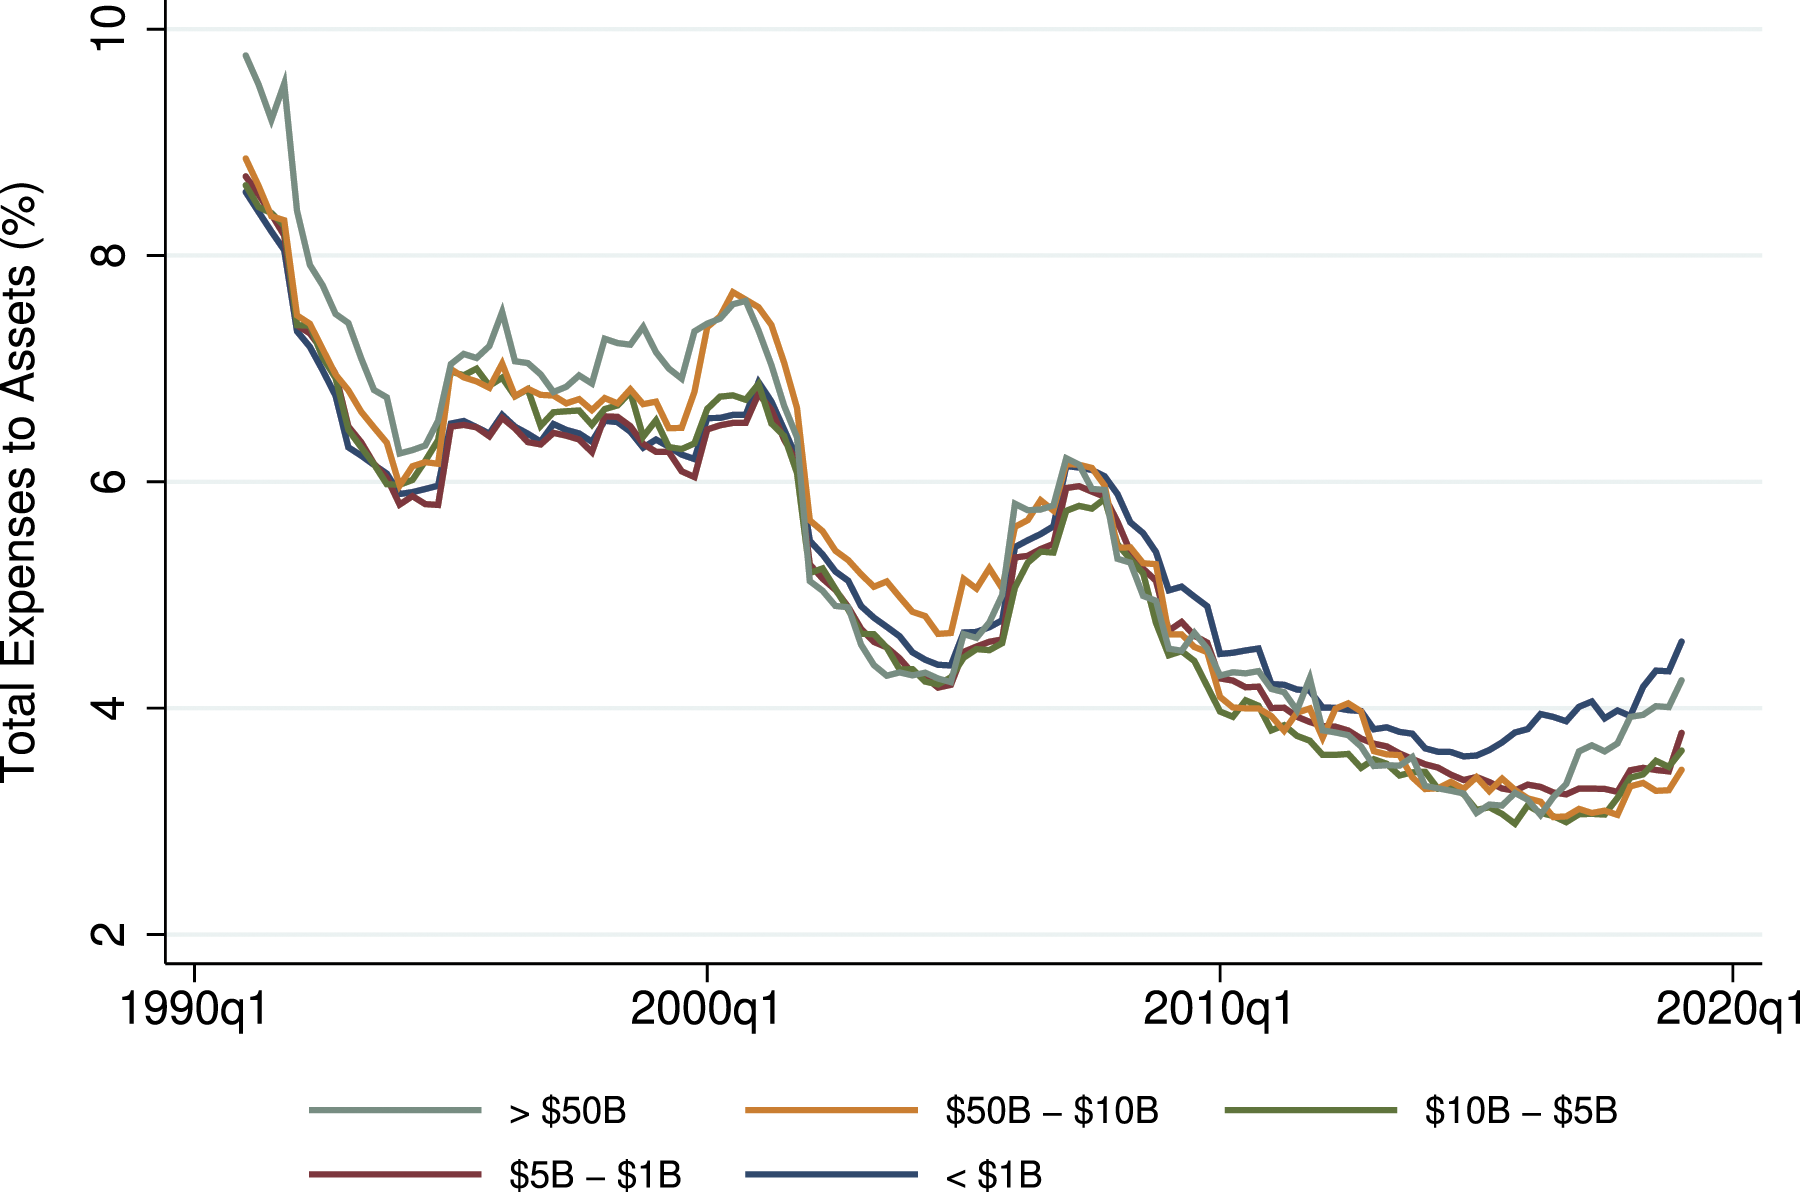

Finally, Figure 1, to which we briefly refer early in the paper, illustrates (pre-tax) return on assets (π
A
). According to equation (9), all else equal, return on assets rises as the factor price of depositors’ financial capital per assets
Estimation Methods
Based on equation (5) through (9), we estimate across BHCs and time the pattern of each performance measure as a function of the corresponding BHC-specific observable variables, unobserved heterogeneity, and dummy variables indicating the dates associated with the implementation of Dodd-Frank, the implementation of the subsequent mortgage and capital-adequacy rules that we reason merit separate econometric identification because of their timing and likely effects on asset transformation, and the implementation of EGRRCPA and, thus, the introduction of the regulatory relief—or, put differently, the reduction of the regulatory burden—the act intends to afford BHCs, community and otherwise.
More formally, we estimate a model that takes the general form of equation (10), where yi,t is the performance measure for BHC i at time t; xi,t is a vector of observable variables that vary across BHCs (i.e., i), across time (i.e., t), or some combination of both BHCs and time; c
i
captures unobserved heterogeneity across BHCs; γ0 is the coefficient on the dummy variable dfa, which takes a value of 1 from 2010 Q3—the quarter in which Dodd-Frank passed—to the end of the dataset and 0 otherwise; γ1 is the coefficient on the dummy variable (subsequent-Dodd-Frank) rules, which takes the value of 1 from 2013 Q3 (see Table 5) to the end of the dataset and 0 otherwise; and γ2 is the coefficient on the dummy variable relief, which takes the value of 1 from 2018 Q2—the quarter in which EGRRCPA passed—to the end of the dataset and 0 otherwise; ui,t is an idiosyncratic error
Additionally, we include year fixed effects and, to control for aggregate shocks, the annualized quarterly growth rate of real gross domestic product (gdp), which, for simplicity, we do not specify in equation (10). We are primarily interested in the γ coefficients on the dummy variables, dfa, rules, and relief. Because mortgage and capital requirements corresponding to rules are, practically speaking, implemented simultaneously, we do not separately identify the individual effects of these subsequent Dodd-Frank rules.
Data and Results
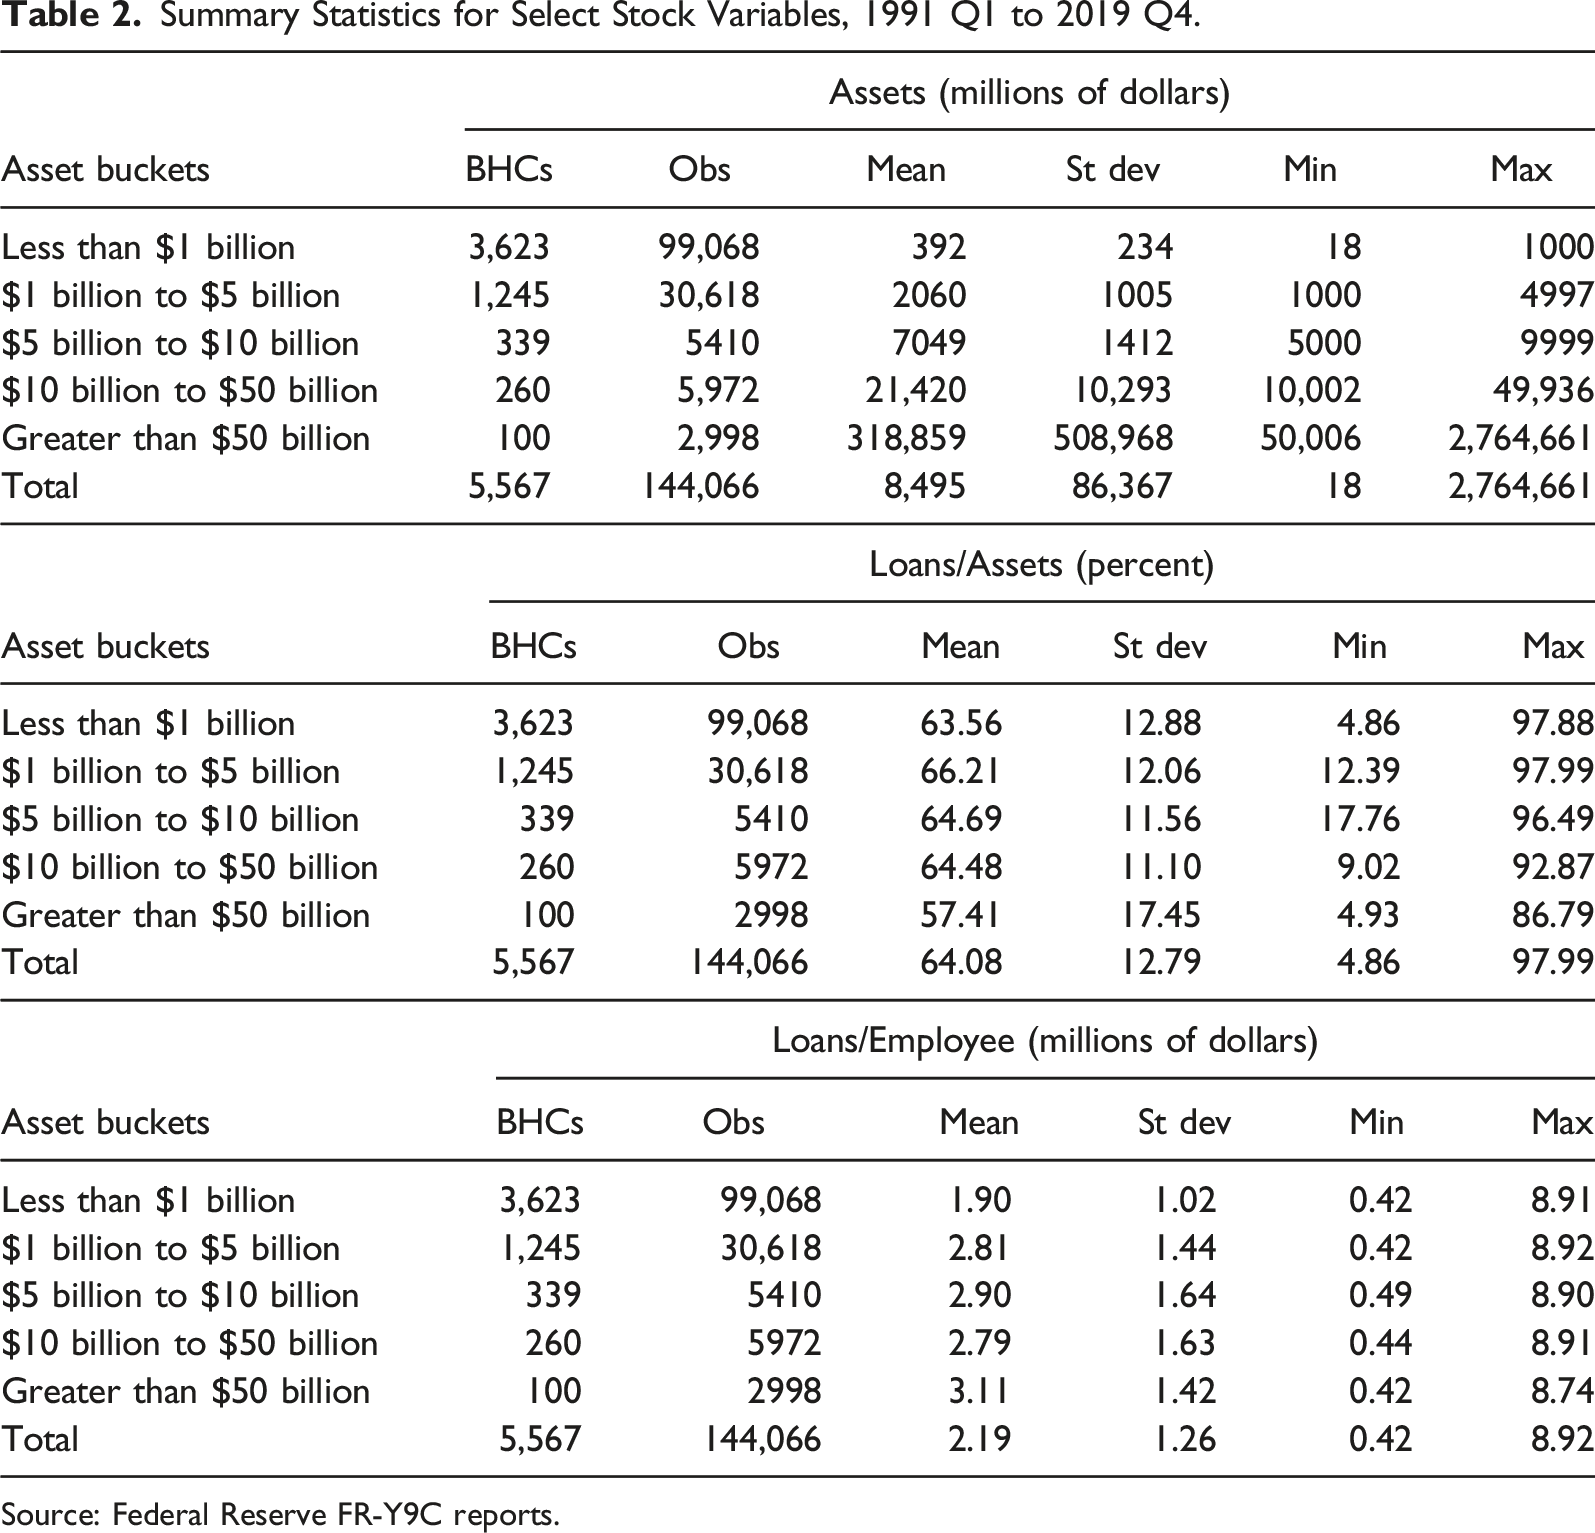
Our data are from the Federal Reserve’s Consolidated Financial Statements for Holding Companies (FR-Y9C) reports, which we obtain from the website of the Federal Reserve Bank of Chicago. Our panel includes more than 140,000 BHC-quarter observations for the period 1991 Q1 to 2019 Q4. Over this period, BHCs enter and exit the industry (often via mergers); thus, our panel is unbalanced.
Summary Statistics for Select Stock Variables, 1991 Q1 to 2019 Q4.
Source: Federal Reserve FR-Y9C reports.
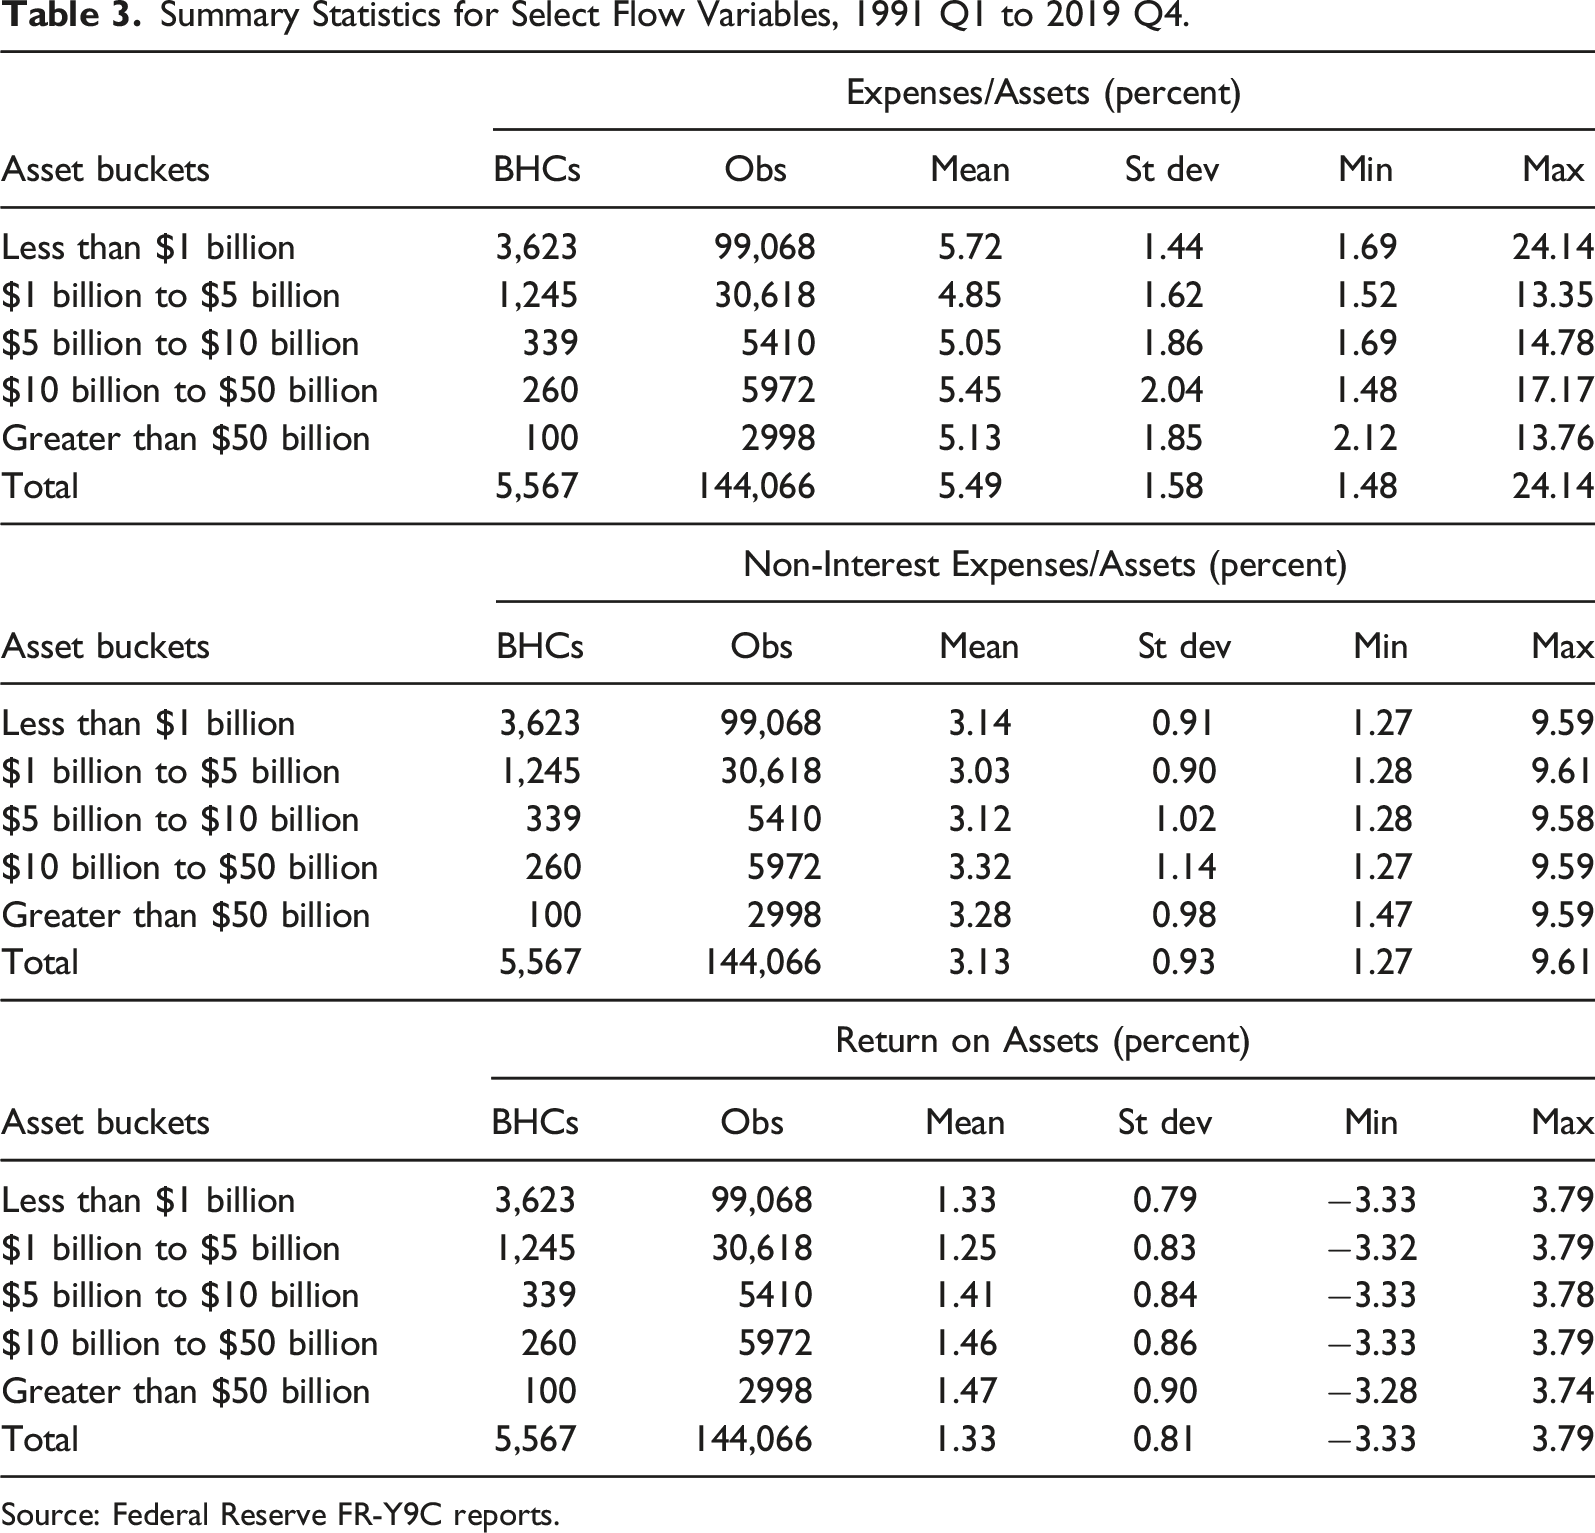
Summary Statistics for Select Flow Variables, 1991 Q1 to 2019 Q4.
Source: Federal Reserve FR-Y9C reports.
According to Table 2, on average, loans as a share of assets vary from 57.4% (for the largest BHCs) to 66.2% (for medium-sized community BHCs). Thus, on balance, conventional loans comprise a relatively small share of assets of systemically important financial institutions because activities other than conventional lending comprise a disproportionally large share of employee efforts at the largest institutions.
Meanwhile, on average, loans per employee generally rise with the size of the BHC—employees of relatively large institutions are, in the context of conventional lending, more productive. For example, a BHC with less than $1 billion of total assets employs workers who each produce an average of $1.9 million of loans; whereas a BHC with between $1 billion to $5 billion of total assets employs workers who each produce an average of $2.8 million of loans. In contrast, the largest BHCs employ workers who each produce an average of $3.1 million of loans. According to Table 3, total expenses as a share of assets—a measure of the average cost of loan production—average 5.5% for all BHCs in the sample; meanwhile, non-interest expenses as a share of assets average 3.1% for all BHCs. Finally, (pre-tax) return on assets average 1.3% for all BHCs and generally rise along with asset size.
Regression-Variable Definitions: FR Y-9C Variables.
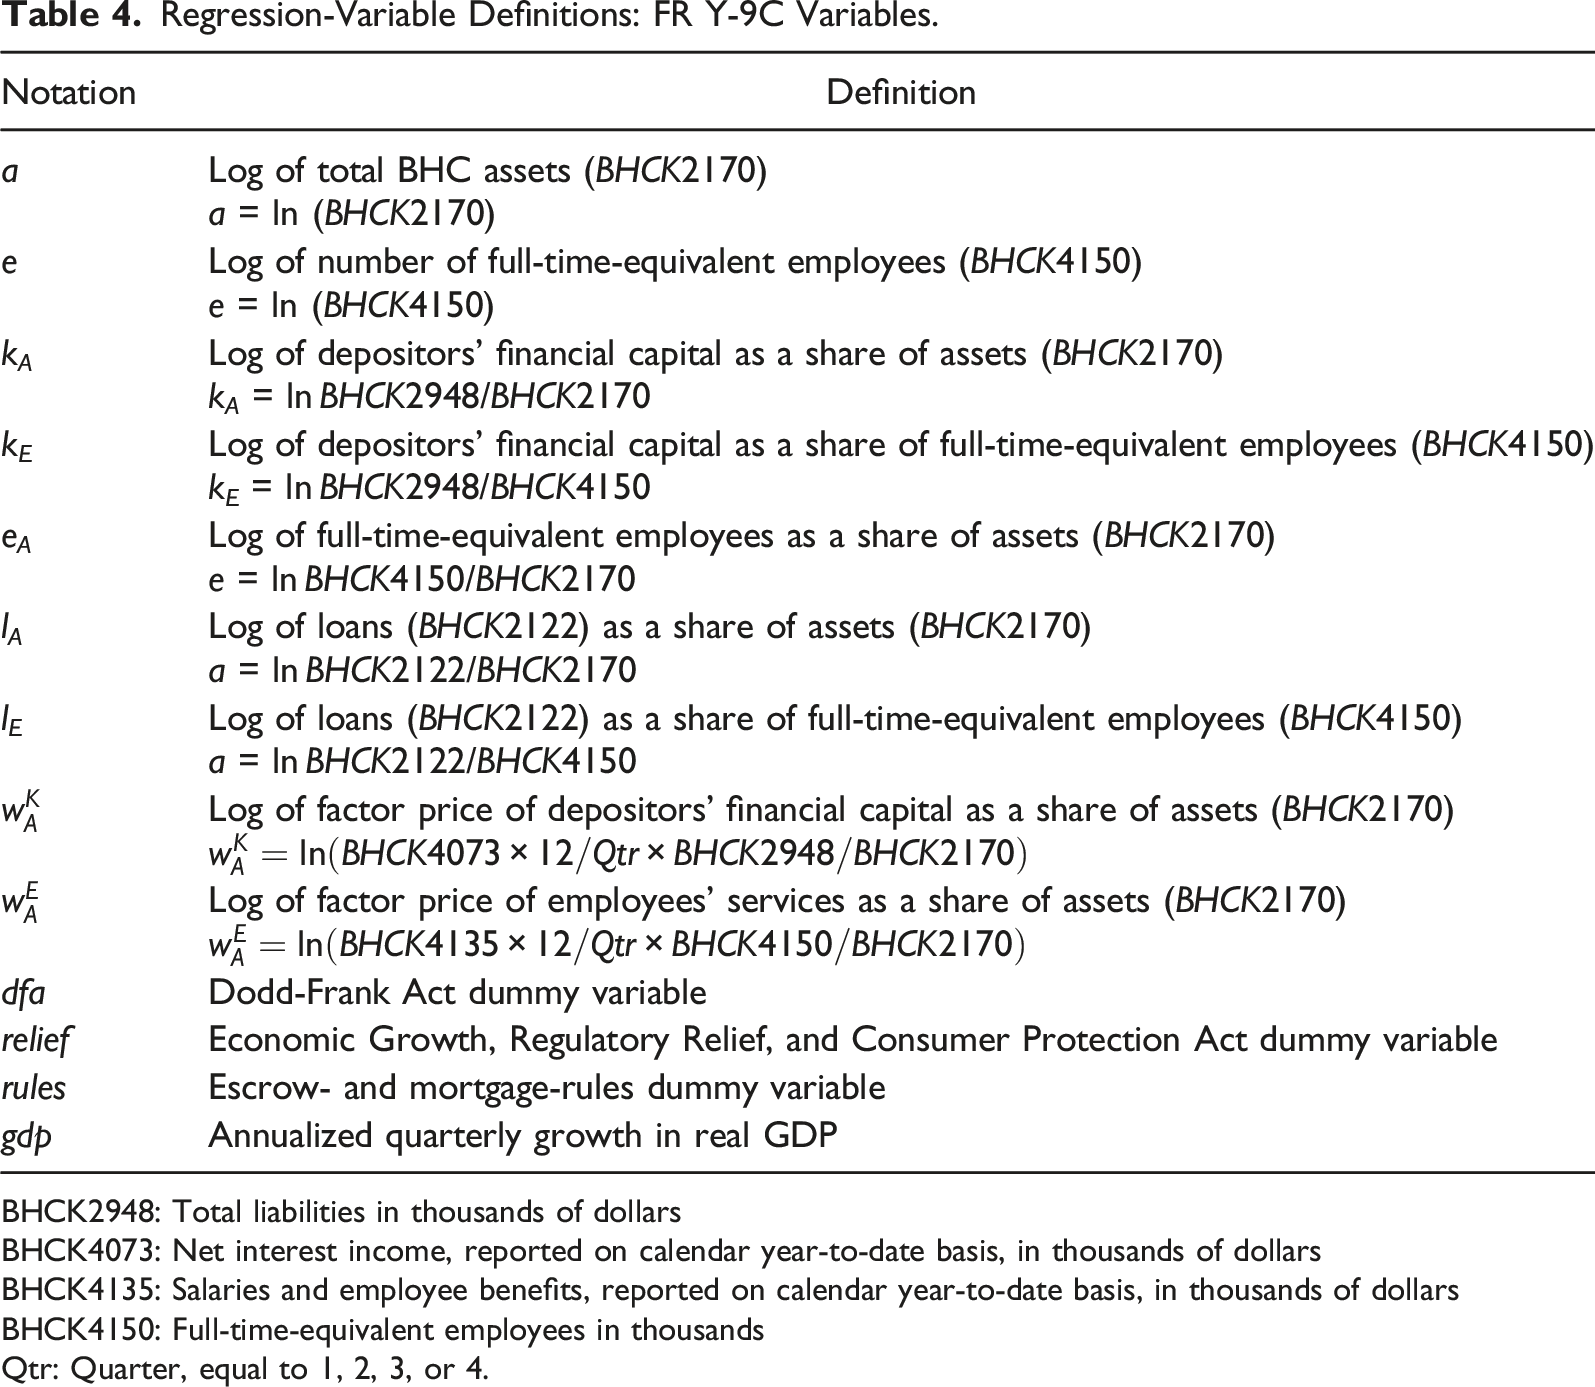
BHCK2948: Total liabilities in thousands of dollars
BHCK4073: Net interest income, reported on calendar year-to-date basis, in thousands of dollars
BHCK4135: Salaries and employee benefits, reported on calendar year-to-date basis, in thousands of dollars
BHCK4150: Full-time-equivalent employees in thousands
Qtr: Quarter, equal to 1, 2, 3, or 4.
Final Rules and Implementation Periods.
Expenses as a Share of Assets (c A and oexp A )
Total Expenses to Assets (c A ; equation (7)).

Robust standard errors in parentheses.
***p
Total Non-Interest Expenses to Assets (oexp A ; equation (7)).

Robust standard errors in parentheses.
***p
The coefficients on the factor price of employees’ services as a share of assets
Meanwhile, the implementation of Dodd-Frank increases non-interest expenses for only the largest (Group-5) and smallest (Group-1 and Group-2) BHCs, for which the estimated coefficient on dfa measures a statistically significant (quarterly) magnitude ranging from 0.031 (Group-2) to 0.042 (Group-1). Consider, for example, the implications for the industry as a whole, for which the estimated coefficient on dfa measures a statistically significant (quarterly) magnitude of 0.037. Based on Table 3 for all BHCs in the sample panel, non-interest expenses measure 3.13% of assets. Additionally, in years since Dodd-Frank passed (2011–2019), total assets average $14.6 trillion annually. Thus, for the industry as a whole, implementation of Dodd-Frank increases non-interest expenses by roughly $68.4 billion annually. 1 For the subsets of, say, Group-1 and Group-2 community BHCs in the sample, the comparable figures are roughly $1.7 billion and $2.8 billion annually. For the industry as a whole, the four Dodd-Frank rules increase non-interest expenses by about $11.5 billion annually. The comparable figure for Group-1 community BHCs, the only group for which the effect is significant, these rules increase non-interest expenses by about $0.6 billion annually, roughly a third of the non-interest expense associated with Dodd-Frank.
Finally, for the industry as a whole, the implementation of EGRRCPA decreases non-interest expense by roughly $23.6 billion annually, about one third the non-interest expense Dodd-Frank imposes—or, about twice the non-interest expense the subsequent Dodd-Frank rules impose. Conditional on bank size, the effect of EGRRCPA on non-interest expense is significant and negative for the Group-2 community BHCs only. The relief the act affords these institutions amounts to about $1.0 billion annually or, again, about one third the regulatory burden Dodd-Frank imposes on these institutions in the form of non-interest expenses.
Loans as a Share of Assets
Loan Supply (
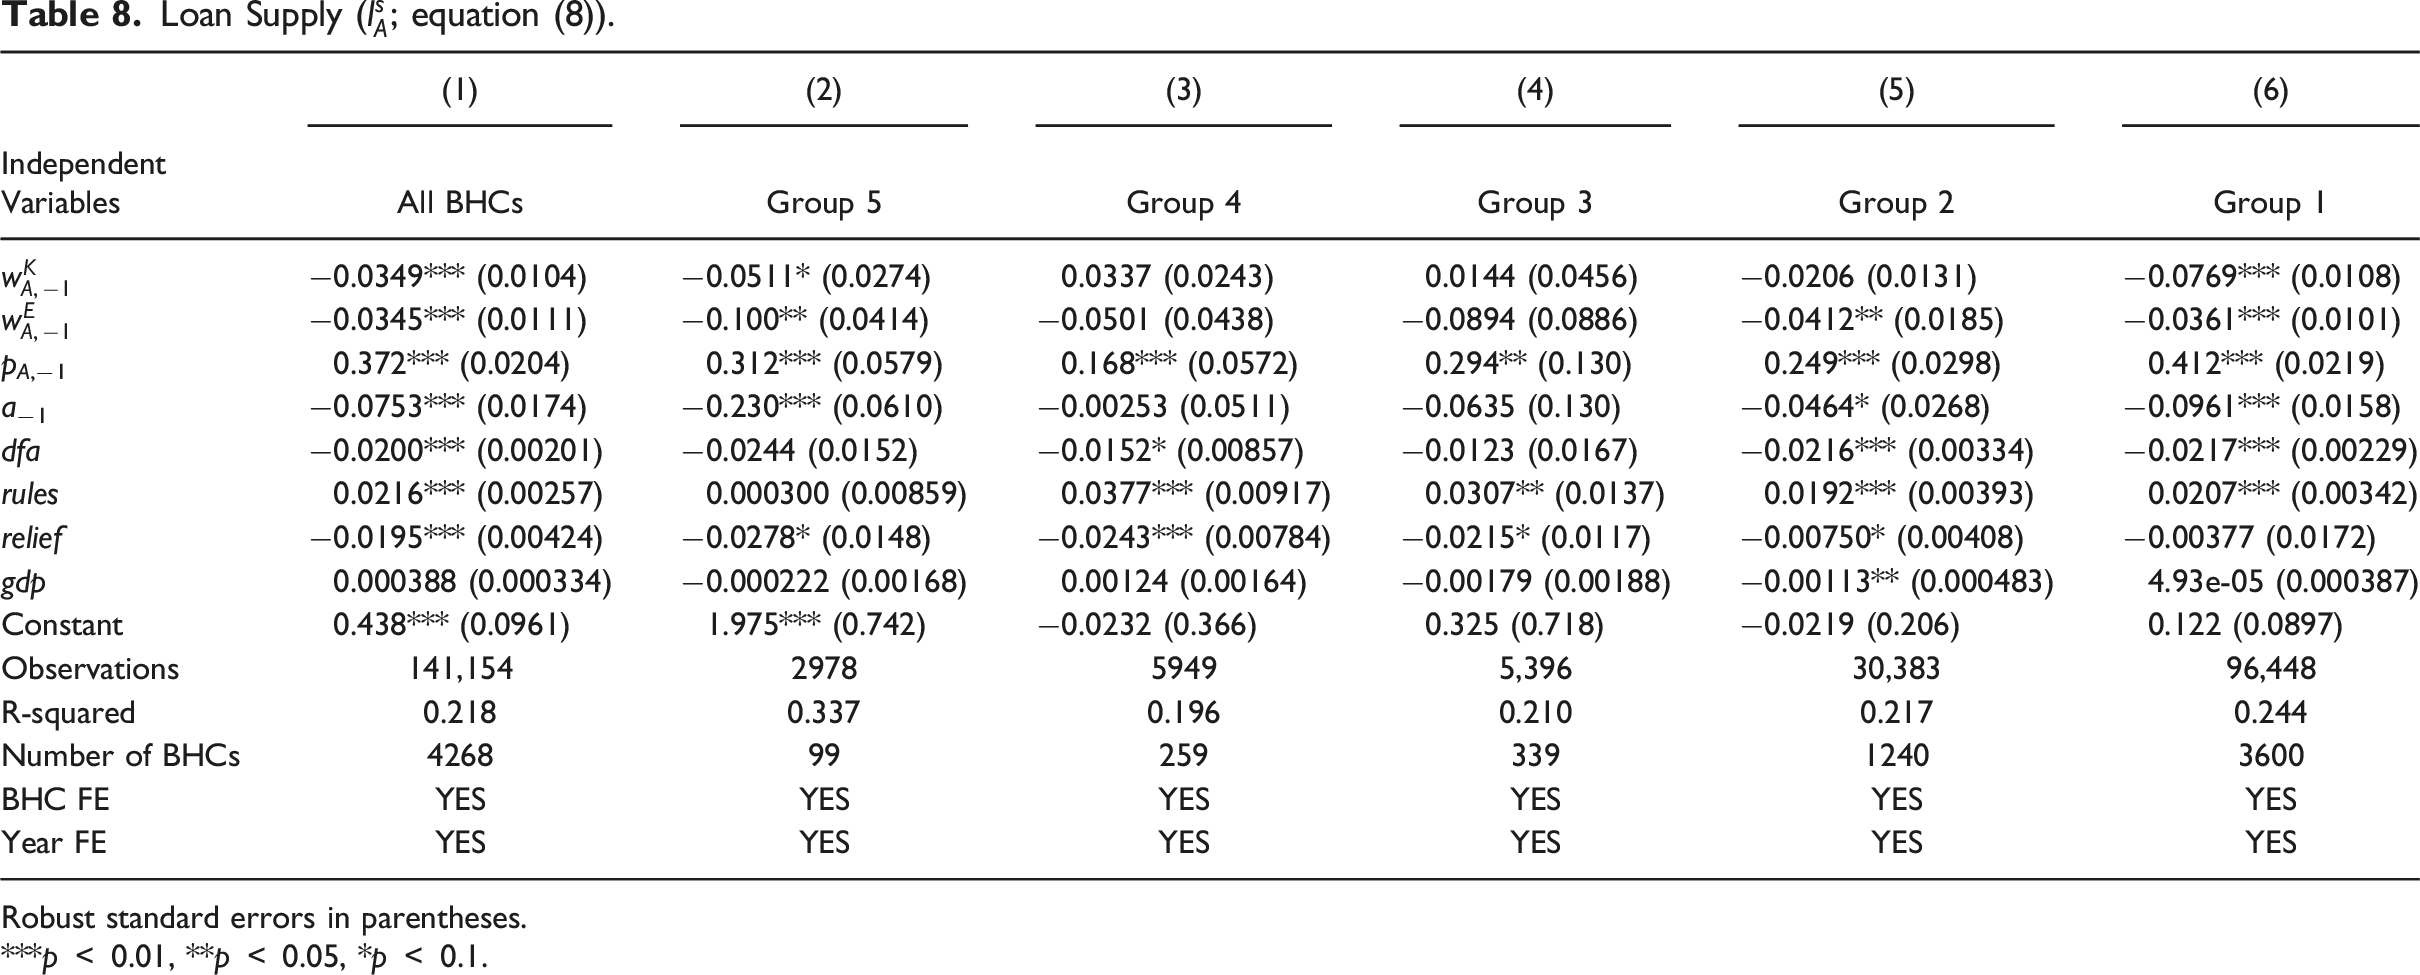
Robust standard errors in parentheses.
***p
Where statistically significant, the coefficients on the explanatory, continuous variables take the expected signs. For example, factor prices
The combined effect of the four Dodd-Frank rules on the supply of loans is significant and positive for all but the Group-3 and Group-5 BHCs. On balance, these rules drive up the supply of loans as a share of assets; and in most cases these effects are economically substantial. For example, for Group-2 community BHCs, the combined, expansionary effects of the four rules—about $37.7 billion annually—is roughly the same as the constriction Dodd-Frank imposes on the supply of loans as a share of assets produced by these community BHCs (roughly $42.4 billion annually). We reason this result implies that the regulatory-compliance efforts associated with these rules effectively lead BHCs to increase their asset shares of relatively high-yielding loans—that is, BHCs search for yield in an attempt to counter compliance costs. To be sure, we panel regress separately the supplies of real-estate loans, agricultural loans, commercial-and-industrial loans, and household loans, each as a share of assets, on the same specification informed by equation (8). And, based on these results, which are available upon request, we find that while the asset share of real-estate loans does not respond to the four Dodd-Frank rules, the shares of the other three loan types do respond positively and significantly.
Meanwhile, the effect of EGRRCPA on the supply of loans is mixed. On balance, the supply of loans as a share of assets falls in response to the regulatory relief. For example, for Group-2 community BHCs, the implementation of EGRRCPA decreases the share by roughly $14.7 billion annually. Generally speaking, in response to the regulatory relief, these community BHCs tend to reduce real-estate loans and increase agricultural and household loans. In the context of loans as a share of assets, regulatory relief has no apparent effects on the smallest (Group-1) community BHCs.
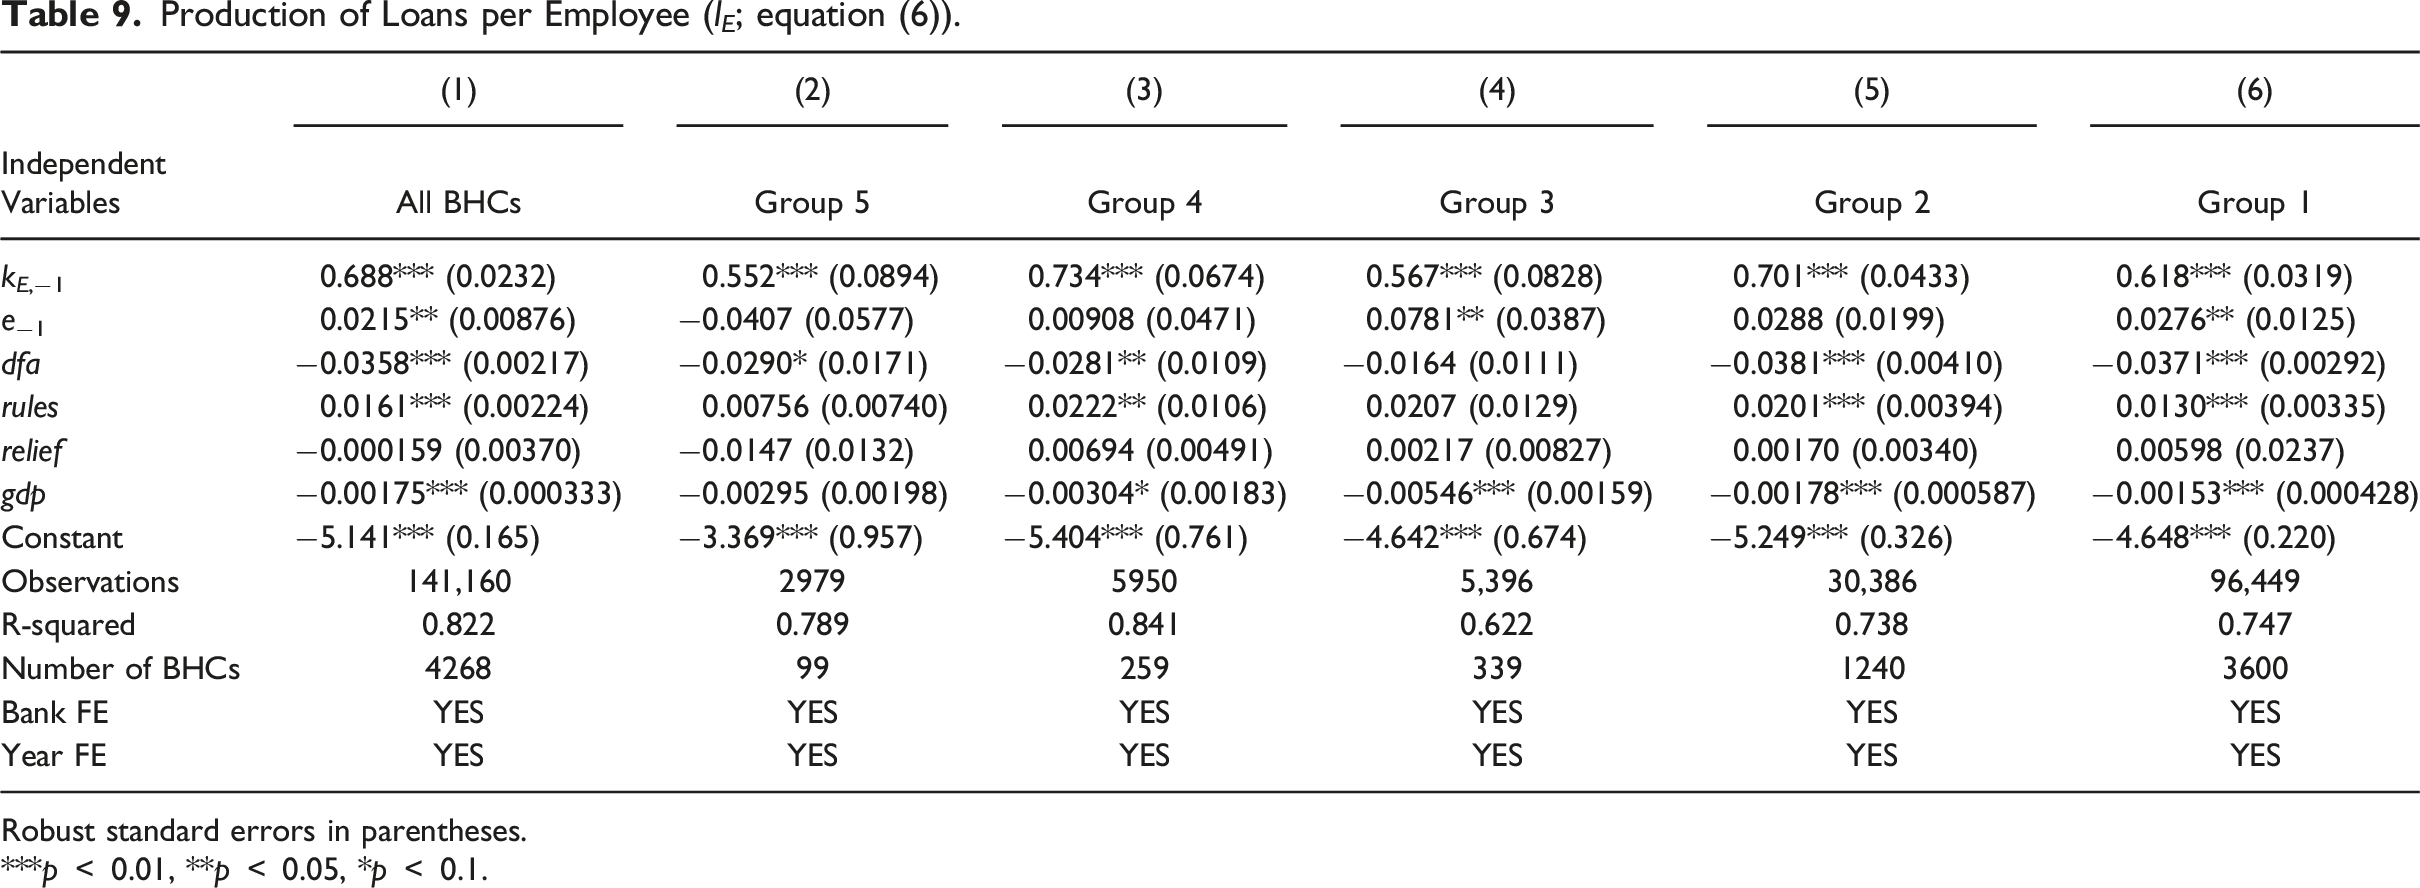
Loans as a Share of Employees (l E )
Production of Loans per Employee (l E ; equation (6)).
Robust standard errors in parentheses.
***p
Where statistically significant, the coefficients on the explanatory, continuous variables take the expected signs. For example, k E , an input to loan production, drives up the production of loans as a share of employees; the corresponding coefficient of elasticity—0.688 for all BHCs—is similar in magnitude across BHC groups. Meanwhile, the implementation of Dodd-Frank constricts the production of loans per employee: except for Group-3 BHCs, the coefficient on dfa measures a statistically significant (quarterly) magnitude ranging from −.028 (for Group-4 BHCs) to −0.038 (for Group-2 BHCs). Consider, for example, the implications for Group-2 BHCs, those with between $1 billion and $5 billion of total assets. Based on Table 2 for Group-2 BHCs in the sample panel, loans per employee average $2.8 million. Thus, for Group-2 BHCs, implementation of Dodd-Frank constricts the production of loans per employee—labor productivity in the context of loan production—by roughly $0.4 million annually.
The combined effect of the four Dodd-Frank rules on the production of loans per employee is significant and positive for Group-1, Group-2, and Group-4 BHCs: on balance, these rules drive up the production of loans; and, again, these effects are economically substantial. For example, for Group-2 community BHCs, the combined expansionary effect of the four rules is roughly half—about $.2 million annually—the constriction Dodd-Frank imposes on the production of loans per employee for these community BHCs (roughly $0.4 million annually). As in the case of the supply of loans per assets, we reason this result implies the regulatory-compliance efforts associated with these rules effectively lead BHCs to increase their asset shares of relatively high-yielding loans. We panel regress separately the productions of real-estate loans, agricultural loans, commercial-and-industrial loans, and household loans, each as a share of employees, on the same specification informed by equation (6). And, based on these results, which are available upon request, we find that for community BHCs, the asset share of real-estate loans does not respond to the four Dodd-Frank rules, while the shares of the other three loan types do respond positively and significantly. This finding aligns with our similar finding for loan supply as a share of assets.
On balance, EGRRCPA has no apparent effects on the production of loans per employee; the coefficient on regulatory relief is statistically insignificant across all BHC sizes. However, there do seem to be compositional effects: for example, Group-2 community BHCs increase their asset shares of commercial-and-industrial and household loans.
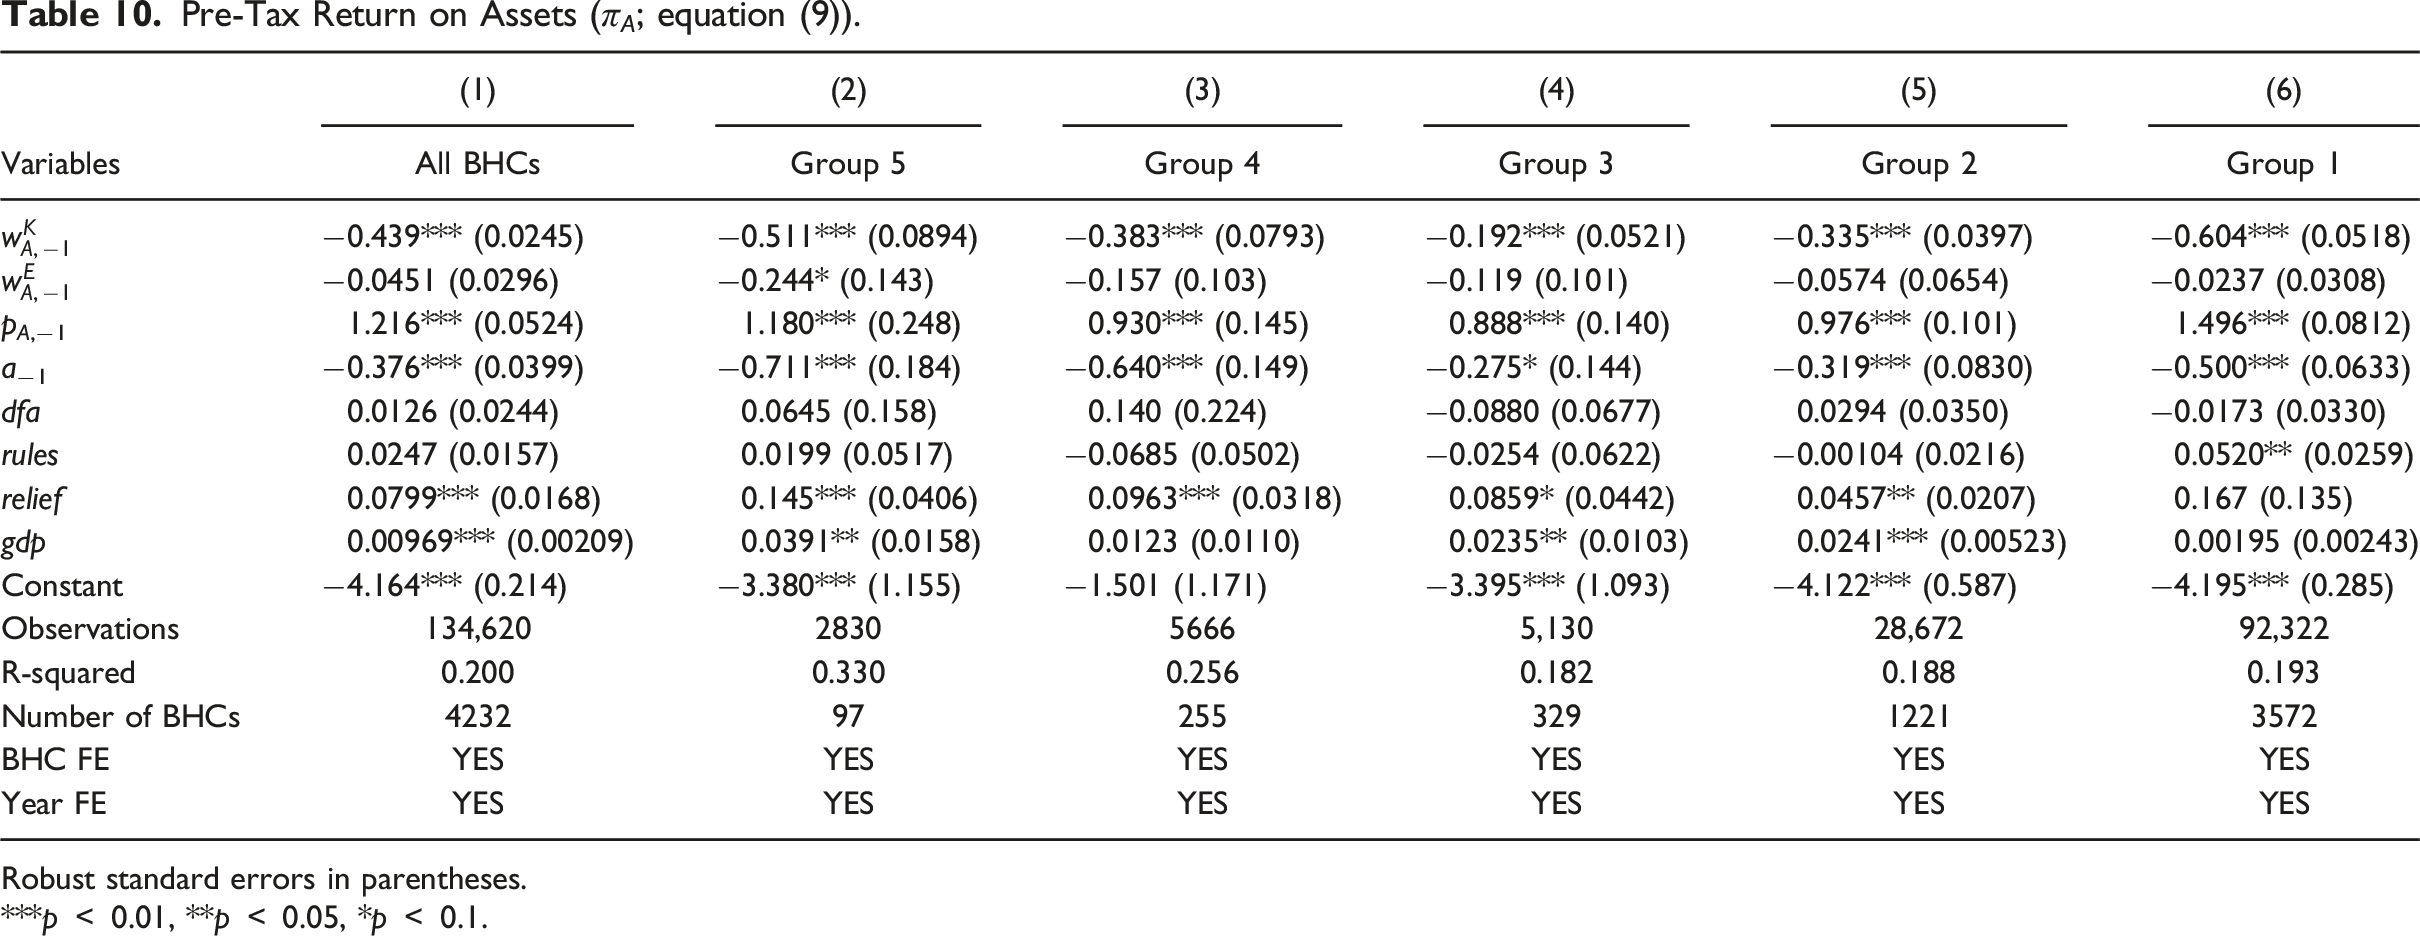
Return on Assets (π A )
Pre-Tax Return on Assets (π A ; equation (9)).
Robust standard errors in parentheses.
***p
The coefficients on the explanatory, continuous variables take the expected signs: factor prices
Finally, and quite interestingly, the effect of EGRRCPA on return on assets is positive and significant for all except the smallest (Group-1) BHCs, suggesting that, in the context of profitability, EGRRCPA affords many BHCs regulatory relief. The estimated coefficient on relief measures a statistically significant (quarterly) magnitude ranging from 0.046 (Group-2) to 0.145 (Group-5); thus, in the context of return on assets, regulatory relief generally increases with BHC size. Consider, for example, the effect on Group-2 BHCs. Based on Table 3 for Group-2 BHCs in the sample panel, return on assets measures 1.25%. Thus, for these BHCs, the implementation of EGRRCPA increases return on assets by roughly 23 basis points annually. Moreover, this relief rises with BHC size and independently of community-BHC status: for example, for relatively large (Group-3) community BHCs, the relief rises to roughly 48 basis points annually; for the largest (Group-5) BHCs, the relief rises to roughly 85 basis points annually.
Conclusion
Community banks were not the source of the financial crisis in 2008, and the passage of Dodd-Frank was not intended to apply to community banks; the act largely exempts institutions with $10 billion or less in total assets. Nevertheless, there remains much debate over the regulatory burden the act imposes—indirectly or otherwise—on community banks. To date, EGRRCPA, passed into law on May 24, 2018, stands out as the most intentional and comprehensive effort to relieve the regulatory burden that Dodd-Frank ostensibly imposes on community banks and otherwise.
Based on data in the Consolidated Financial Statements for Holding Companies (FR-Y9C) reports from 1991 to 2019, we measure the effects of Dodd-Frank, a selection of its subsequent rules, and EGRRCPA on four performance measures: namely, total and non-interest expenses per assets, loans per assets, loans per employee, and pretax return on assets. We model each performance measure as a function of BHC-specific observable variables, BHC-specific unobservable (fixed-effect) heterogeneity, and Dodd-Frank regulation and EGRRCPA relief dummy variables. We estimate our models across five groups of holding companies, which we define according to asset size.
Generally, the initial implementation of Dodd-Frank reduces loans per assets and loans per employee, while it increases non-interest expenses, notably for relatively small BHCs. Meanwhile, the effects of subsequent Dodd-Frank rules vary by BHC size. The subsequent rules increase non-interest expenses for the industry as a whole; and, conditional on BHC size, the rules increase non-interest expenses for only the smallest community BHCs. Additionally, the rules increase the loan share of assets for all except the largest BHCs and, for the most part, increase employee productivity, particularly for community BHCs. We reason these increases in loans per assets and loans per employee obtain because the subsequent Dodd-Frank rules effectively encourage BHCs to increase their asset shares of relatively high-yielding loans (as opposed to, say, relatively low-yielding cash items, e.g.,); this is to say, BHCs seek yield in order to mitigate the expenses that regulatory compliance imposes. In any case, regulatory burden, measured as the initial implementation of Dodd-Frank or its subsequent rules, does not significantly affect return on assets.
Meanwhile, on balance, EGRRCPA provides some regulatory relief. The effect of the act on non-interest expense is significant and negative for mid-sized community BHCs. Finally, and quite interestingly, the effect of EGRRCPA on return on assets is positive and significant for all except the smallest BHCs, suggesting that, in the context of profitability, EGRRCPA affords many BHCs regulatory relief. For example, for mid-sized community BHCs, the implementation of EGRRCPA increases return on assets by roughly 23 basis points annually. Moreover, this relief rises with BHC size and independently of community-BHC status: for example, for relatively large community BHCs, the relief rises to roughly 48 basis points annually; for the largest BHCs, the relief rises to roughly 85 basis points annually.
Note
The data we analyze in this paper are those the Board of Governors of the Federal Reserve System reports (for the close of business as of the last calendar day of each quarter) in its release of Consolidated Financial Statements for Holding Companies—FR Y-9C. We downloaded these data in the form of quarterly text files from the Federal Reserve Bank of Chicago website: https://www.chicagofed.org/applications/bhc/bhc-home. Our dataset spans the time period 1991 Q1 to 2019 Q4. In the data definitions in Table 4, we specify our variable constructions in terms of FR Y-9C account-naming conventions. For example, according to the FR Y-9C account-naming convention, total assets are identified as BHCK2170; thus, in the data definitions in Table 4, we specify our variable a, the log of total assets, as a = ln (BHCK2170).
Footnotes
Declaration of Conflicting Interests
The author(s) declared no potential conflicts of interest with respect to the research, authorship, and/or publication of this article.
Funding
The author(s) received no financial support for the research, authorship, and/or publication of this article.