
Abstract
Despite the specter of artists clustered in inner reaches of a few hip, fashionable cities, people do artwork as a major occupation in most U.S. communities. Artists move across state lines more often than workers in other occupations, and because more apt to be self-employed, for reasons other than a job. The author explores why artists migrate, varying by artistic discipline and age cohort. Some metros home grow more artists by offering nurturing infrastructure. Finding considerable complexity in the spatial distribution of artists over time, the author argues that the bohemian stereotype is inaccurate, undermining respect for artwork as an occupation and for artists’ roles in creative placemaking.
Popular media images of artists are often dominated by hip young people in either fancy or slummy big city neighborhoods doing their thing. Sometimes, case study accounts of artists’ careers and struggles in dense urban places such as New York, as in Sharon Zukin’s (1982) classic, Loft Living, lead researchers, and eventually the public, to believe that artists are synonymous with Gotham and Hollywood and that both cause, and are subsequent victims of, gentrification. It does not help that the bulk of social science research on artists has either concentrated on or taken place in the largest conurbations, such as New York and Los Angeles, thus compounding these stereotypes.
In fact, working artists—defined as those currently employed who report in government census and labor surveys that artwork is their primary occupation by numbers of hours worked a week and including self-employment—are to be found among all age groups, including substantial numbers more than 65. They are found in many industries the general public would find surprising, sometimes in either very large numbers or where they form a major segment of the industry workforce (Markusen & Gadwa Nicodemus, 2013). A majority of them work outside of the three largest megalopolises, especially in medium-size cities and metros, where their shares of the workforce sometimes exceed national averages. Even farther from the stereotype, many artists choose to work in small towns and rural areas.
In this article, I explore the location of U.S. artists using data from the both the U.S. Census Public Use Microdata Series (PUMS) and in some cases American Community Survey data, including net migration patterns both to and from a large group of major metros. 1 I offer a location theory of how and where artists choose to live and move, speculating on how demand and supply factors shape their choices by both age and artistic discipline and how these may have changed over time given shifts in media, technology, the rise of regional theaters and training institutions, and other factors, such as the growing gaps in cost of living between the megalopolises and second-tier metros. Overall, I find artists actively moving among cities of all sizes as well as evidence of robust home growing of artists in many and sometimes surprising places. Overall, there are few discernable trends other than persistently high artist employment growth in a group of second-tier metros, further slippage among some larger cities with initially low artist concentrations, and a moderation in the once superior concentration and growth rates of artists in the artist supermetros of New York, San Francisco, and Los Angeles.
For both researchers and arts advocates alike, it is important to celebrate this age, disciplinary, and geographic diversity of artists in our society. They bring their skills and perspectives to even the smallest hamlets where their music, drawings, writings, and performance experiences may be particularly valued, albeit less well compensated.
Contemporary Metropolitan Artist Concentrations
Artistic Concentrations, Top 29 U.S. Metro Areas by Employment, 2000.
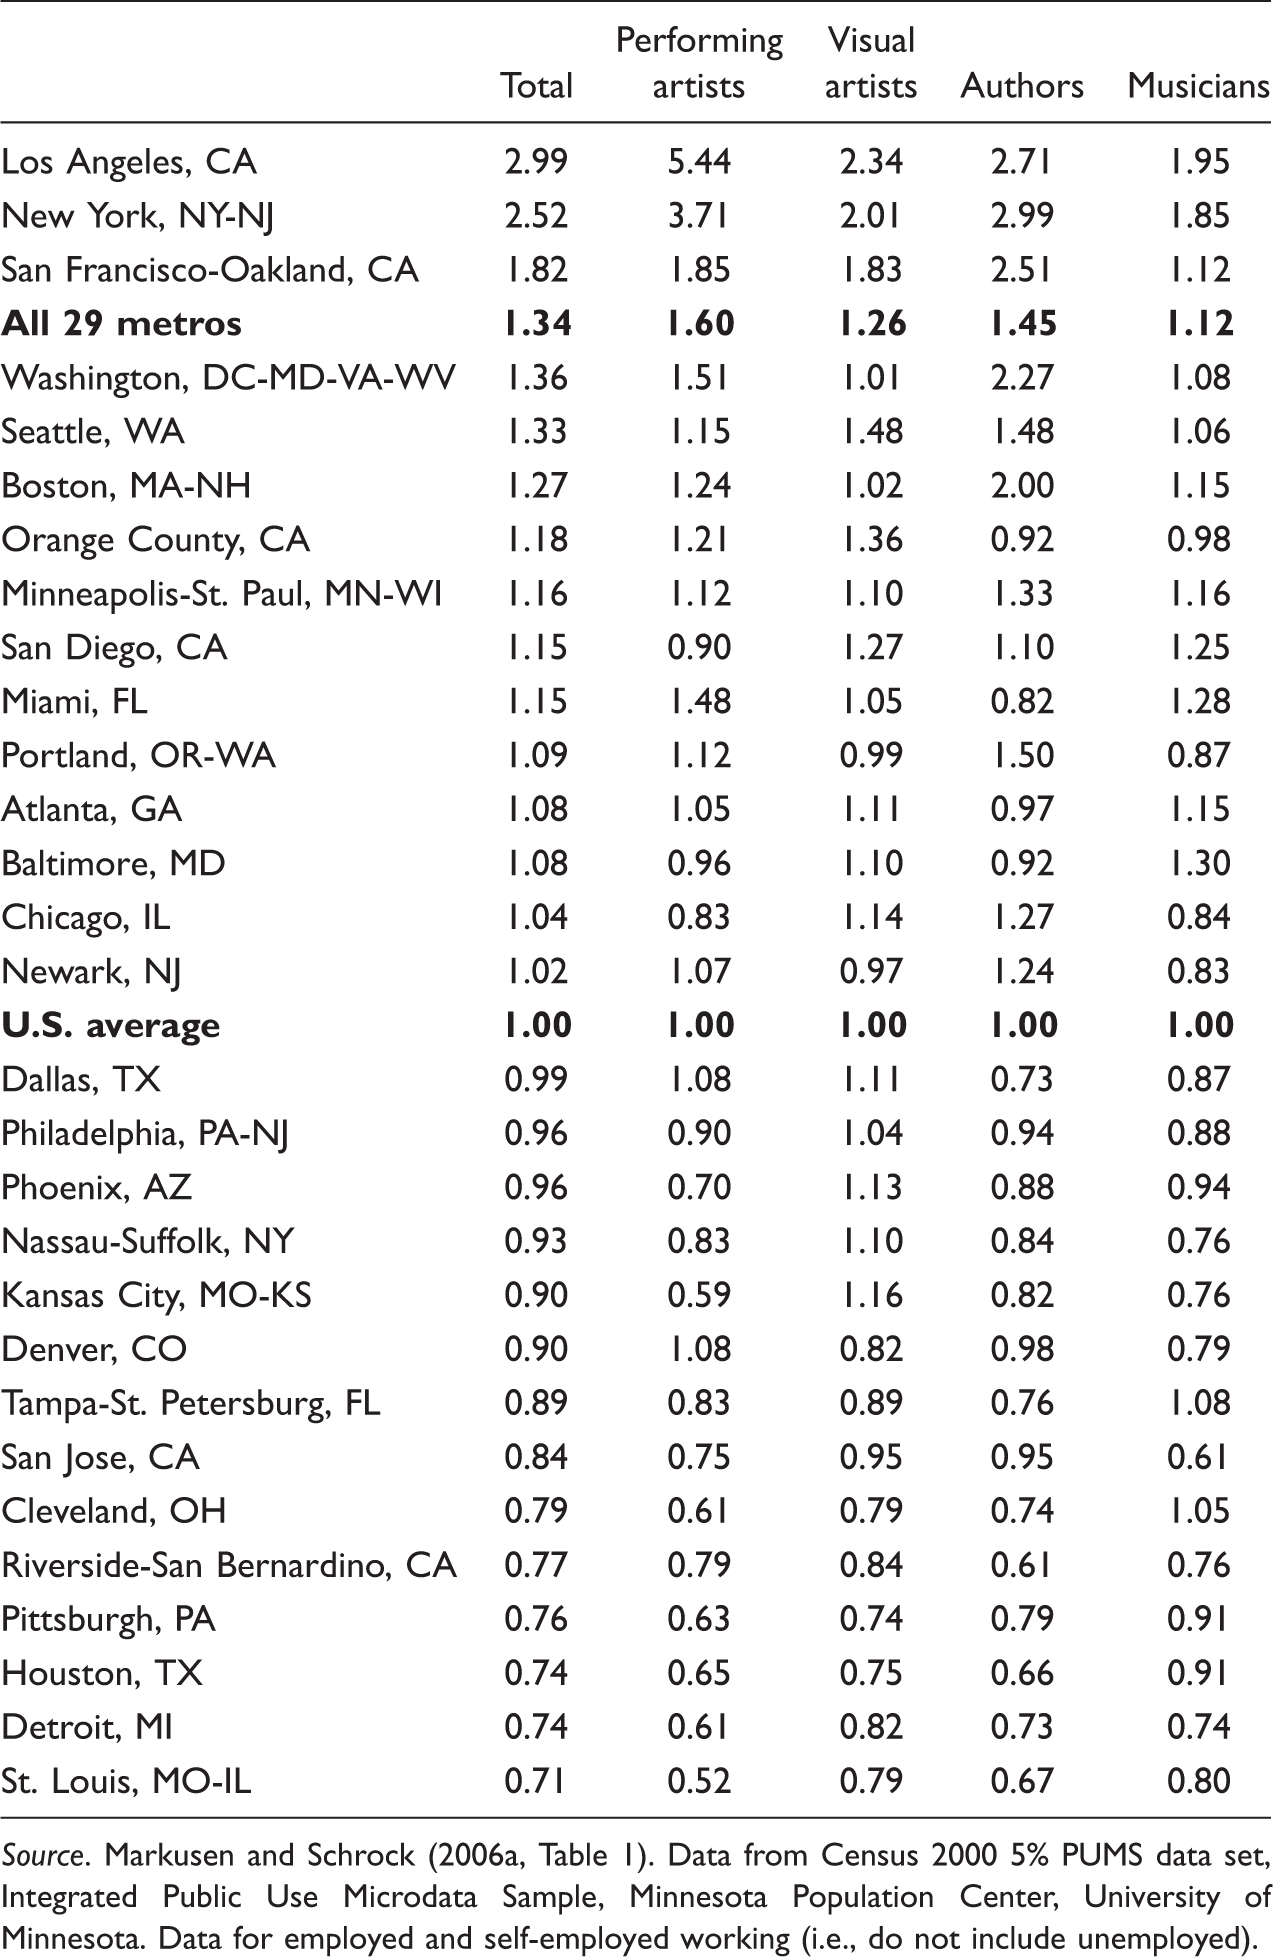
Source. Markusen and Schrock (2006a, Table 1). Data from Census 2000 5% PUMS data set, Integrated Public Use Microdata Sample, Minnesota Population Center, University of Minnesota. Data for employed and self-employed working (i.e., do not include unemployed).
Net Migration of Artists for Selected Metropolitan Areas, 1995–2000.
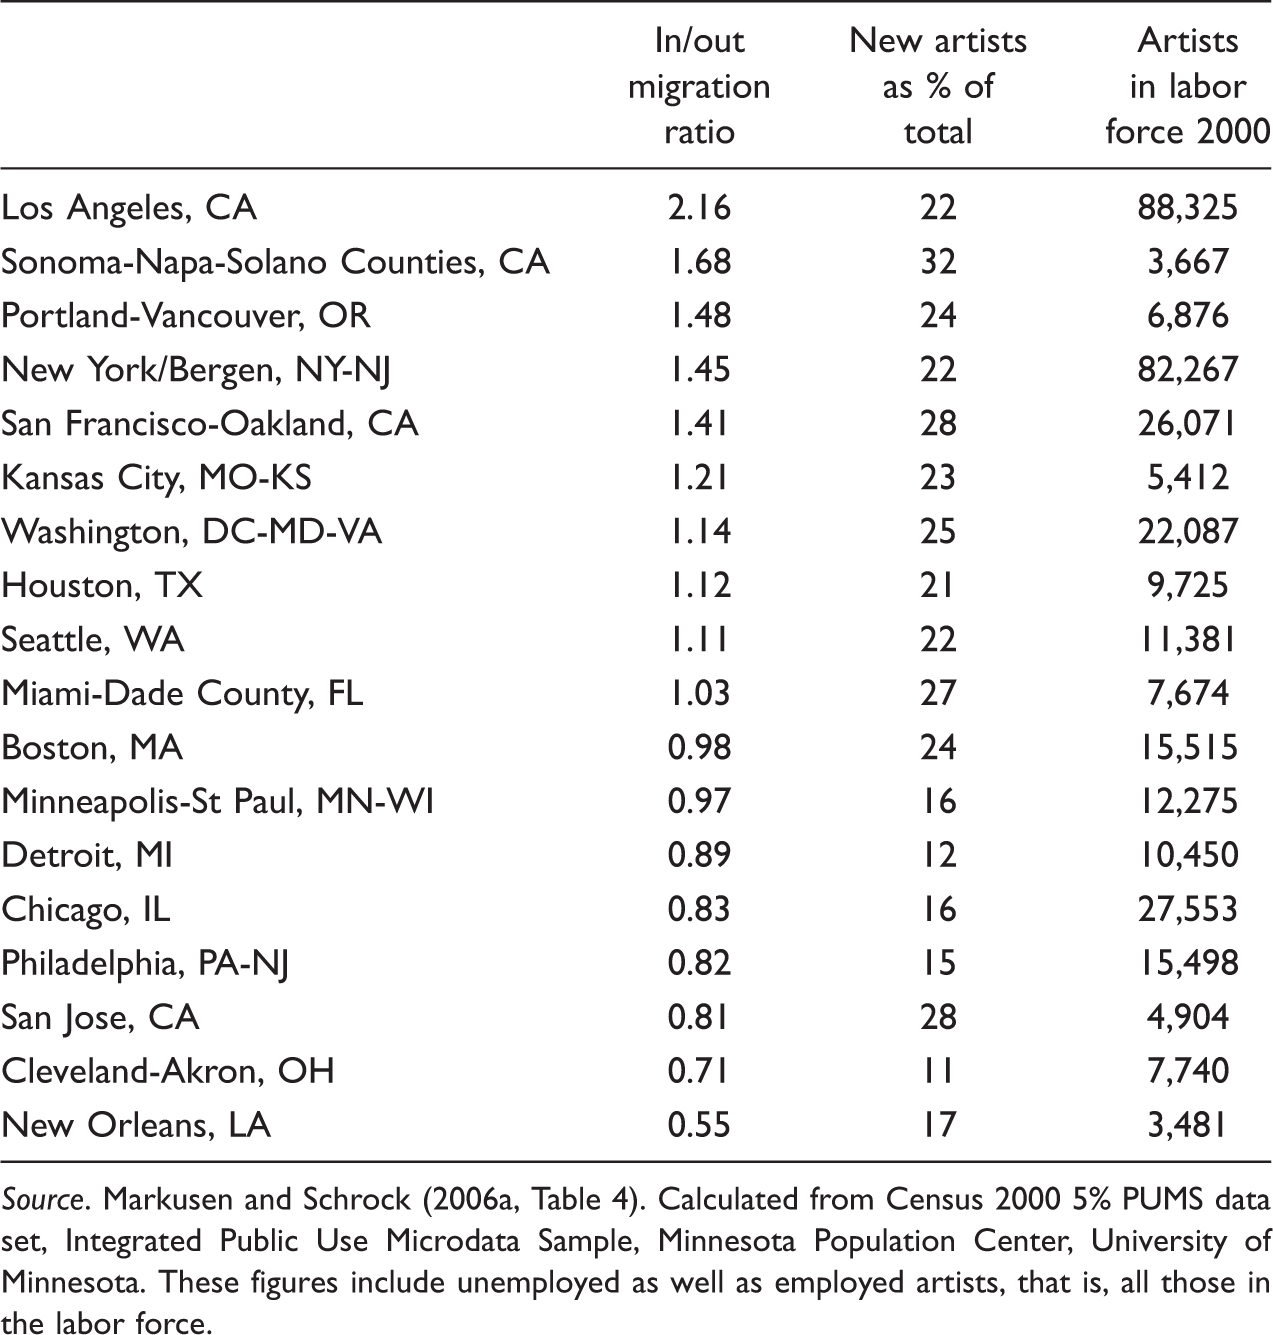
Source. Markusen and Schrock (2006a, Table 4). Calculated from Census 2000 5% PUMS data set, Integrated Public Use Microdata Sample, Minnesota Population Center, University of Minnesota. These figures include unemployed as well as employed artists, that is, all those in the labor force.
LQs convey the relative thickness of artists among metro workers. Artist concentrations for the 29 largest metros (on average 33% higher than U.S. concentrations) reveal several interesting things. A set of second-tier metros stand out as major artist employers: Washington, D.C., Seattle, Boston, Minneapolis/St. Paul, San Diego, and Miami all host artist concentrations 10% above the nation as a whole. Performing artists are more lopsided in their distribution among metros than other artists, with standout concentrations in Los Angeles and New York—an artifact of the significant stage and film industries in those metros. Writers also gravitate toward the superartist cities, though metros such as Boston, Washington, Seattle, and Minneapolis also host large concentrations.
A few older industrial cities (e.g., Baltimore and Chicago) have managed to either retain artists or remake themselves as artist enclaves, but many, such as St. Louis, Detroit, and Pittsburgh, have low artist shares of metro-wide employment. But so do some fast-growing large metros such as Phoenix, Tampa-St. Petersburg, and Houston. Suburban metros (e.g., Nassau-Suffolk, NY, and Riverside-San Bernardino, CA) have relatively low LQs, with the singular exception of Orange County, California—a warning to be cognizant of both the unevenness of metro sizes (generally much larger area wise in the southwest than elsewhere) and historically evolved boundaries which must follow county lines in making comparisons. Artists are pulled centripetally toward the centers of metros in their residential location patterns, while their presence is relatively low in the suburbs. Our work on Minnesota found that there were, in 2000, more artists as a share of the employed residents in two of four large thinly populated regions that include smaller metros beyond the Twin Cities metropolis than there were in the Twin Cities suburbs (Figure 1).
Artists in the Minnesota labor force by region, 2000.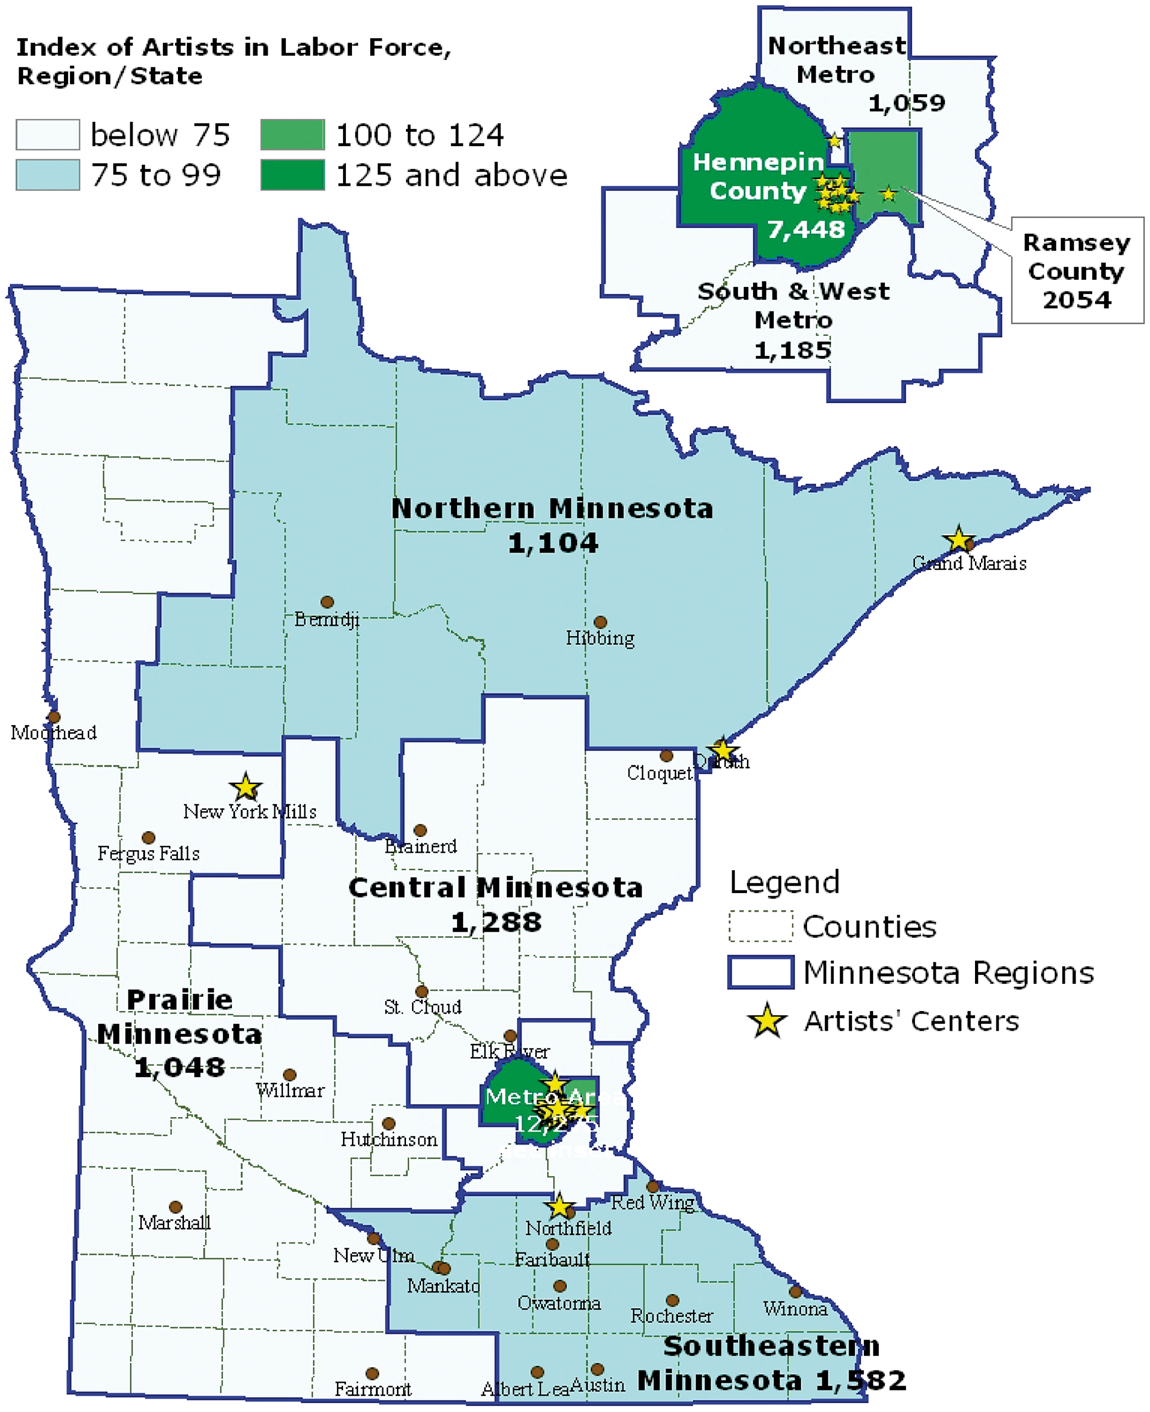
Artists’ Location and Migration Calculus
Why are artists distributed among cities and hinterlands the way they are? An area’s current artist population is a function of both net migration, that is, numbers of artists who moved in minus those who have moved out, and natural increase, that is, the numbers of home-grown artists. Migration flows do not tell the whole story. The Minneapolis/St. Paul metro, for instance, experienced modest net artist out-migration rates of artists for the period 1995 to 2000—more working artists left than arrived in the state than arrived. Yet the metro posted superior growth rates in the numbers of working artists (Markusen & Johnson, 2006; Markusen & Schrock, 2006a). The net increase is due to the region’s success in home-growing artists, both through a wide range of excellent arts educational institutions and because of the state’s extraordinary artist centers that offer ongoing training; space and equipment to work; opportunities to vet, exhibit, and sell work; and, above all, occupational networking, especially among beginning, emerging, and seasoned artists (Markusen & Johnson, 2006).
Before cranking the 2000 PUMS migration data (there was, regrettably, no migration question in the 2010 Census), I speculated on why some artists might prefer either big metros over smaller ones or rural areas over urban ones. I hypothesized that some artists would prefer medium-to-large cities because of the presence of both large, central city-centric industries (e.g., advertising and media, major visual and performing arts institutions) and more educational and internship options. In some industries, there are well-known increasing returns to scale—the cost of production per consumer falls in complex art forms such as symphonic music. Also, there may be synergies among art forms (e.g., music, set making, and performance in opera and film) that are easier to achieve in cities. The preference for arts consumption may be higher in large cities where wealthier people live or visit frequently. The asset share of income may be higher in the largest metros, fueling both nonprofit philanthropy and patronage of visual and performance artists. Downstream outlets for one’s work, such as galleries and publishing houses, may be more concentrated in large central cities. And—very important—the networking and learning opportunities are likely to be more accessible there. Urban amenities, from restaurants to opportunities to consume creative goods and services, may also be a big city advantage.
But what about artists in medium-size metros and in small towns? They may be drawn by work and lifestyle amenities not available in big cities (e.g., affordability, as in cheaper and more expansive space for creating artwork; more favorable conditions for raising a family). Vintage architecture, farmhouses, or older industrial buildings are poised for artist-friendly occupancy. Isolation, I hypothesized, would be attractive to some solitary creators, e.g., visual artists and writers, who could rely on the Internet for both professional and social interactions. Both community connectedness and K–12 schools might be superior in smaller cities and towns. Leaders in some smaller cities and small towns might hang out the welcome mat for artists in ways that big cities do not. Recreation and environmental amenities might trump what big cities offer. It may be where they have always lived. Many artists grow up in places large or small, receive their training there or elsewhere, and then return to build a career and life where they grew up.
Artist Net Migration: Intermetro and Metro Hinterlands
Artists do move often, census data reveal. Artists, designers, and those in entertainment, sports, and media occupations were the third most likely group of people to migrate across state lines from 1995 to 2000, when about 15% of them did so (compared to 10% of people in all occupations.) Only scientists, including social scientists, engineers, and people in computer and mathematical occupations were more likely to move (Markusen & Gadwa Nicodemus, 2013; Markusen & Schrock, 2006b). The latter occupations, however, had much lower rates of self-employment—between 8.7% and 5.0%—compared with 45% of working artists, including those who did their artwork as a second job (Markusen & Schrock, 2006b, Table 8). While scientists and engineers probably do follow job offers, artists are much less likely to do so.
The arts supercities were big magnets for migrating artists in the last U.S. Census. Artist net migration ratios (the number of artists arriving divided by the number leaving) ranged from 2.16 in the Los Angeles metro to 0.55 in New Orleans (Table 2). That means that more than two artists arrived in Los Angeles for every one that left. In New Orleans, nearly two artists left for every one that arrived in that stretch, resulting in a low ratio (17%) of newcomer artists. The highest rates of newcomer artists were found in both San Francisco and San Jose (28% each) and Sonoma-Napa-Solano (the northern Bay Area metro). Artists are arriving in suburbs, along with other new residents and are more likely to be visual artists and writers than performing artists or musicians. Overall, though, artists are more concentrated residentially in central city and inner ring suburbs than is a metro’s workforce overall.
What about migration by age? We speculated in advance that the large-core cities’ draw would be greatest among young artists and taper off for established, middle-aged, and older artists. For visual artists and writers especially, we imagined, the individual nature of much of their work would enable them more easily to seek the affordability, environment, and other amenities of smaller towns and rural areas.
Using Minnesota as a laboratory and comparing migration to the Twin Cities (70% of the state’s population) with Greater Minnesota (the other 30%), we found strikingly divergent migration paths by age cohort (Figure 2). A net 40% of artists who in 2000 were between the ages of 16 and 24 years had moved out of Greater Minnesota over the previous 5 years, presumably for school, jobs, and experience in the Twin Cities and elsewhere (Markusen & Johnson, 2006). The Twin Cities was on the receiving end of a net 15% net migration gain of artists in this age group, some from out of state. Less markedly, 25- to 34-year-olds follow the same paths. But for the artists aged 35 to 44 years, there was a notable reverse migration—about 18% net gain in Greater Minnesota and an 8% loss in the Twin Cities. For the more than 65 age group, more working artists left the Twin Cities than arrived, while Greater Minnesota gained a net 10% of artists through in-migration. Musicians are the most dispersed of all occupations across rural/urban territory, because nationally, some 30% of them work for religious organizations, found in all sizes of communities.
Net migration, Minnesota artists by region, age cohort, 1995–2000.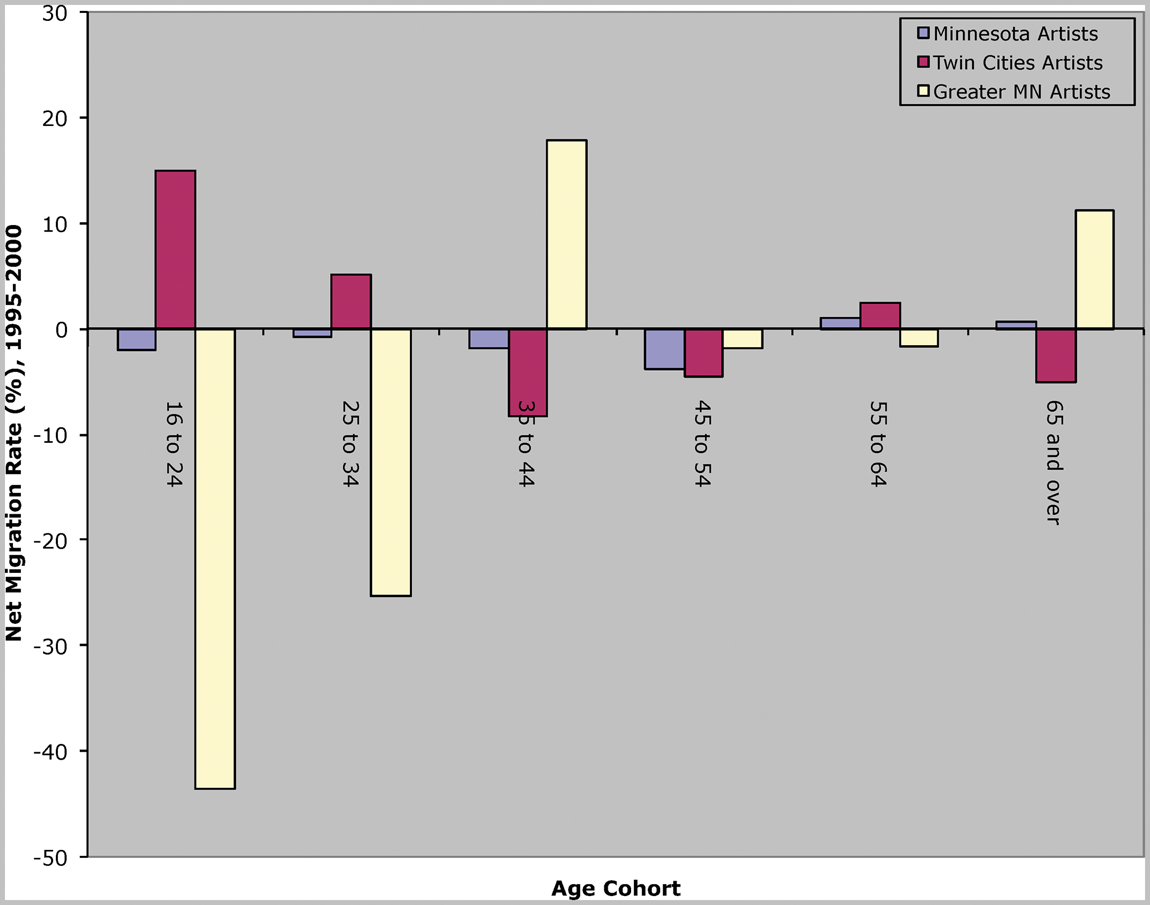
Qualitative work and case studies suggest that many reverse migrants, especially visual artists and writers but also musicians, are seasoned, successful, midcareer people who have both gallery representation and publishers in arts market cities or who can travel to act or perform anywhere. Two well-documented cases—New York Mills (MN) and Arnaudville (LA)—involve visual artists who not only chose to live in small towns for amenities, affordable quality workspace, and family reasons but also brought skills that transformed their towns and communities. Painter John Davis bought a roomy farmhouse and barn in rural New York Mills, many hours from a major metro, to paint in peace, and ended up spearheading the creation of the New York Mills Regional Cultural Center (Cuesta, Gillespie, & Lillis, 2005; Markusen & Johnson, 2006). Painter George Marks returned home to the tiny hamlet of Arnaudville to care for his dying father and stayed to lead a revitalization effort using visual art, Cajun music, and French language.
Changes in Artist Distribution Over Time: 1980 to 2009
Over time, artist distribution both among metros and between cities and countryside can shift with changes in artist home growing and net migration, as well as movements of artists in and out of other occupations. What structural trends shape this process? Historically, large eastern U.S. cities—and some railroad- and industrial-era midwestern ones—built art institutions with new wealth, often replicating European norms. Blau (1989) admirably recounts this history in marvelous detail in her book, The Shape of Culture, summarized in Markusen, Gadwa Nicodemus, and Barbour (2013). Artists and art sprang up around these institutions and their patrons. The postwar rise of arts philanthropy and the National Endowment for the Arts (NEA) helped to spread arts capacity (e.g., regional theaters, artists’ centers, modern art museums) across the United States, and artist communities thrived in many places.
Other developments have quickened artist dispersion. Increases in self-employment mean that more artists are footloose and able to chose locations on the basis of affordability, amenities, space, and markets. The rise of regional arts training institutions, some connected to the vitality of the land-grant colleges, helps to build regional artist workforces. New technologies and transportation systems make it easier for artists to work remotely from their companies, clients, and customers. And many midsized cities are actively trying to attract and hold artists.
So there is upheaval, but few clear patterns are evident. From 1980 to 2000, large metros experienced markedly differential growth rates of working artists but not systematically. Between 1980 and 1990, a decade when the ranks of working artists grew 53% nationally, Orange County Metro added them fastest, at 87%, with increases robust in San Diego, Boston, and Washington, D.C., metros as well (Markusen & Schrock, 2006a). Between 1990 and 2000, a period of slow growth in the artist population nationally (10%), Atlanta’s working artist ranks grew most rapidly, by 53%, though the metro’s LQ reached only a few points above the national average. Interestingly, despite being high, New York metro’s artist concentrations declined between 1980 and 2000, while Los Angeles’ increased significantly (in part, a function of the huge implosion of aerospace jobs following the defense cuts of the 1990s—beware the compositional effect). One clear trend is metros that experienced high population growth overall added artists at higher rates than other metros—evidence that many artists are serving local markets (Markusen et al., 2013).
In the deep recession of the past decade, working artists’ ranks diverged both dramatically and in surprising ways across the largest U.S. metros. Using the American Community Survey data (a 1% sample, compared with the 5% sample used in Tables 1 and 2), Grodach and Seman (2013, p. 19) found that for 2006 through 2009, “a concentration and growth of cultural economy activity in a specific set of strong midsized hubs and marginal growth in the major centers.” Minneapolis/St. Paul, Las Vegas, San Diego, Atlanta, and Baltimore metros experienced the most impressive growth in artist employment. Los Angeles and New York, along with Portland, hovered around the national mean of a bit less than 1%, while Washington, D.C., and San Francisco posted losses. Cost of living may have driven some artists away from the these metros, though relatively medium-to-high-cost metros such as Seattle and Boston posted higher gains than many low-cost metros (Grodach & Seman, 2013). In another clear pattern, metros with initial artist concentrations below the national average endured the greatest setbacks, many of them deindustrializing metros but including also Dallas/Ft. Worth and San Antonio.
Implications for Place-Based Nurturing of Artists
These findings reveal much greater urban and rural complexity than prevailing stereotypes of artists’ life and work patterns. Artists do succeed in living and working outside of cultural industry-rich city centers, and their presence may improve economic and livability characteristics in communities of all sizes. The evidence that artists live and work everywhere vindicates the creative placemaking phenomenon currently engaging new partnerships nationwide. The NEA’s Creative Placemaking White Paper in 2010 (Markusen & Gadwa, 2010) demonstrated, on the basis of successful case studies in diverse types of settings, that artists are very often initiators of community revitalization efforts with arts and culture at their core, especially the case in small towns and rural areas. Since 2010, the NEA and ArtPlace (a collaboration between 13 philanthropic foundations, 6 national banks, and several federal agencies midwived by the NEA) have made a combined 232 grants in all 50 states, for an investment total of $41.6 million. Other private foundations (Kresge, William Penn) have placed a new emphasis on creative placemaking in their grant making. The State of Connecticut has shifted the focus of all of its arts funding to creative place making, and nearly doubled funding award levels (Gadwa Nicodemus, 2013). Simultaneously, in the slow recovery from the 1990s' culture wars, funding for artists has diversified into many new streams, not only preserving innovation-nurturing fellowships but also developing support systems for artists who include entrepreneurial training, more and varied live/work and studio space, and new roles for artists in community-building projects (Markusen, 2013).
Artists, I would argue, would rise in the ranks of most admired U.S. occupations, where they currently rank poorly (along with lawyers), in public surveys if researchers and pundits would collectively acknowledge both the complexity and ubiquity of working artists across all sorts of communities, helping us move beyond the foreshortened specter of the iconic centers. A related emphasis on artists’ economic impact at the expense of their intrinsic missions (McCarthy, Heneghan Ondaatje, Zakaras, & Brooks, 2004)—creating and delivering beauty, delight, insight, political and cultural critique, bridging and bonding capital—has undermined public comprehension of and support for artists. Scientists, engineers, and doctors do not have to argue that every dollar spent on them generates other jobs and incomes—it is clear what they deliver.
Similarly, depictions of artists as bohemians (e.g., Florida, 2002; Lloyd, 2002, 2004) who prefer living and working in revitalizing inner city precincts, especially in a few very large cities, are overstated. They obscure the presence and roles of artists in very small communities and artists’ leadership in smaller and midsized towns and metros. They reinforce a broad public conception that artists are strange, talented creatures who live on a reservation, Larry Gross’s (1995) wonderful metaphor, where the rest of us are not welcome. Yes, artists form a fractionally larger part of the resident workforce in some places, and in part because those cities and metros have lost large numbers of other types of good jobs, especially in manufacturing. But the differentials are not that large—not nearly as large as they are for jobs by industry, for instance. Artists work everywhere, and both artists and society will be better off if we acknowledge their presence and gifts.
Footnotes
Declaration of Conflicting Interests
The author(s) declared no potential conflicts of interest with respect to the research, authorship, and/or publication of this article.
Funding
The author(s) disclosed receipt of the following financial support with respect to the research, authorship, and/or publication of this article: This research received an honorarium of $300 from the Curb Center at Vanderbilt University.
Note
Author Biography
Economist