



Abstract
Researchers have long documented a significant wage gap between White and Black workers, at least some of which is attributable to discrimination. Drawing on research suggesting that discrimination increases during recessions, we test whether the racial wage gap expands during economic downturns. Using longitudinal wage data from the Panel Study of Income Dynamics over a 40-year time period (N = 18,954), we find that the wage gap between Black and White workers increases with the unemployment rate. Moreover, we find that the cyclical wage gap is more pronounced in states in which Whites hold more negative attitudes about Blacks and in states with larger Black populations, suggesting that the racial wage gap expansion during recessions is at least partially driven by discrimination. Finally, we find evidence for at least two mechanisms by which the wage gap expands during recessions. First, we find that Black workers are more likely to lose their jobs during downturns and earn lower wages upon reemployment than comparable Whites. Second, we find that Black hourly workers are slightly more likely to have their hours reduced during recessions than White hourly workers, thereby resulting in lower earnings. These findings suggest that the racial wage gap widens during recessions and that discrimination accounts for at least some of this expansion.
It is well documented that White workers earn more than their Black counterparts. In 2014, the median annual income for White male workers employed full time was $74,108 compared to $52,236 for comparable Black workers (Wilson & Rodgers, 2016). Adjusting for education, workforce experience, region, and population density, Black men working full time still earned approximately 22% less than White men (Wilson & Rodgers, 2016). Similar gaps emerge within industries and occupations (Grodsky & Pager, 2001). For instance, Black professional athletes earn less than their White counterparts, even after controlling for performance (Kahn, 1991).
Past work has explored several reasons for the racial earnings gap. One line of research has attributed this gap to demographic characteristics such as age, education, and family background (Altonji & Blank, 1999; Corcoran & Duncan, 1979; Pager & Shepherd, 2008). Other work has tied the gap to different labor market experiences such as mobility and productivity (Bowlus & Eckstein, 2002). Yet, even after controlling for these observable characteristics, many studies still find that a substantial portion of the gap remains (Corcoran & Duncan, 1979; Fryer et al., 2013). Indeed, one recent study estimated that only two thirds of the wage gap can be accounted for by demographic or premarket factors (Fryer et al., 2013). The wage gap that remains after controlling for educational, experience, and other differences is typically attributed to discrimination (Corcoran & Duncan, 1979; Fryer et al., 2013; Pager & Shepherd, 2008).
While much is known about the demographic and premarket determinants of the racial wage gap, relatively little is known about whether the gap swells and recedes over time. Drawing on evidence that discrimination increases during economic downturns, we propose that the wage gap will widen during economic downturns and shrink during prosperous times. Given that we expect discrimination to underlie any increase in the gap, we expect that the cyclical wage gap will be most pronounced in states with more acrimonious race relations and larger Black populations. We explore two mechanisms by which the racial wage gap may increase during downturns. First, we examine whether Blacks are more likely to lose their jobs during recessions and become reemployed at lower wages. Secondly, we examine whether Black hourly workers are more likely that White hourly workers to have their hours reduced during economic downturns, thereby resulting in lower overall earnings.
The Wage Gap
A substantial body of literature documents a robust and persistent racial wage gap (Cancio et al., 1996; Corcoran & Duncan, 1979; Pager & Shepherd, 2008). This gap appears across cohorts (Cancio et al., 1996), within occupations (e.g, Grodsky & Pager, 2001), and for both men and women (McCall, 2001). The size of the gap varies across studies but typically emerges even after controlling for demographics, human capital, and on-the-job behavior.
While there is little doubt that the wage gap exists, the causes of the gap remain heavily debated. Some scholars attribute this gap largely to differences in educational backgrounds. For instance, past work has shown that some of the gap can be attributed to differences in secondary school quality (Card & Krueger, 1992), educational attainment (Corcoran & Duncan, 1979; Kronberg, 2014), or skills (Farkas, 2003; Farkas et al., 1997). Another portion of the gap can be attributed to occupational differences. Black workers tend to be overrepresented in low paying industries such as public administration, education, and health care services and underrepresented in high skill and high wage occupations (Fryer et al., 2013; Grodsky & Pager, 2001; Parcel & Mueller, 1983; Smith, 2002; Wilson & Roscigno, 2016). Another body of work has considered on-the-job determinants of the wage gap. For instance, scholars have found racial differences in on-the-job behaviors such as health-related absenteeism (Corcoran & Duncan, 1979) and performance evaluations (Greenhaus et al., 1990), which may account for some of the racial differential in earnings.
Despite many well-documented premarket and labor market explanations for the racial discrepancy in earnings, this gap typically persists even after adjusting for these factors (Altonji & Blank, 1999; Corcoran & Duncan, 1979; Darity & Mason, 2004; Fryer et al., 2013). For instance, one study found that observable characteristics such as age, education, occupation, state, and labor market experience only accounted for approximately half of the wage gap (Corcoran & Duncan, 1979). Similarly, Fryer et al. (2013) found that at least one-third of the racial gap in starting salaries could not be explained by differences in education or skill. Other work has found that including additional controls for schooling quality and test performance, White workers still substantially out earn Black workers with similar education levels and intelligence scores (Lang & Manove, 2011). Another analysis found that White men earned 15% more than Black men with similar backgrounds and White women earned 6% more than Black women with similar backgrounds (Cancio et al., 1996). Given that measurable characteristics cannot account for this gap, the wage gap that remains after controlling for well-established covariates is typically attributed to discrimination (e.g., Altonji & Blank, 1999; Fryer et al., 2013; Pager & Shepherd, 2008).
Evidence of racial workplace discrimination is also well documented and more easily measured in other domains of organizational life. For instance, audit studies have found that White job applicants are substantially more likely to be given job interviews than their Black counterparts (Bertrand & Mullainathan, 2004; Pager, 2007). Moreover, Black job seekers spend significantly more time looking for work (Tomaskovic-Devey et al., 2005) and are offered significantly lower starting salaries for the same jobs than their White counterparts (Bendick et al., 1994; Fryer et al., 2013).
Given that discrimination is a well-documented feature of organizational life and accounts for at least some of the racial wage gap, we reasoned that environmental conditions associated with increases in discrimination also may be linked to increases in the racial wage gap. Drawing on evidence that racial discrimination rises during recessions, we propose that the racial wage gap will widen during bad economic times. If discrimination is contributing to an expanding wage gap, then we expected that the widening gap will be more pronounced in places with greater racial animosity. Finally, we propose two mechanisms that may underlie the rising wage gap during recessions: reduced working hours and greater job loss among Black workers.
Consistent with recent work, we define discrimination as the decisions and policies within and between organizations that yield differential outcomes for Black and White employees (Tomaskovic-Devey & Avent-Holt, 2019). Organizations are responsible for allocating resources and opportunities ranging from wages to promotions and dismissals. Discriminatory resource allocation is revealed through unequal allocation of these resources across employees of different races but with similar skills and backgrounds. Below we outline why we expect race based discrimination to increase during bad economic times and how this might widen the wage gap between Black and White workers.
Increases in Discrimination During Recessions
Economic turmoil appears to inflame racial discrimination. For instance, recent work has shown that during economic downturns Whites feel less warmly towards Blacks and are more likely to condone inequality between groups as natural and inevitable (Bianchi et al., 2018). Similarly, reminders of economic scarcity increase the likelihood that Whites will view Blacks as having darker skin tones and more stereotypical features (Krosch & Amodio, 2014). Moreover, when reminded of economic scarcity, White participants tend to allocate fewer resources to Black recipients, even when doing so is not personally costly (Krosch et al., 2017). These findings suggest that Whites are more likely to regard Blacks more negatively and with greater hostility during bad economic times.
Indirect indicators also point to increased discrimination during recessions. For instance, when the economy contracts, the unemployment rate increases considerably faster for Blacks than for Whites (Engemann & Wall, 2009). Indeed, during the Great Recession, the unemployment rate increased by 7.1 percentage points for Blacks compared to 4.6 percentage points for Whites (Bureau of Labor Statistics, 2019). Moreover, during recessions Black congressional candidates are less likely to win elections and Black musicians are less likely to secure Billboard top 10 hits (Bianchi et al., 2018). While these studies do not capture why these effects emerge, these patterns are consistent with the possibility that discrimination increases when the economy falters and that such discrimination has tangible economic outcomes for Black workers. Indeed, various perceived and real threats have been linked to more negative attitudes towards minority group members (Blumer, 1958; LeVine & Campbell, 1972).
One reason that labor market discrimination may increase during recessions is that downturns enable employers with discriminatory tendencies the opportunity to act on these preferences (Becker, 1957). During bad economic times, there is more likely to be a glut of qualified White job seekers. This makes it easier for employers favoring White workers to act on these preferences. Indeed, discriminatory firing practices are more likely in contexts with fewer safeguards in place to prevent them (Byron, 2010). Conversely, when the economy is doing well, a discriminatory employer may have more difficulty filling a vacant position with a White worker. The job may stay opened longer, leaving work undone and making discriminatory behavior more apparent to outsiders. As such, acting in a discriminatory manner during economic booms may make the organization more vulnerable to litigation and negative publicity.
We reasoned that if discrimination accounts for at least some of the racial wage gap, then this gap should grow during periods of economic turmoil when discrimination is likely to be more pronounced. However, if discrimination does not increase during recessions or if discrimination does not account for a meaningful portion of the gap, then we should find no relationship between the economy and the wage gap. Thus, we propose that the Black-White wage gap will widen when the economy contracts. Hypothesis 1: The wage gap between Blacks and Whites will widen during recessions.
The Wage Gap and Discrimination
We reasoned that if discrimination is underlying cyclical fluctuations in the wage gap, then a widening wage gap during recessions should be more pronounced in contexts where discrimination is more pronounced.
We tested this possibility in two ways. First, we examined whether the racial wage gap swelled more during recessions in states in which Whites had more negative attitudes about Blacks. Whites’ attitudes towards Blacks tend to vary across states. In the South, for instance, Whites typically have more negative views about Blacks than Whites in other regions (e.g., Chae et al., 2015). For instance, White Southerners are more likely to report a preference for living in an entirely White neighborhood (Black & Black, 1989) and more likely to express anger about affirmative action policies (Kuklinski et al., 1997) compared to Whites in other parts of the United States. Moreover, the racial gap in wages and unemployment has historically been larger in the South (O’Neill, 1990). Thus, we expected that if discrimination was at least partially accounting for an increase in the wage gap during recessions, this gap should grow most steadily in states where Whites held more negative views of Blacks. Hypothesis 2: The expansion of the racial wage gap during recessions will be greater in states where Whites hold more negative views of Blacks.
Whites in communities with higher densities of Black residents are more likely to support racist political candidates than Whites in more racially homogenous environments (e.g., Knoke & Kyriazis, 1977). Moreover, in states with higher Black populations, Blacks have worse health and economic outcomes. Indeed, communities with a higher concentration of Black residents tend to have greater racial disparities in income, jobs, and education and higher rates of incarceration rates for Blacks (Taylor, 1998). Thus, we expected that the widening of the racial wage gap would be particularly pronounced in states with larger percentages of Black residents. Hypothesis 3: The expansion of the racial wage gap during recessions will be greater in states with a higher percentage of Blacks.
Potential Mechanisms Underlying an Expanding Wage Gap: Job Loss and Time Reduction
While discrimination appears to swell during recessions, at first glance it is not clear how this might expand the wage gap. A considerable body of work suggests that wages rarely decline during recessions (see Bewley, 1995 for a review). Rather, organizations often deal with resource constraints by laying off employees instead of reducing wages. Consequently, if discrimination helps account for an expanding wage gap during recessions, it is unlikely that this expansion occurs through wage reduction.
We consider two potential mechanisms by which discrimination might widen the racial wage gap during downturns. The first is through job loss. As previously noted, employers often address resource constraints during downturns by reducing their workforce rather than reducing wages. Thus, discrimination is more likely to be revealed through termination than wage reduction. Consistent with the possibility that Blacks face increased discrimination during recessions, Blacks incur greater job loss during recessions than Whites (Couch & Fairlie, 2010; Fairlie & Kletzer, 1998; Freeman, 1973). For instance, analyses of 25 years of data from the Current Population Survey found that Blacks were considerably more likely to be fired during recessions than Whites (Couch & Fairlie, 2010). These effects persisted even after accounting for differences in educational levels as well as occupational and industry differences between Black and White workers. Another analysis found that between September 2008 and August 2009, 8% of Black private-sector prime age workers involuntarily lost their jobs compared to 6% of White employees (Couch et al., 2018). Indeed, the unemployment rate tends to rise more rapidly for Blacks than for Whites during recessions, a pattern which is likely driven by the greater tendency of organizations to terminate Black workers during bad economic times (Engemann & Wall, 2009). Thus, building on these findings, we expected that Blacks would be more likely to lose their jobs than Whites during bad economic times.
We expected that greater job loss among Blacks during recessions might widen the wage gap because of lower wages upon reemployment. Indeed, job loss has long term negative implications for earnings, such that workers who lose their jobs often receive lower wages upon reemployment and the negative effect of unemployment on wages persists for a long time to come (Couch & Placzek, 2010; Jacobson et al., 1993; Ruhm, 1991; Sullivan & Von Wachter, 2009). This earnings loss tends to be greater during recessions, presumably because there are fewer jobs to choose from, making it more difficult to find a job with comparable pay (Couch & Placzek, 2010). For instance, one study found that workers who lost their job following a mass layoff experienced a ∼33% drop in earnings the following quarter (Jacobson et al., 1993). Six years later, they were still earning 13–15% less. Similarly, people who lost their jobs involuntarily during the Great Recession, earned roughly 10% less when they were subsequently reemployed than they had previously earned. Three years later, they still earned 7% less.
Thus, if Blacks are more likely to lose their jobs during recessions and people who lose their jobs tend to be reemployed at lower wages, this may help explain the increasing racial wage gap during recessions. Hypothesis 4a: During recessions Blacks are more likely to lose their jobs than Whites. Hypothesis 4b: After jobs loss during recessions, Blacks are likely to be reemployed at lower salaries than Whites.
Thus, we predicted that Black workers would be more likely to have their hours reduced during recessions than White workers. Hypothesis 5: Black workers are more likely to have their hours reduced than White workers.
Methods
We tested our hypotheses using the Panel Study of Income Dynamics (PSID), a longitudinal dataset with detailed individual income information over many decades. The survey was first administered in 1968 and consisted of approximately 4,800 households. When children of the original sample members grew up and formed their own families, this new household was added to the survey and each adult member of this household was interviewed. Over time, more than 25,000 people have participated.
The survey was administered annually from 1968 to 1998 and biannually thereafter. In every survey, each adult member of the household was interviewed over the phone or in person. The survey contained information on topics such as employment, income, and educational background. Our sample included respondents interviewed between 1976, the first year in which consistent state level economic data was available, and 2015, the last year in which wage data was publicly available.
Sample
We gathered all the income data from respondents who completed the survey between 1976 and 2015 and were currently employed. We did not consider those who were retired, students or homemakers. Our initial sample consisted of 27,529 respondents and 245,129 individual-year observations. We then filtered out people who did not work at any point during the survey, had no reported income, or did not respond to any income-based questions. Respondents were only asked questions about wages if they were currently employed. Thus, our analyses did not include people who were retired or enrolled in school full time.
The survey was originally designed to measure the effect of President Lyndon B. Johnson’s War on Poverty. For this reason, low-income and Black households were overrepresented. Indeed, in our sample, 34% of the sample was Black, which is considerably higher than the percentage of Blacks in the country. Because the Black population was oversampled and to ensure that all individuals were sampled equally, all the analyses were adjusted with PSID provided weights. After including weights, Blacks comprised approximately 13% of the sample. Similar results emerged whether we adjust for weights. We also filtered out participants who did not identify as White or Black. Given the original sample selection parameters, this was a relatively small proportion of the sample (∼4%).
This yielded a panel dataset in which the individual was the unit of analysis and all data was at the individual-year level. The final sample consisted of 18,954 respondents, spanning 151,410 individual-years. 70% of respondents were male. The average age was 43 years old (SD = 17.8). On average participants held 2.5 jobs over their lifetime (SD = 2.2, range 1 to 23) and participated in the survey 6.5 times (SD = 1.3).
The sample of White participants was slightly older (Mage = 45.6, SD = 18.6) and more heavily male (77% male) than the sample of Black participants (Mage = 41.6, SD = 16.4; 56% male). On average, White participants had 14.5 years of education (SD = 11.9) while Black participants 13.4 years (SD = 13.6) of education.
Measures
Income
Our unit of analysis was the annual salary of an individual i in year t. PSID collected data on both hourly wages for non-salaried individuals and annual salary for salaried individuals. For hourly workers, we computed their annual salary by multiplying their hourly salary by the number of hours they reported working in a given year. Incomes were top-coded in the PSID. Before 1978, they were capped at $9.97 per hour, from 1978 to 1992, they were capped at $99.97 per hour, and after 1993, they were capped at $996.99 per hour. Our key dependent variable was the natural logarithm of annual wages of an individual (Log Annual Wages). The average annual salary was $28,403 (SD = $49,115) for Blacks and $45,085 (SD = $48,412) for Whites.
Unemployment Status
At each survey administration, respondents were asked their employment status (working now, temporarily laid off, unemployed and looking for work, retired, permanently disabled, housewife, student, other). We considered respondents involuntarily unemployed if they indicated they were temporarily laid off or unemployed and looking for work.
Wages at Reemployment
Hypothesis 5 predicted that during recessions Blacks would be reemployed at lower wages than Whites. We tested this possibility by examining the wages of workers who were employed during the survey year but involuntarily unemployed the previous year.
Hours Worked
Both hourly and salaried employees were asked how many hours they worked each year. On average White respondents worked 2,084 hours in a year (SD = 1,200) while Black respondents worked 1,819 hours in a year (SD = 788).
Economic Conditions
We measured economic conditions using the annual state unemployment rate from the Bureau of Labor Statistics. We used the state unemployment rate (Unemployment) to capture economic conditions given that past work has shown this indicator is more tightly tied to people’s assessments and beliefs about the economy than other major indicators (e.g., Bianchi, 2016; Kahn, 2010; Ruhm, 2000; Wolfers, 2003). This is also the variable most frequently used across disciplines to examine how the economy affects attitudes and behaviors (e.g., Bianchi, 2016; Kahn, 2010; Ruhm, 2000). The mean unemployment rate during the time period examined was 6.7% (SD = 2.02) and ranged from 2.5% to 17.4%.
Race
Race was self-identified and was reported by the respondent during their first interview. Race was coded as 1 if the respondent was Black and 0 if the respondent was White.
State-Level Racial Attitudes
We measured state-level racial attitudes using three different data sources, each with different strengths and limitations. First, we measured self-reported attitudes about Blacks and Whites using data from Project Implicit. Project Implicit hosts a website in which internet respondents voluntarily complete Implicit Associations Tests and answer multiple questions, including a feeling thermometer about different racial groups. To gauge feelings towards various racial groups, respondents are asked, “Please rate how warm or cold you feel toward the following groups (0 = coldest feelings, 5 = neutral, 10 = warmest feelings).” All respondents were asked to complete feeling thermometers for “African-Americans” and “European Americans.” Drawing on past work, we gauged prejudice towards Blacks using the difference between how warmly Whites felt towards Whites and how warmly they felt towards Blacks (Leitner et al., 2016). Past work has shown that a larger difference (e.g. favoritism towards Whites) predicts worse health outcomes for Blacks (Leitner et al., 2016).
One limitation of the Project Implicit data is the representativeness of the sample. Participation is voluntary and past work suggests that the sample tends to be younger and include more women than the general population (Connor et al., 2019). That said, this sample also has considerable strengths. For one, unlike many cross-temporal surveys, it has well-validated measures of racial bias. Indeed, in our analyses we use the feeling thermometer which is one of the most widely used and validated measures of racial attitudes. In addition, this dataset has considerably larger response rates than government administered surveys. In the Project Implicit data, an average of 1,500 respondents in each state complete the survey each year. Finally, in this sample there is considerable variation in racial bias across states and the pattern of distribution at the state level is similar to the pattern seen in the other datasets. Indeed, when we rank order the states by the degree of prejudice we obtain a very similar ranking across all three measures.
We gathered data from 10,875 White respondents from all fifty states. Participants were only included if: 1) they responded to feeling thermometers about Blacks and Whites, 2) this was the first time they completed the survey, and 3) they had valid state level information. All data was collected between 2003 and 2013. For each state, we averaged individual responses among White respondents and used this average to create a static discrimination score for each state. We used this approach because this discrimination data was only available for 10 years of the 40 years of the available wage data. While there was slight variation in discrimination by state over time, the rank order of states remained relatively stable during this time period, a pattern shown in other studies using this dataset (Leitner et al., 2016; Schmidt & Nosek, 2010).
Figure 1 presents these difference scores by state. As shown in this figure, there was substantial heterogeneity in racial attitudes by state. States that had particularly high difference scores, indicating considerably more positive attitudes towards Whites than Blacks, included Mississippi (M = 1.23, SD = 2.13) and Alabama (M = 1.18, SD = 2.03). The states with the lowest differentials were New Mexico (M = 0.51, SD = 1.66) and Vermont (M = 0.52, SD = 1.46).

Difference in Feelings Towards Whites and Blacks Among Whites by State.
Our second metric of discrimination came from the General Social Survey (GSS). Unlike the Project Implicit data, which is based on a non-random internet sample, this survey gathers data from a nationally representative sample of American adults. However, one disadvantage of this metric is that the samples are fairly small. The GSS was administered annually from 1972 to 1994 and biannually thereafter. The GSS has included dozens of questions on racial sentiment, though each question was not asked each year. To construct a measure of racial sentiment, we followed the method used by Charles and Guryan (2007). This method created an index which included ten questions which appeared in the survey between 1972 and 2011 (see Appendix). Each individual’s response was normalized by subtracting the mean of all the responses in 1977 and dividing by the variation of responses in the first year that the question was asked. The aggregate average level of discrimination in that state and year (GSS) was constructed by taking the mean of all the responses for each question across all individuals in each state and year. Thus, unlike the Project Implicit metric, this measure fluctuated by state and year. We only had state level GSS racial data through 2011, while our wage data went through 2017. As a result, these analyses included most but not all of the sample.
Our final metric of discrimination was the number of hate groups as measured by the Southern Poverty Law Center (SPLC) between 2000 and 2017. The SPLC reports the total number of hate groups by type in each state and year. We created the variable Hate Groups by taking the total number of anti-Black hate groups in each state (White Nationalist, Identity, Ku-Klux Klan, Neo-Confederate, Neo-Nazi, Skinhead and Other) and dividing it by the population of the state. As a robustness test, we also created a variable comprised of all hate groups (which also include anti-LGBT etc. other hate types). We obtained similar results when we used this measure. As with the Project Implicit measure, given the limited time frame of this data, we computed one figure per state and used this across the survey time period.
Racial Composition by State
We also measured discrimination using the percentage of the Black population in any given state. Past research has shown that Whites in states with larger Black populations are more likely to regard Blacks as a threat to scarce resources (e.g., Fossett & Kiecolt, 1989; Pettigrew, 1998). Thus, we expected that an increasing wage gap during recessions would be stronger in states with a larger Black population.
We gathered data on the percentage of Blacks in each state in each decade from the census conducted in 1970, 1980, 1990, 2000, and 2010. For each year in a given decade, we used the percentage of Blacks in a given state according to the census conducted at the beginning of that decade. These percentages ranged from below 1% in states like Montana, Idaho, and Wyoming to more than 30% in states like Georgia, Louisiana, and Mississippi.
Control Variables
Following past literature, we controlled for demographic variables that are associated with wages. These included gender, age, educational level, and union status (e.g., Kronberg, 2014; McCall, 2001; Petersen & Morgan, 1995; Rosenfeld & Kleykamp, 2012). Gender was coded 1 if the respondent was male and 0 if the respondent was female. Age (Age) and age squared (Age Squared) were measured continuously. Union was coded as 1 if the respondent was part of a union and 0 if they were not. Because questions about highest degree were not included in every administration of the survey, we coded respondents as having a college degree if they had 16 or more years of education (College Educated). Overall, 20% of our sample held a college degree. This included 26% of Whites and 9% of Blacks.
In all analysis, we used individual fixed effects which allowed us to account for unmeasured individual characteristics such as experience, personality, or skills. Moreover, individual fixed effects allowed us to examine within person changes in income in different economic times. We also used year and state fixed effects to account for any year or state-specific non-economic shocks. Our results were robust to the inclusion of state-specific linear time trends although we did not include them in the reported results.
Finally, we controlled for occupation and industry. Past work has shown that occupation and industry differences account for some of the racial wage gap (Drange & Helland, 2019; Fryer et al., 2013; Grodsky & Pager, 2001; Parcel & Mueller, 1983; Smith, 2002; Wilson & Roscigno, 2016). Moreover, some occupations and industries are more negatively affected by recessions than others (Jaimovich & Siu, 2012). If Blacks are more likely to sort into recession-prone occupations or industries relative to Whites, we would expect this to account for at least some of the change in the wage gap. Therefore, we included occupational and industry fixed effects in order to account for the possibility that occupational differences across race were driving any observed effects. Industry and occupations were categorized using 3-digit industry codes from the 1970 Census of Population issued by the United States Department of Commerce and the Bureau of the Census. There were twelve categories for both industries and occupations. These codes were specified in the PSID documentation.
Empirical Methodology
All analyses were conducted using OLS regressions with individual fixed effects. 1 This approach allowed us to examine changes in individual wages over time and across different economic environments. Individual fixed effects also allowed us to control for person-level characteristics such as experience, quality of schooling and skill level that may contribute to the racial wage gap. This approach offers considerable advantages over cross-sectional examinations of the racial wage gap which has difficulty ensuring that differences between Black and White workers are measured and included as control variables (Fryer et al., 2013). Moreover, some scholars argue that this approach may underestimate the wage gap because some of the relevant controls might be products of discriminatory behavior (e.g., Fryer et al., 2013; Western & Pettit, 2005). Our approach, however, allowed us to control for individual differences across workers and then examine whether the gap between White and Black workers fluctuates with the economy. As such, it accounts for possible pre-market and labor market differences between Black and White workers.
To test whether the wage gap widened during recessions (Hypothesis 1), we created a model which estimated the log of annual wages of individual i at year t when there was an increase in unemployment of state of residence s and year t. This yields the following OLS estimation model with fixed effects:
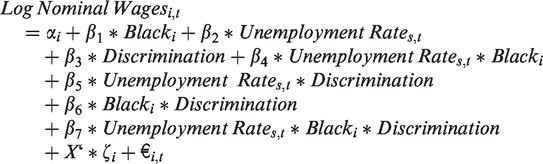
The vector X represents the control variables. All standard-errors were clustered at the individual level.
To test whether wages dropped more quickly for Blacks than Whites during downturns, we examined the interaction between the unemployment rate and Black (β4). A negative coefficient for this interaction suggests that when the unemployment rises, Black wages decrease relative to White wages.
To test whether the widening of the racial wage gap during recessions was more pronounced in states with greater discrimination and larger Black populations (Hypotheses 2 and 3), we created a three-way interaction term between the unemployment rate, race, and discrimination/Black population. In this model, we also added all pairwise interactions between these three variables. We do not show the effects of the pairwise interactions in Table 3 for the sake of brevity.
This yielded the following model:
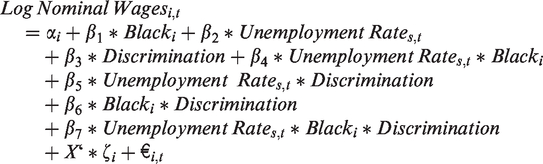
To test whether an expanding wage gap during recessions could be explained in part by a greater reduction in hours for Black compared to White workers, we used a similar methodology as above with the annual number of hours as a dependent variable. This yielded the following model:
Hours Workedi,t = αi + β1* Blacki + β2* Unemployment Rates,t + β3 * Unemployment Rates,t * Blacki + X‘* ζ i + €I,t
To test whether Blacks were more likely to be unemployed than Whites during bad economic times, we ran the same model, using unemployment as the dependent variable. We expected the coefficient β4 to be positive and significant, indicating that Blacks were more likely to be unemployed than Whites as the unemployment rate increases. This yielded the following equation:
Unemployedi,t = αi + β1* Blacki + β2* Unemployment Rates,t + β3 * Unemployment Rates,t * Blacki + X‘* ζi + €i,
To test whether Blacks were more likely to be reemployed at a lower salary than Whites, we limited the sample to people who had been unemployed within the previous two years (t-1, t-2) and were currently employed (year t). We estimated wages upon reemployment for the year t and controlled for wages before they became unemployed. Since we measured the wages for the year of reemployment, we did not include individual fixed effects. We did keep all other controls.
Wages at Reemploymenti,t = αi + β1* Blacki + β2* Unemployment Rates,t + β3 * Unemployment Rates,t * Black + β4 * Previous Job Wagesi + X‘* ζi + €i,
Results
The Racial Wage Gap in Recessions
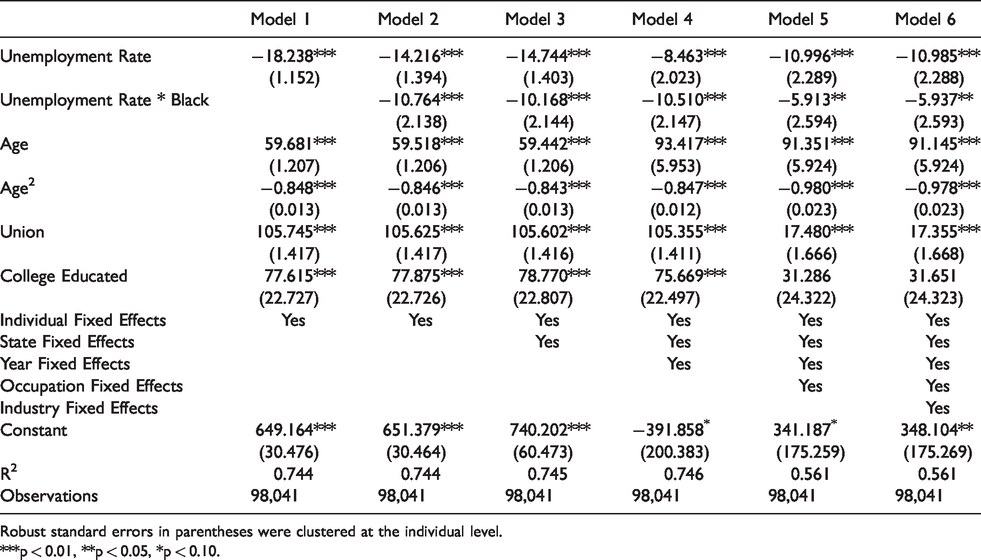
Table 1 reports all summary statistics and correlations. Table 2 reports the results of OLS regressions predicting individual wages. 2
Correlations and Summary Statistics.
***p < 0.01, **p < 0.05, *p < 0.10.
The Unemployment Rate as a Predictor of Annual Wages.

Robust standard errors in parentheses were clustered at the individual level.
***p < 0.01.
Model 1 presents a simple model using the control variables to predict wages. In this model, the unemployment rate was not significantly associated with wages, a finding consistent with past work showing that wages do not decline during recessions (Bewley, 1995). Age was correlated with wages in an inverted U-shape. As expected, union membership and holding a college degree were positively associated with wages.
Model 2 adds the interaction term between race and the unemployment rate to test whether the racial wage gap is greater during periods of higher unemployment. Consistent with the prediction that the racial wage gap increases during recessions (Hypothesis 1), the interaction between the unemployment rate and Black was negative and significant. Figure 2 shows the predicted wages at different levels of unemployment using the results from this model. As shown in this Figure, wages decreased more quickly for Blacks than Whites when the unemployment rate rose. Model 3 added state fixed effects and showed similar results. Model 4 added year fixed effects. Across all models, the earnings gap between Black and White workers significantly widened as the unemployment rate increased. The interaction between unemployment and Black showed that a one-point increase in the unemployment rate was associated with a 0.194 decrease in log of annual wages for Blacks relative to Whites. To examine the magnitude of this effect, we unlogged wages and reran the regression. These findings showed that a one point increase in the unemployment rate was linked to an 18% increase in the racial wage gap.
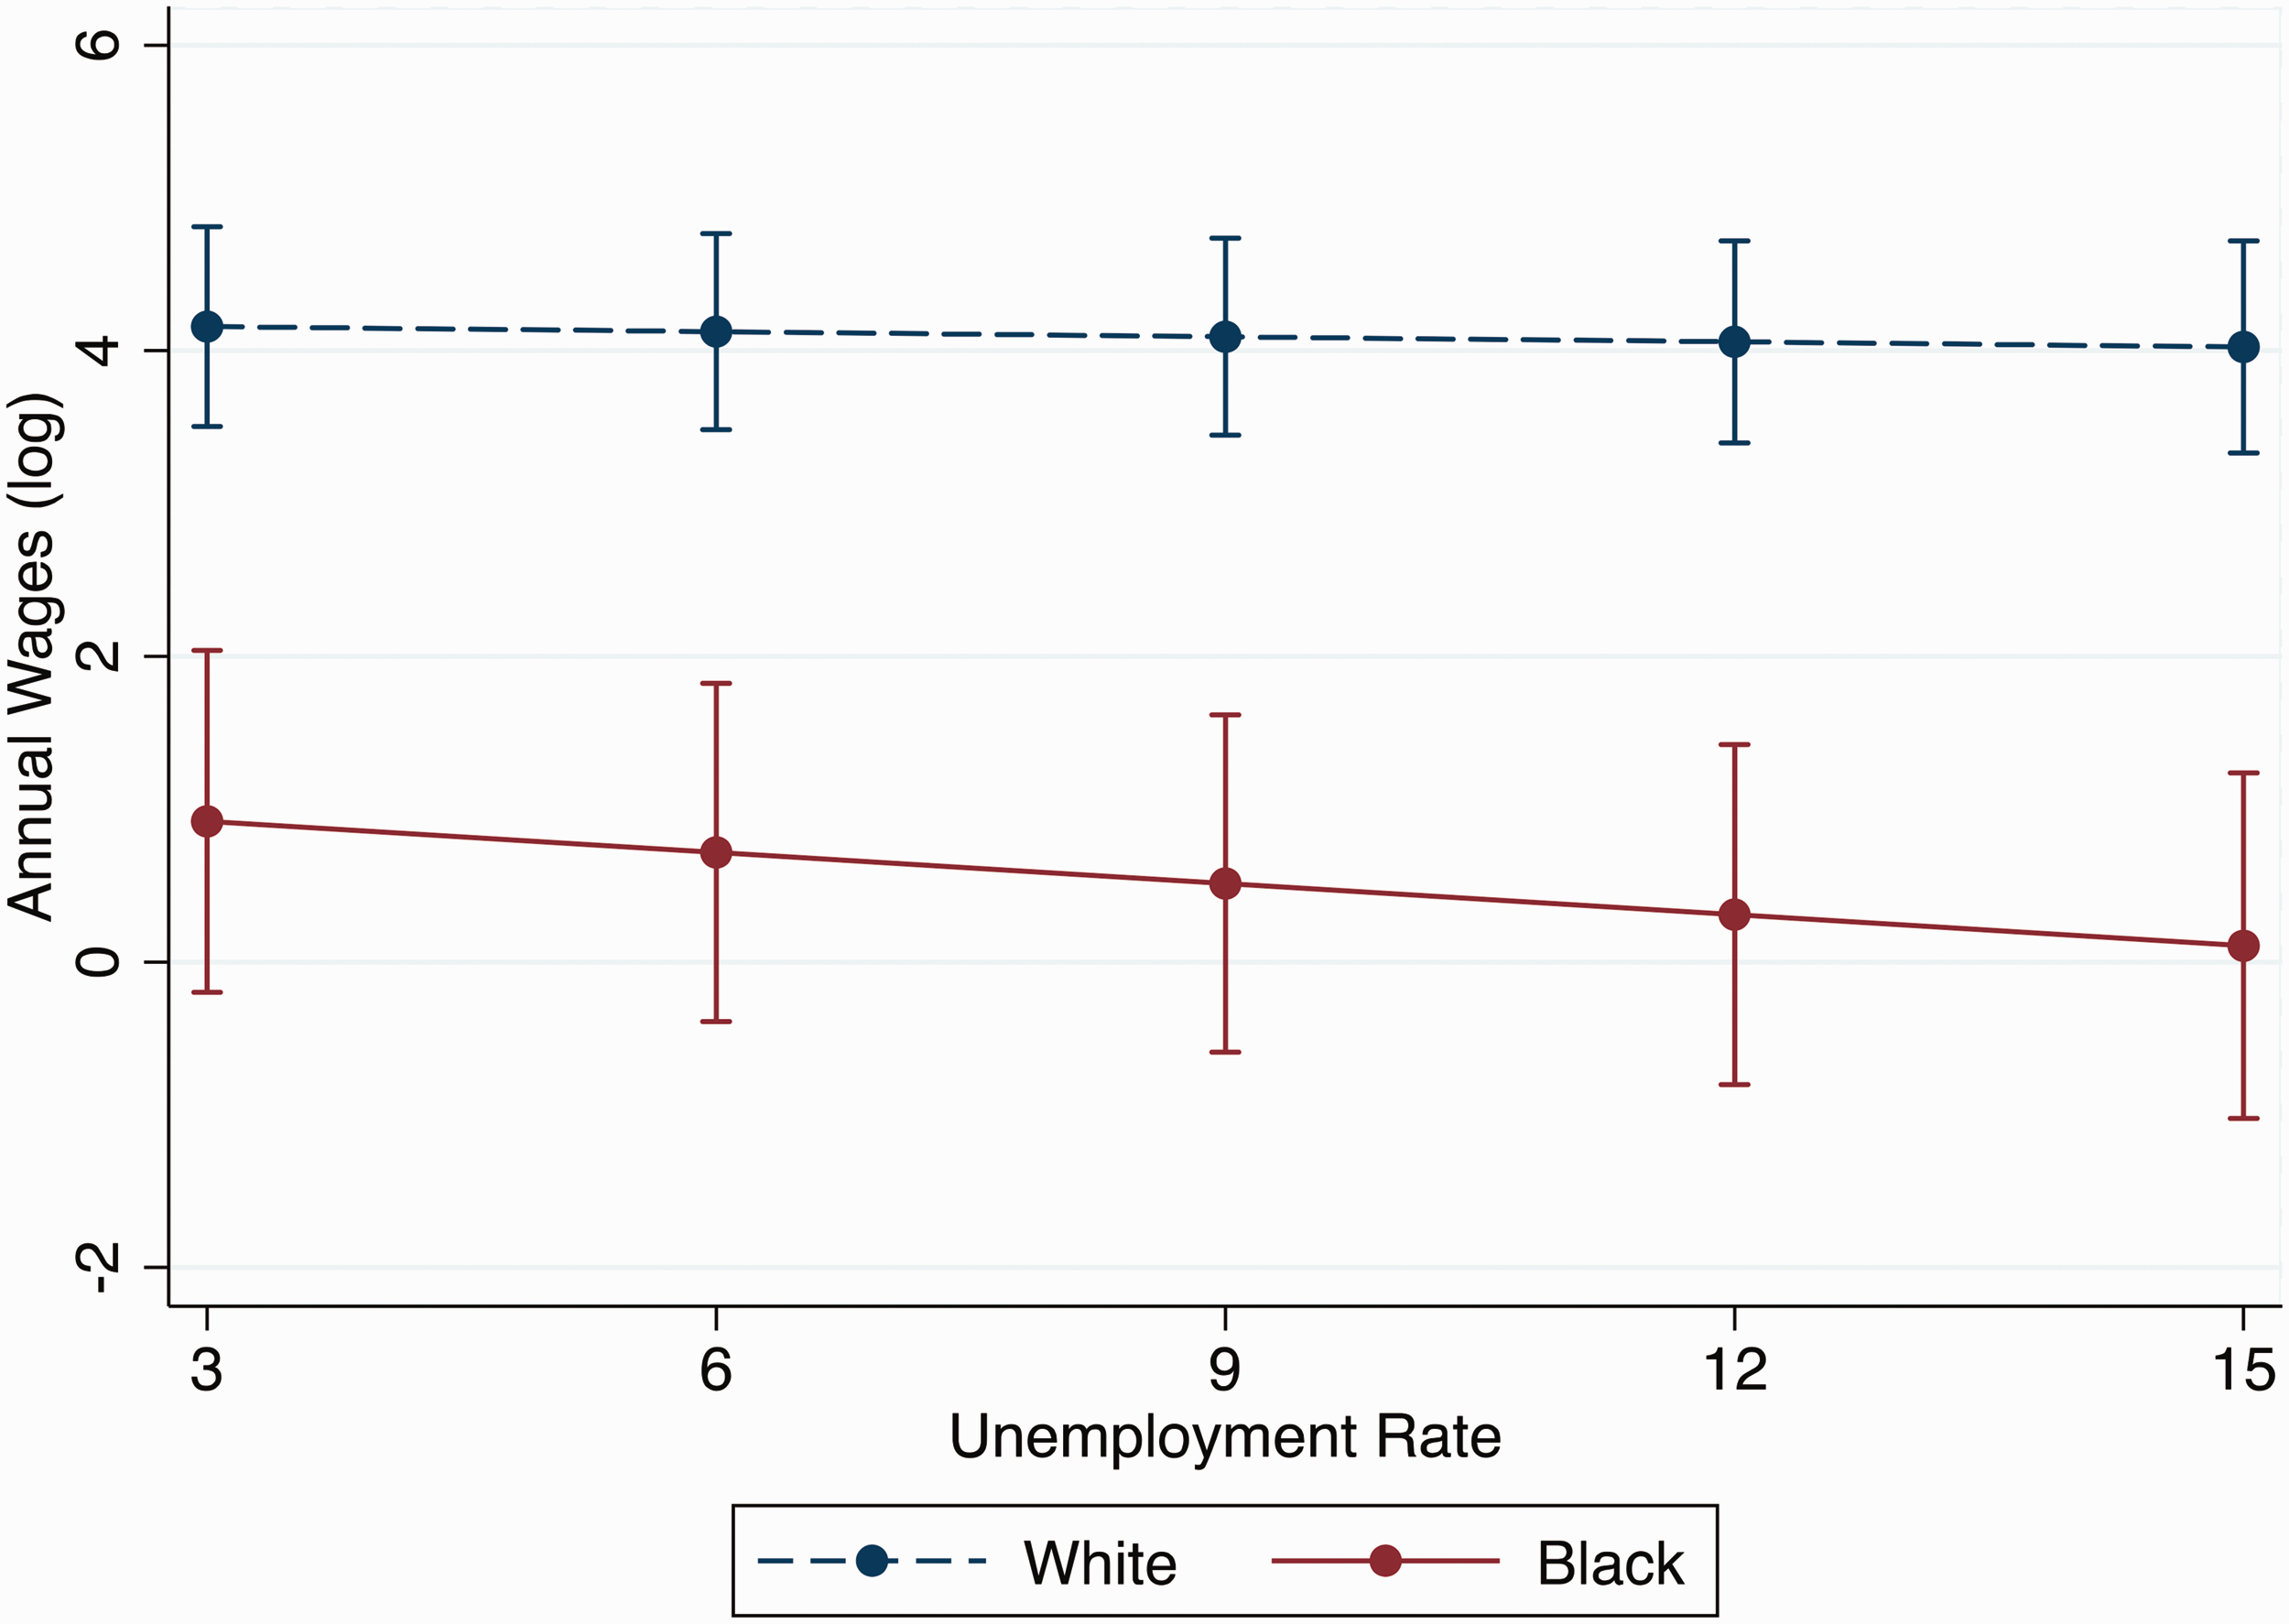
Predicted Annual Wages for Blacks and Whites with 95% Confidence Intervals.

Three Way Interaction Between Race, the Unemployment Rate and the Black Population.
Models 5 and 6 added occupation and industry fixed effects respectively. Importantly, Model 5 suggested that adding occupational controls increased the magnitude of the effect. Indeed, the interaction between race and the unemployment rate increased from −0.194 in Model 4 when occupation was not included as a control to −0.258 in Model 5 when it was included as a control.
Model 6 added industry fixed effects. As shown in this model, industry effects were not similarly influential and did not account for a meaningful change in the wage gap.
The Racial Wage Gap Across States
We next tested whether the widening of the racial wage gap was greater in states with more discrimination (Hypothesis 2) and in states with larger Black populations (Hypothesis 3).
First, we examined whether adding each measure of discrimination meaningfully altered the effect of economic conditions on the racial wage gap. We did this by adding each measure of discrimination to the full model shown in Table 2, Model 6. Before controlling for discrimination, the interaction between race and economic conditions was b = −0.258, SE = 0.052. After controlling for the GSS measure of discrimination, this figure fell to b = −0.116, SE = 0.021. We then ran three additional separate regressions with each measure of discrimination. Controlling for the Project Implicit measure of discrimination, the interaction between race and economic conditions fell to b = −0.23, SE = 0.026. Controlling for the number of hate groups, the interaction reduced to b = −0.225, SE = 0.026. Finally, controlling for the percentage of blacks in the population, the interaction between race and economic conditions fell to b = −0.224, SE = 0.026. These findings suggest that the GSS measure of discrimination accounted for roughly 55% of the wage gap, while the other measures of discrimination explained approximately 10–11% of the wage gap.
Next, we created a series of models which tested whether the increase in the racial wage gap was larger in states with greater discrimination and larger relative Black populations. We did this by examining a three-way interaction between race, economic conditions, and each measure of discrimination. The results of these regressions are shown in Table 3. Model 1 used the Project Implicit measure of discrimination. As shown in this model, the three-way interaction term was significant, suggesting that that the widening of the wage gap was larger in states with greater discrimination. Model 2 showed similar results using the GSS measure of discrimination. Finally Model 3 found similar results using the number of racially based hate groups in each state. Across all three metrics of discrimination, the widening of the racial wage gap during recessions was larger in states with greater animosity towards Blacks (see Figure 3).
Model 5 examined whether the widening racial wage gap during recessions was more pronounced in states with greater Black populations. As shown in this model and consistent with Hypothesis 3, the effects were larger in states with larger Blacks populations. The three-way interaction term in Model 4 shows that a 1% increase in Black population and 1% increase in the unemployment rate was associated with a 27% increase in the racial wage gap.
Hours Worked
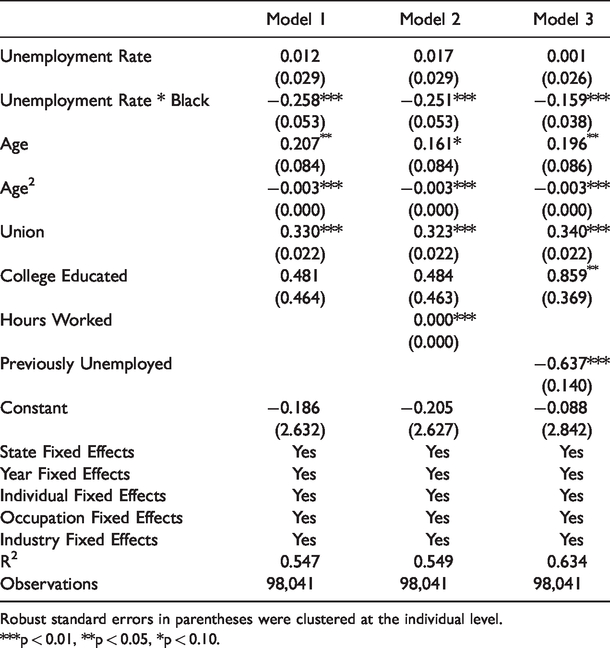
Hypothesis 3 posits that Blacks work fewer hours than Whites during periods of higher unemployment. We tested this possibility by running the same regressions used in Table 2 but using hours worked rather than wages earned as the dependent variable. The results are shown in Table 4. Model 1 showed that hours worked declined when the unemployment rate increased across the sample. As in the previous tables, we added various controls and fixed effects to each subsequent model. Across all models, we found that in worse economic times, the racial gap in hours worked increased, though the magnitude of this effect was quite small. Model 6 presents the results with all included controls. This model showed that a 1% increase in the unemployment rate was associated with a decrease of approximately 6 annual work hours for Blacks relative to Whites.
Unemployment Rate as a Predictor of the Annual Wages in States With More Discrimination and Higher Percentage of Black Residents.

Robust standard errors in parentheses were clustered at the individual level. All models include pairwise interactions terms between the unemployment rate, race, and discrimination/Black population. The results for these interactions are not included in the table for ease of comprehension.
***p < 0.01, **p < 0.05, *p < 0.10.
The Unemployment Rate as a Predictor of Annual Hours Worked.
Robust standard errors in parentheses were clustered at the individual level.
***p < 0.01, **p < 0.05, *p < 0.10.
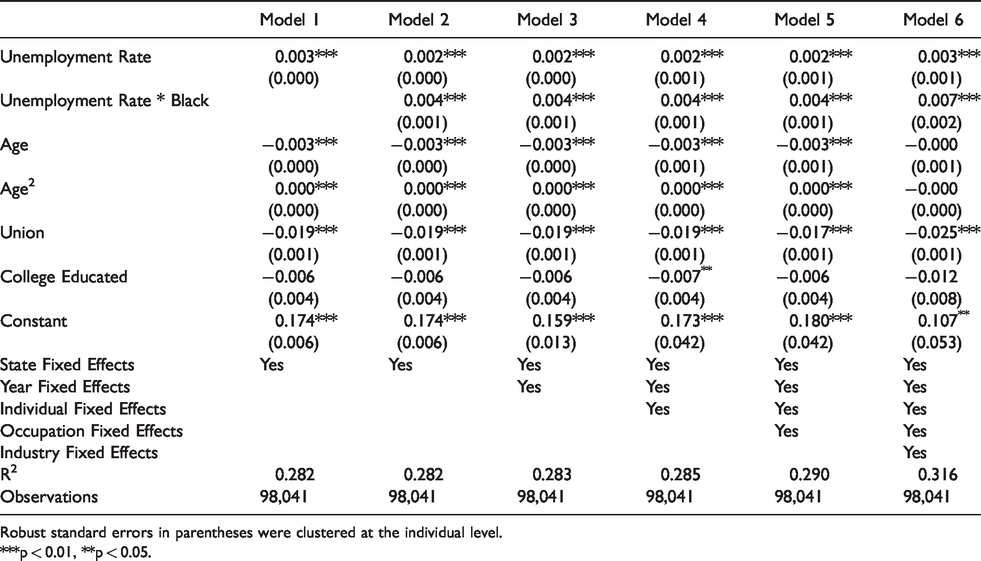
Next, we tested how much of the widening wage gap was accounted for by a reduction of hours for Black workers during recessions. We did this by including hours worked as a control in our full wage model shown in Table 2, Model 6. Table 5 presents the results of regression analyses both with and without controlling for hours worked. Model 1 presents the full wage model, while Model 2 adds hours worked. As shown in Model 1, the interaction between race and the unemployment rate was b = −0.258 when hours worked was not included as a control variable. As shown in Model 2, when hours worked was included, this coefficient was b = −0.251. To test whether this drop was significant, we ran a bootstrapping analysis based on 500 re-samples (Preacher & Hayes, 2008). This analysis showed significant indirect effects for hours worked (b = −0.043, 95% CI = −0.045, -0.041). These findings suggest that fewer hours worked does account for some of the expansion of the wage gap, but a fairly small amount. Indeed, these results suggest that fewer hours worked accounted for approximately 3% of the increase in the racial wage gap during recessions.
The Unemployment Rate as a Predictor of Annual Wages After Accounting for Hours Worked and Spells of Unemployment.
Robust standard errors in parentheses were clustered at the individual level.
***p < 0.01, **p < 0.05, *p < 0.10.
Job Loss
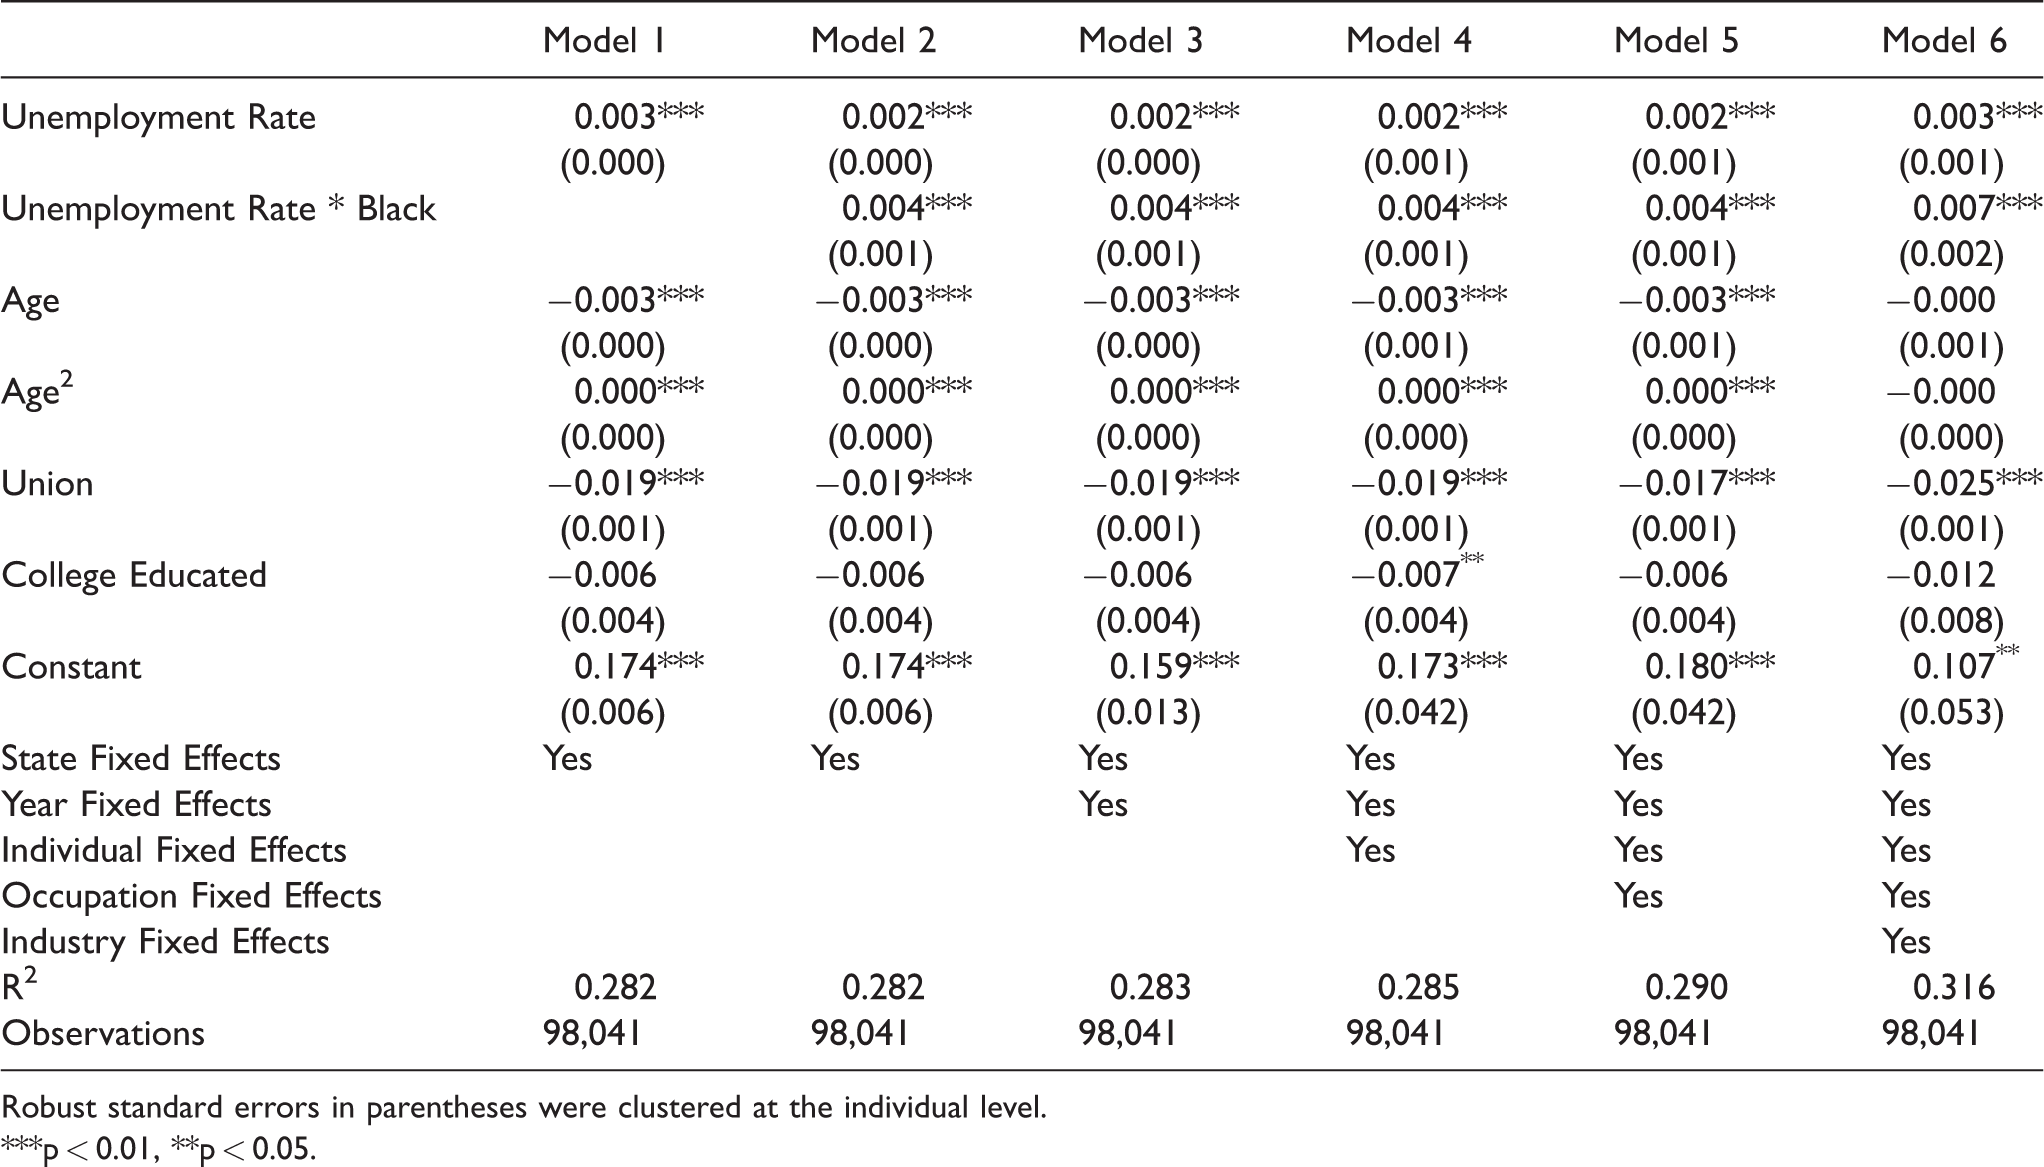
Hypothesis 4 posits that Blacks are more likely to be involuntarily unemployed during recessions than Whites. Table 6 shows the results of logistic regressions using unemployed as the dependent variable and including all the same control variables shown in the previous analyses. 3 Consistent with Hypothesis 4, across all models and specifications, Blacks were significantly more likely to be involuntarily unemployed in recessions than Whites. Model 5 included all controls. This model suggests that a 1% increase in the unemployment rate was associated with a 0.7% increase in the probability of Blacks being unemployed relative to Whites.
Unemployment Rate as a Predictor of Likelihood of Being Unemployed.
Robust standard errors in parentheses were clustered at the individual level.
***p < 0.01, **p < 0.05.
As with hourly wages, we tested how much of the widening wage gap was accounted for by job loss during recessions by including previous year job loss as a control in our full wage model. Table 5 presents the results of regression analyses both with and without controlling for job loss in the previous year. As shown in Model 1, the interaction between race and the unemployment rate was b = −0.258 when we did not control for previous year’s job loss. As shown in Model 4, when including job loss, this coefficient was reduced to b = −0.159. This suggests that job loss accounts for approximately 38% of the increase in the wage gap during recessions.
Reemployment Wages After Job Loss
Hypothesis 5 predicts that Blacks who lose their jobs during downturns are more likely to be reemployed at lower wages relative to unemployed Whites. Table 7 shows models predicting wages in the year after reemployment while controlling for past wages. The dependent variable is the natural logarithm of wages in the current job. We included the same sequence of control variables used in the previous wage analyses except for individual fixed effects. However, in all of these analyses, we also included an additional control for wages in the year before job loss.
Unemployment Rate as a Predictor of Wages in the First Year of Re-Employment After a Period of Unemployment.

Robust standard errors in parentheses were clustered at the individual level.
***p < 0.01.
Consistent with Hypothesis 5, all models showed that Blacks reemployed after job loss received lower wages upon reemployment than Whites reemployed after job loss. Indeed, as shown in Table 7 Model 6, a 1% increase in the unemployment rate was associated with a 3.4% greater reduction in wages for involuntarily unemployed Black workers in the year of reemployment relative to comparable White workers.
Importantly, our analyses only examined people who had been involuntarily unemployed and reported personal income in the following year. Given that long-term job loss is likely to result in even lower wages than short-term job loss, this approach may underestimate the extent to which the greater layoffs of Black workers during recessions increases the racial wage gap in the following years.
Discussion
Using a large sample of working adults followed over a long period of time, we found that higher state unemployment rates were associated with a greater wage gap between Black and White workers. These effects emerged within individuals, suggesting they cannot be explained by premarket factors such as educational background. Moreover, these effects emerged even after controlling for industry and occupation and selection into and out of the workforce. In addition, the racial wage gap was more likely to widen during recessions in states with greater racial discrimination and larger Black populations, suggesting that discrimination was underlying at least some of the widening gap.
Our results also provided some evidence on how the racial wage gap widens during recessions. We found that Black workers were substantially more likely to lose their jobs during recessions and earn lower wages upon reemployment. A smaller share of the widening wage gap seemed to be driven by a reduction in hours. Black workers were slightly more likely to have their hours reduced during recessions, thereby resulting in lower earnings. Yet the effect of hourly reduction, while statistically significant, was quite small.
Conclusion
These findings have several implications for the literature on the racial wage gap and labor market discrimination. First, our findings point to the fluidity of the wage gap and discrimination in general. Labor market discrimination is often regarded as fairly static and slow to change. Indeed, when scholars debate whether labor market discrimination has diminished over time, they typically consider changes over decades rather than over years or economic cycles (e.g., Cancio et al., 1996; Hughes & Thomas, 1998; Quillian et al., 2017). Our results suggest that discrimination is more fluid than past approaches would suggest. By showing that the wage gap is sensitive to macroeconomic fluctuations, our findings suggest that the size of the gap can fluctuate relatively easily and in response to changing contextual forces.
These findings also provide additional evidence that discrimination explains some of the racial wage gap. Past work has documented racial wage discrimination by showing that a gap between Black and White wages persists even after controlling for pre-market and market factors (Altonji & Blank, 1999; Corcoran & Duncan, 1979; Darity & Mason, 2004). While wage discrimination is typically regarded as the wage differential that remains after controlling for premarket and productivity differences, this approach has at least two shortcomings. First, it may underestimate discrimination (e.g., Fryer et al., 2013; Western & Pettit, 2005). Some of the relevant controls might be products of discriminatory behavior. For instance, Black job applicants are often diverted into less prestigious jobs than White applicants (Pager et al., 2009). Thus, controlling for job type may underestimate the wage gap attributable to discrimination. On the other hand, this approach also may overestimate the size of the racial wage gap if all appropriate controls are not included. These issues highlight the challenges of capturing discrimination from wage differentials.
We used a different approach to highlight the role of discrimination. By examining changes in the wage gap within individuals over time, we were able to hold constant any unmeasured individual differences that may be driving the racial wage gap. Even so, we still found that an exogenous shock associated with greater discrimination widened this gap. Moreover, the widening of the gap was particularly pronounced in states with higher levels of discrimination. This provides additional evidence that discrimination is at least one mechanism underlying the racial wage gap and fluctuations within it.
These findings also provide insight into how the racial wage gap spreads during recessions. Past work on greater workforce discrimination during recessions has largely focused on job loss (e.g., Couch & Fairlie, 2010; Fairlie & Kletzer, 1998; Freeman, 1973). We similarly find that Blacks are more likely to involuntarily lose their jobs during periods of high unemployment. However, this alone cannot account for the widening racial wage gap since we find that the wage gap increases even among Black and White workers who are continuously employed. Instead, we find that part of the reason the wage gap widens during recessions is because unemployed Black workers receive lower salaries after reentering the workforce than comparable White workers. Our findings also suggest that reducing hours has a small but measurable effect on expanding the racial wage gap during bad economic times.
Black workers were significantly more likely to have their hours reduced during recessions than comparable White workers. Past work has focused largely on hiring and firing practices as consequences of discrimination during recessions. The current findings reveal another way in which discrimination appears to widen the wage gap when the economy flounders.
Our research also points to several potential directions for future work. First, while our study focused on how the wage gap fluctuates across the economic cycle, future work could explore how the economy affects other workplace outcomes as well. Past work has revealed differential outcomes by race across several workplace domains. For instance, Blacks tend to receive less favorable performance evaluations than Whites (Ilgen & Youtz, 1986; Kraiger & Ford, 1985). Blacks are also less likely to receive call backs for job interviews and more likely to be excluded from lucrative occupations (e.g, Bertrand & Mullainathan, 2004; Bowlus & Eckstein, 2002). Future research could explore whether these racial discrepancies might similarly widen when the economy sours.
Future research could also consider whether organizational or industry level scarcity similarly predict divergent outcomes across race. While our study focuses on how macroeconomic scarcity affects the racial wage gap, the accompanying reasoning suggests that more proximate economic scarcity might yield similar effects. Given that organizations undergo their own periods of abundance and scarcity, future work could examine whether these fluctuations similarly predict divergent racial outcomes.
We suspect that most of these effects are driven by subconscious processes among managers and organizations and not by overt attempts at wage discrimination. Indeed, recent work suggests that most workplace discrimination is subtle and often unrecognized by organizations and decision makers (Pearson et al., 2009). If these processes are largely unconscious, then one implication of this work could be the recognition that discriminatory decisions and resource allocation appear to be more common during recessions. Organizations and managers that are committed to fair and merit-based employment practices may benefit from further scrutinizing their practices and procedures during tumultuous economic times.
Another practical implication of this work is to highlight the role of discrimination in wage allocation. As previously noted, this research provides additional evidence that discrimination underlies this gap. As such, it suggests that organizations need to reevaluate their wage allocation choices with an eye towards assuring wage parity across races. Our results suggest that this is particularly true for employers of low-wage and high turnover workers. Indeed, our results suggest that this population is the most vulnerable to reduced wages based on their race.
Racial discrepancies in employment outcomes are a well-documented feature of organizational life. Yet, relatively little is known about the conditions that exacerbate or temper racial gaps in outcomes. This study takes a step towards understanding how contextual factors influence racial wage discrepancies. In doing so, it helps reveal how such discrepancies replicate and persist.
Appendix
GSS Questions Used to Create the Racial Attitudes Index
1. Do you think there should be laws against marriages between (Blacks/African-Americans) and whites?
2. Now thinking about ten years ago, that is in 1972, did you then think there should be laws against marriages between (Blacks) and whites?
3. White people have a right to keep (Blacks/African-Americans) out of their neighborhoods if they want to, and (Blacks/African-Americans) should respect that right.
4. If your party nominated a (Black/African-American) for President, would you vote for him if he were qualified for the job?
5. Do you think white students and (Black) students should go to the same schools or to separate schools?
6. How strongly would you object if a member of your family wanted to bring a (Black) friend home to dinner? Would you object strongly, mildly, or not at all?
7. (Blacks/African-Americans) shouldn't push themselves where they're not wanted.
8. During the last few years, has anyone in your family brought a friend who was a (Black/African-American) home for dinner?
9. Do you think Blacks should have as good a chance as white people to get any kind of job, or do you think white people should have the first chance at any kind of job?
10. Do (Blacks/African-Americans)/Whites attend the church that you, yourself, attend most often, or no?
Footnotes
Declaration of Conflicting Interests
The authors declared no potential conflicts of interest with respect to the research, authorship, and/or publication of this article.
Funding
The authors received no financial support for the research, authorship, and/or publication of this article.
