




Abstract
Criminal justice system fines and fees are a source of revenue for courts, district attorneys, probation departments, and other actors both inside and outside of the justice system. Because these departments rely on fine and fee revenue to partially fund their budgets, they may be incentivized to oppose reforms that would reduce fine and fee collections. Using budget documents from counties and a sample of municipalities in Florida and New York, the authors find that budget reports provide more detailed data on fines and fees than are available from other data sources, including information on which types of fines and fees are collected and how much revenue criminal justice fines and fees provide, both on a per-capita basis and as a share of the total jurisdiction budget. This paper presents a replicable methodology for future research in how to use local government budget documents to evaluate fine and fee collections. A larger, forthcoming study will use this methodology to examine fine and fee collections in five states.
The fatal shooting of Michael Brown by a police officer in Ferguson, Missouri, and the subsequent Department of Justice investigation into the Ferguson Police Department brought the issue of revenue-driven justice into the national spotlight. In Ferguson, federal investigators found that the need for revenue was a driving factor in police decision making and that justice fines and fees made up nearly one-quarter of general fund revenues in the municipal budget (U.S. Department of Justice 2015). Thousands of arrest warrants were issued each year as a way to increase collections, the vast majority for minor ordinance violations and traffic tickets. The investigation also uncovered communications between the city’s finance director and police chief strategizing on ways to alter police practices to maximize revenue, and diverting attention away from other public safety priorities.
The use of fines and fees has expanded in recent decades, following the twin phenomena of mass incarceration and shrinking state and local budgets (Sobol 2017). Fines and fees became more common under the “broken windows” theory of policing in the 1980s, when fines were increasingly used as sanction for low-level offenses and used as revenue to help support the ballooning cost of state and local justice systems (Atkinson 2015; Council of Economic Advisors 2015).
More recently, in the wake of the Great Recession, states and localities facing budget shortfalls and widespread anti-tax attitudes again increased fines and fees. A 2014 survey found that 48 states had either increased the amount of court fines and fees, added new ones, or both in the years since the recession began (Shapiro 2014). In municipalities with structural limits on raising revenue, such as property tax caps or constitutional tax limits, increasing economic sanctions can be an appealing way to increase revenue while avoiding the political battles of increasing taxes (Atkinson 2015). The Supreme Court’s decision in Timbs v. Indiana (2019:7) agreed, citing an amicus curae brief stating, “[p]erhaps because they are politically easier to impose than generally applicable taxes, state and local governments nationwide increasingly depend heavily on fines and fees as a source of general revenue.”
Fines and fees are an attractive revenue option for many jurisdictions as they often draw from nonresidents in the case of traffic fines and fees, or from individuals with low political power (Garrett and Wagner 2006). Once these revenues have become an anticipated part of a government’s budget, local lawmakers are incentivized to ensure these collections continue (Martin et al. 2018). The specific stakeholders—the government agencies or actors—who directly benefit from the revenue are particularly incentivized to ensure its continuance. This revenue pressure is most acute in smaller jurisdictions (Goldstein, Sances, and You 2018). Research has also uncovered that collections for economic sanctions are higher in jurisdictions under fiscal strain and that they tend to be higher in places with lower property tax revenue, a key source of funding for local governments (Makowsky and Stratmann 2009). As states and localities face the COVID-19 recession, they may again consider increases in fines and fees, especially in states with no income tax or limited alternative sources of revenue (Hager 2020).
The Scale of Fines and Fees
Fines and fees exist at every stage of the criminal legal process, from arrest and booking to conviction and sentencing, and are the most common form of punishment in the United States (Martin et al. 2018). Fines and fees, also referred to as economic sanctions or legal financial obligations, have differing purported goals. Fines ostensibly serve as a sanction for an offense, and may be combined with jail or prison time as part of a punishment. Fees and surcharges, also called “costs,” are often assessed with the stated goal to fund a specific government service. People are also charged a range of “user fees” such as fees for being on probation or parole, participating in pretrial monitoring, and completing a drug test, among many others. Courts may add a fee or surcharge onto restitution, a cost that is intended to compensate the victim of a crime for loss or harm. Many jails and prisons charge the people they lock up fees to place telephone calls as well as a mark-up on commissary goods (Schaffer, Tylek, and Callahan 2019). Private companies often contract with local or state governments to provide a service including probation, parole, or jail commissary in exchange for the right to charge fees (Sobol 2018). In some cases, jurisdictions receive a portion of this revenue (Wagner and Jones 2019).
People who are charged economic sanctions find it difficult to pay in light of other financial obligations and often miss payments (Ruback et al. 2006). A survey of nearly 1,000 Alabamians with court debt found that more than 8 in 10 had to reduce spending on basic needs like food and medical care to make court debt payments and nearly half had relied on payday loans (Alabama Appleseed Center for Law & Justice et al). Another survey found that the median income for people under supervision for a felony conviction was only $8,000, and that the majority of this group had foregone basic necessities and borrowed money from friends and family to pay off court debt (Cook 2014). In this context, fines and fees operate as a poverty trap with little to no impact on financially stable households but with seriously harmful consequences for those who struggle to pay (Mello 2018). Regardless of the stated goal—whether punishment or payment intended to compensate for government operations—fines and fees represent revenue to the governments collecting them. In this way, the imposition of fines, and fees functions as a tax, or as Theresa Zhen (2019:179) puts it, a “faux-taxation scheme that circumvents the traditional political process and is predicated on racially discriminatory stops.”
Fines and Fees as a Revenue Source
A growing body of research is beginning to examine how reliant governments are on these revenues. Research using Census data on state and local government revenues from fines and forfeits has suggested that the municipalities that collect the largest share of local revenues from this source tend to have larger proportions of Black residents, regardless of income level (Kopf 2016). Similarly, another analysis found that cities with a larger Black population tend to collect more in “fines and forfeits” per capita, although this impact is mitigated by the presence of Black city council members (Sances and You 2016). An analysis of Census revenue data supplemented with state datasets and audited financial statements found hundreds of municipal governments, mostly small towns and cities, in which fine revenue made up 10 percent or more of general revenues, and that these places were more likely to have a lower median household income (Maciag 2019). Yet the Census does not capture the full universe of criminal justice economic sanctions—notably court fees and surcharges, “user fees” for community supervision, and jail fees—and thus likely represents an underestimate (Colgan 2020).
Other research has relied on court data to investigate revenue from economic sanctions. An examination of administrative court records in Alabama found that a “felony-centric” view of the justice system underestimates the revenue impact of economic sanctions, because much of the revenue collected was related to misdemeanor, traffic, and municipal charges, with many of the cases adjudicated in municipal courts (Greenberg, Meredith, and Morse 2016). While administrative court data can provide rich detail on court cases and court fines and fees, it often lacks information on noncourt fines and fees such as probation fees, pretrial monitoring fees, and jail fees.
Revenue from fines and fees benefits a range of stakeholders. Because fines and fees are typically collected by courts at multiple jurisdiction levels as well as by other justice system actors like jails, there is often a complex web of beneficiaries from fine and fee revenue (McGovern and Greenberg 2014). Yet there is no national dataset of the wide range of criminal justice fine and fee revenues, including court, probation, alternatives to incarceration, ordinance violations, and jail fees, among others (Meredith and Morse 2017). The budget documents of state, county, and municipal governments are a promising source of data for fine and fee inquiry as a way to examine the incentives underpinning the fines and fees system. 1 Reviewing the budgets of counties and municipalities is one way to accomplish the goal of understanding the degree to which local governments benefit from collections.
Florida and New York as Case Studies
This paper aims to introduce a methodology for using budgets as a primary data source for analyzing the revenue implications of criminal justice fines and fees collections. These documents are typically publicly available and can often provide a wealth of data about the scope of fines and fees revenue including types of fines and fees revenues, revenue over time, and in some cases additional details such as the statutory authority permitting the fine or fee. An analysis of the agencies and dedicated funds that benefit from fine and fee revenue also permits an examination of the incentive structures that maintain the system of sanctions. The data presented here are preliminary findings of a larger study, to be completed in 2021. The full study will examine the revenue implications of fines and fees in five states: Florida, New Mexico, New York, Virginia, and Washington. This preliminary examination of budget documents as a potential source of fine and fee data is intended to provide initial results from the larger study. In addition, this paper will provide methodical guidance to inform future studies of fines and fees.
This paper uses a sample of county and municipal budget documents in Florida and New York to examine how these documents can uncover how much revenue local governments receive from economic sanctions and how these collections compare to the size of the local budget. New York and Florida are two states where fines and fees have increased in recent years and where there has been increased scrutiny on the use of fines and fees in the justice system. In 2019, New York City became the first major city to eliminate fees on telephone calls from the city’s jails (Johnson 2019). In the 2020 legislative sessions in both states, advocates pushed forward bills to end the use of license suspensions for nonpayment of fines and fees (Driven by Justice Coalition 2019; Fines & Fees Justice Center 2019). The two states also represent two different models of local governance and court systems that provide an interesting contrast. Florida has a more centralized court system, in which county courts in the 67 counties hear misdemeanor cases and traffic offenses and civil cases with smaller monetary amounts. Felony cases and larger civil cases are heard in the 20 circuit courts. In contrast, New York’s court system is more fragmented. The state has more than 1,300 town and village courts, 61 city courts and several district courts that each handle municipal and misdemeanor cases, as well as preliminary proceedings for felony cases. County courts in the 62 counties handle felony cases. Table 1 provides key statistics in the two states.
Key Jurisdictional and Economic Metrics in Florida and New York. a

Data from U.S. Census Bureau.
Methods and Limitations
Fines and fees are collected by a range of government entities. County jails collect fees from people in jail, courts collect conviction fines and fees, and city police departments collect fines for ordinance violations. To understand the full range of revenue implications from fines and fees at the local government level, and because the two states have very different court structures, the authors collected both county and municipal budget data.
The authors collected data from each county and a sample of municipal governments in both Florida and New York. Florida has 67 counties and just over 400 incorporated places, which include cities, towns, and villages. 2 New York has 57 counties plus the five counties comprising New York City, 61 cities, more than 900 towns and more than 500 villages. 3
Because previous research has identified heavy reliance on fines and fees as primarily an issue found in small towns, the authors took a randomized sample of small and large municipalities in each state (Maciag). The cities, towns, and villages of Florida were split into two strata of the 355 town, cities, and villages below population of 50,000 and 58 above populations of 50,000. The Census Bureau uses 50,000 as the lower bound to define urbanized areas (U.S. Bureau of the Census, N.d). A similar process was used on the cities and towns of New York which has 1,517 municipalities below 50,000 populations and 33 above. The authors randomly sampled 10 places from each stratum using a random number generator, for a total of 40 sampled municipal governments. 4
The primary data source for each jurisdiction is the most recent publicly available county or municipal budget, as of early 2020. These documents are commonly available on the website for the budget division of the government. In most local governments, the 2020 adopted budget was the most recently available and 2018 was the latest year for actual revenue collections in the 2020 budget. Unlike adopted or budgeted revenue amounts, the actual figures represent amounts already received by local governments. From the budgets, the authors collected data on revenue derived from criminal justice fines, fees, surcharges, tickets, or user costs, including fines for traffic or parking offenses. Fines and fees revenues from civil court proceedings, filing fees, and copying fees, as well as other costs collected by court clerks, such as driver’s license fees were beyond the scope of this analysis and were excluded. To compare fine and fee collections to the overall size of the jurisdiction budget and to the jurisdiction size, the authors used total jurisdiction expenditure data and population data from the Florida Office of Economic & Demographic Research and the Office of the New York State Comptroller.
Where the budget documents are searchable, data are gathered using keywords. The list of keywords included fine, fee, surcharge, court cost, commissary, probation, monitoring, traffic, violation, red light, restitution, bail, and forfeit. Budget lines that contain one of these keywords but are not criminal justice related, such as library fines, are excluded. Where it is unclear if the revenue is criminal justice related, such as “sheriff’s fees,” further research of the budgets, court websites, and conversations with county budgets officers provided further insights.
To standardize the analysis and more deeply understand the types of fines and fees being collected, the authors assigned all revenue to five categories of fine and fees: (1) Court Fines and Fees, representing all court costs and charges, including municipal ordinance fines; (2) Incarceration Fines and Fees, including all fees and charges from within a jail, such as commissary, telephone, booking, and daily fees; (3) Traffic, including traffic fines, fees, and court fines and fees related to moving violations and DWI-specific costs; (4) Community Corrections and Program User Fees, a category including all charges for services for probation, alternatives to incarceration, monitoring, and surcharges for restitution; and (5) Other fines, fees, and forfeitures, including all noncourt financial obligations such as revenues from asset forfeitures.
While these documents can provide data on fines and fees that is unavailable elsewhere, there are some limitations to this method. Because budget data may be written with abbreviations or generic terms, for example, “clerk’s fees,” it is helpful to have some familiarity with the state or local justice system to know what data to regard as justice system fines and fees. The number of sampled municipalities in each state is small relative to the total number in each state. While data on fines and fees per capita and fines and fees as a share of expenditures are presented here, the samples should not be considered representative of the state as a whole. No prior research has examined budget documents for fines and fees data on a state-by-state basis, so it is unknown if budget documents in these two states are representative of those in other states. Yet using these two states as case studies provides an initial methodology that can later be adapted for budget documents from other states. This paper focuses on the local government implications of fine and fee revenue; forthcoming research will examine the revenue implications to the state government.
Findings
Most county and municipal budgets provide at least some detailed data on a range of fines and fees from different parts of the justice system. Some budgets report the amounts received from specific services (“probation fees,” “alternative to incarceration fees”) while other report fines and fees collected for a specific criminal charge (“ordinance violation fines,” “sex offender fines”). Some budgets provide the relevant statute number allowing for further understanding of the legal justification for the collections. Budgets do not typically provide data on the number of people who have paid justice fines and fees, but these calculations are possible in more limited ways. For example, if a statute provides that a certain fee is always assessed at a flat rate, such as Florida’s $65 court cost, it is possible to calculate the number of people who have paid that fee based on that fee’s revenue. These documents are readily publicly available for larger jurisdictions; less commonly so for small jurisdictions.
Collecting data using this method can be labor-intensive, requiring examination of individual budget documents which differ in reporting and structure. Budget documents are also highly unique to the jurisdiction and do not lend themselves toward expedient data scraping. While some jurisdictions provide highly disaggregated fine and fee data, with revenue lines ascribed to specific statutes, courts, or charges, others merely provide aggregate figures with little distinguishing detail. Another challenge is data transparency and clarity. If certain revenue is sent into the jurisdiction’s general fund revenue, there may be little indication of this transfer within the budget document. Regardless of these challenges, in a system where data on fines and fees is minimal, the use of budgets is a promising strategy to understand the scope and scale of fines and fees at a greater depth than previously possible with national databases. The rest of this paper will explore the data that can be gleaned in Florida and New York using this method.
Florida
In Florida, some fines and fees collected on misdemeanor, traffic, and felony cases go to the county government, while the rest is sent to the state general fund and state trust funds. Each county in the state operates a jail that can charge fees on people held in the facility. Cities and towns in Florida receive revenue from fines on city code violations, traffic, parking, and red light camera fines as well as some revenue that is passed down through the county courts.
Types of monetary sanctions in Florida
The authors categorize fine and fee revenue into five groupings:
Court Fines and Fees: County budgets report revenue from a number of flat fees such as a $3 fee on every conviction to operate youth diversion programs, a $2 fee to run law enforcement education programs, a fee of $50 for felonies and $20 for all other offenses to fund crime prevention programs, and a $65 fee on all convictions to fund court innovation programs and legal aid. Municipal budgets report revenue from ordinance violation fines, which may be fines for animal control violations, consuming alcohol in a public area, or soliciting, among others. 5
Incarceration Fines and Fees: State law allows county jails to charge an admissions or “uniform” fee for every person who enters the jails as well as a daily “subsistence” cost, typically a few dollars per day. 6 Many of the county budgets report this revenue. Counties also collect revenue from telephone fees, commissary, and work release fees, among others.
Traffic: Counties report fines and fees in criminal traffic cases, including a $12.50 surcharge to support county communications programs and fees to fund driver safety programs. Municipalities report revenue from parking tickets.
Community Corrections and Program User Fees: People are charged fees either while they await trial or after their conviction to pay for services that monitor them. Counties report revenue from probation fees, drug court fees, GPS and monitoring fees, community services fees, and drug and alcohol testing fees, among others.
Other: Some counties report revenue from asset forfeiture.
County fine and fee revenue
Revenue collections are a modest $8 per capita in the typical county, though in three counties (Glades, Martin, and Wakulla) collections exceed $25 per person (see Figure 1). Of course, not everyone pays fines and fees; for those who do pay, the total cost may be quite large. Fines and fees make up only a modest share of total county budgets, a median of 0.5 percent, indicating that it may be relatively easy to replace or simply eliminate these revenues.

Fine and fee revenue per capita and as a share of total expenditures, Florida counties.
Yet, these revenues do matter to individual agencies. In Leon County, fines and fees, including probation fees, pretrial fees, and drug and alcohol testing fees, fund nearly one-third of the county probation services. Fines on felony and misdemeanor offenses also fully fund a drug intervention funding stream and court innovation programs and more than half of funding for the teen court, a juvenile diversion program. Other fines and fees are transferred to the General Fund and the Fine and Forfeitures Fund, where they support general government operations and criminal justice costs but make up only a small share of these funds.
Municipal fine and fee revenue
In the median sampled Florida municipality, fines and fees revenue were $15 per capita, and made up 0.7 percent of the municipal budget (see Figure 2). Common revenues collected at the municipal level are city code violation fines, traffic and parking fines, red light camera fines, and court fines.

Fine and fee revenue per capita and as a share of total expenditures, sampled Florida municipalities.
New York
Each county in New York has a county court which hears felony cases. New York has more than 1,300 city, town, and village courts which handle petty offense cases (traffic infractions and local violations) as well as misdemeanors and collect fines and fees.
Types of monetary sanctions in New York
The same categories are used in New York as in Florida, though the types of fines and fees collected differ. These include the following:
Court Fines and Fees: Nearly all counties report revenue from “fines and forfeited bail,” or something similar. This would include conviction fines as well as up to a three percent fee on any bail payment. Cities and towns collect fine revenue from the enforcement of local ordinances. These can include property maintenance issues, litter, noise complaints, and parking complaints. 7
Incarceration Fines and Fees: Unlike Florida jails, New York jails do not typically charge a booking fee or daily fee. Instead, counties report revenue in their jails from phone calls, commissary, and other costs.
Traffic: Town, city, and village courts collect revenue from traffic and parking tickets. County governments collect revenue from DWI cases and probation tied to DWI.
Community Corrections and Program User Fees: This category includes GPS, monitoring, ignition tools, lab tests, investigations, and probation and parole fees. Restitution payments are typically charged up to a ten percent surcharge, collected by the county probation department.
Other: This category mostly includes asset forfeiture revenue.
County fine and fee revenue
Revenue collections are a modest $4 per capita in the typical county, though in Nassau and Suffolk Counties (the counties of Long Island) and New York City collections exceed $25 per person (see Figure 3). As in Florida, fines and fees also make up only a modest share of total county budgets. In the median county, fine and fee revenue is only 0.2 percent.

Fine and fee revenue per capita and as a share of total expenditures, New York counties.
These revenues can be a significant source of funding to individual county agencies, however. In Steuben County, fine and fee revenue funds 2 percent of the jail budget and 15 percent of the budget for alternatives to incarceration. Nearly one-fifth of the probation department is funded through fines and fees. Fines on DWI cases nearly fully fund the county’s STOP DWI program.
Municipal fine and fee revenue
In the median sampled New York municipality, fines and fee revenue were $13 per capita, and made up 1.1 percent of the municipal budget (see Figure 4). Common revenues collected at the municipal level are city code violation fines, traffic and parking fines, red light camera fines, and court fines.
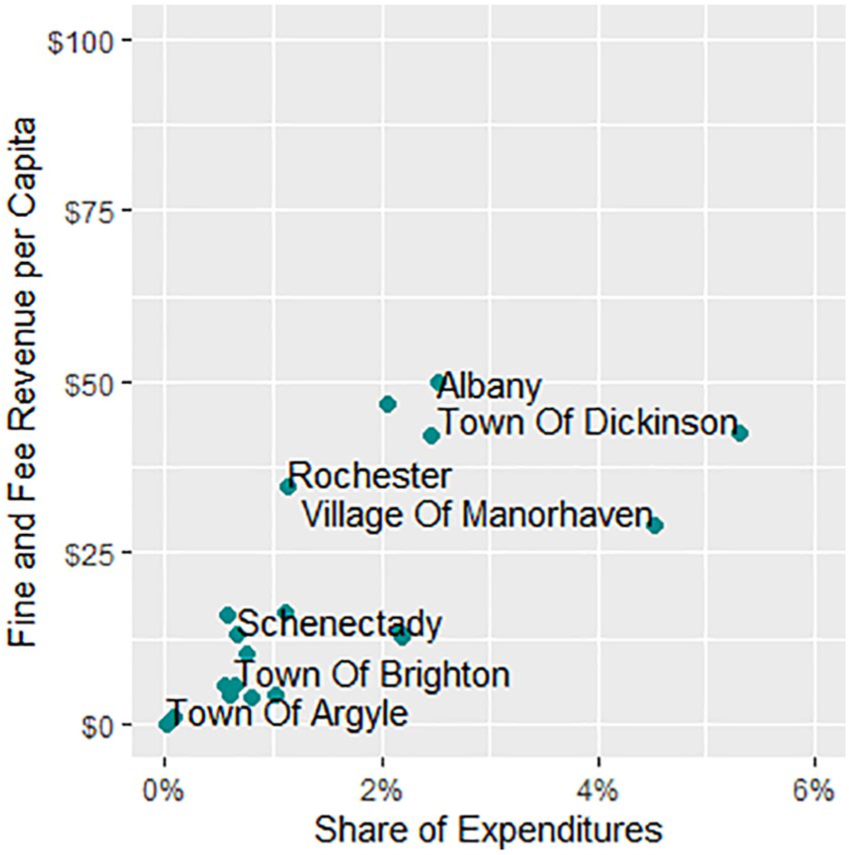
Fine and fee revenue per capita and as a share of total expenditures, sampled New York municipalities.
Discussion
County and municipal budget documents offer a promising future avenue for research on justice fines and fees. As evidenced by the authors’ application of this methodology in Florida and New York, there is much to be gleaned from using budget documents to examine how governments generate revenue using fines and fees.
First, these documents are generally available to the public without the need for issuing a formal public records request. In both Florida and New York, all county budgets were available online. In both states, all randomly sampled municipalities with populations above 50,000 had their budgets available online and many of the counties with populations below 50,000 did as well.
Next, these documents offer credible information on how much money specific jurisdictions and agencies are actually receiving and keeping in fine and fee revenues. Compare this with court revenue data, for example, which only account for the money that courts initially collect and do not track the flow of this revenue to its ultimate end, at the state, county, or municipal levels. This kind of detailed, disaggregated revenue information can be used to understand how much government entities rely on fine and fee revenue compared with other revenue sources, which can expose the incentive structures in place. For example, monthly probation fees collected from people held on probation are a major source of revenue to county probation departments in New York. In Florida, county jails benefit from the collection of jail admissions fees and daily “subsistence” fees from everyone who enters the jails. Examining the flow of revenue (including the entity that is responsible for collection and the entity that ultimately receives the revenue) is crucial to understanding the full range of stakeholders who rely on fines and fees. These details are crucial to a more holistic understanding of fines and fees practices at the local level, and cannot be gleaned from Census or court databases.
Of course, this method of collecting and analyzing data is not without its limitations. For example, budget data do not convey how much was assessed, or charged, in fines and fees, only the amount that was ultimately collected. The amount of outstanding assessments can provide information on the scale of collateral consequences faced by people for nonpayment. Budget data also lack case-specific data that might be used to assess patterns with respect to race.
In Florida and New York counties and sampled municipalities, fines and fees proved to be a common but modest source of revenue, especially compared with other county revenue sources, typically one percent or less of the total budget. Thus, reforms to reduce or eliminate justice fines and fees should have minimal impact on overall revenues. One challenge, however, is that these collections can represent a substantial share of the budgets of specific agencies, for example, probation departments that rely heavily on probation fees to fund their operations. This structure creates incentives for the recipients of fine and fee revenue to oppose changes to their imposition.
The results from Florida and New York are not necessarily generalizable to other states and localities, but this work provides a starting point for this line of inquiry into the budget implications of criminal justice fines and fees for local governments. In states with highly centralized court systems where much of the fine and fee revenue is remitted to the state government, the appropriate analysis may begin with an examination of the state, rather than local government, budget. This methodology provides a model for similar research in other states and localities, where the authors anticipate findings may provide insight into possible pathways to reform.
Footnotes
Declaration of Conflicting Interests
The author(s) declared no potential conflicts of interest with respect to the research, authorship, and/or publication of this article.
Funding
The author(s) disclosed receipt of the following financial support for the research, authorship, and/or publication of this article: Research supported by Arnold Ventures and Vera Institute of Justice. Views expressed in this article are those of the authors.
