
Abstract
Throughout parts of the Western world, populist nationalism has gained increasing momentum. Despite cross-national differences in populist leaders and parties, one common feature stands out: xenophobic prejudice. This paper examines in the U.S. context, first, a common assumption linking outgroup threat perception with support for restrictive immigration. Second, more importantly, this paper tests how and the extent to which collective (state-level) social capital independently influences the American citizens’ anti-immigrant attitudes, as well as whether it moderates the association between outgroup threat and preference for restricting immigration. Multilevel models based on a nationally representative sample show that people who hold higher perceptions of outgroup threat are indeed more likely to oppose immigration. By contrast, living in a state endowed with more social capital is associated with pro-immigration attitudes. Last, the association between security threat and anti-immigrant preference is weaker (stronger) in states with higher (lower) measures of social capital.
Introduction
The contemporary world may be witnessing a “populist zeitgeist” (Mudde 2004). In many countries, especially capitalist democracies in the West, there have been increasing right-wing political movements and growing popular support for them (Norris and Inglehart 2019). Perhaps no episode better epitomizes this trend than the unexpected political victory of Donald Trump in the United States, signaling populism’s emergence as a new force to be reckoned with (Dennison and Geddes 2019; Gest 2016). There are numerous, at times incongruent, characteristics and definitions put forth in describing populism. But there is an undeniable common denominator that ties most, if not all, of populist phenomena: anti-immigrant xenophobia. Indeed, Trump’s trademark slogan (Make America Great Again) was deeply rooted in his parochial vision of “who” Americans are and, as part of that vision, his commitment to keeping unauthorized foreigners from entering the American soil.
Trump’s anti-immigration stance is well known, as attested by, above all, his call to erect a physical wall along the U.S.-Mexico border, resulting in the longest government shutdown in the U.S. history. His open verbal attacks against undocumented immigrants have also caused an uproar (or a sensation, depending on one’s perspective), both domestically and internationally. At the time, the American public was clearly split along immigration-related issues (Pew Research Center 2019), reflecting a bipartisan divide exacerbated by the Trump administration. The perception of immigrants as posing an economic challenge to domestic workers and a security problem for the entire nation (“they’re bringing drugs, they’re bringing crime” as Trump infamously put it) was shared by many of his supporters and, to lesser extent, non-supporters alike. And this perception of outgroup threat was directly linked with Americans’ preferences on immigration, more specifically, the level of inflow. Studies have shown that, in fact, outgroup threat is one of the most powerful and consistent predictors of negative attitudes toward immigration not only in the United States but in other host societies as well (Blumer 1958; Bobo 1983; Hjerm 2007; McLaren 2003; Meseguer and Kemmerling 2018; Pottie-Sherman and Wilkes 2017; Quillian 1995; Schneider 2008).
The purpose of the present study is to offer evidence using nationally representative data on determinants of the American public opinion on immigration policy. In the literature, findings on anti-immigrant (xenophobic) preferences and sentiments largely fall into two groups. On the one hand, they are shown to be driven mainly by individual characteristics (Fussell 2014). An emerging consensus is that cultural, rather than economic, factors drive the extent to which natives welcome, or not, the people of foreign origins (for a systematic review see, Hainmueller and Hopkins 2014). On the other hand, a literature exists largely emphasizing contextual factors, particularly how immigrant influx at the national or subnational level, that is “migrant stock,” affects natives’ reactions (Gravelle 2019; Karreth, Singh, and Stojek 2015; Laurence and Kim 2021; Newman and Velez 2014; van Heerden and Ruedin 2019).
Against this backdrop, this study builds on and extends the previous scholarship by incorporating a novel factor: the role of collective social capital. For reasons largely due to data unavailability, there is a paucity of research on the connection between contextual or collective social capital and attitudes toward immigrants/immigration at the individual level. Based on a comprehensive Social Capital Index (SCI), the present study first explores how, if at all, the level of collective social capital shapes individual residents’ immigration preferences. Second, it examines whether the amount of social capital measured at the contextual level modifies (strengthens or weakens) the association between Americans’ preexisting perceptions of the foreign-born population and their preferred levels of immigration. To the author’s knowledge, this research is the first to utilize a contextual SCI in explaining the individual-level variation in immigration-related attitudes using a nationally representative U.S. sample.
Determinants of Anti-immigrant Attitudes
Findings Based on Economic Predictors
There is a large body of scholarship on the factors underlying natives’ attitudes toward immigrants and immigration. The bulk of prior studies incorporates individual- and contextual-level sets of predictors. Specifically, the former set consists of socioeconomic and demographic measures (e.g., education, income, employment status, political affiliation/ideology), while the latter typically includes aggregate ones such as gross domestic product (GDP), Gini index, unemployment rate, migrant stock, and change in the size of immigration population. Within this framework, scholars operationalize the predictors of public opinion on immigration in largely economic and cultural terms (Hainmueller and Hopkins 2014). With respect to economic factors, low-skilled and/or low-income individuals, or those with relatively lower socioeconomic status, are in general more antagonistic toward immigrant workers, as they may be in direct competition with them over jobs and fiscal expenditures (Ceobanu and Escandell 2010; Rustenbach 2010). This is consistent with the labor market competition theory, according to which natives’ preference over specific groups of immigrants, not just general attitudes, is related to their respective labor market positions (Jeannet 2018; Markaki and Longhi 2013).
More recent studies point out that income and employment status in and of themselves do not shape immigration-related views. Rather, workers at all skill levels support immigration of high-skilled immigrants over that of low-skilled ones, suggesting a possibility of sociotropic (other-oriented), as opposed to egotropic (self-oriented), economic concerns (Hainmueller and Hopkins 2014). The link between anti-immigration attitudes and immigrants’ perceived effects on overall economic conditions has been mostly illuminated by theories concerning intergroup relations. Existing views focus either on group threat or conflict (Berg 2015; Ceobanu and Escandell 2010; Fussell 2014) or integrated threat (Ramsay and Pang 2017). The argument is that natives form prejudice against the outgroup due to threat from actual and/or perceived competition over scarce real and/or symbolic resources. Increase in the number of immigrants is frequently used to gauge realistic and symbolic threat (cf. Putnam 2007), though it remains debatable whether the influx leads to negative attitude through the threat mechanism or to positive attitude through intergroup contact (see Kaufmann and Goodwin 2018).
Relatedly, the relationship between anti-immigrant views and contextual-level factors (high unemployment rate, inequality, lower GDP, etc.) can be explained as a function of increased competition and scarcity of available resources (Ceobanu and Escandell 2010; Fussell 2014; Zamora-Kapoor, Kovincic, and Causey 2013). Economic inequality is one such example. First, inequality can heighten perceptions of competition and sense of insecurity, causing natives to become more hostile toward immigrants (Barcelo 2016). Increase in inequality can also make income and class differences more salient and, as a result, elevate the sense of threat among all classes, not just the relatively deprived or disadvantaged (Jay et al. 2019). In addition, inequality lowers general trust and social cohesion (Delhey and Dragolov 2014; Jay et al. 2019), which are intricately associated with tolerance and positive orientation toward outsiders (Ekici and Yucel 2015; Herreros and Criado 2009).
Findings Based on Cultural Predictors
The effects of cultural variables on anti-immigrant attitudes can similarly be explained in terms of intergroup conflict and symbolic threat: the more people sense and believe that their values, identities, and ways of life are threatened by immigrants, the more likely they are to perceive them negatively and to show in-group bias (Bloom, Arikan, and Lahav 2015; Bobo 1983; Ceobanu and Escandell 2010; Hjerm 2007; Quillian 1995; Sides and Citrin 2007). Much of the evidence is motivated by social identity theory, which states that people tend to form groups based on shared sociodemographic characteristics (ethnicity, religion, and political orientation) and that outgroup distinction and prejudice emerge from such identification (Fussell 2014; Weber 2015). In this line of research, scholars find variables such as having immigrant parents, belonging to minority ethnic group, and speaking non-majority first language to be significantly correlated with pro-immigrant tendencies and preferences (Markaki and Longhi 2013; Wilkes, Guppy, and Farris 2008). Political and ideological orientations are also important factors that constitute natives’ identities and values. Perhaps the most obvious is partisan support, for example voting for far-right parties, which strongly predicts xenophobic attitudes and related policy support (Hainmueller and Hopkins 2014).
Other cultural explanations emphasize variables measuring political interest, exposure to the media, and education. While general interest in politics may prevent people from jumping into a quick conclusion, such as blaming immigrants (Barcelo 2016; Rustenbach 2010), it can lead to stronger alignment of attitude and partisan ideology and, therefore, more unfavorable attitudes among conservatives (Sides and Citrin 2007). On the other hand, exposure to media itself can increase anti-immigrant attitudes as the issue of immigration receives negative treatment (Hooghe and de Vroome 2015). Last, but very importantly, education molds attitudes toward immigrants and immigration through direct and mediated mechanisms. Educational attainment is associated with not only political interest and cosmopolitan orientation but also labor market status, place of residence, and the like (Czaika and Di Lillo 2018; Maxwell 2019). Apart from such distal indirect effects, it also exerts direct liberalizing effects, leading to more open-mindedness toward immigrants as well as outgroup members more generally (Cavaille and Marshall 2019).
Concerning individual-level identity and ideological orientation, national pride is a critical component of the explanatory mechanism. People with greater national attachments are likely to develop strong, exclusive sense of “us” based on nationality, and display feelings of superiority and discrimination against the outgroup members (Barcelo 2016). Consequently, immigration can be construed as a symbolic threat against the cherished status quo (Luksyte and Avery 2010). Indeed, studies based on dichotomous national pride/identification measures have generally shown confirmatory results (Young, Loebach, and Korinek 2018). Other studies further divide national pride into civic and cultural/ethnic aspects. According to them, an ethnic sense of pride, which concerns the nation’s historical and cultural achievements, increases anti-immigrant attitude, while a civic sense of pride involving national institutions and social system is conversely related (Grigoryan and Ponizovskiy 2018; Miller and Ali 2014). It has also been shown that negative sentiments toward immigrants are related to such concepts as locus of control (Harell, Soroka, and Iyengar 2017), nostalgic deprivation (Gest, Reny, and Mayer 2019), social exclusion (Pellegrini et al. 2021), and social marginalization (Gidron and Hall 2020).
Study Aim
Previous discussion highlights a variety of economic and cultural determinants of anti-immigrant sentiments conceptualized across individual and contextual levels of analysis. At the same time, it reveals a relative lack of attention given to the role of social capital. In fact, how the concept relates to “the formation of attitudes towards immigrants remains unexplored” (Herreros and Criado 2009:339). More than a decade since this observation, our understanding remains limited. To the extent that research has been conducted, aside from few exceptions (e.g., Barcelo 2016; Citrin and Sides 2008), the measurement of social capital is confined to the individual level. That is, studies mostly emphasize how people with more social capital—such as higher interpersonal trust, larger network size, and greater voluntary organizational involvement—tend to be pro-immigrant (Ekici and Yucel 2015; Herreros and Criado 2009; Reeskens 2013; van der Linden et al. 2017).
As a result, we know relatively little about how social capital as a component of the broader environment impacts personal views and sentiments regarding issues related to immigration. The context in which individuals are embedded powerfully affects public opinion on whether more immigrants should be admitted, how they should be incorporated and treated, etc. According to a comprehensive analysis of multiple (five cross-sectional and two longitudinal) large-scale surveys, a contextual effect of positive intergroup contact on outgroup prejudice is shown to significantly exceed that of intergroup contact at the individual level (Christ et al. 2014; see also Maxwell 2019). In other words, net of personal experiences, context matters a great deal when it comes to how natives think and feel about the issue of immigration.
The present study thus shifts the analytic focus to how community-level social capital independently, as well as interactively, impacts individual members’ preferences with respect to immigration flows in the United States. Prior findings from contextual analysis typically highlight macro variables such as GDP, inequality index, unemployment rate, and immigrant population (Ceobanu and Escandell 2010; Kaufmann and Goodwin 2018). As a systematic review makes clear, “how visible a minority group is in a particular locality” has been the most frequently analyzed contextual variable (Ceobanu and Escandell 2010:322). While adjusting for this variable (the size of immigrant population), the current research adds to the literature by prioritizing the role of social capital and its multilevel interrelationships with other predictors. Specifically, it sheds light on the processes by which micro variables (e.g., individual threat perception) interact with macro variables (e.g., collective social capital) in shaping one of the most politically salient topics in contemporary American society and elsewhere: natives’ views on whether to relax or constrain the entry of immigrants. To that end, empirical investigation is informed by the following two queries.
Materials and Methods
Data
There are two data sources. First, to operationalize individual-level variables, including the outcome and the main predictors, “June 2018 Political Survey” conducted by the Pew Research Center is used, a unique dataset that is available at its open repository (https://www.people-press.org/dataset/september-2018-political-survey). The Center actively maintains eight broad areas of survey research, including “U.S. Politics and Policy” under which the Political Survey series falls. Its primary goal is to gauge trends in the American public opinion on a host of domestic and international issues. The June 2018 version was fielded between June 5 and June 12 among 2,002 American adults (18 years of age and older) living in the 50 states and the District of Columbia. Data were collected via phone interviews in English and Spanish. The (500 landline and 1,500 cell phone) combined sample is weighted using an iterative technique that matches gender, age, education, race, and region to parameters from the 2016 Census Bureau’s American Community Survey one-year estimates and population density to parameters from the Decennial Census. 1
Second, for the collective social capital measure, data are drawn from the Social Capital Project, or the “Geography of Social Capital in America” study, commissioned by the U.S. Congress (Joint Economic Committee). By benchmarking R. D. Putnam’s (2000) earlier work Bowling Alone as well as the Penn State Index of Social Capital, 2 this multiyear government-funded project has compiled an impressive array of administrative and survey data to construct a new aggregate measure of social capital across the U.S. states, which has been publicly available since 2018. The SCI consists of multiple dimensions: Family Unity (e.g., share of births in past year to women who were unmarried), Family Interaction (e.g., share who report someone in the family read to child every day in past week), Social Support (e.g., share saying they get the emotional support they need), Community Health (e.g., share of adults who report having volunteered for a group in the past year), Institutional Health (e.g., average of votes in the presidential election per citizen age 18 years and over), Collective Efficacy (violent crimes per 100,000), and Philanthropic Health (share of adults who gave more than $25 in the past year to “charitable or religious organizations”).
The seven subindices, in turn, are made up of 50 indicators (collected between 2006 and 2016, primarily 2013 forward) based on multiple sources including, for example, American Community Survey, 2012 to 2016 (five-year estimates); National Survey of Children’s Health, 2016; Behavioral Risk Factor Surveillance System; Civic Engagement Supplement to the 2008 Current Population Survey; Volunteer Supplement to the 2015 Current Population Survey; Election Administration and Voting Survey; FBI’s Uniform Crime Reporting Statistics, 2008 to 2014; and Census Bureau data (e-mail-back response rates for the 2010 census). For the analysis, a raw data file containing state-by-state index scores was retrieved from the Web page (https://www.jec.senate.gov/public/index.cfm/republicans/2018/4/the-geography-of-social-capital-in-america) maintained by the Joint Economic Committee. Technical information on the index construction is provided in the Appendix of the Social Capital Project Report (Joint Economic Committee, U.S. Congress 2018).
Measures
The outcome variable is named Limit immigration, which is based on the following survey item from the Pew Research Center’s Political Survey: “Should LEGAL immigration into the United States be kept at its present level, increased, or decreased?” The original answers coded on a 3-point scale (1 = Kept at present level; 2 = Increased: 3 = Decreased) are dichotomized due to skewed data distribution such that the choice “Decreased” is coded 1 and 0 otherwise. About one in four Americans prefers to restrict or limit immigrant inflows.
The main predictors are operationalized at individual (immigrant threat) and state (collective social capital) units of analysis. At the state level, the variable Collective social capital is measured using the SCI, as described above, with a higher value indicating greater stock. Scores for its seven subindices were first standardized to put them on a common scale and then weights were created for each by running principal components analysis. Each state’s SCI score was then computed by taking the weighted sum of the scores and then standardizing it. SCI ranges in value from −2.2 to 2.1. A score of 1, for example, means the state lies one standard deviation above the mean index score across all states (for detail, see Joint Economic Committee, U.S. Congress 2018). 3
At the individual level, two variables capture natives’ sense of immigrant threat. Economic concern is operationalized using the statement that says, “Undocumented immigrants mostly fill jobs that American citizens like to have” (coded 1) “[OR] Undocumented immigrants mostly fill jobs American citizens don’t want” (coded 0; “Neither/Both equally” also coded 0). A little less than one in five Americans gave an affirmative answer. Security concern is the second variable based on the following statement: “Undocumented immigrants living in the United States are more likely than American citizens to commit serious crimes” (coded 1) “[OR] Undocumented immigrants living in the United States are NO more likely than American citizens to commit serious crimes” (coded 0; “Neither/Both equally” also coded 0). About a quarter of the survey participants saw immigrants as being more prone to commit crime.
Confounders
Models adjust for socioeconomic, demographic, and others controls including: race (non-Hispanic White; ref.: all minorities excluding immigrants), gender (ref.: female), age (in years), education (coded on an 8-point scale, e.g., 1 = less than high school, 2 = high school incomplete, 5 = two-year associate degree, 6 = Bachelor’s degree, 8 = post-graduate or professional degree), affiliation with the Republican party (ref.: Democrats and Independents), and household income (coded on a 9-point scale, e.g., 1 = less than $10,000, 2 = $10,000 to under $20,000, 7 = $75,000 to under $100,000, 8 = $100,000 to under $150,000, 9 = $150,000 or more). Also added are dummy indicators for residential size (Most dense and Dense; Ref.: all others), that is the population density quintiles based on FIPS (Federal Information Processing Standards) codes from self-reported zip codes (e.g., 5 = “most dense,” 4 = “dense”). 4 In a separate analysis, this variable was used based on its original ordinal coding. Results (not shown) were consistent with those presented below. Finally, for a more conservative test, Intergroup contact is included, which is known to be highly correlated with how natives perceive immigrants. 5 It is operationalized using the question that asks: “How often do you personally come in contact with immigrants who speak little or no English?” (1 = often, 2 = sometimes, 3 = rarely, 4 = never; reverse-coded).
At the state level, the following controls are adjusted for: Border state (coded 1 for Arizona, California, New Mexico, and Texas; 0 otherwise) since at the time of the survey the Trump administration galvanized Americans with the proposed plan to build a physical wall along the U.S.-Mexico border; GDP (Current-Dollar Gross Domestic Product in 2017 available from the U.S. Bureau of Economic Analysis); and Unemployment rate (taken from the U.S. Bureau of Labor Statistics at https://www.bls.gov/web/laus/laumstrk.htm) as standard macroeconomic indicators
6
; and Migrant stock (percentage of the foreign-born population in 2017), a conventional measure used in prior research as a proxy for immigration-induced threat, as well as Immigrant change that gauges the proportional growth/decline in the migrant stock during a 10-year period leading up to 2017 (both of which are available at the Migration Policy Institute Data Hub). This dynamic measure of immigrant population is used, in addition to Migrant stock, to conduct a sensitivity analysis. Table 1 presents descriptive statistics for the above set of individual and contextual variables operationalized to answer
Summary of Descriptive Statistics.
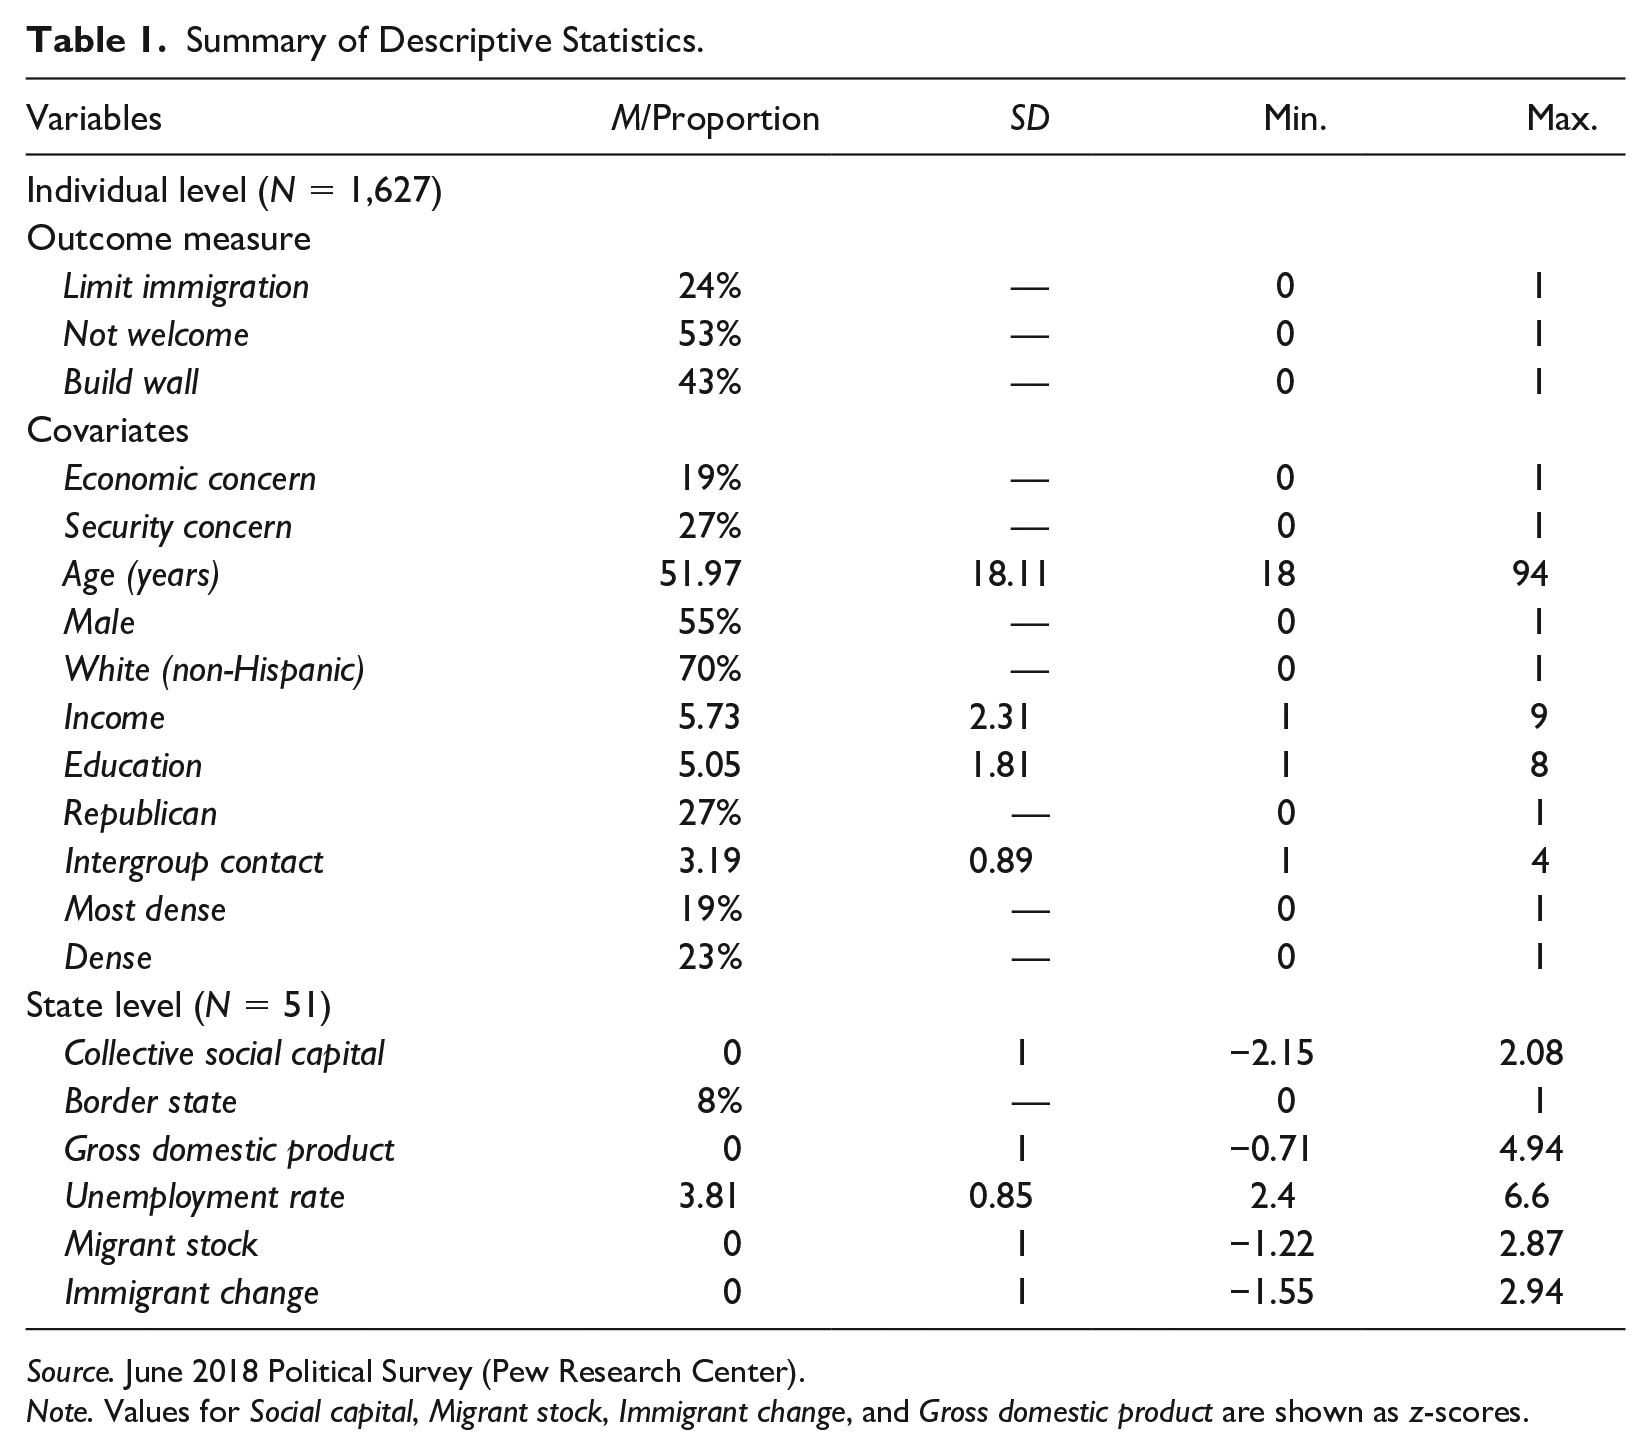
Source. June 2018 Political Survey (Pew Research Center).
Note. Values for Social capital, Migrant stock, Immigrant change, and Gross domestic product are shown as z-scores.
Analytic Approach
To address the research questions stated above, two-level mixed effects models (with individuals at level 1 and subnational regions at level 2) are fitted. Since the outcome variable, Limit immigration, is dichotomous, estimating multilevel logit models is the standard procedure. However, log-odds ratios cannot be directly compared across models with different explanatory variables in a sample (Mood 2010). Therefore, consistent with previous studies (e.g., Abascal 2020), hierarchical linear probability models (HLPMs) with robust standard errors are estimated and presented below. To test “contextual effects” of collective social capital net of compositional effects, as described in
Using the specialist statistical software HLM version 8 (Raudenbush, Bryk, and Congdon 2019), multilevel analysis is conducted based on the following two-level models:
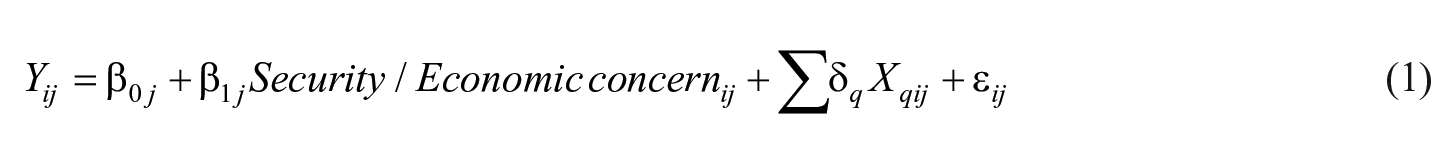
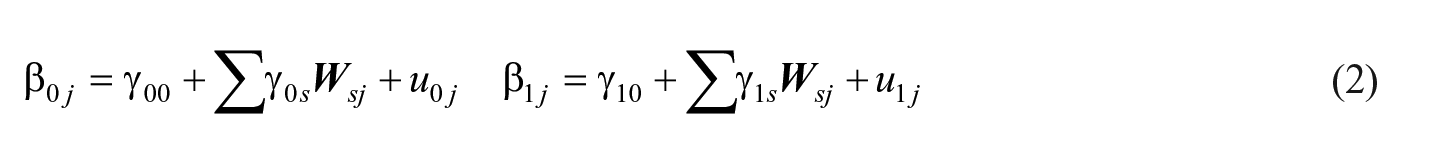
where
Results
Descriptive Analysis
In Appendix Table A1, average values for the contextual variables across subnational regions (50 states plus the District of Columbia) are shown according to the descending order of the SCI score. Figure 1 provides a visual map of the distribution. Twelve states in the lightest shade, that is with the highest levels of social capital, are located across two continuous blocs: the “Mid-Continent North” consisting of Utah, Wyoming, Colorado, two Dakotas, Nebraska, Iowa, Minnesota, and Wisconsin. The other contains New England states of Maine, New Hampshire, and Vermont. Utah ranks number one on the SCI, followed by Minnesota and Wisconsin. At the other end, among 11 states with the lowest levels of social capital (indicated by the darkest shade), 10 (excluding New York) make up a single bloc represented by Nevada, Arizona, New Mexico, and others in the “Far South” including Louisiana, Georgia, and Florida. Louisiana has the lowest social capital score, followed by Nevada, Arizona, and New Mexico. As shown, there is a wide geographic dispersion of social capital (see Joint Economic Committee, U.S. Congress 2018). Figure 2 displays a negative relationship between the SCI scores and state averages for Limit immigration. That is, residents of a state with more collective social capital tend to be less (more) supportive of limiting (increasing) immigration.

Social capital across the U.S. states and District of Columbia.
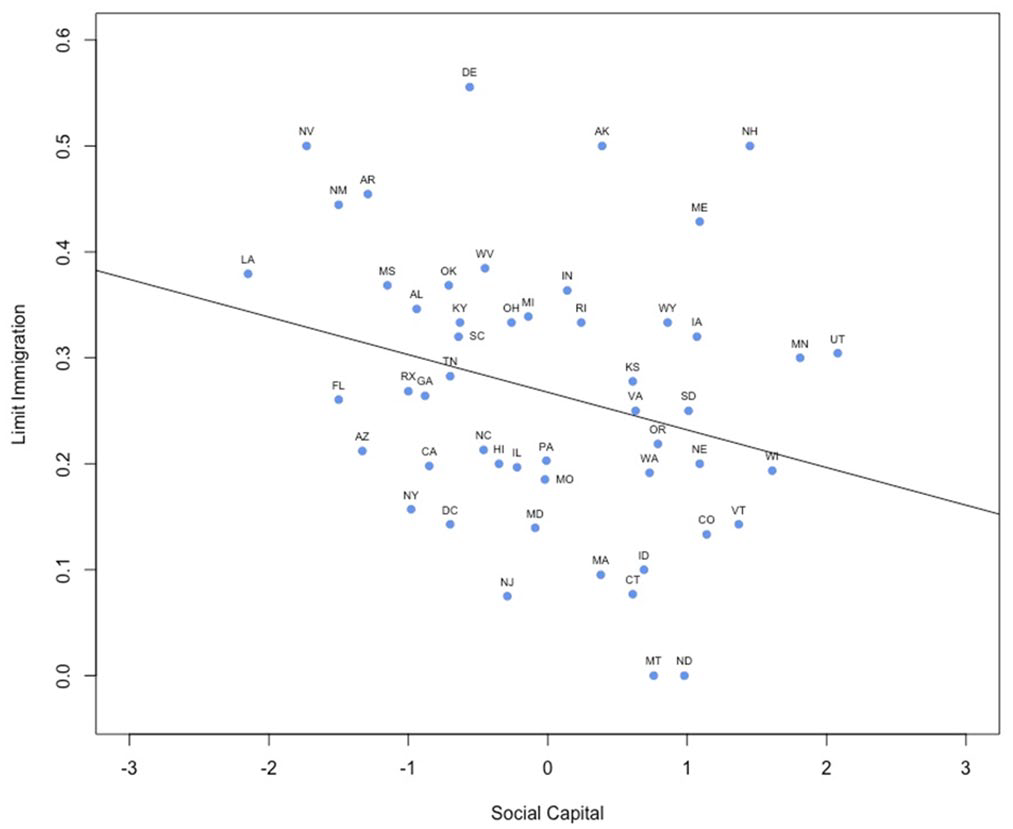
State-level relationship between social capital and anti-immigration attitude.
The scatterplot in Figure 2 provides suggestive evidence, but only at the aggregate level. Making inference about individuals at the microlevel based on this descriptive macrolevel relationship would be tantamount to committing ecological fallacy. A key question for this study is whether, net of compositional effects or individual-level covariates, residency in a state endowed with greater stock of social capital is independently associated with a more liberal attitude toward immigration. In addition, does social capital act as a buffer against outgroup threat perception—economic and security concerns—in modifying (i.e., dampening) its impact on preference for restrictive immigration? To properly address these issues, the statistical output from multilevel modeling is examined below, as summarized in Tables 2 and 3.
Results from Multilevel Analysis Predicting Anti-immigration Preference: Compositional and Contextual Effects.
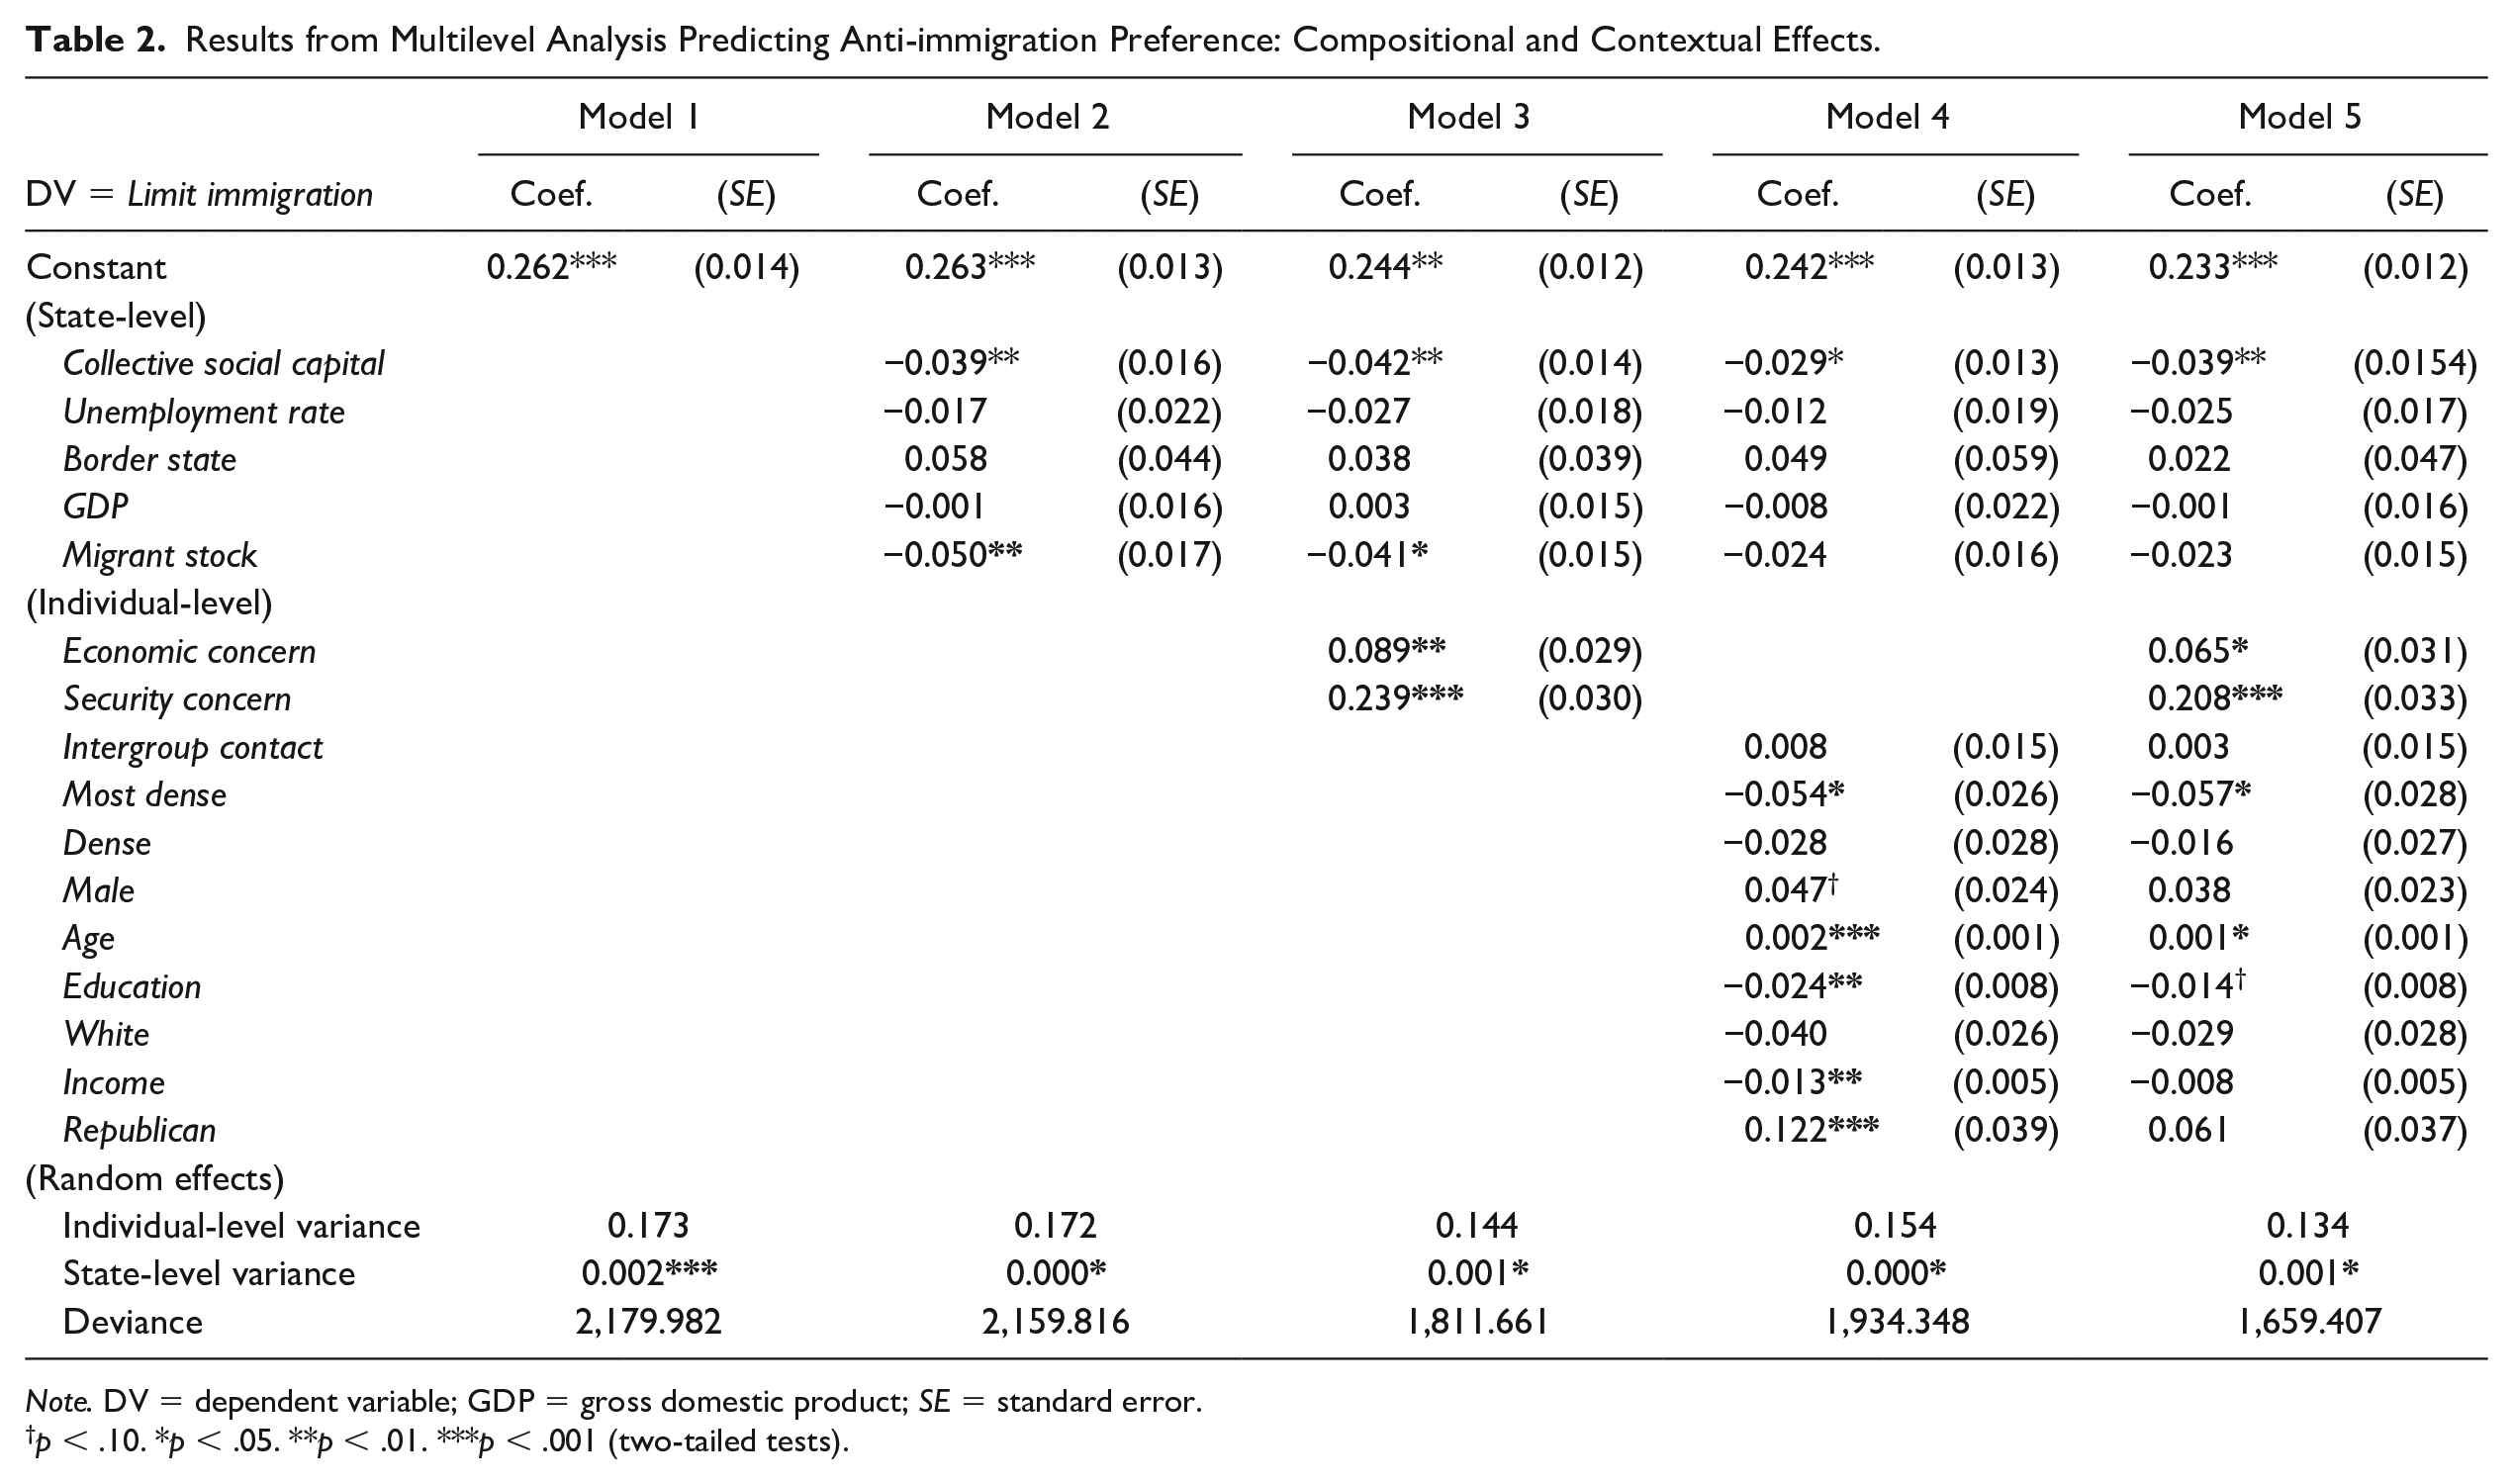
Note. DV = dependent variable; GDP = gross domestic product; SE = standard error.
p < .10. *p < .05. **p < .01. ***p < .001 (two-tailed tests).
Results from Estimating Cross-level Interactions in Predicting Anti-immigration Preference.
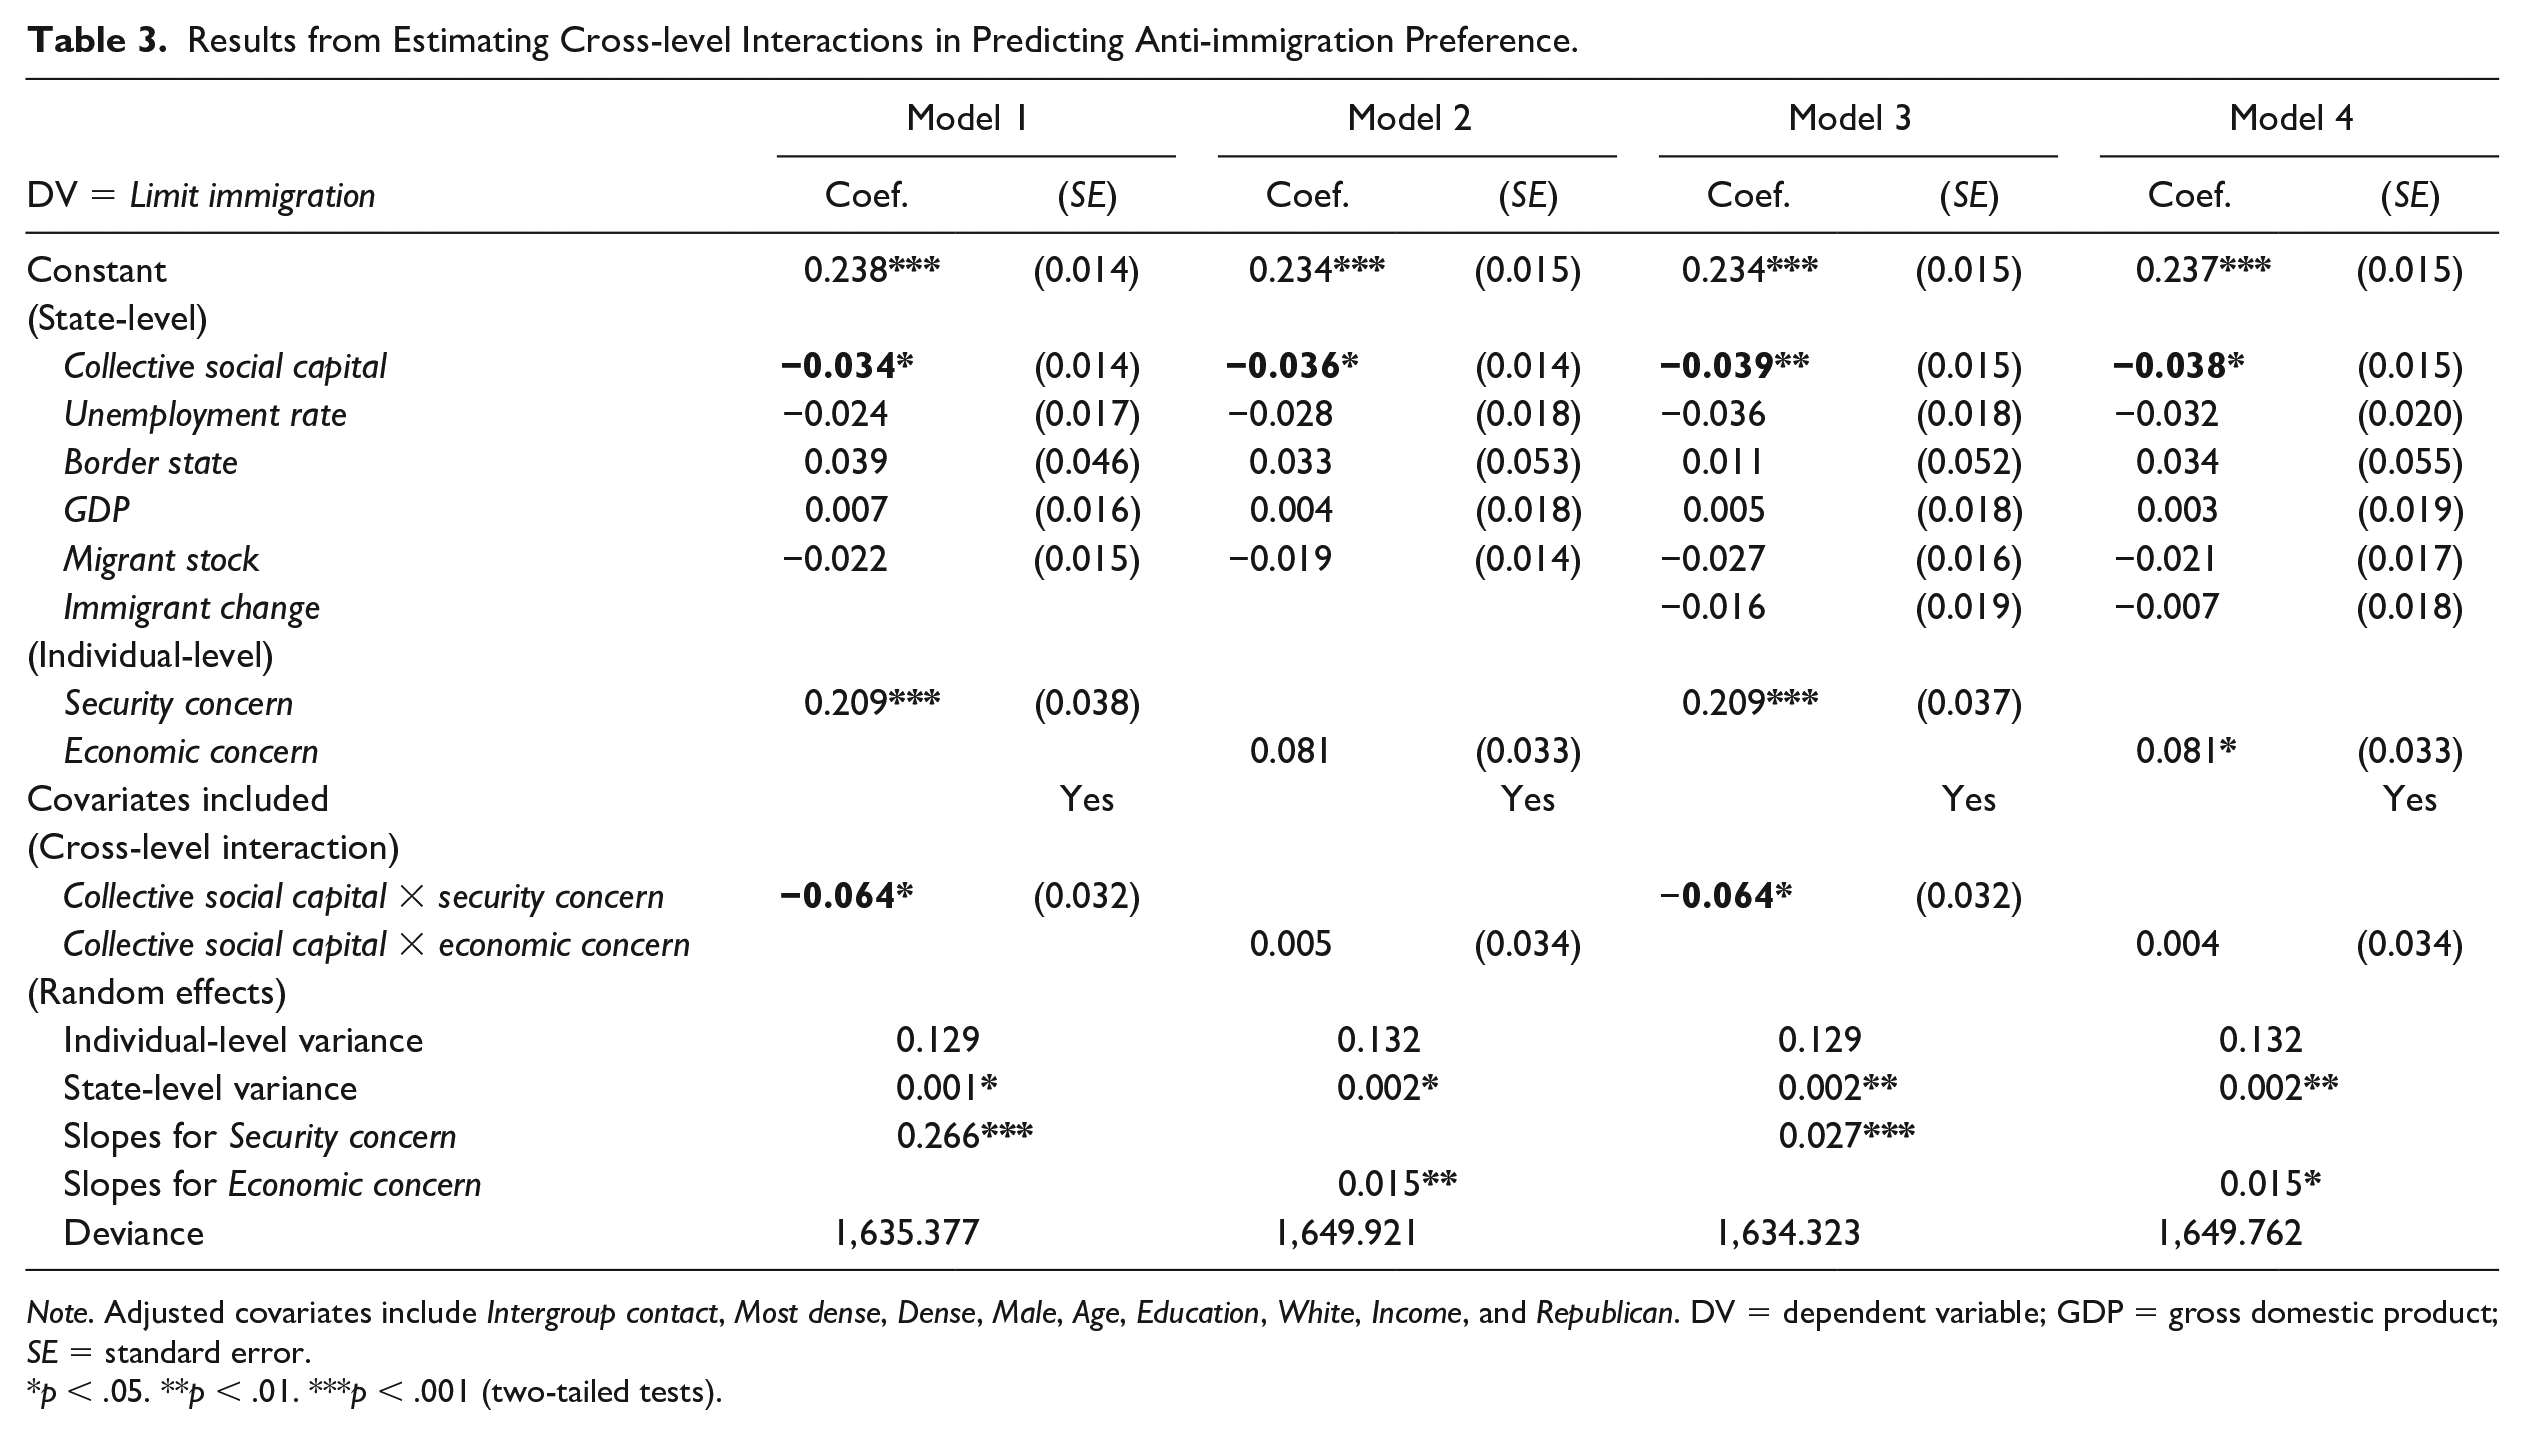
Note. Adjusted covariates include Intergroup contact, Most dense, Dense, Male, Age, Education, White, Income, and Republican. DV = dependent variable; GDP = gross domestic product; SE = standard error.
p < .05. **p < .01. ***p < .001 (two-tailed tests).
Compositional and Contextual Effects
According to Model 1 in Table 2, which is the unconditional model without any covariates or random effects Analysis of Variance (ANOVA), there is significant variation in the outcome variable (Limit immigration) across the U.S. states (τ = .002; df = 50; χ2 = 91.435; p < .001), justifying the use of multilevel analysis. As a baseline model excluding individual-level controls, Model 2 introduces the five contextual variables, according to which two of them are significant. First, as indicated by the parameter estimate for Migrant stock (β = −.05, p < .01), a higher proportion of immigrants is associated with support more open, not closed, immigration policy. For the main purpose of this study (with respect to
In Model 4, the two main individual-level predictors are replaced with a set of background controls. Findings show that race (White), interaction with immigrants (Intergroup contact), and one of the residential dummies (Dense) are not significantly associated with Limit immigration. By contrast, older adults (β = .002, p < .001) are significantly more and males (β = .047, p < .1) are marginally significantly more in favor of restricting the immigrant inflow. Being a Republican (β = .122, p < .001) is also positively associated with supporting restrictive immigration. On the other hand, being better educated (β = −.024, p < .01), having higher income (β = −.013, p < .01), and living in the densest county (β = −.054, p < .05) are all negatively related to anti-immigrant preference. Net of these factors, collective social capital at the state level (β = −.029, p < .05) continues to exert an independent impact on the outcome, while the other contextual effects are non-significant. Last, as a more stringent test, Model 5 is estimated by adjusting for all the covariates. As this fully specified model shows, the main finding in terms of effect size is consistent with respect to Collective social capital (β = −.039, p < .05), providing an affirmative answer for
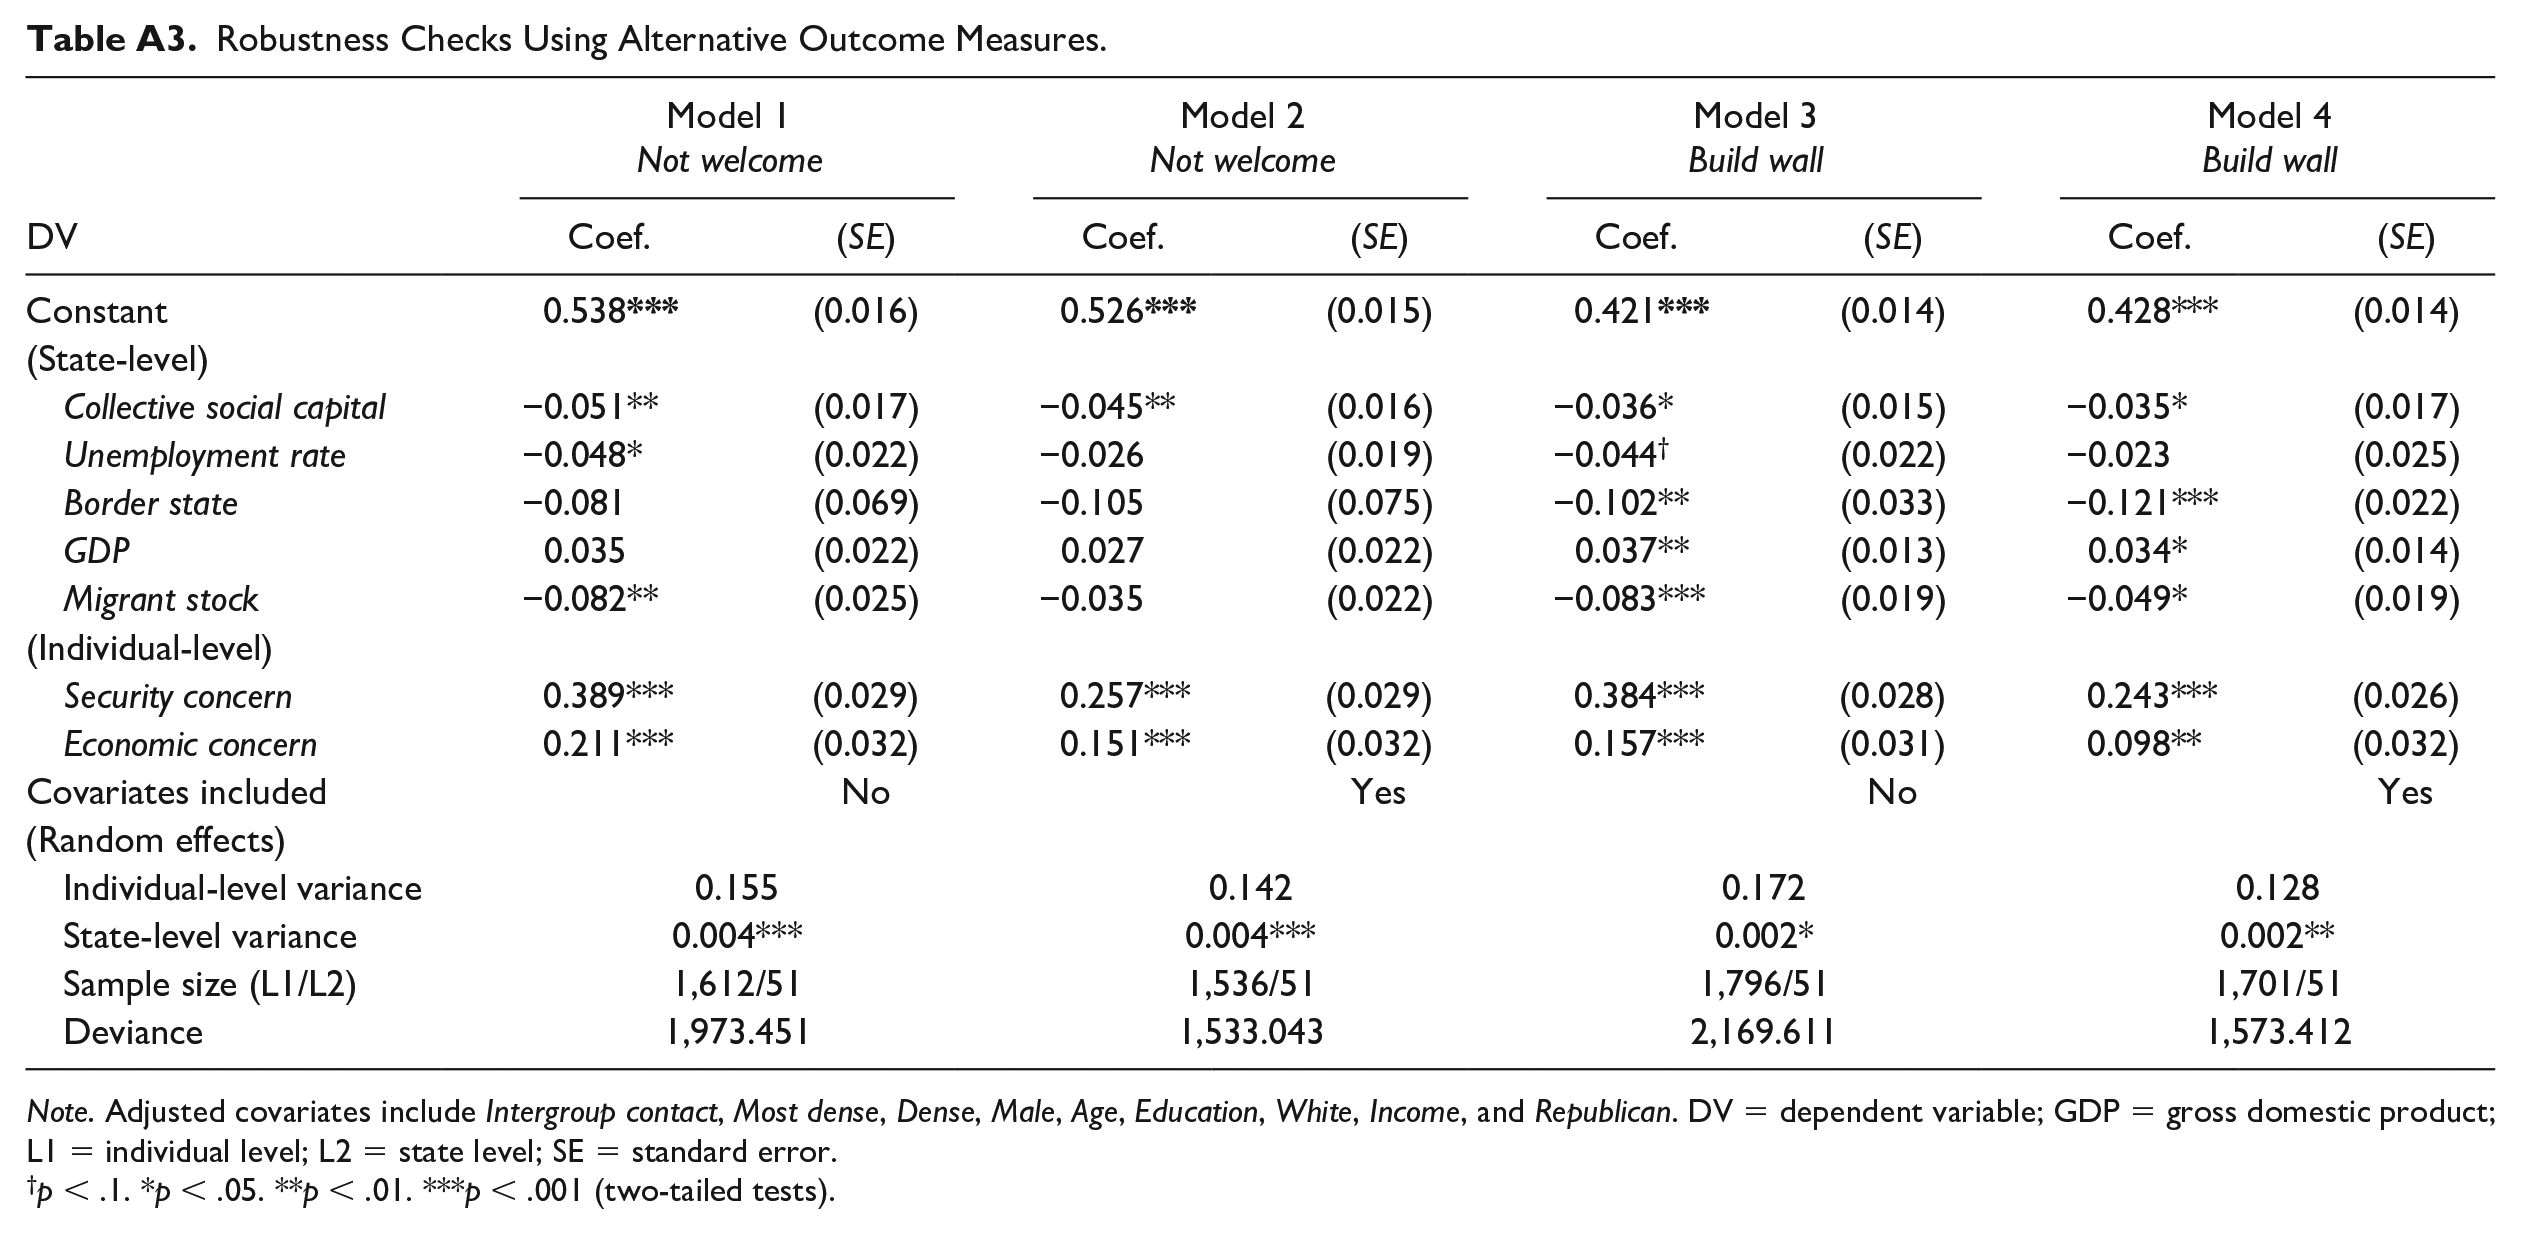
Additional models were estimated to check the robustness of this finding by using alternative outcome measures, namely Not welcome and Build wall. In the Pew Political Survey (2018), respondents were additionally asked whether they would in general accept or welcome immigrants into their country (53 percent said yes) and whether they would support Trump’s call for a wall along the U.S.-Mexico border (43 percent said yes). New results based on these outcomes are provided in Appendix Table A3. Models 1 and 2 refer to Not welcome as the dependent variable; Models 3 and 4 contain findings with respect to Build wall. In Model 1, adjusting for two key individual-level covariates (Security concern and Economic concern) and state-level controls, the coefficient for Collective social capital is shown to be negatively significant (β = −.051, p < .01), which is consistent with earlier findings in Table 3 (with Limit immigration as the outcome). Even after adjusting for all compositional effects at the individual unit of analysis, as shown in Model 2, the result based on the alternative measure (Not welcome) remains robust (β = −.045, p < .01). Moving onto the next set of findings for Build wall, consistent evidence emerges with respect to its relationship with Collective social capital in Model 3 (β = −.036, p < .05) and Model 4 (β = −.035, p < .05). These additional analyses lend further support for the contextual effect of state-level social capital on how U.S. natives feel about immigrants and immigration.
Cross-Level Interaction Effects
Next, to address
To check the robustness of this finding, another state-level variable is added, namely Immigrant change since prior research indicates that the proportional increase or decrease in the foreign-born population over time plays a critical role above and beyond the static measure of migrant stock (e.g., Laurence and Kim 2021). The new coefficient for the interaction term in Model 3 (Collective social capital × Security concern) remains identical, suggesting that the main association under consideration is not sensitive to different measures of immigrant population. This conditional relationship is graphically illustrated in Figure 3, with all other multilevel covariates held at their means (based on Model 3 in Table 3). 7 The lighter bar refers to (“low-social capital”) states with the SCI score at the 25th percentile. The shaded one corresponds to (“high-social capital”) states at the 75th percentile. Two observations merit discussion. First, the predicted value for Limit immigration is higher (as indicated by the two bars on the right side of the figure under the label “Yes”) for American adults who agree that “undocumented immigrants living in the United States are more likely than American citizens to commit serious crimes.” Second, this tendency is reduced in a regional context with greater aggregate social capital, as demonstrated by the relatively shorter shaded bar under the label “Yes” (with the 75th percentile SCI score).
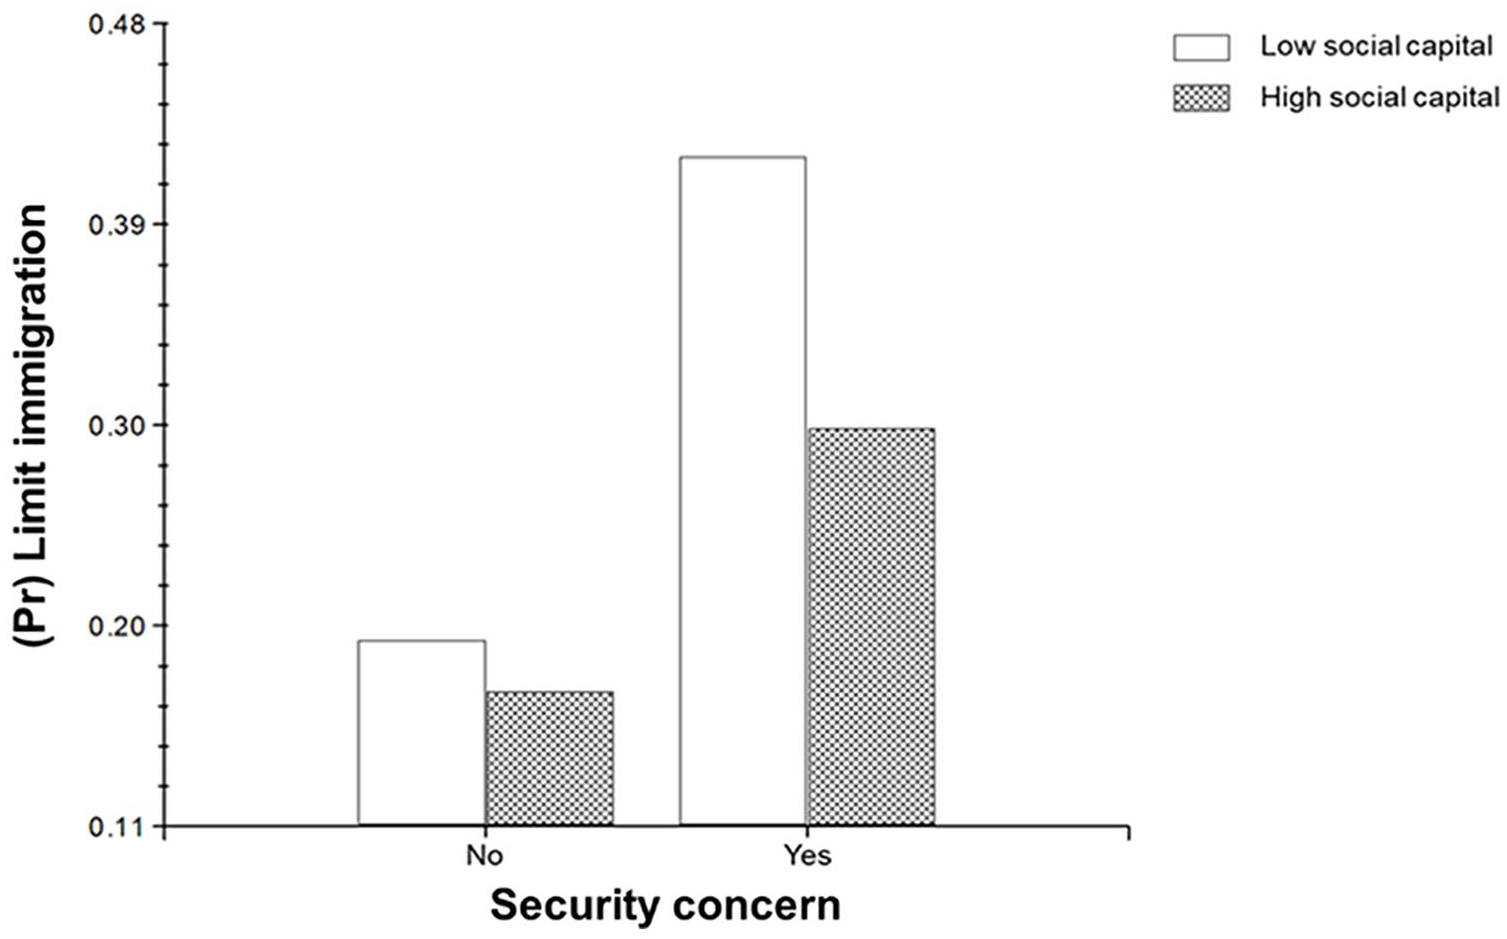
Cross-level interaction between security concern and collective social capital.
Conclusion
This research was motivated by two questions regarding the independent and interactive roles of social capital in relation to natives’ attitudes toward immigration. To address them, a probability sample of American adults was analyzed using mixed-effects models. In the process, the central focus was on conceptualizing and operationalizing social capital at the contextual (i.e., state) level. A voluminous literature exists on explaining natives’ views and sentiments concerning immigrants and immigration. Empirical findings from this literature are mainly based on economic and cultural predictors, as previously noted. The present study helps to advance the scholarship by considering a relatively neglected dimension: how and the extent to which collective social capital can impact Americans’ preference for restrictive immigration. Limited research suggests that people who are more prone to trust generalized others (i.e., those with more “individual-level” social capital) are positively predisposed to outgroup members in general and immigrants specifically. The question remains, however, whether and how contextual social capital shapes the degree to which citizens are willing to welcome or reject the foreign-born.
Adjusting for confounders across two units of analysis, results from the HLPMs provided substantial support for the independent effect of state-level social capital. Net of contextual (e.g., economic size, migrant stock, unemployment rate) and sociodemographic (e.g., income, education, party affiliation, race) controls—along with intergroup interaction known to powerfully influence immigrant attitudes (Laurence and Bentley 2018) as well as preexisting lack of sympathy toward undocumented immigrants—being embedded in a state with a higher level of social capital is negatively associated with anti-immigration attitudes in the United States. All things equal, support for restrictive immigration is greater in subnational regions that rank relatively lower on the SCI (e.g., New Mexico and Arkansas) vis-à-vis those at the higher end of the spectrum (e.g., Montana and North Dakota). Moreover, collective social capital is found to significantly moderate, that is lower, the strength of the specific association between security-related outgroup threat and preference for limiting immigration.
In general, Americans are more likely to oppose the inflow to the extent that they perceive immigrants as being more crime-prone in comparison with their native compatriots. And this association is not fixed but varies geographically: it increases inversely with the level of aggregate social capital. Evidence from estimating cross-level interaction terms with various model specifications (with fixed and random slopes) substantiates this contingent relationship. That the cross-level interaction term was not significant with Economic concern complements prior research that the rise of right-wing (i.e., anti-immigrant) populism in the United States and in other Western countries has more to do with “cultural backlash” than financial grievances (Norris and Inglehart 2019). Natives, in varying degree, certainly worry about having to compete with immigrant workers for jobs and the possibility of receiving lower wages as a result. Be that as it may, what matters more, according to the analysis presented above, is the perceived immigrant threat against their physical safety. In the fully specified model (Model 5 in Table 2), the coefficient for Economic concern in fact drops below the conventional level of significance, while that for Security concern remained.
Regarding the interpretation of findings, two related questions arise: why are residents of states endowed with greater social capital more open to immigration? and why does contextual social capital provide a buffer against the negative effect of immigrant threat (security concern)? Answering them requires a closer examination of how the SCI was originally operationalized in the Social Capital Project. As previously discussed, it consists of seven subindices. At the core of this index is the concept of “associational life” defined in terms of three substantive areas: family/community, cooperation, and trust. According to this view, social capital is “‘greater’ or more productive” in families and communities “with an abundance of close, supportive relationships.” Social capital is also understood to be created through and found in social interactions and activities, both informal (e.g., interaction with neighbors) and formal (e.g., participation in nonprofit organizations). Consistent with the conventional literature, it is also theorized to be reflected in trust in other people, confidence in institutions, mutual generosity, and high collective efficacy (Joint Economic Committee, U.S. Congress 2018: 7).
Defined as such, states with higher SCI scores are characterized by supportive relationships, cooperative interactions, and greater interpersonal and institutional trust. By contrast, at the lower end of the index, subnational regions with limited social capital imply that the residents are largely seen as distrustful. And naturally, they are relatively distrusting of one another, unwilling to cooperate with others, and unlikely to support one another in times of need. This dichotomous characterization, at the risk of overgeneralization, has profound implications for how the individual members would embrace or reject immigrants and related the issue of immigration policy. Scholars have highlighted a variety of positive consequences, that is “functions,” of aggregate social capital (Coleman 1988; Portes and Sensenbrenner 1993; Putnam 2000). Main findings of the present study suggest “willingness to accept outsiders,” or a positive outgroup orientation, to be included in the list of potential benefits.
Being part of an environment characterized by “high” social capital means residents, when necessary, can depend on those around them for assistance, have a deeper sense of group belonging, enjoy better interpersonal connectedness and related well-being (e.g., feel safer and less lonely), and ultimately derive greater life satisfaction. In fact, the Social Capital Project was initiated by the U.S. government to draw policy implications to improve the overall quality of American life. That is, from the policy perspective, social capital is viewed in a normative light as a sign of community welfare. By extension, then, we can conjecture that those members of communities with “high” social capital, on average, may be more likely to welcome outsiders (e.g., immigrants). On the other hand, a residential context with “low” social capital is, by definition, fraught with social isolation, distrust, lack of cooperation, and relative deprivation. Living in such communities denotes personal feelings of uncertainty and insecurity, a situation where immigrants are more likely to be perceived as a threat and consequently criticized, demonized, and even shunned.
Aside from empirical contributions, this study offers a theoretical lesson relating to the level of conceptualization of social capital. Some researchers define social capital as a property of individual actors (Burt 1992; Coleman 1988), while others see it as a collective attribute (Fukuyama 1995; Putnam 1993). As a result, there is a great deal of controversy surrounding social capital which “has to do with its . . . use in theories involving different units of analysis” (Portes 2000:2). Clearly, individual social capital is qualitatively distinct from collective social capital. The former can be seen, for example, in terms of interpersonal ties or networks, whereas the latter may be conceptualized as shared responsibility and altruism or “civic spirit” (Portes 2000). And it is entirely possible for social capital to vary among specific actors as well as between various communities. The current research took the approach of using an aggregate index to gauge levels of social capital across the U.S. states. An important task for future research is to, first, distinguish between the two levels or units of conceptualization and, second, operationalize an appropriate measure for each type in empirical investigation.
One major shortcoming of Pew Research Center’s Political Survey is the lack of data on individual-level social capital, including the number of close contacts and frequency of social interaction. It would have been ideal to control for such measures while testing the role of collective social capital. Future studies can contribute to the literature by explicitly measuring social capital across individuals and their broader environmental contexts (neighborhoods, communities, etc.). Doing so would make it possible to probe possible interactions between individual and collective levels of social capital: for example, whether the relationship between individual-level network variables on anti-immigrant attitudes is moderated by state-level variables on collective efficacy, social support, institutional health, and the like. More nuanced analyses can also be conducted by collecting more detailed information on intergroup contact, such as whether the survey respondent evaluates it as positive or negative in addition to its frequency.
Despite data limitations, the present study provided new findings on the protective role of collective social capital in the American context, one that has been highly politicized of late because of social problems intricately related to race relations. It also highlighted possible directions to help improve our understanding of how, when, and why social capital matters with respect to natives’ perception of immigrants and desires for increasing or decreasing the flows of immigration. With the rise of global populist nationalism, xenophobia has emerged as a grave concern in many countries. And the United States is certainly no exception in this regard. The current study sought to shed light on the importance of a key contextual variable in shaping American adults’ views on the foreign-born population. More research is required to further assess the conditions under which macro variables (e.g., collective social capital) can dampen the anti-immigrant rhetoric and xenophobic behavior from flaring up at the microlevel.
Footnotes
Appendix
Robustness Checks Using Alternative Outcome Measures.
| DV | Model 1 |
Model 2 |
Model 3 |
Model 4 |
||||
|---|---|---|---|---|---|---|---|---|
| Coef. | (SE) | Coef. | (SE) | Coef. | (SE) | Coef. | (SE) | |
| Constant | 0.538 |
(0.016) | 0.526 |
(0.015) | 0.421 |
(0.014) | 0.428*** | (0.014) |
| (State-level) | ||||||||
| Collective social capital | −0.051** | (0.017) | −0.045** | (0.016) | −0.036* | (0.015) | −0.035* | (0.017) |
| Unemployment rate | −0.048* | (0.022) | −0.026 | (0.019) | −0.044 † | (0.022) | −0.023 | (0.025) |
| Border state | −0.081 | (0.069) | −0.105 | (0.075) | −0.102** | (0.033) | −0.121*** | (0.022) |
| GDP | 0.035 | (0.022) | 0.027 | (0.022) | 0.037** | (0.013) | 0.034* | (0.014) |
| Migrant stock | −0.082** | (0.025) | −0.035 | (0.022) | −0.083*** | (0.019) | −0.049* | (0.019) |
| (Individual-level) | ||||||||
| Security concern | 0.389*** | (0.029) | 0.257*** | (0.029) | 0.384*** | (0.028) | 0.243*** | (0.026) |
| Economic concern | 0.211*** | (0.032) | 0.151*** | (0.032) | 0.157*** | (0.031) | 0.098** | (0.032) |
| Covariates included | No | Yes | No | Yes | ||||
| (Random effects) | ||||||||
| Individual-level variance | 0.155 | 0.142 | 0.172 | 0.128 | ||||
| State-level variance | 0.004*** | 0.004*** | 0.002* | 0.002** | ||||
| Sample size (L1/L2) | 1,612/51 | 1,536/51 | 1,796/51 | 1,701/51 | ||||
| Deviance | 1,973.451 | 1,533.043 | 2,169.611 | 1,573.412 | ||||
Note. Adjusted covariates include Intergroup contact, Most dense, Dense, Male, Age, Education, White, Income, and Republican. DV = dependent variable; GDP = gross domestic product; L1 = individual level; L2 = state level; SE = standard error.
p < .1. *p < .05. **p < .01. ***p < .001 (two-tailed tests).
Declaration of Conflicting Interests
The author(s) declared no potential conflicts of interest with respect to the research, authorship, and/or publication of this article.
Funding
The author(s) received no financial support for the research, authorship, and/or publication of this article.