
Abstract
The current study examined a solution to high false positive reading risk classification rates in early kindergarten by investigating a method of identifying students with possible false positive risk classifications and returning them to general classroom instruction. Researchers assessed kindergarten students (N = 105) identified as at risk who were participating in a full-year Tier 2 reading intervention program. Students with very strong initial curriculum mastery (n = 9) were identified as having possible false positive risk classifications and returned to general classroom Tier 1 instruction. Very strong responders who were exited from intervention (i.e., exited strong responders) scored above the risk range across multiple reading measures at the end of the year and performed similarly to a historical comparison cohort who remained in intervention services for the entire year (i.e., treated strong responders). Results suggest that kindergarten students with false positive risk classifications can be identified after a period of intervention services and successfully returned to general classroom instruction.
Responsiveness-to-intervention (RTI) models of reading support are promising approaches for preventing many reading difficulties. Targeted early interventions in kindergarten have been successful in increasing basic early reading skills (see Cavanaugh, Kim, Wanzek, & Vaughn, 2004, for review). Selecting appropriate students for this type of early intervention, however, has been problematic (McAlenney & Coyne, 2011). Screening batteries used at the entrance to kindergarten often over-predict the number of students who will ultimately experience reading difficulties, resulting in high rates of false positive risk classifications. Fuchs and Vaughn (2012) identified difficulties with screening, including high false positive rates, as one of the “persistent questions” surrounding RTI (p. 196).
Including large numbers of students with false positive risk classifications in intervention groups can increase staffing needs while creating an unnecessary financial burden for schools with limited resources. The purpose of this study was to examine a simple and practical method for reducing the number of kindergarten students with false positive risk classifications in intervention groups. Specifically, we developed a model for identifying students with possible false positive risk classifications based on RTI data and returned identified students to general classroom instruction (i.e., exited strong responders). At the end of kindergarten, we compared the exited strong responders’ reading outcome scores with commonly used benchmarks of reading achievement and with the reading scores of a historical cohort who remained in intervention groups for the entire school year (i.e., treated strong responders).
“First-Generation” RTI Research: What to Teach
RTI models are characterized by a tiered system of prevention-oriented instruction, with core reading instruction serving as a universal, or Tier 1, level of prevention of reading difficulties. More intensive and explicit instruction is applied as targeted, or Tier 2, reading intervention for these students identified as at risk for learning difficulties (Vaughn & Fuchs, 2003). Students who continue to struggle are supported at higher tiers with more intensive instruction, and students meeting reading goals, as evidenced by measures of intervention response, are returned to less intensive services.
Research on what to teach within tiered reading instruction has been described as “first-generation” RTI research. The goal of “first-generation” research has been to develop and evaluate targeted programs and interventions (Compton, Fuchs, Fuchs, & Bryant, 2006, p. 395). Reading interventions for kindergarten students have been successful in increasing basic early reading skills (Cavanaugh et al., 2004). Moreover, students who make progress in kindergarten intervention and are able to catch up to their peers by the fall of first grade are likely to continue to make progress in the general first grade curriculum without needing additional intervention services (Coyne, Kame’enui, Simmons, & Harn, 2004).
“Second-Generation” RTI Research: Whom to Teach
The “second-generation” of research in RTI examines the procedures necessary for effective and efficient implementation of practices within a tiered model of reading instruction and intervention service delivery, including how students move into and through the tiers of RTI (Compton et al., 2006, p. 395). Central to this is determining whom to teach by selecting the appropriate students for targeted Tier 2 intervention.
In kindergarten, current conceptualizations of risk for future reading difficulties generally stem from low performance on screening measures that are predictive of later reading achievement. Letter name knowledge, phonological awareness, and rapid naming have been found to be the strongest predictors of future word reading skill (Bishop & League, 2006; Boscardin, Muthén, Francis, & Baker, 2008; Burke, Hagan-Burke, Zou, & Kwok, 2010; Scarborough, 1998; Schatschneider, Fletcher, Francis, Carlson, & Foorman, 2004), and early phonemic awareness measures are also predictive for English Language Learner (ELL) students (Linklater, O’Connor, & Palardy, 2009). Poor achievement in these areas is indicative of an increased risk for reading failure, and students who exhibit low scores are targeted for preventative reading intervention services.
False Positive Risk Classifications
Despite their wide use in intervention research studies, measures used to identify at-risk kindergarten students have shown limited predictive power (Jenkins, Hudson, & Johnson, 2007; Nelson, 2008; Ritchey, 2008; Scarborough, 1998). A significant problem with kindergarten screening measures is that they tend to produce high numbers of false positive risk classifications (Catts, Fey, Zhang, & Tomblin, 2001; Jenkins et al., 2007; Jenkins & O’Connor, 2002; O’Connor & Jenkins, 1999; Torgesen, 2002; Vellutino, Scanlon, Zhang, & Schatschneider, 2008). False positive risk classifications indicate that students are at risk, yet the students do not develop reading difficulties.
Early reading screening batteries often have liberal cut-off scores for risk status (Catts et al., 2001; Jenkins et al., 2007; O’Connor & Jenkins, 1999) in the hope of capturing every student who will eventually develop difficulties and limiting false negative risk classifications (i.e., at-risk students who are not identified by screening batteries). Widening the access to risk status by raising cut-off scores has obvious consequences for the number of students with false positive risk classifications. Jenkins et al. (2007) found false positive rates of 13% to 44% when kindergarten reading screening measures had acceptable false negative rates (e.g., 5%–10%). The resource implications for over-identification at these rates may be prohibitive to the many schools with limited funding for intervention services.
Second, early kindergarten measures may not accurately predict future reading performance. Young children can be difficult to measure. Some assessments, such as Dynamic Indicators of Basic Early Literacy Skills (DIBELS) Initial Sound Fluency (ISF), demonstrate relatively weak alternate-form reliabilities at kindergarten (r = .72, Good & Kaminski, 2003). In addition, while some previous studies have found no difference in outcomes when assessing students in the fall as compared with the winter of kindergarten (Bishop & League, 2006; Santi, York, Foorman, & Francis, 2009), others have provided evidence for greater predictive power of measures given later in kindergarten (O’Connor & Jenkins, 1999; Torgesen, 1998) or at fall of first grade (Clemens, Shapiro, & Thoemmes, 2011; Compton et al., 2006; Compton et al., 2010; Fletcher et al., 2002; Hurford, Potter, & Hart, 2002) when assessments more closely resemble actual print-based reading tasks (Scarborough, 1998).
Waiting to identify students for reading intervention services, however, is no longer an appropriate solution to the problem of classification accuracy. With the acknowledgment that children who are at risk for reading difficulties should be identified as early as possible (Snow, Burns, & Griffin, 1998), data indicating the power of kindergarten interventions to successfully teach early reading skills (Cavanaugh et al., 2004), and evidence that students make greater gains when they start intervention services at the beginning of kindergarten rather than at the mid-point (Cooke, Kretlow, & Helf, 2010; O’Connor, Bocian, Beebe-Frankenberger, & Linklater, 2010), waiting to screen and intervene is but another manifestation of waiting to fail. That is precisely what RTI models of reading instruction seek to prevent.
Potential Contribution of Intervention Response Data
Schools, then, are left with many questions about the appropriate use of screening batteries to select students for early reading intervention. Early screenings produce high rates of false positive risk classifications. Delaying screening may produce more accurate predictions of future reading difficulties; however, waiting to intervene with a more accurately selected group loses precious early intervention time.
RTI models of reading instruction and reading intervention service delivery provide a unique opportunity for progress monitoring and dynamic grouping strategies that may offer a solution to the over-identification of reading risk. Much work has been done on identifying and understanding nonresponders to intervention (e.g., Al Otaiba & Fuchs, 2002; Torgesen, 2000). There is little research evidence, however, on the use of responsiveness data to identify strong responders. Data on student response to intervention has been helpful in more accurately predicting future reading achievement at the first grade level (Compton et al., 2006; Compton et al., 2010; Fuchs, Fuchs, & Compton, 2004; Torgesen, 2000). Similar data on initial response to kindergarten intervention, then, may give insight into the strongest responders, those with the fastest and greatest mastery of curriculum skills.
Purpose of the Study
The current study represents an exploratory examination of a method to reduce false positives in Tier 2 kindergarten reading intervention using intervention response data. We were interested in a simple and practical solution to this problem that would reduce unnecessary resource use while still allowing intervention to begin early in the kindergarten year.
First, we wanted to address the question of whether high-achieving intervention students could be safely exited from full-year reading interventions. To test this, we identified students with the highest initial response rates to intervention (score of >97%) and returned them to general classroom Tier 1 instruction. Second, we looked further to examine whether this very strong initial response could be used as an indicator of false positive risk classification on early kindergarten screening measures. We hypothesized that students could be considered to have had false positive risk classifications if they scored outside of risk status (>30th percentile; Simmons, Coyne, Kwok, McDonagh, & Kame’enui, 2008; Torgesen, 2000) on multiple end-of-kindergarten reading outcome measures in the absence of continued intervention services. Third, we compared the reading outcome scores of students who were exited from intervention with the outcome scores of students with similarly strong initial response in a historical cohort who remained in intervention groups for the entire academic year.
Overall, we believed that if schools could make evidence-based determinations about students with false positive risk classifications after a short period of intervention services and return them to general classroom instruction, then it would become more feasible to place all kindergarten students who appear to be at risk into early intervention services as soon as the school year begins.
Method
Research Design
The study occurred over 2 consecutive years of implementation of a Tier 2 kindergarten reading intervention curriculum. We examined the end of kindergarten reading outcomes of strong initial responders to Tier 2 supports in the second cohort year who were exited from intervention (i.e., exited strong responders). We considered (a) their absolute achievement at the end of the kindergarten year and (b) possible differences between their end of kindergarten reading outcomes and similar strong responders in the earlier cohort who had remained in the intervention program for the entire academic year (i.e., treated strong responders). To evaluate the absolute achievement, we compared individual student reading outcome scores in spring of kindergarten with end-of-year benchmark goals and risk level scores (30th percentile; Torgesen, 2000). We also compared the end-of-year reading performance between the exited strong responders from Cohort 2 and the treated strong responders from Cohort 1 who continued to participate in intervention groups for the entire school year. Due to the limited number of students who met the strict criteria for exiting the intervention, random assignment to condition was not feasible in this study. Shadish, Cook, and Campbell (2002) cite cohort groups as useful control groups when groups have only minor differences from one cohort to the next and when random assignment to a simultaneous true control group is not possible. This assumption rests on the idea that cohorts are more similar than noncohort groups and may be less prone to selection differences (Shadish et al., 2002).
Participants
Participants were students and school personnel in seven elementary schools in three Connecticut school districts over 2 consecutive school years. Percentages of students at each school receiving free or reduced-price lunch ranged from 3% to 81%. Six of the seven schools received Title I funding.
Interventionists
Participating interventionists across both years were literacy specialists, classroom teachers, special educators, and paraprofessionals (n = 14). Each interventionist taught one or two intervention groups during the school day. Interventionists held a variety of teaching and paraprofessional certifications, had 2 to 31 years of experience as educators (Cohort 1: M = 13.8, SD = 8.12; Cohort 2: M = 13.8, SD = 12.06), and completed 2 to 6 years of university-level coursework (Cohort 1: M = 4.1, SD = 1.36; Cohort 2: M = 3.5, SD = 1.76). One interventionist taught groups in both cohort years.
Students
Student participants in this study were 105 kindergarten students participating in Tier 2 intervention. They were identified as at risk for early reading difficulties based on fall DIBELS screening measure scores indicating Instructional Support Recommendations of Intensive–Needs Substantial Intervention or Strategic–Additional Intervention (Good, Simmons, Kame’enui, Kaminski, & Wallin, 2002). Cohort 1 included 60 kindergarten students (31 girls, 29 boys), and Cohort 2 included 45 kindergarten students (25 girls, 23 boys). In Cohort 1, 51% of the students were Caucasian, 36% were Hispanic, and 12% were African American. In Cohort 2, 48% of the students were Caucasian, 29% were Hispanic, 15% were African American, and 8% were Asian or identified as Other.
Measures
Fall screening measure scores used to establish reading risk status were collected from schools. Data collectors trained by the researchers administered a curriculum mastery test to all students in January and a battery of reading outcome measures in the third and fourth weeks of May. In addition, each of the exited strong responders received progress-monitoring assessments over the course of the spring semester (March to May).
Screening measures
The following screening measures were administered through each school, by trained school staff, as part of the routine assessment procedures for selecting kindergarten students for intervention.
Letter naming fluency
Fluency with naming letters was assessed using the Letter Naming Fluency (LNF) subtest of the DIBELS–Sixth Edition (Good & Kaminski, 2003). The LNF subtest measures a student’s ability to rapidly name upper- and lowercase letters presented in a random sequence in 1 min. The alternate-form reliability for this subtest for the kindergarten sample is .89.
Phonemic awareness fluency
Fluency with phonemic awareness skills was assessed using DIBELS Initial Sound Fluency subtest (ISF; Good & Kaminski, 2003). The ISF subtest measures a student’s ability to recognize and produce the initial sound in an orally presented word. The alternate-form reliability for this subtest is .72.
Outcome measures
Assessments were completed at the end of each school year in the third and fourth weeks of May.
Letter names and sounds
Letter name and sound knowledge were assessed using untimed measures of letter name and sound knowledge. The Supplementary Letter Checklist subtest of the Woodcock Reading Mastery Test–Revised/Normative Update (WRMT-R/NU; Woodcock, 1987/1998) is an unnormed measure of lowercase letter identification. This subtest includes 29 items, including alternate presentations of a, q, and g. The same subtest was also administered to assess a student’s ability to name the appropriate sound for each letter, with 36 total items including common digraphs and diphthongs. Scores indicate the number of letters or sounds correctly identified.
Phonemic awareness
Phonemic awareness was measured using the Sound Matching subtest of the Comprehensive Test of Phonological Processing (CTOPP; Wagner, Torgesen, & Rashotte, 1999) and DIBELS Phoneme Segmentation Fluency (PSF; Good & Kaminski, 2003). Sound Matching is an untimed assessment. Students are given a word represented by a picture and asked to select one of three words represented by pictures that have the same initial or final sound. The internal consistency reliability coefficient for this subtest is .93. The PSF subtest measures a student’s ability to fluently segment three- and four-phoneme words. The alternate-form reliability for this subtest for the kindergarten sample is .88.
Alphabetic principle
A student’s ability to apply knowledge of the alphabetic principle was measured using DIBELS Nonsense Word Fluency subtest (NWF; Good & Kaminski, 2003) and the Word Attack subtest of the WRMT-R/NU (Woodcock, 1987/1998). The NWF subtest measures a student’s knowledge of letter-sound correspondence and the ability to blend letter sounds into words. The alternate-form reliability for this subtest for the kindergarten sample is .88. The Word Attack subtest measures a student’s skill in reading a list of nonwords presented in isolation. The split-half reliability coefficient for this subtest is .94 for the first grade sample (coefficient for kindergarten sample not reported for any WRMT-R/NU subtests).
Word reading
Word reading skill was assessed using two subtests of the WRMT-R/NU (Woodcock, 1987/1998). The Word Identification subtest measures a student’s skill in reading a list of real words presented in isolation. The split-half reliability coefficient for this subtest is .98 for the first grade sample. The Passage Comprehension subtest assesses a student’s ability to read a short passage and supply a missing keyword. The split-half reliability coefficient for this subtest is .94 for the first grade sample.
Oral reading fluency
Oral reading fluency was assessed using a decodable passage titled “Mac Gets Well” (Makar, 1995; Simmons et al., 2011; Vadasy, Sanders, & Peyton, 2006). Scores indicate the number of words read correctly in 1 min. Estimates of internal consistency reliability indicated a Cronbach’s alpha of .93 for the kindergarten sample (Vadasy et al., 2006).
Progress monitoring
DIBELS benchmark measures (Good & Kaminski, 2003) were administered by trained school staff as part of routine assessment procedures. Each of the nine exited strong responders also received biweekly progress-monitoring assessments between March and May. Measures included LNF, ISF, PSF, and NWF.
Procedures
Procedures were the same during both cohort years, except where noted.
Intervention curriculum and training
Early Reading Intervention (ERI; Pearson/Scott Foresman, 2004) was used as the Tier 2 curriculum. ERI focuses on phonemic awareness and the alphabetic principle. Instruction establishes and reinforces the phonemic skills of the first and the last sound isolation, phoneme blending, and phoneme segmentation. It also teaches basic code-based skills and strategies such as letter name and sound identification, blending strategies, letter dictation, and whole word spelling. The full-year curriculum is scripted and carefully sequenced. Students participate in 126 daily 30-min lessons and four curriculum mastery tests.
Interventionists and other school personnel attended two full-day professional development trainings covering the ERI curriculum. Fidelity was assessed using a direct observation checklist developed as part of a larger evaluation of the ERI curriculum (Simmons et al., 2011). Researchers had previously been trained in the use of the fidelity checklist with other research staff. Each item was scored on a 4-point scale (1 = low; 4 = high).
Identification of strong responders
Cohort 1
After students in Cohort 1 had participated in a full year of Tier 2 reading intervention, we hypothesized that 11 out of 60 students (18%) may have been misclassified as at risk (false positive risk classification) based on a retrospective review of student performance data. These were students who were deemed at risk based on low fall screening measure scores but demonstrated that they may not have truly been at risk due to (a) immediate and sustained mastery of skills taught throughout the entire course of the intervention and (b) reading scores at posttest that were outside of the high risk range at the end of kindergarten.
Immediate and sustained mastery of intervention content was evaluated using data from four publisher-provided curriculum mastery tests associated with the ERI intervention that were administered throughout the year. Each of the 11 students scored 95% correct or higher on each of these mastery tests. Curriculum mastery tests evaluated skill mastery by assessing students’ knowledge of the letter names and sounds introduced in the previous lessons and their ability to apply blending, segmenting, and decoding skills learned in recent weeks.
Each of the 11 students also scored outside of high-risk levels on at least five of six reading outcome measures at the end of kindergarten. Students scored at or above the 30th percentile on CTOPP Sound Matching and WRMT-R/NU Word Attack, Word Identification, and Passage Comprehension and at or above end-of-kindergarten benchmark goals of 25 or more letter sounds correctly identified for DIBELS NWF and 35 or more phonemes correctly segmented for DIBELS PSF. These 11 treated strong responders in Cohort 1 were used as the comparison group for evaluating the exited strong responders from Cohort 2. The treated strong responders were primarily female (73%) and non-Caucasian (37% Hispanic, 37% Other). Approximately 37% also spoke a language other than English.
Cohort 2
We used the data from the treated strong responders in Cohort 1 to develop a model for early identification of students with possible false positive risk classifications in Cohort 2 who would be exited from intervention. First, we examined data from the first of the four ERI curriculum mastery tests administered to Cohort 1. Scores on the first curriculum mastery test were highly predictive of overall curriculum mastery (Lentini, 2008) and outcome scores (Oslund et al., 2013). The first test assessed skills learned in Part 1 of the ERI curriculum, including letter names, letter sounds, and first and last sound isolation. We reviewed the scores of the 11 treated strong responders to determine a cut-off score on the first curriculum mastery test that most accurately identified that group. A score of 97% or higher was the most accurate and was used to identify students with possible false positive risk classifications in Cohort 2.
Data collectors trained by the researchers assessed the curriculum mastery of students in Cohort 2 using the first ERI curriculum mastery test after students completed Part 1 of the curriculum, approximately 9 weeks of a 26-week curriculum. Nine students (19%) met or exceeded the 97% correct benchmark. This percentage was comparable to the percentage of the treated strong responders (18%) identified as having possible false positive risk classifications in the Cohort 1 comparison group. These 9 strong responders in Cohort 2 were primarily female (78%) and non-Caucasian (44% Hispanic, 22% Other). Approximately 56% also spoke a language other than English. Demographics for both groups are included in Table 1.
Student Demographic Variables, by Cohort Group.
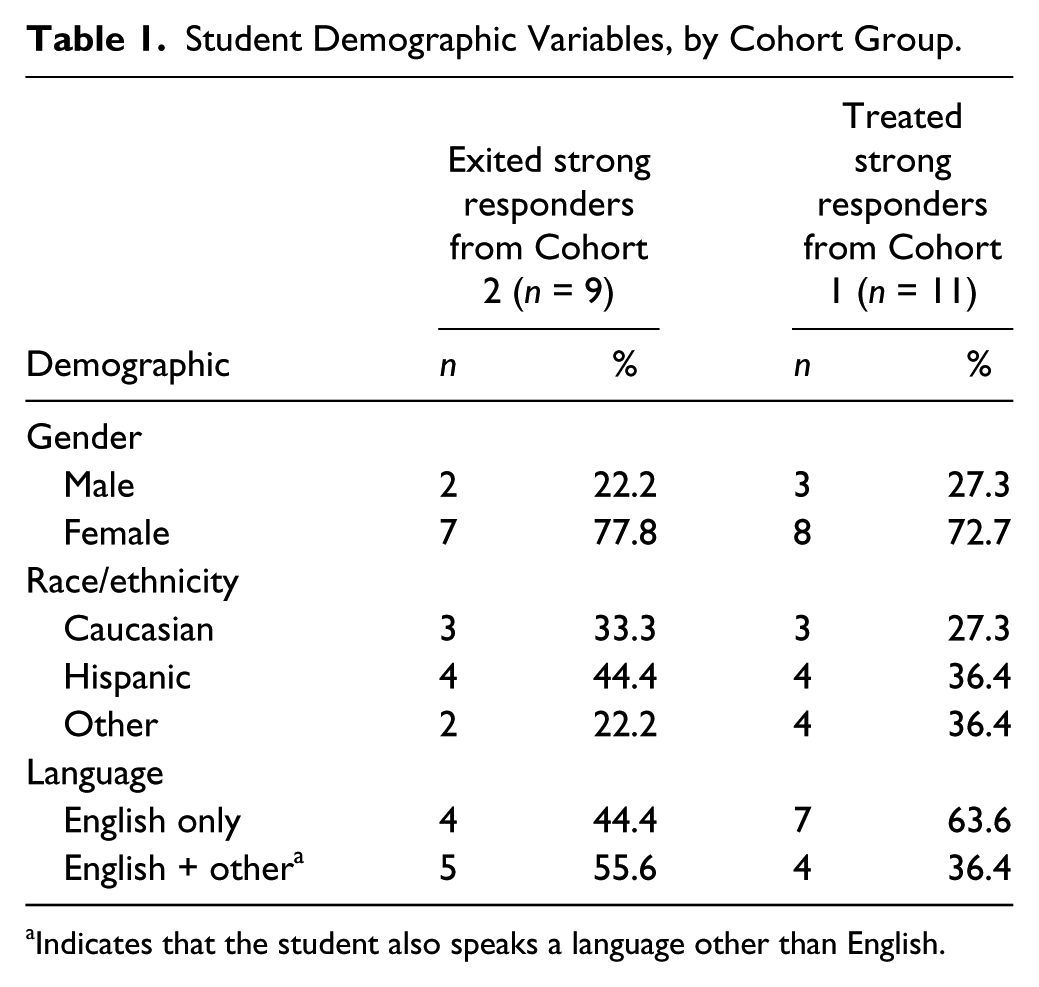
Indicates that the student also speaks a language other than English.
Next, the researchers reviewed curriculum mastery test data for all students with literacy personnel at each school. On final consultation with classroom teachers and interventionists, each of the nine students with possible false positive risk classifications was then exited from Tier 2 intervention and returned to general classroom instruction (Tier 1) for the remainder of the school year. Progress in the general curriculum was monitored from March to May.
Results
Analysis
Less than 20% of the 105 intervention students met the strict score criteria for identification as having a possible false positive risk classification. This number has important practical ramifications for intervention group size, affecting one out of every five students in a typical intervention group; however, the number relative to the entire population of kindergarten students is small (approximately one student per classroom). The 20 strong responders considered in the final analysis represent a small yet meaningful subsection of Tier 2 participants: those who might be safely exited from intervention. As this is an exploratory study, we acknowledge that the results presented here are constrained by limited power to conduct and interpret statistical tests; consequently, much of the analyses are based on description and evaluation of trends. Where appropriate, we have provided effect sizes (d) and 95% confidence intervals for the effect sizes for interpretation.
Effect sizes and confidence intervals were calculated using CIdelta, a software program by Exploratory Software for Confidence Intervals (ESCI; Cumming & Finch, 2001). Effect size confidence intervals account for error inherent in the estimation of effect sizes and indicate the plausible range of population effect sizes (δ) given the calculated effect size (d). When the 95% confidence interval for the effect size includes zero, the true population effect size may not be different from zero (i.e., there may not be a true mean score difference in the population).
To increase interpretability and account for possible differences between the groups at pretest as described below, effect sizes for outcome scores were calculated with covariate-adjusted mean scores using fall DIBELS LNF and ISF scores as covariates and pooled raw standard deviations, as suggested by Lipsey et al. (2012). Covariate adjusted mean scores were generated through a multivariate analysis of covariance (MANCOVA) with outcome measures as dependent variables. When confidence intervals for the effect sizes did not include zero, we reported MANCOVA results for outcome variables or conducted additional univariate analyses for the variables of interest; however, given the small sample size and the exploratory nature of this study, the results of statistical tests should be interpreted with caution.
Comparability of Cohort Groups
We considered threats to the validity of the interpretation of outcome scores that arise when using cohort groups. To address these concerns, data were analyzed in three areas to evaluate possible pre-existing selection differences, history effects, and differential maturation effects between groups: student variables, classroom instruction, and interventionist variables. Each represents within-child and environmental variables that may have contributed to student outcomes.
Student variables
The treated strong responders from Cohort 1 and the exited strong responders in Cohort 2 met the same criteria for inclusion in Tier 2 intervention groups. They each received DIBELS Instructional Support Recommendations of Intensive–Needs Substantial Intervention or Strategic–Additional Intervention (Good et al., 2002). Of the treated strong responders, five students (45%) were considered Intensive at screening and six students (55%) were considered Strategic. Of the exited strong responders, five students were also considered Intensive (56%) and four were considered Strategic (44%).
On screening measures, Cohort 1 scores trended higher on DIBELS ISF, d = 0.72; 95% CI [−0.202, 2.02], and Cohort 2 scores trended higher on DIBELS LNF, d = −1.29; 95% CI [−2.25, −0.302], as presented in Table 2. The difference between cohorts on the LNF measure was statistically significant, t(18) = 2.872, p = .01. A small number of students drove these mean score differences, with scores above benchmark goals on one measure and in the at risk range on the other measure. However, all students met the same criteria for inclusion in Tier 2 reading groups in that they failed to meet fall benchmark scores on at least one of the two screening measures. Importantly, there were no meaningful differences between scores in the middle of the year at the point where the treatment of the two cohorts differed and the strong responders in Cohort 2 were exited, as described below.
Screening and Winter Scores, by Cohort Group.
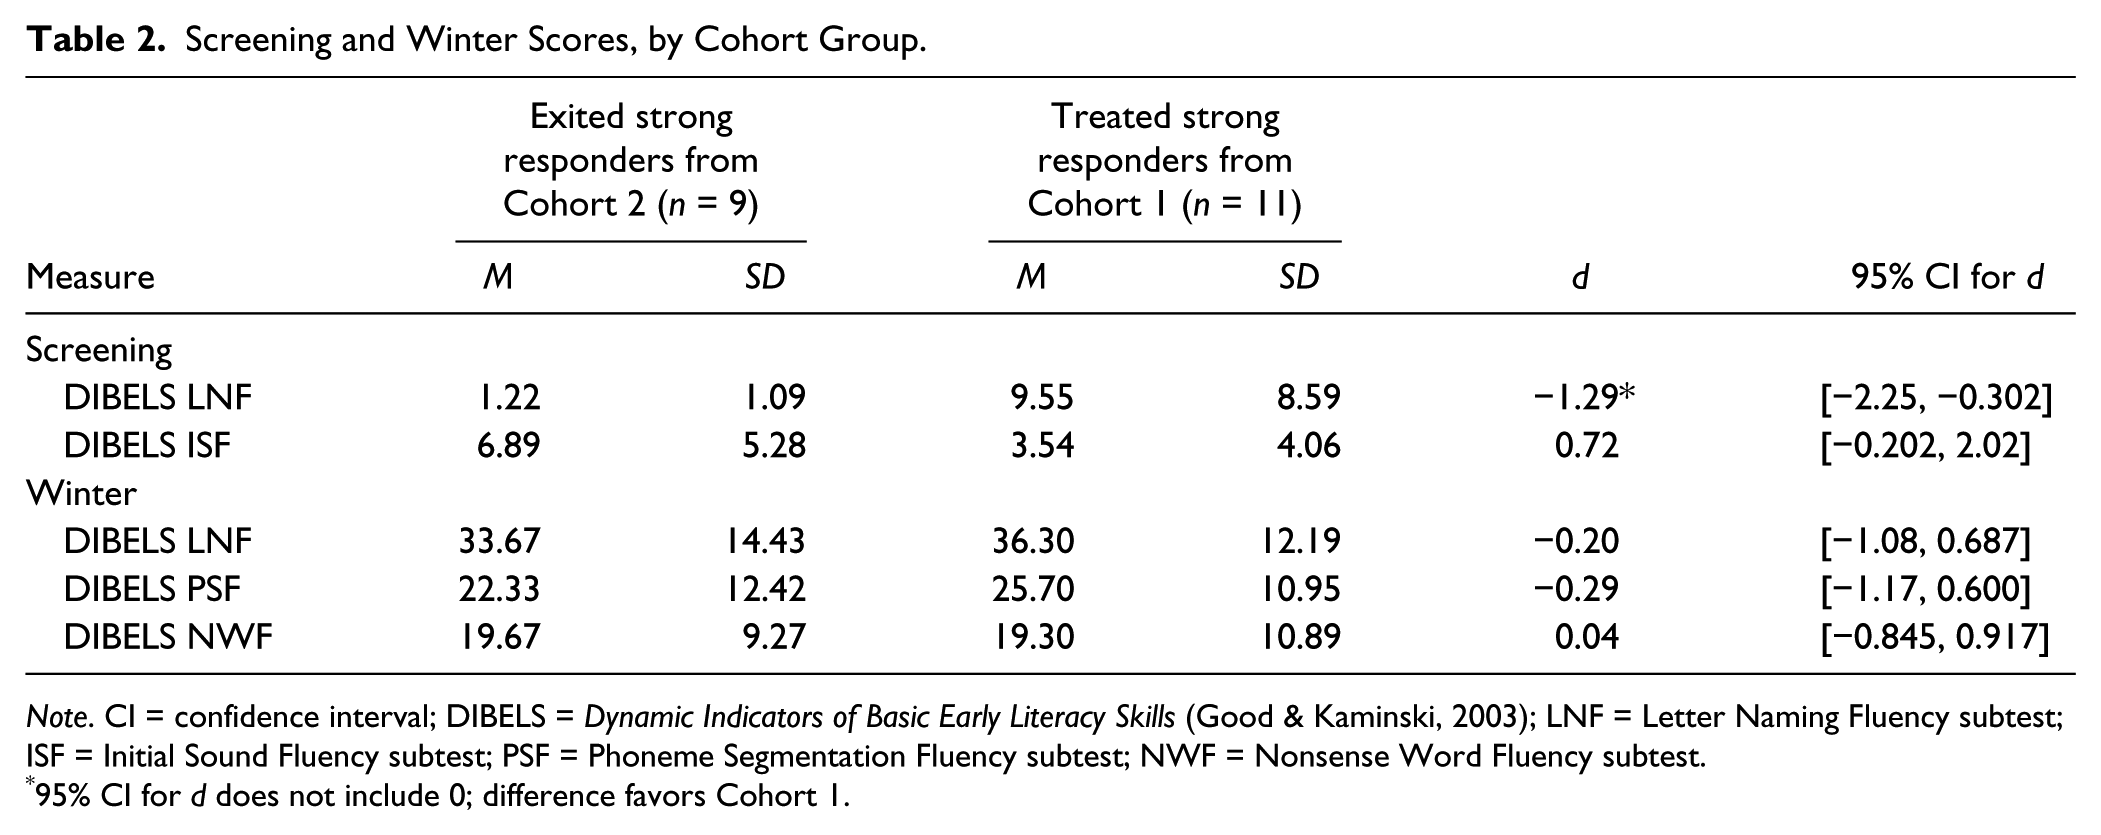
Note. CI = confidence interval; DIBELS = Dynamic Indicators of Basic Early Literacy Skills (Good & Kaminski, 2003); LNF = Letter Naming Fluency subtest; ISF = Initial Sound Fluency subtest; PSF = Phoneme Segmentation Fluency subtest; NWF = Nonsense Word Fluency subtest.
95% CI for d does not include 0; difference favors Cohort 1.
The performance of the treated strong responders and the exited strong responders was evaluated in the middle of the kindergarten year to help determine whether differential maturation effects could be contributing to end-of-year reading performance. DIBELS winter benchmark measures of LNF, PSF, and NWF were collected by school staff in January at approximately the same time as the first ERI curriculum mastery tests. The treated and the exited strong responders had similar scores at winter benchmark. As shown in Table 2, effect sizes ranged from −.29 to .04 and all effect size confidence intervals included 0.
The treated and the exited strong responders started the school year in the Intensive or Strategic risk range on DIBELS subtests. At the middle of kindergarten, students in both groups showed similar mastery of the ERI curriculum and similar performance on reading measures. It appears that these groups did not demonstrate differential maturation effects during the beginning of the school year, and, therefore, it is unlikely that a sudden difference in maturation between cohort groups could account for end-of-year results.
Classroom instruction
Significant changes in classroom instruction across cohort years could signify threats to validity due to history effects. Classroom teachers and literacy specialists in each cohort year provided information on the curriculum used and the number of minutes of reading and language instruction that each child was scheduled to receive in a 5-day school week. In six of seven schools, the Tier 1 kindergarten reading curriculum remained the same across both cohorts of students. The seventh school changed Tier 1 curriculums and added 15 min of reading instruction during the second cohort year. Students in Cohort 1, on average, were scheduled to receive approximately the same total number of minutes of reading instruction and language support per week (M = 572.7, SD = 173.4) as students in Cohort 2 (M = 575.0, SD = 221.9). The majority of kindergarten classroom teachers (90%) remained the same across both cohort years.
Interventionist variables
Differences in ERI interventionists across cohort years could also result in history effects that affected reading outcome scores. Interventionist educational and teaching experience was not statistically significantly different across cohort years.
In addition, observational data were collected to evaluate the interventionists’ fidelity to the ERI curriculum. Scores are reported on a 4-point scale (1 = low; 4 = high). Over both cohorts, fidelity to the curriculum was strong, with mean scores between 3 and 4 across all categories. Comparing interventionists across cohorts, effect sizes ranged from .11 to −.93 and confidence intervals for all effects include 0. Effect sizes trended in favor of interventionists in Cohort 1 on two measures of procedural fidelity “Completes activity components” (d = −0.93) and “Fluency with wording and activities” (d = −0.68), evaluating whether specific parts of the curriculum and its activities were completed as intended. Both groups demonstrated similarly strong scores on two measures of instructional quality, “Quality of Implementation” (d = −0.19) and “Use of instructional time” (d = 0.11).
Overall, comparisons of cohort groups, including student variables, classroom instruction, and interventionist variables, indicate that treated strong responders in Cohort 1 and the exited strong responders in Cohort 2 were similar across factors that could have influenced reading outcome measures. Where identified, differences between cohort groups appeared to favor higher reading outcome scores for treated strong responders in Cohort 1, including stronger procedural fidelity. Most notably, treated strong responders in Cohort 1 received small-group ERI reading intervention instruction for the duration of the academic year, whereas exited strong responders in Cohort 2 ceased participating in reading intervention groups after completing only one third of the curriculum. The additional hours of intensive reading intervention would seem to favor higher end-of-year scores for the treated strong responders in Cohort 1. When comparing two groups of kindergarteners in early reading intervention, O’Connor et al. (2010) found effect sizes between .25 and .83 favoring the group that participated in a full year of intervention as compared with the group that began its intervention at midyear. Although substantively different from the current study, O’Connor et al. provide evidence that more time spent in quality small group intervention results in higher outcome scores—a logical conclusion. The Cohort 1 comparison group of treated strong responders then appears to be a useful and somewhat conservative comparison group for the exited strong responders in that it is reasonable to expect outcome scores to be higher for Cohort 1.
Absolute Achievement at Spring
To maximize the practical applicability of the results, scores without adjustments for pretest covariates (i.e., raw standard scores and percentile ranks) were evaluated to determine whether scores reached desired benchmark levels. Individual student scores are presented in Table 3.
Spring Outcome Scores for Each Student.
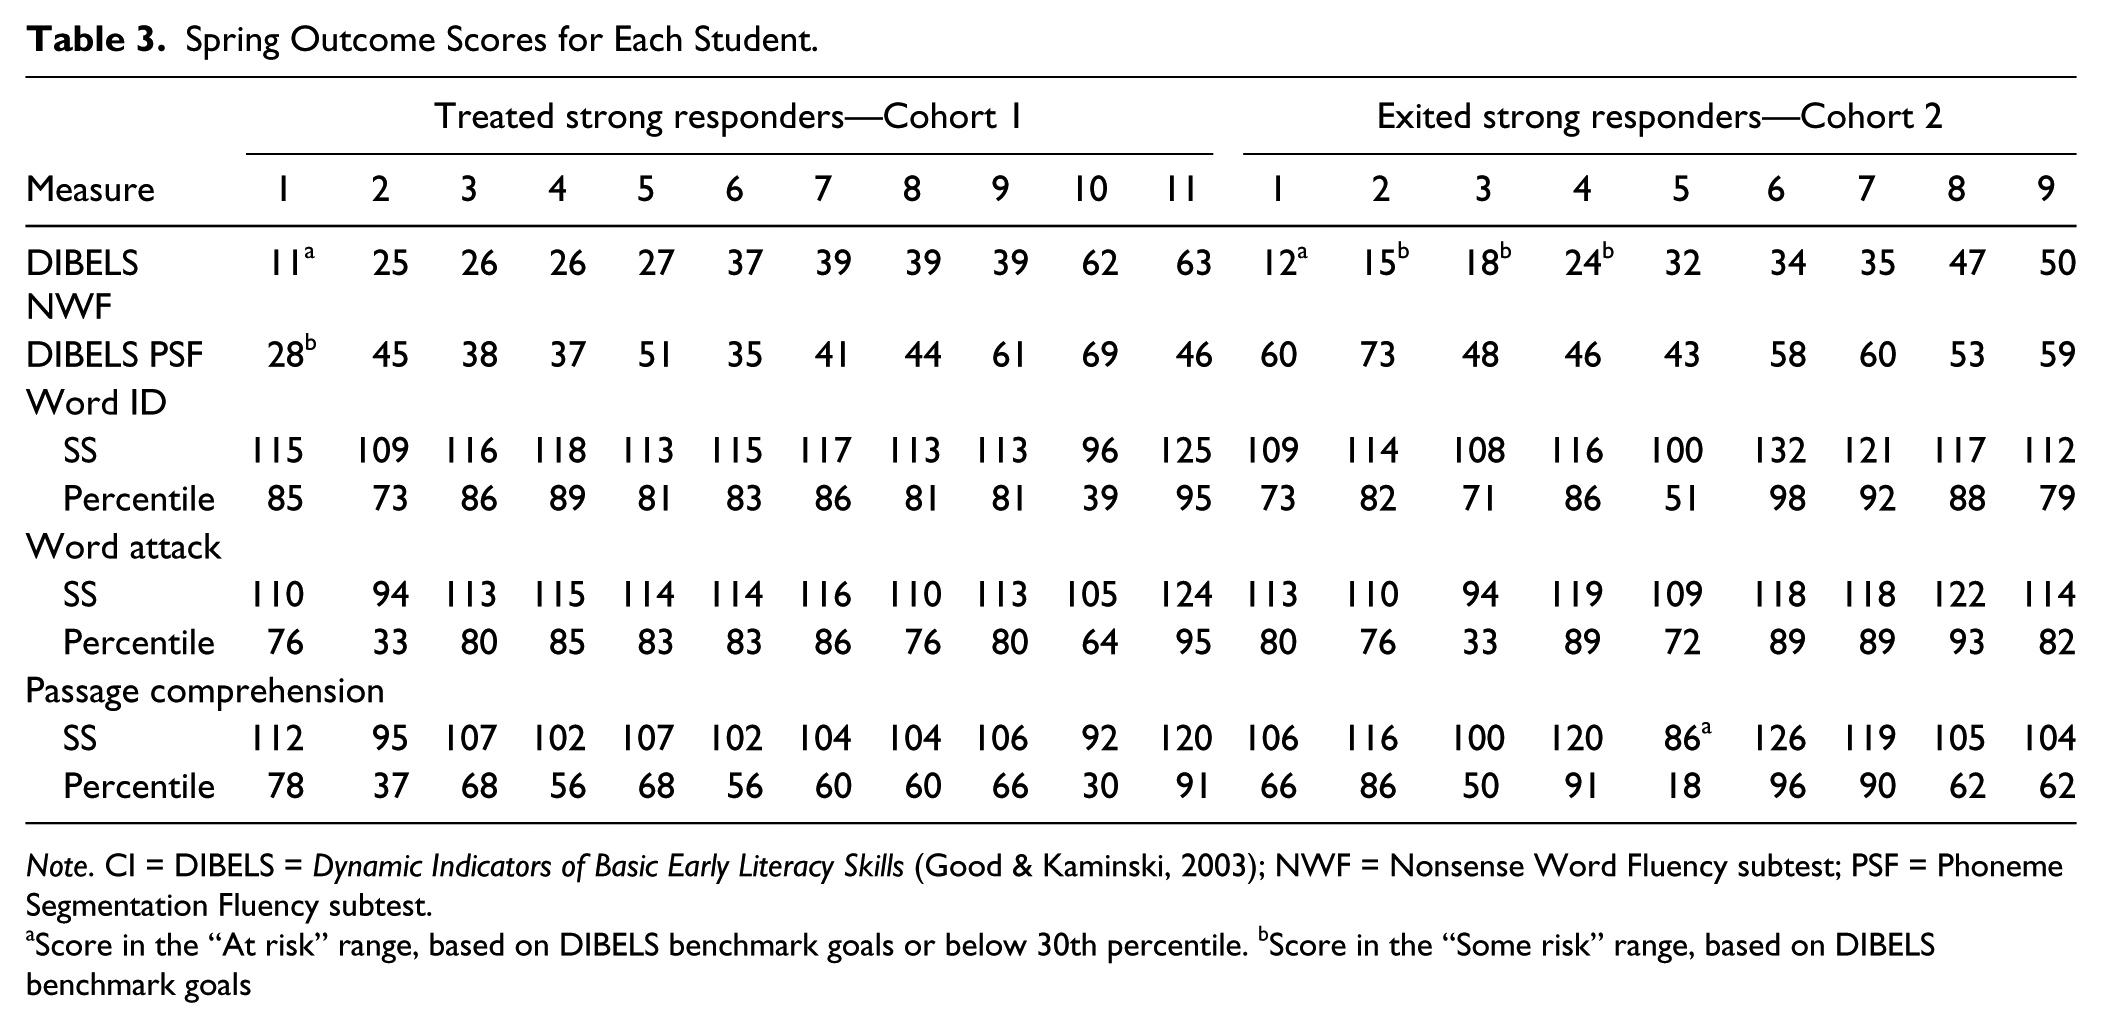
Note. CI = DIBELS = Dynamic Indicators of Basic Early Literacy Skills (Good & Kaminski, 2003); NWF = Nonsense Word Fluency subtest; PSF = Phoneme Segmentation Fluency subtest.
Score in the “At risk” range, based on DIBELS benchmark goals or below 30th percentile. bScore in the “Some risk” range, based on DIBELS benchmark goals
Treated strong responders
Treated strong responders from Cohort 1 were selected in part because of their strong performance at the end of kindergarten. As a group, the treated strong responders met end-of-kindergarten DIBELS PSF benchmark goals of 35 or more phonemes correctly segmented in 1 min (M = 45.00, SD = 11.78) and NWF benchmark goals 25 or more letter sounds correctly read in 1 min (M = 35.82, SD = 15.68). Individually, eight of nine students met the benchmark goal for the PSF and NWF measures. One student scored in the “at risk” range on NWF and the “some risk” range on PSF.
In addition, the treated strong responders scored outside of the high-risk range (at or above the 30th percentile; Torgesen, 2000) on subtests of the WRMT-R/NU, Word Identification (mean percentile = 79.91, SD = 14.65) and Passage Comprehension (mean percentile = 60.91, SD = 17.03). According to the published standard score percentile equivalents, it is not possible for students in this age group to score below the 30th percentile on the Word Attack subtest. Individually, all 11 students scored at or above the 30th percentile on each of the WRMT-R/NU measures (see Figure 1).
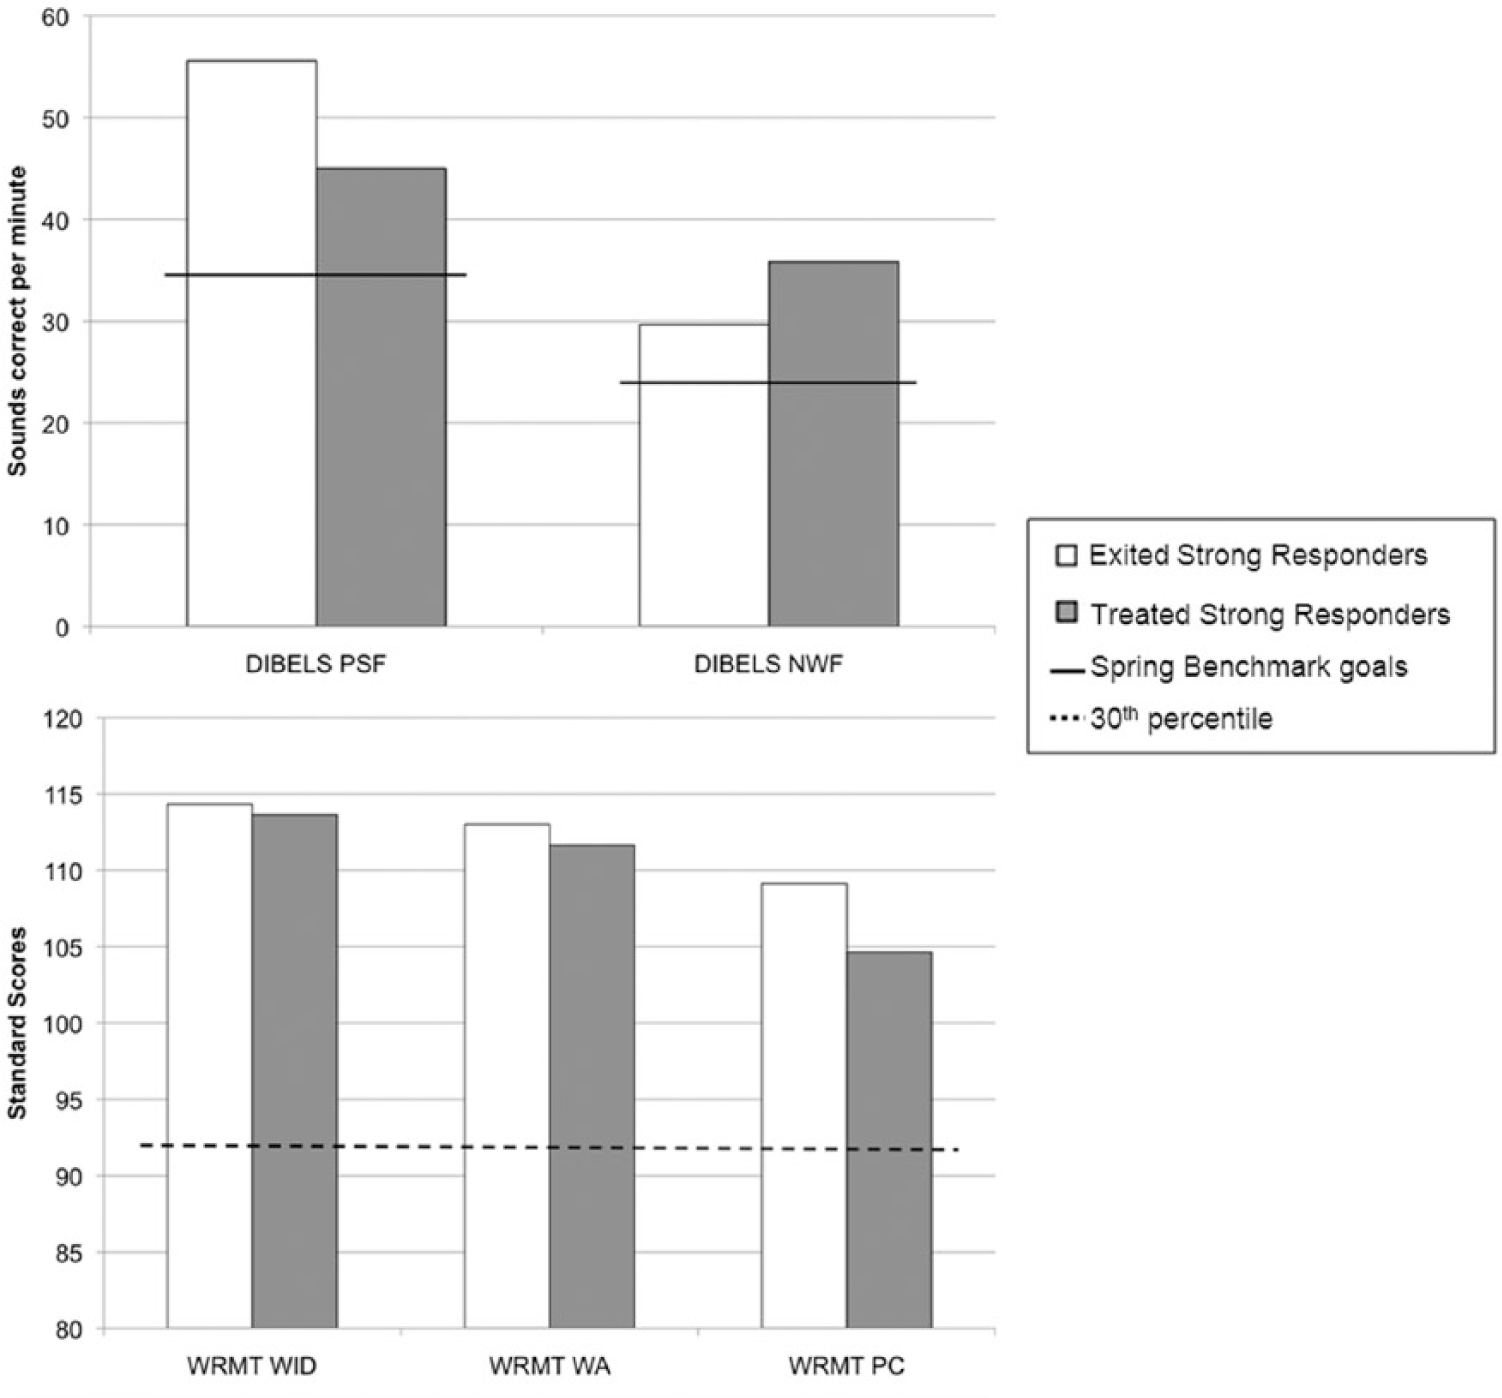
Mean outcome scores as related to DIBELS–6th ed. Spring Benchmark goals (PSF = 35; NWF = 25) and 30th percentile score.
Exited strong responders
Exited strong responders in Cohort 2 also met end of kindergarten DIBELS benchmark goals for PSF (M = 55.56, SD = 9.180) and NWF (M = 29.67, SD = 13.519). Individually, all nine students met the benchmark goal on the PSF measure and five students also met the goal on the NWF measure. Of the four students who did not meet the end-of-year benchmark goal on NWF, three students scored in the “some risk” range and one student scored in the “at risk” range by DIBELS benchmark standards.
The exited strong responders scored outside of the high risk range on subtests of the WRMT-R/NU, Word Identification (mean percentile = 80.00, SD = 13.89) and Passage Comprehension (mean percentile = 69.00, SD = 25.03). All nine exited strong responders scored above the high-risk range on the Word Identification subtest, and eight students also scored above the high-risk range on the Passage Comprehension subtest (see Figure 1).
Reading Outcomes
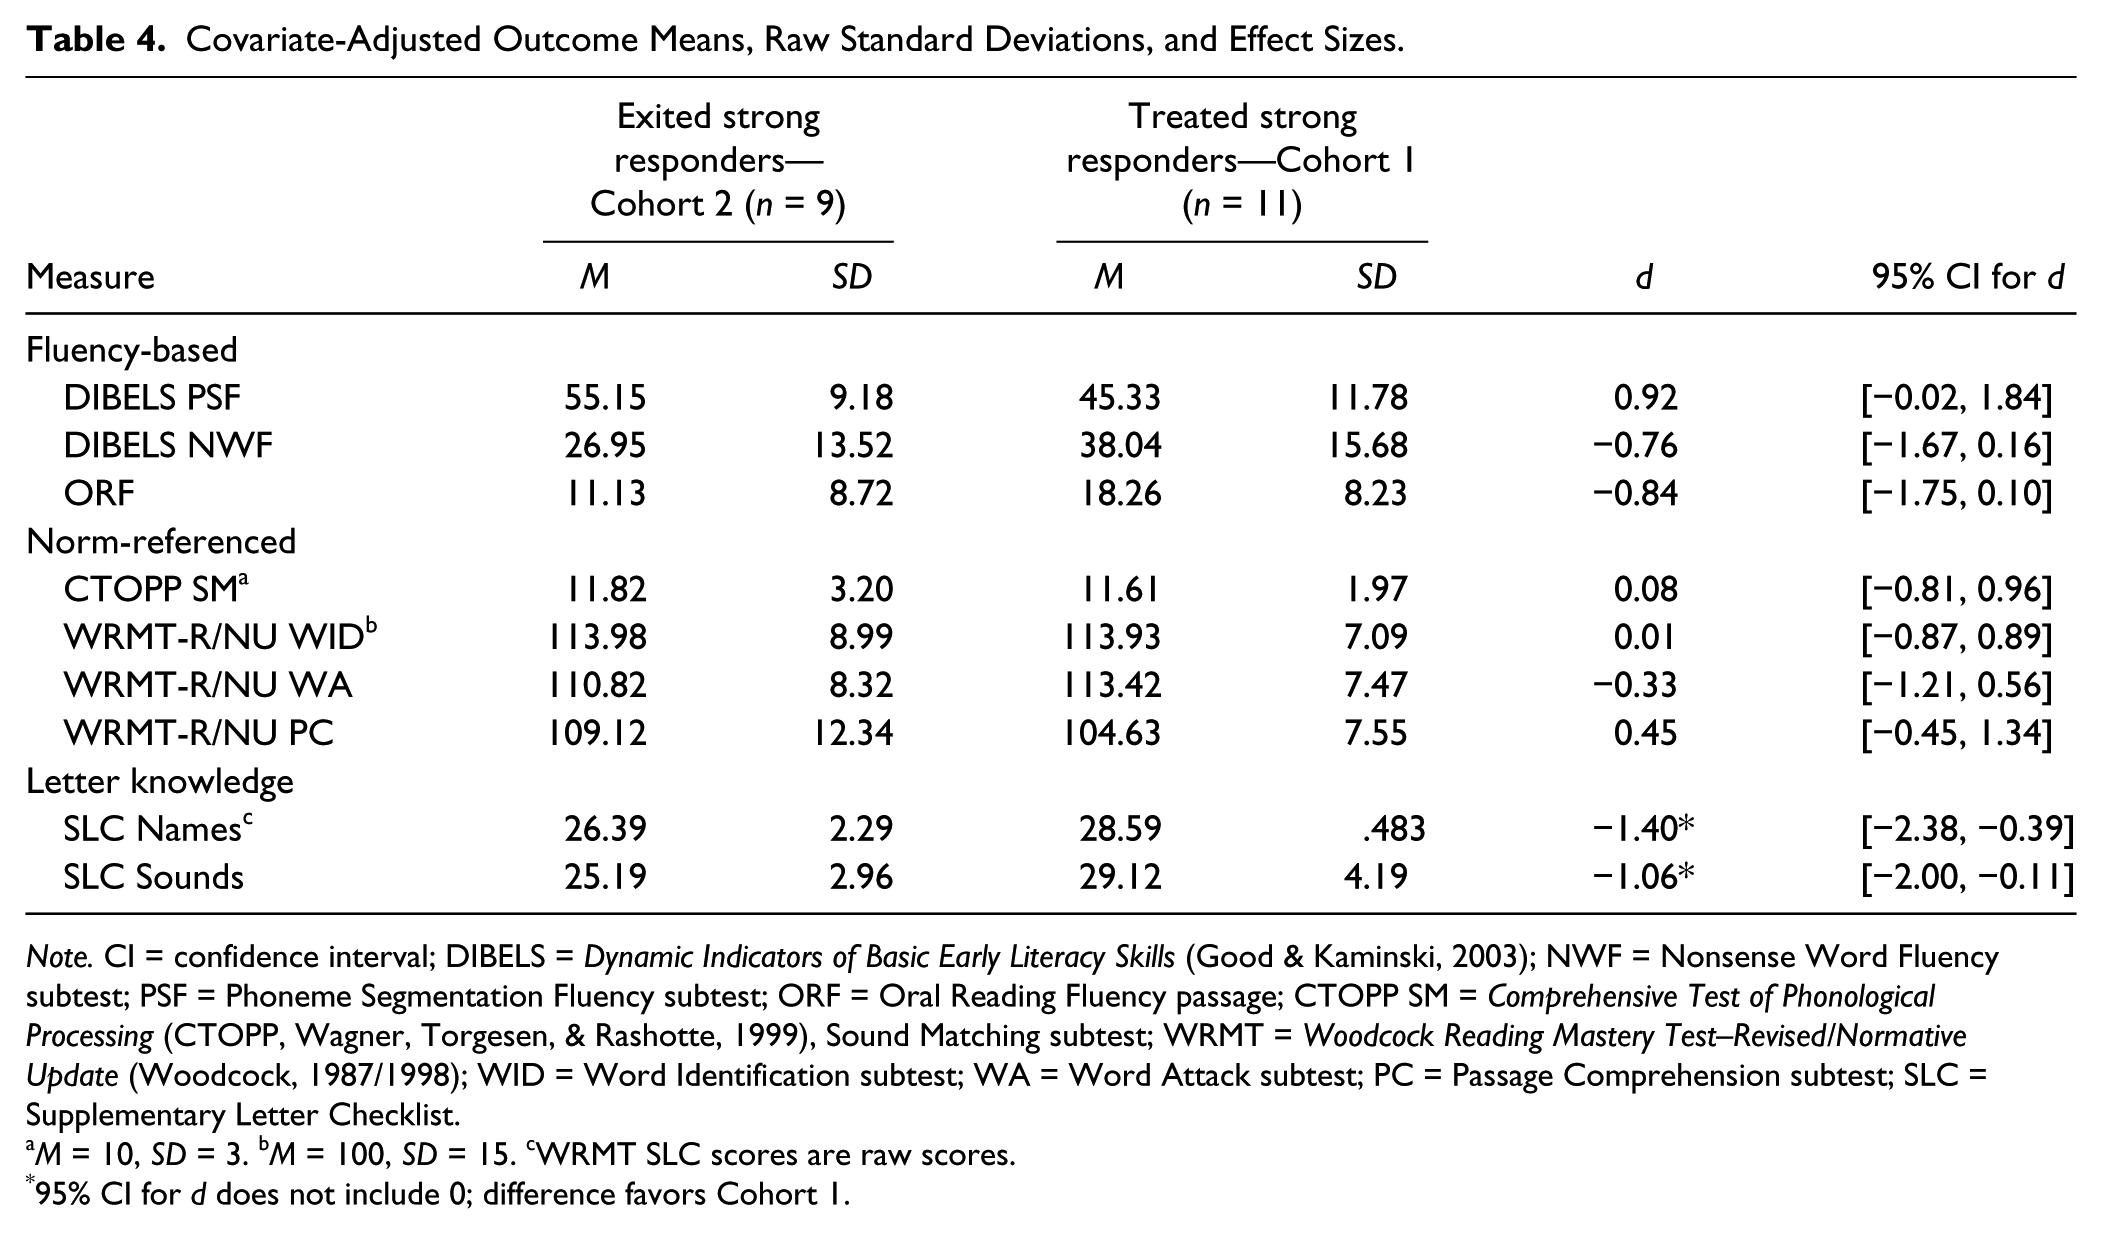
Full descriptive data with covariate-adjusted means are presented in Table 4, including effect sizes and confidence intervals around effect sizes to aid in interpretation.
Covariate-Adjusted Outcome Means, Raw Standard Deviations, and Effect Sizes.
Note. CI = confidence interval; DIBELS = Dynamic Indicators of Basic Early Literacy Skills (Good & Kaminski, 2003); NWF = Nonsense Word Fluency subtest; PSF = Phoneme Segmentation Fluency subtest; ORF = Oral Reading Fluency passage; CTOPP SM = Comprehensive Test of Phonological Processing (CTOPP, Wagner, Torgesen, & Rashotte, 1999), Sound Matching subtest; WRMT = Woodcock Reading Mastery Test–Revised/Normative Update (Woodcock, 1987/1998); WID = Word Identification subtest; WA = Word Attack subtest; PC = Passage Comprehension subtest; SLC = Supplementary Letter Checklist.
M = 10, SD = 3. bM = 100, SD = 15. cWRMT SLC scores are raw scores.
95% CI for d does not include 0; difference favors Cohort 1.
Fluency-based measures
The average scores of the treated strong responders and exited strong responders exceeded the DIBELS spring benchmark score for PSF (35 sounds per minute) and NWF (25 letter sounds per minute). On average, the exited strong responders in Cohort 2 segmented approximately 11 more sounds correctly in 1 min than the treated strong responders in Cohort 1, resulting in an effect favoring the exited strong responders. Mean scores on the NWF measure and Oral Reading Fluency subtest (ORF) measures trended in favor of the treated strong responders in Cohort 1.
Untimed, norm-referenced measures
Mean scores on CTOPP Sound Matching and WRMT subtests Word Identification, Word Attack, and Passage Comprehension were similar across the treated strong responders and the exited strong responders. Average scores for both groups exceeded the 50th percentile across all four measures. Effect sizes ranged from −.33 to .45. On three of the four measures, covariate-adjusted scores trended in favor of the exited strong responders.
Letter name/sound raw scores
Comparison of scores on the untimed letter name and letter-sound identification assessments from the WRMT Supplementary Letter Checklist indicated a statistically significant large effect in favor of the treated strong responders in the Cohort 1 comparison group for letter names, t(18) = 2.71, p = .015. Differences on the letter-sound measure did not reach statistical significance t(18) = 1.83, p = .087. Ceiling effects on this measure likely contributed to small standard deviations and the finding of large effects despite a small mean difference.
Discussion
This study investigated a practical, evidence-based method of identifying kindergarten students with possible false positive reading risk classifications and evaluated the effects of returning those students to Tier 1 general classroom instruction. The first purpose of the analysis was to determine whether students with possible false positive risk classifications would score outside of the high-risk range on reading outcome measures at the end of school year after exiting intervention services. Across all measures, at least eight of the nine exited strong responders scored above the high-risk range. Average levels of performance across all three WRMT-R/NU measures ranged from the 69th to the 80th percentiles. This is a meaningful finding for students who were deemed “at risk” at the beginning of the year. The scores, on average, for these students who were returned to general classroom instruction were well above the 50th percentile.
At the very least, these results are promising in that they suggest that some students with very strong initial mastery of the intervention curriculum can be successfully exited from intervention and still attain reading outcome scores above the high-risk range at the end of the school year. This begins to address a practical question often asked by school personnel: Can we exit this high-achieving intervention student? Again, these results are promising. This small group of high-achieving students was successful in general classroom instruction, and we believe that these data warrant further examination in future studies.
The second purpose was to compare performance of the exited strong responders with treated strong responders in the historical cohort who remained in intervention groups through the academic year. Overall, exited strong responders in Cohort 2 performed competitively with the treated strong responders in the Cohort 1 comparison group. Effect size trends favored the treated strong responders from Cohort 1 on tasks that mimicked those often practiced in the later ERI curriculum lessons but not for more complex reading tasks not directly addressed in the intervention curriculum. On more complex measures of reading skill, the exited strong responders from Cohort 2 showed a small advantage.
Implications for Practice
Findings from this study provide insight for schools using early reading screening measures to assign risk status and select students for intervention groups. First, these results may be particularly relevant for schools with similarly diverse student populations, as 36% of the treated strong responders and 55% of the exited strong responders also spoke a language other than English. While early phonemic awareness measures have been shown to be equally predictive of end-of-kindergarten reading for ELL and English only students (Linklater et al., 2009), results from this study suggest that it may be valuable to monitor ELLs in early reading intervention for potential strong response.
Second, results indicate that some students with very strong initial response to the intervention curriculum may be successfully exited from intervention. The achievement of students returned to general instruction, in the absence of intervention services, suggests that these students may have had false positive risk classifications and that their false positive status was accurately identified through strong initial response to the intervention curriculum.
Previously, schools have been faced with the decision to either include all students meeting risk criteria in early intervention, accepting that some are not truly at risk, or wait until later in the kindergarten year when measures are somewhat more accurate at determining risk (O’Connor & Jenkins, 1999; Torgesen, 1998). The former places undue stress on already limited school resources, and the latter sacrifices critical intervention time. A practical, intervention-based solution to this problem had not previously been examined. While other studies have explored the movement of students in and out of risk status (O’Connor, Harty, & Fulmer, 2005; Simmons et al., 2008), this study ties strong initial intervention response to the problem of false positive risk classifications by demonstrating continued student achievement in the absence of intervention support.
These results are potentially encouraging for schools seeking to exit strong responders from intervention services and certainly warrant additional investigation to see whether the pattern holds true. Perhaps of greater interest is the finding that students who exited intervention achieved similar reading outcomes to their peers who remained in intervention groups for the duration of the academic year. Trends showed that remaining in intervention groups benefited students on measures that closely resembled intervention activities but not on more complex tasks of real word reading. Remaining in the reading intervention reinforced basic reading skills, but it did not translate into higher scores on other reading tasks.
In addition, many schools struggle to provide early intervention services within the confines of financial and staffing limitations. If these results are replicated in future studies, returning strong initial responders to general classroom instruction could reduce intervention group sizes, free space for additional students in need, or decrease the number of staff members required to provide services. Rather than delaying services until screening measures more accurately classify risk so as not to expend resources on students who are not truly in need, schools can provide intervention to all kindergarten students who meet risk criteria at the beginning of the year and likely reduce the resource load after only a few weeks once initial response is documented.
False Positive Risk Classifications
Exited strong responders in Cohort 2 were identified as at risk at the beginning of kindergarten yet scored outside of risk levels on end-of-year outcome measures after exiting intervention. These results suggest that these students may have had false positive risk classifications and lend credibility to the hypothesis that students with false positive risk classifications can be identified through very strong initial responsiveness to intervention. If this result holds true through replications, it provides an intervention-based solution to this measurement problem.
It is important to remember that students received intensive intervention services prior to determining that they might be false positives. It is possible that these students may not have been misclassified. They may have had a true risk for developing reading difficulties but benefited tremendously and immediately from the intervention curriculum. In practice, however, we wonder whether false positives and immediate strong responders to intervention are meaningfully different groups. Both are simply students who look at risk but end up learning appropriately once instructed. Given previous research indicating high false positive rates for kindergarten reading risk classification, it is reasonable to expect that a percentage of students identified for any kindergarten reading intervention will inevitably be inappropriately classified as at risk. Those with immediate strong intervention response are good candidates for consideration, especially when achievement is maintained in the absence of intervention. This study makes the case that very strong initial responders to kindergarten intervention and students with false positive risk classifications are one in the same.
Limitations
Given the exploratory nature of this study, results and conclusions identified here should be interpreted with caution. First, the study addresses reading screening only. It is not clear whether these results would generalize to mathematics, writing, or other academic areas. Second, the sample size in the final analysis is small. Results are generally descriptive in nature. A cohort group design was used to test differences between students who remained in the intervention and those who returned to general classroom instruction. This design is limited by threats to validity through possible differential maturation, selection bias, and history effects. Although additional analyses have been included to help reduce the possibility that these threats underlie the results presented here, there remains a chance that unmeasured variables contributed to the findings.
In addition, the limitations of this design did not allow for control over the content of general classroom instruction. Data confirmed that the core reading curriculum remained the same in six of seven schools across both cohort groups and that more than 90% of classrooms had the same kindergarten teachers; however, daily classroom lessons and fidelity to the core reading curricula were not monitored over the 2 cohort years. Reasonably, differences in general classroom instruction outside of those measured in this study may have had an effect on student end-of-year performance. Replicating this study with randomized assignment to condition would help to resolve this limitation and allow for measurement of additional contributing variables.
Future Directions
Despite the limitations of this study, the findings provide important preliminary answers to the problem of high false positive rates in early kindergarten reading screening. Larger replications of this study in other kindergarten populations and incorporating other intervention curriculums will help to extend the generalizability of these early findings. Furthermore, a randomized control design will be critical for reducing the threat of history effects that may contribute to reading outcome results.
In addition, increasing the size of the student sample in the study will allow for further examination of within-student characteristics that might contribute to false positive risk classifications (e.g., preschool classes, ELL status). More information about what makes average- and high-achieving kindergarten students appear to be at risk will help to clarify decision-making for schools and inform the design of future kindergarten screening batteries.
Schools have true resource limitations that can be affected by delivering unnecessary intervention services to students with false positive risk classifications. Successfully exiting these students could limit unnecessary resource load and allow students who are truly at risk for developing reading difficulties greater access to needed services. Future studies of at-risk kindergarten readers could provide an additional benefit to schools by incorporating attempts to replicate these findings within the larger research design.
Footnotes
Declaration of Conflicting Interests
The author(s) declared no potential conflicts of interest with respect to the research, authorship, and/or publication of this article.
Funding
The author(s) received no financial support for the research, authorship, and/or publication of this article.