
Abstract
The purpose of this study was to compare the results of a regression discontinuity design (RDD) with those of an experimental design of a tiered vocabulary intervention for children at risk for reading disability to determine RDD’s feasibility as a research methodology for this type of study. Researchers reanalyzed an archival dataset of a previous study that determined the effectiveness of the intervention through a randomized experiment. Results were comparable for the receptive outcome scores in direction, magnitude, and significance, although the magnitude of the treatment effect for the RDD was slightly higher. Results were also comparable for contextual outcome scores with respect to direction and magnitude. We present possible reasons for the different results between studies, limitations, and future research.
A recent trend in education is tiered instruction, in which young students who do not respond to quality instruction in the general education classroom receive more intensive instruction in smaller groups. Researchers have identified tiered instruction, commonly referred to as response-to-intervention (RTI), as one way to address deficits in young readers who are at risk for reading failure (Fuchs & Fuchs, 2006) and deficits in classroom instruction. As researchers begin to study tiered vocabulary interventions for at-risk readers, randomized experiments tend to be the gold standard methodology (e.g., Coyne, McCoach, & Kapp, 2007; Pullen, Tuckwiller, Konold, Maynard, & Coyne, 2010). However, one quasi-experimental research design, regression discontinuity design (RDD), is a promising alternative to the randomized experiment that suits research in tiered instruction very well.
RDD is a quasi-experimental research design that eliminates the need for a control group (Trochim, 2001, 2006). When using this design, researchers assign participants to treatment and comparison groups based on a cutoff score on a preprogram measure or assignment variable (Trochim, 2001, 2006). Although RD designs have less statistical power compared with randomized experiments with the same sample size (Trochim, 2006), the likelihood of school administrators and teachers allowing researchers to study within their schools and classrooms is much more likely with an ethical design such as RDD, one in which all students who are in need of an intervention or treatment receive it. When researchers use randomized experiments in school settings, the requirement of having a control group means that treatment is withheld from students who could potentially benefit from it.
RDD also serves as a solution to another problem educational researchers face when targeting at-risk populations: sample size (Cappelleri & Trochim, 2003). Special education researchers are often limited to groups of students with specific disabilities or who are deemed at risk of academic difficulties based on some measure of achievement. With randomized experiments, sample sizes are split into half, leaving the control group without treatment. However, by using a RDD, researchers can provide treatment to all participants in the target population and use their peers without disabilities or who are not at risk as the comparison group.
RDD
Randomized experiments hold the “gold standard” mark of approval among educational researchers and have done so for several years (Walters, Lareau, & Ranis, 2009). In fact, the Institute of Educational Sciences, along with other groups, asserts that randomized experiments should be used whenever possible (Walters et al., 2009). However, educational and other applied researchers also recognize that randomized experiments are frequently not feasible. Walters et al. (2009) cite several instances for which this could be the case, including political and organizational considerations and the costs associated with such a design.
In its basic form, RDD is a two-group pretest–posttest design (Trochim, 2001, 2006). A cutoff value on the preprogram measure determines whether participants are part of the treatment group or comparison group (Schochet et al., 2010; Trochim, 2001, 2006). Only those participants deemed in need of treatment, based on the preprogram measure, receive it. In RDDs, the treatment effect is determined by discontinuity in the regression line at the cutoff point of the preprogram measure (Trochim, 2001, 2006). In addition, as long as the assignment process (i.e., forcing variable used as cutoff) is followed perfectly, the results are “an unbiased estimate of the treatment effect” (Cappelleri & Trochim, 2003, p. 5).
RDDs do, however, have some limitations when compared with randomized experiments. One important limitation, and something to keep in mind when using this design, is that RDDs are not as efficient (Walters et al., 2009). Statistical power is less for RDDs than for randomized experiments (with the same sample size). The cause for this is the high probability that the covariate and the dummy variable for treatment are correlated (Walters et al., 2009). This increases the treatment effect estimate’s standard error. An important caveat is that all RDDs are not the same and methods for calculating treatment effects depend upon many variables such as sample size and level of adherence to the design’s major assumptions.
Historically, RDDs have been used in the social sciences and can most often be found in program evaluation studies (Cappelleri & Trochim, 2003). Interestingly, this design was independently “discovered” by many researchers across various fields of expertise (Cook, 2008). Thistlethwaite and Campbell (1960) were the first to publish a study using a RDD and were interested in its feasibility compared with that of ex-post facto designs using data from a national scholarship competition (Cook, 2008; Imbens & Lemieux, 2008). Several other studies of psychology and education followed Thislethwaite and Campbell’s original work, as well as entries in methodological and statistics textbooks and one book devoted solely to the design (i.e., Cook, 2008; Trochim, 1984). RDDs also began appearing in Economics journals in the early 1970s (e.g., Cain, 1975; Cook, 2008).
In recent years, there has been resurgence in the use of RDDs by researchers to answer their questions and determine effectiveness of various educational programs (Rumrill, Cook, & Wiley, 2011). RDDs have several benefits that other quasi-experimental designs do not. Arguably most important, RDDs do not suffer the threats to validity of other quasi-experimental designs (Rumrill et al., 2011). Furthermore, special educators address problems that fit well with this design (Rumrill et al., 2011). In special education, students receive interventions to address their areas of academic weakness. With the requirement of using a cutoff score when using RDDs, this is a natural way to study the effectiveness of interventions for students with disabilities. This design allows for a more natural investigation of an intervention in a real, rather than contrived, setting. Furthermore, an advantage of RDD is that there is no need to withhold treatment for the students who need it most.
Educational Research Using RDDs
Several researchers have used the RDD to test the effectiveness of educational programs and policies (e.g., Jacob & Lefgren, 2004; Lesik, 2007; Ludwig & Miller, 2007; Wong, Cook, Barnett, & Jung, 2008). The design is attractive for larger datasets with naturally occurring cutoffs that can be applied as the forcing variable in RDD. Wong et al. used a RDD to evaluate five state prekindergarten programs in Michigan, New Jersey, Oklahoma, South Carolina, and West Virginia. Because each of these states uses a birthday cutoff to determine pre-K program eligibility, Wong and colleagues were easily able to apply a RDD comparing children in a small bandwidth around that cutoff on outcome measures of school readiness (i.e., vocabulary, math, and print awareness). Their study serves as a methodological exemplar for the use of RDDs within education and other fields.
Ludwig and Miller (2007) used a RDD to determine the effect of Head Start funding on long-term student outcomes. During Head Start’s initial launch in 1965, the Office of Economic Opportunity provided technical assistance to the country’s 300 poorest counties in developing their proposals, 80% of which received funding (much higher than the national average of 43% during that year; Ludwig & Miller, 2007). Ludwig and Miller were able to exploit this variation as the assignment variable for their RDD. Jacob and Lefgren (2004) were interested in the effects of summer school and grade retention on low-achieving third- and sixth-grade students’ performance on state standardized accountability tests. They had data for 147,894 students in the Chicago Public Schools from 1997 to 1999. Using testing dates (i.e., June and August) as the cutoff to determine whether students were retained and/or received summer school services, Jacob and Lefgren were able to determine the program’s effect on reading and mathematics scores for the following school year.
These studies illustrate how RDDs can successfully be implemented with data from education programs. Although limitations are present, the benefits of this design have proved useful for intervention research.
Reading Intervention Research Using RDDs
Within the special education field, researchers are beginning to use RDDs to measure effects of interventions such as with RTI studies (e.g., Tuckwiller, Pullen, & Coyne, 2010; Vaughn et al., 2009). Tuckwiller and her colleagues explored the feasibility of using RDD for tiered vocabulary instruction. They used students’ scores on the Peabody Picture Vocabulary Test (PPVT-4) as the cutoff to determine which students were at risk of reading failure and needed an additional tier of instruction on selected vocabulary words from shared storybook reading beyond the general education lessons. Based on posttreatment measures of target vocabulary, they found that the second tier of instruction was not a significant predictor of outcome variables, with the grouping variable in their model only accounting for 2% of the variance in their posttreatment measures. They did observe a discontinuity in the regression line, suggesting a treatment effect. Apparently, their study did not have enough power to show significant effects with the RDD. Similar studies with larger sample sizes may produce different results.
Vaughn et al. (2009) also used a RDD to test the effectiveness of a tiered model of reading instruction. As part of a larger, longitudinal study, they were interested in whether a more intensive tertiary tier of reading instruction would improve reading outcomes for second-grade students who were lower responders for a secondary tier of instruction. They used oral reading fluency (ORF) scores as the cutoff variable. Vaughn et al. measured five outcome measures (i.e., Dynamic Indicators of Basic Early Literacy Skills ORF; Woodcock Reading Mastery Tests—Revised Word Attack [WA], Word Identification [WI], and Passage Comprehension [PC] subtests; Social Skills Rating System—Academic Competence subtest; and PPVT–3rd ed.). They did not find any significant main effect of the tertiary intervention on ORF, WA, PC, and WI. They did, however, find a significant negative effect on Academic Competence. Furthermore, they found interaction effects for PC and WI. Similarly to Tuckwiller et al. (2010), small sample sizes could have been a notable cause for the lack of significant main effects. The sample sizes in Vaughn and colleagues’ study were even smaller than those in Tuckwiller et al. (2010).
These two intervention studies (i.e., Tuckwiller et al., 2010; Vaughn et al., 2009) demonstrate the potential for using RDDs in the field of special education. Although limitations are evident in each study, as is the case in the research process, they might be the seminal studies that support further using RDDs in intervention research. Taken together, these studies may serve as a springboard to advance the use of RDD in the field of special education.
Comparing RDDs With Randomized Experiments
Due to RDD’s potential as a predictor of treatment effects and the fact that it can detect effects without the use of a control group, researchers have begun to empirically compare RDDs with randomized experiments (Aiken, West, Schwalm, Carroll, & Hsuing, 1998; Berk, Barnes, Ahlman, & Kurtz, 2010; Black, Galdo, & Smith, 2007; Buddelmeyer & Skoufias, 2004; Shadish, Galindo, Wong, Steiner, & Cook, 2011). When comparing results from a RDD study of college remedial courses with a randomized experiment of the same program, Aiken et al. found the direction of treatment effects to be similar for both studies; however, the magnitude of treatment effects was not consistent across variables. Buddelmeyer and Skoufias compared results from a RDD study and a randomized experiment, testing the effects of a poverty alleviation program in Mexico on school attendance and participation in work-related activities, with exceptionally large sample sizes (around 10,000). They found discordant results between the two designs. Where there were significant effects in the randomized experiment, the RDD showed none. One limitation of these comparisons was that neither tested for significance when comparing the treatment effects from one design to the other.
Other researchers have actually tested the statistical significance of treatment effects between outcomes from comparable randomized experiments and RDDs. Black et al. (2007) embedded a randomized experiment into a RDD study of a reemployment services system on annual earnings and unemployment benefits. Unlike Aiken et al. (1998) and Buddelmeyer and Skoufias (2004), Black and colleagues tested the significance of the difference in treatment effects between the randomized experiment and the RDD. They tested more than one method of treatment effect estimation (both parametric and nonparametric) within their RDD against the effects of the randomized experiment and found similar results between the two designs. Black et al. determined differences in estimation methods in their RDD as compared with the randomized experiment. Berk et al. (2010) also tested the significance of differences in treatment estimates in their comparison of a RDD and a randomized experiment. They used data from a reduced parole program to determine its effect on risk of recidivism of former inmates. Although participants in the randomized experiment were not as at risk of recidivism as participants in the RDD, Berk et al. found that the RDD replicated the results of the randomized experiment in magnitude, direction, and significance. Furthermore, results from each of the designs were not statistically different from one another showing that, in this case, the two designs were comparable in answering the same research question.
Although the previous two studies (i.e., Berk et al., 2010; Black et al., 2007) tested statistical significance of the differences in treatment effects for RDDs and randomized experiments, some limitations still exist. Shadish et al. (2011) recognized the importance of having two separate teams of researchers analyze the results from the two designs independently to avoid inadvertently skewing the results to increase the likelihood of one design’s outcomes replicating the other. With this in mind, they designed a highly controlled comparison study of a RDD and a randomized experiment in which participants were randomly assigned to one design or the other. To adjust for power issues (see Note 1), they assigned more participants to the RDD (n = 380 after minimal attrition) than to the randomized experiment (n = 189 after minimal attrition). After independent analysis of each experiment (RDD and randomized experiment), they compared the findings statistically using eight exploratory analyses. They found that the two designs were comparable in most respects. Their analyses yielded similar effect sizes, showing that RDDs approximate treatment effects from randomized experiments fairly well, with significant differences in results between the two designs on the vocabulary-dependent variable for only three of the eight analyses.
To determine RDD’s role in intervention research, more within-study comparisons specific to educational interventions are needed. The present study serves to add to this body of research.
Present Study
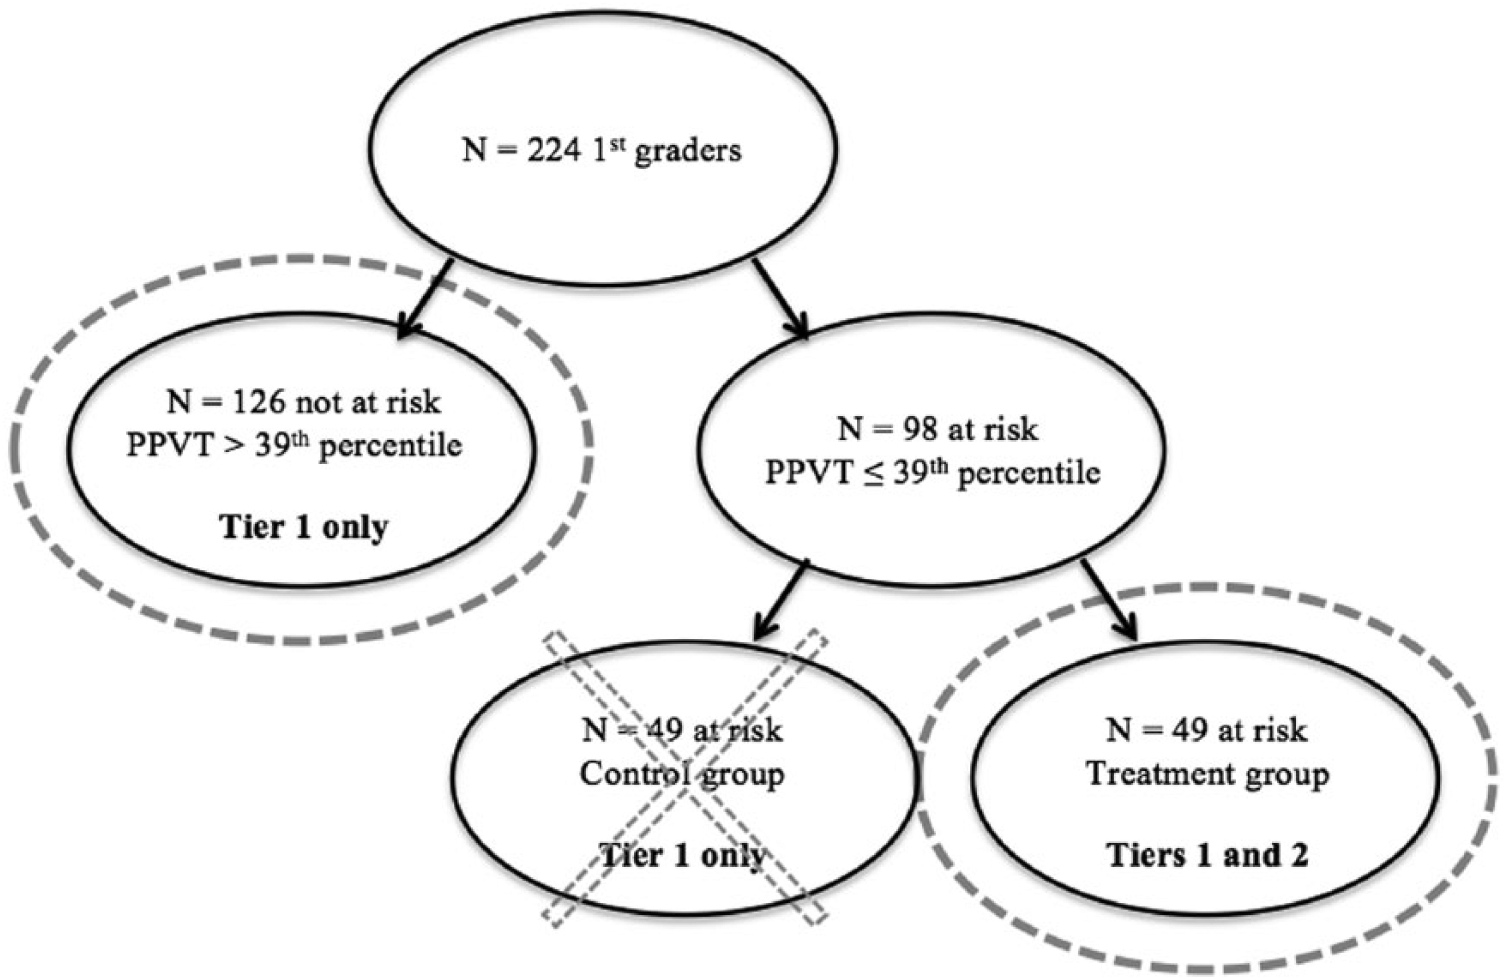
There are presently no within-study comparisons of RDD versus randomized experiment in the reading literature. We define a within-study comparison as one in which different analyses are completed using the same data to determine whether the findings are comparable with each design. The aim of the present study was to determine whether RDD can be useful when studying an increasingly important and timely question: the effectiveness of tiered vocabulary interventions in which students who are at risk of reading failure receive additional instruction in a small group format. We believe that findings could be generalized to tiered interventions in any content area. Accordingly, we compare our results from a RDD analysis of archival data from Pullen and colleagues’ (2010) analysis of the same dataset, specifically comparing direction, magnitude, and statistical significance. Pullen and colleagues used a randomized experiment to determine the effectiveness of a tiered vocabulary intervention in which they randomly assigned students who were at risk of reading or language difficulties to either a treatment or a control group. They also had a comparison group of students who were not at risk. For the present study, we eliminate the control group to use a RDD and, subsequently, compare our results with those of the original study (see Figure 1).
Sample.
Pullen and Colleagues’ Study
Data used to answer the current study’s research questions were collected in an intervention study during the 2007–2008 school year (see Pullen et al., 2010). Pullen and colleagues used a tiered intervention to teach target vocabulary from shared storybook readings to first-graders at risk for reading disability and language difficulties. Students who were deemed at risk were randomly assigned to either a treatment or a control group (see Figure 1). The study took place in first-grade classrooms from three elementary schools in a medium-sized school district. They strategically chose these schools based on district-level recommendations for their ethnic and socioeconomic diversity.
Pullen et al. (2010) used a randomized design for the original study. For demographic information, see Pullen et al. Of their sample, students who received scores below the 39th percentile on the PPVT-4 served as the at-risk group, and those with scores at or above the 39th percentile were considered not at risk. They determined the cutoff percentile based on Reading First criteria (Jackson et al., 2007). They randomly assigned the 98 students who were deemed at risk to either the treatment or the control group. They also assessed expressive knowledge of the target vocabulary words that were to be taught in the tiered lessons prior to the intervention. For posttreatment measures, they assessed target word knowledge at three levels: expressive, contextual, and receptive. For more information on the pre- and posttreatment measures and an in-depth description of the intervention, see Pullen et al. (2010).
Summary of Findings
Pullen and colleagues (2010) used a multivariate analysis of variance (MANOVA), Roy-Bargman step-down analyses, and planned contrasts to analyze their data. They compared the three groups of students on the combined posttest measures (i.e., expressive, contextual, and receptive vocabulary measures) at the end of the intervention period and 4 weeks later (delayed posttest). For data collected immediately following the intervention, they found statistically significant between-group differences on measures of receptive and contextual vocabulary, but not on measures of expressive vocabulary. In each instance, the at-risk treatment group outperformed the at-risk control group, and the not-at-risk group outperformed the at-risk treatment group. Similarly, for delayed posttest data, they found significant differences between the not-at-risk and at-risk treatment groups on receptive and contextual vocabulary knowledge, with the not-at-risk group performing better than the treatment group. They did not find significant differences in delayed posttest scores for the at-risk treatment and at-risk control groups. They also calculated effect sizes using data from the two at-risk groups (i.e., treatment and control) and found that the immediate effect of treatment was moderate and the effect 4 weeks after treatment was small to moderate.
Method
In the present study, a replication of Tuckwiller and colleagues’ (2010) study, we eliminated the control group from the analyses to utilize a RDD. We were only interested in the group of students who were not at risk for reading failure (n = 118) and those from the at-risk group who actually received treatment (n = 45; see Figure 1; also see Note 2) from Pullen et al.’s (2010) study.
Research Design
The analyses that RDD requires are appropriate for use with Pullen and colleagues’ (2010) dataset. The fact that Pullen et al. strictly adhered to a cutoff score on the PPVT-4 (Dunn & Dunn, 2007) to determine whether students were at risk of reading failure provides a unique opportunity for the use of a RDD for additional analyses and creates the ability to evaluate the use of RDDs in educational intervention research against the more popular randomized experiment. PPVT-4 scores serve as the assignment variable for this study, creating a treatment group of students who are at risk for reading failure and a comparison group of students not at risk who do not receive treatment.
With access to the original hard documents and the electronic database file (Pullen et al., 2010), we spot checked 20% of the data to ensure that it was entered accurately into the database; we randomly pulled 20% of the original student folders and checked their scores against those in the database.
Data Analysis
We used a RDD to predict treatment group participants’ immediate posttest scores using the functional relationship between the comparison group participants’ pretest and immediate posttest scores. When using a RDD, prior to data analysis, one must examine the assumptions underlying a RD model: (a) The cutoff score must be strictly followed when assigning participants to groups, (b) the relationship between pre- and posttest scores must be describable as a polynomial function, (c) the comparison group sample must be large enough to adequately predict the regression line, (d) participants from both groups must come from the same continuous preprogram distribution, and (e) the intervention must be delivered consistently for all participants (Schochet et al., 2010; Trochim, 2006).
After analyzing the assumptions, the next step is determining the best model for the data. The modeling strategy must minimize bias and maximize efficiency of the estimates (Trochim, 2006). Ideally, the model would be true to life. However, potential error in the data makes it nearly impossible for researchers to determine a true model. The best way to achieve the model with the least amount of bias while still maintaining efficiency is to start with an overspecified model. Trochim recommends beginning with a model that includes two polynomial terms higher than what is determined by the visual test (including interaction terms). The resulting model likely provides an unbiased estimate of the treatment effect; however, efficiency suffers making it more difficult to reach statistical significance due to “noise” from the additional terms. The next steps refine the model by removing the higher-order terms one by one until reaching efficiency. One removes terms when their coefficients and those of their interaction terms are insignificant (i.e., p < .05). Each time a term is removed, the researcher checks the respecified model. The model reaches efficiency when error is minimized without much resulting change in the treatment effect. When efficiency is achieved, the grouping variable’s coefficient is the estimate of the treatment effect, and the associated t-test values, along with visual tests of polynomial regression plots, provide information on whether the effect is statistically significant.
The notation we used in the analyses is as follows: Y represents the outcome variable, in this case the total posttest scores and the subtest scores for expressive, contextual, and receptive target word knowledge; X represents the preprogram measure, adjusted PPVT-4 scores; and Z is a dummy code representing group assignment. Prior to the analyses, we calculated adjusted PPVT-4 scores by subtracting 96, the standard score at the 39th percentile, from all the standard scores. Using adjusted scores allowed us to graph and analyze the outcome variables with the PPVT-4 cutoff centered on 0.
One can also use a RDD to determine whether there are significant group differences on a number of covariates at the cutoff. Although there may be mean differences in groups on each of these variables, in a RDD, we need to only determine that there are no significant differences at the cutoff after modeling the appropriate functional relationship. Treatment effects are analyzed at the cutoff point in RDDs, and therefore effects of covariates are also determined in the same manner.
We tested the significance of several covariates using a RDD approach to determine whether the treatment group and comparison group differed at the cutoff. For this analysis, we separately regressed six covariates (i.e., gender, ethnicity, disability status, gifted status, speech therapy status, and English for speakers of other languages [ESOL] services status) on adjusted PPVT scores with both quadratic and linear models. We found no significant differences in groups at the cutoff for any of the six covariates.
RDD and Randomized Experiment Comparison
To answer the main research question of this study, the researchers compared treatment effects from the present study with those of Pullen and colleagues’ (2010) study. We examined three criteria to determine whether the RDD was comparable with a randomized experiment: (a) direction of treatment effects, (b) magnitude of treatment effects, and (c) statistical significance of treatment effects.
Results
RDD
The data used for the present study met the five underlying assumptions of a RDD. Researchers analyzed posttest data as a total and then separately analyzed each subtest of vocabulary knowledge (receptive, contextual, and expressive). The next step is determining the best model for the data. The modeling strategy must minimize bias and maximize efficiency of the estimates (Trochim, 2006).
Total posttest scores
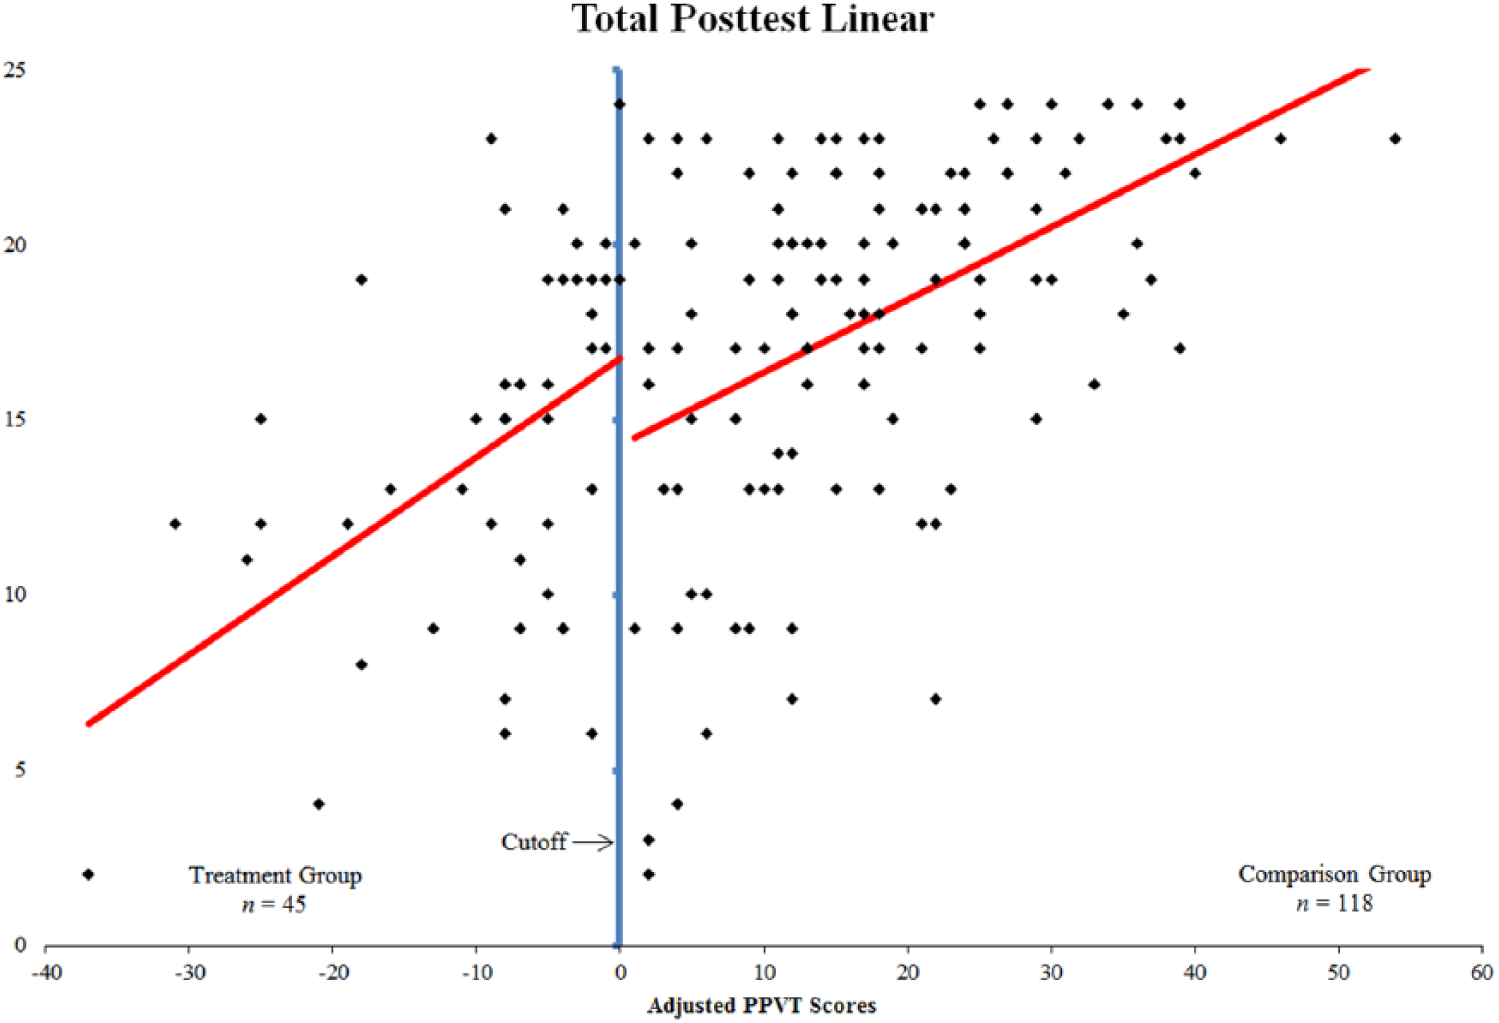
The scatterplot of the total posttest scores suggested a linear relationship between total posttest scores and the adjusted PPVT-4 scores. Trochim (2006) recommends first testing a model two degrees higher than what is observed in the visual test. Therefore, we first tested a quadratic relationship between total posttest and PPVT. We created a second-order term by squaring the PPVT adjusted scores (X2). We also created interaction terms for both the linear and quadratic terms by multiplying each of them by the dummy variable for group assignment (XZ and X2Z, respectively). We then regressed total posttest scores (Y) on the assignment variable (Z), adjusted PPVT scores (X), the quadratic term (X2), and the two interaction terms (XZ and X2Z). The resulting model was statistically significant, F(5, 157) = 13.830, p < .001. The resulting coefficients for the assignment variable and the PPVT scores were also statistically significant.
Next, we removed the quadratic term and its accompanying interaction term from the model, since neither was statistically significant. The resulting model was also statistically significant, F(3, 159) = 22.269, p < .001. In this model, coefficients for both the assignment variable and the adjusted PPVT scores were statistically significant.
Both the quadratic model and the linear model accounted for approximately 30% of the variance of total posttest scores with only a 1% difference separating them (R2quadratic = .306, R2linear = .296). Therefore, we chose to interpret the results from the linear model due to its higher efficiency. The treatment effect is illustrated in Figure 2 by the discontinuity in the regression line at the cutoff. The coefficient of the assignment variable, which is statistically significant, provides the estimated treatment effect (see Table 1). Students in the treatment group performed approximately 2.5 points (SD = 1.25) higher, on average, after receiving Tier 2 of the treatment than would be predicted had they only received Tier 1 instruction in the general education classroom. In addition, we calculated an effect size using the treatment effect in the numerator and the standard deviation of the comparison group in the denominator. The resulting effect size was 0.497, which was a moderate effect.
Linear regression line over total posttest scores.
Coefficient Tables.

Note. PPVT = Peabody Picture Vocabulary Test.
Receptive level of vocabulary knowledge
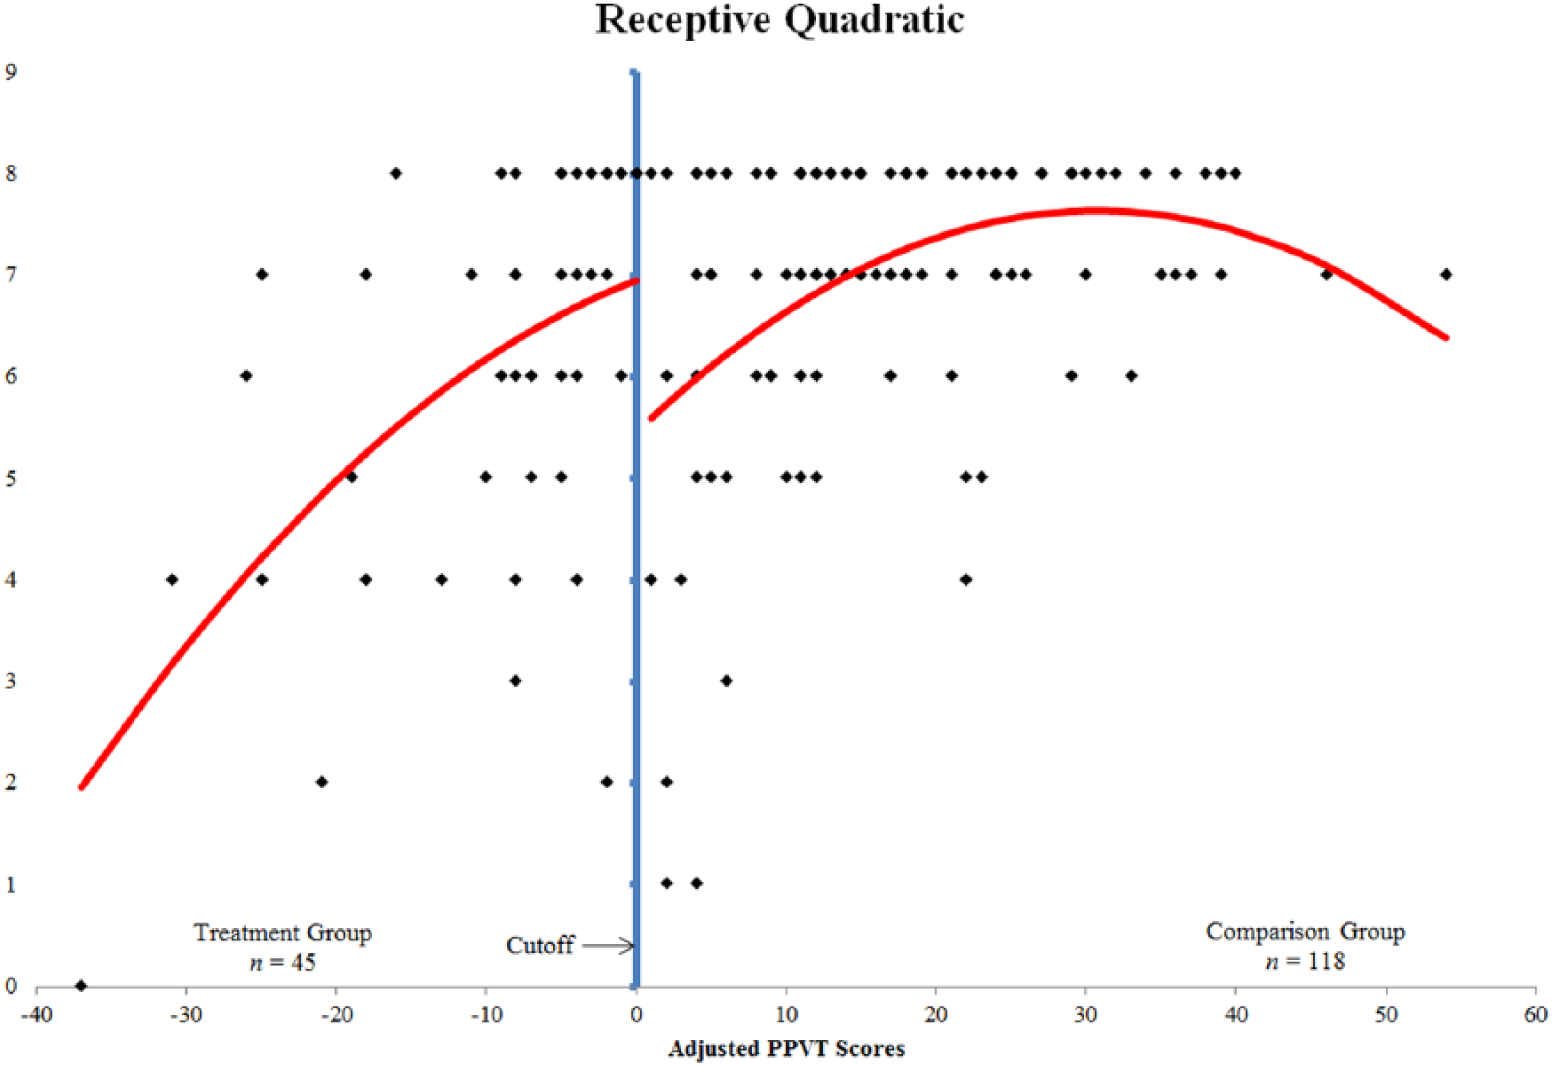
Through a visual analysis of the scatterplot of the receptive subtest scores, we determined that a ceiling effect existed that caused the relationship to be nonlinear. Following the same process as with total posttest scores, we began by testing a cubic relationship. We regressed receptive vocabulary posttest scores (Y) on the assignment variable (Z), adjusted PPVT scores (X), the quadratic term (X2), the cubic term (X3), and the three interaction terms (XZ, X2Z, and X3Z). The resulting model was statistically significant, F(7, 155) = 9.672, p < .001. The resulting coefficients for the assignment variable, PPVT scores, and the quadratic interaction term were also statistically significant. In addition, the coefficients for the quadratic term and the cubic interaction term were nearing significance. We then tested the quadratic model, which was also statistically significant, F(5, 157) = 11.898, p < .001. In addition, coefficients for the assignment variable, adjusted PPVT scores, and the quadratic term were statistically significant.
Through a visual analysis and comparison of the standard errors for the cubic and quadratic models, we chose to interpret the quadratic model that accounted for approximately 28% of the variance of receptive posttest scores (R2 = .275). The treatment effect is illustrated in Figure 3 by the discontinuity in the regression line at the cutoff. The coefficient of the assignment variable, which is statistically significant in the quadratic model, provides the estimated treatment effect. Students in the treatment group performed approximately 1.5 points better, with a standard error barely above 0.5 of a point, after receiving Tier 2 of the treatment than would be predicted had they only received Tier 1 instruction in the general education classroom (see Table 1). In addition, we found a large effect size of 1.048 for receptive posttest scores.
Quadratic regression line over receptive posttest scores.
Contextual level of vocabulary knowledge
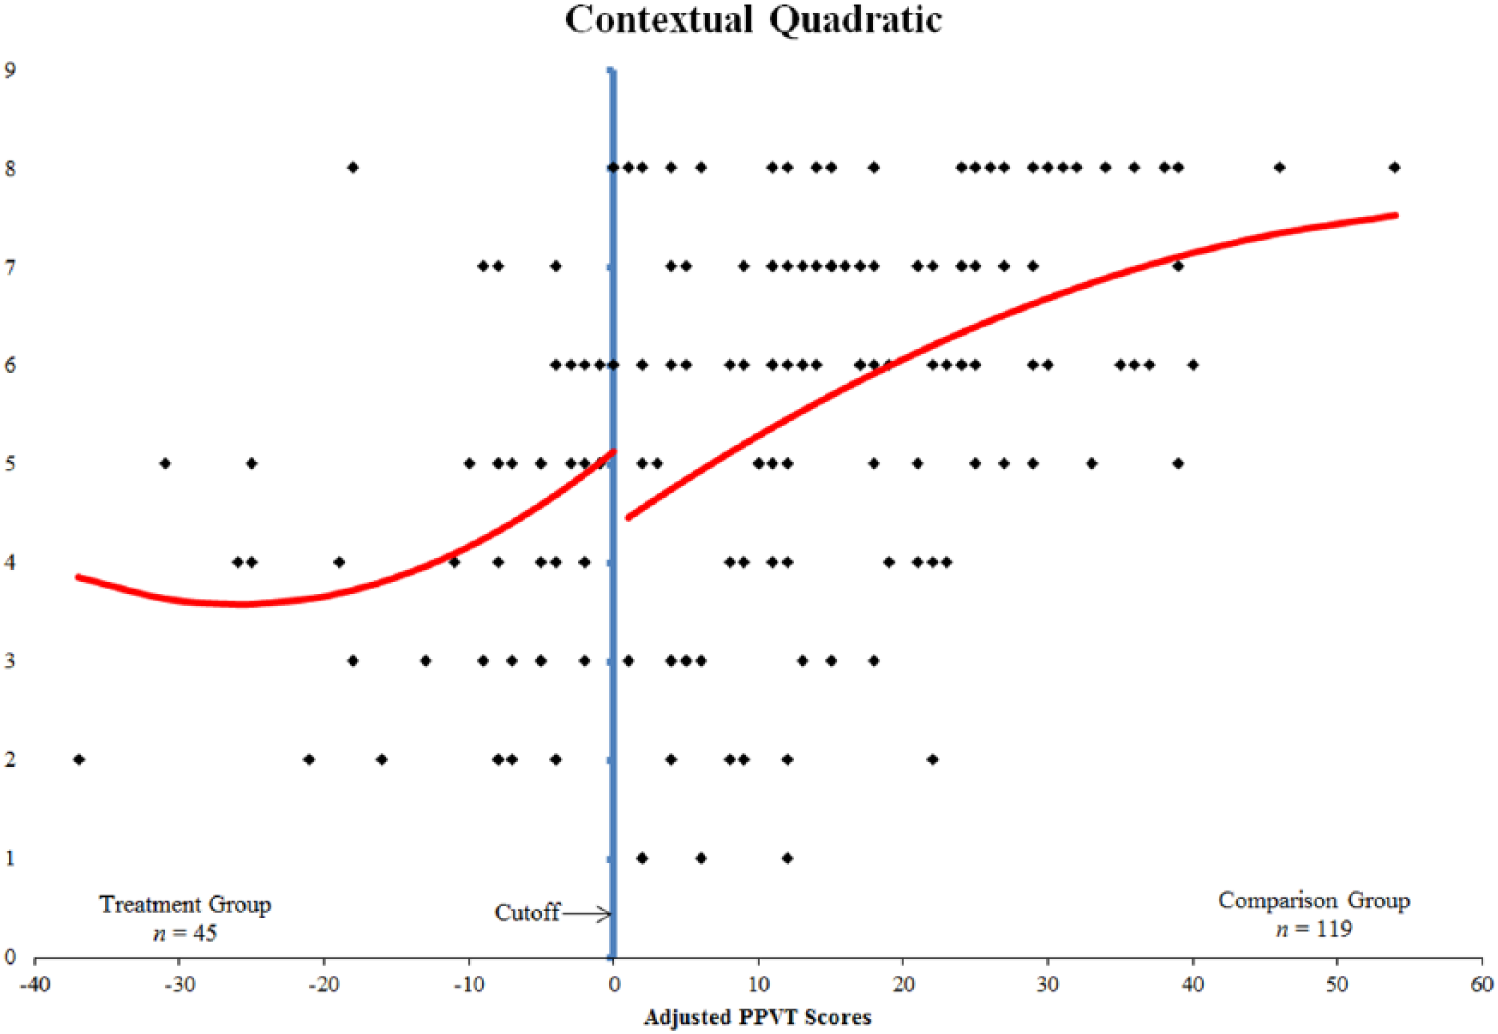
The scatterplot of the contextual posttest scores suggested a linear relationship between total posttest scores and the adjusted PPVT-4 scores. Therefore, we first tested a quadratic relationship between contextual posttest scores and PPVT. The resulting model was statistically significant, F(5, 158) = 9.637, p < .001. The coefficient for PPVT scores was also statistically significant. However, the treatment effect was not significant (see Table 1).
Since the coefficients for the quadratic term and its interaction term were not significant, we removed both of them from the model. The resulting model was statistically significant, F(3, 160) = 15.737, p < .001. In this model, the coefficient of the adjusted PPVT scores was statistically significant, but the estimated treatment effect was not. Similarly, a visual analysis of the regression line reveals very little discontinuity at the cutoff, but the slopes of the regression lines on each side of the cutoff are slightly different. Based on this observation, the quadratic model is a better fit for the contextual measure. Even though the treatment effect was not significant in the quadratic model, a visual analysis reveals a slight discontinuity at the cutoff, which shows that the treatment was beneficial (see Figure 4). The lack of significance may be due to the fact that RDDs have less statistical power than randomized designs (Schochet et al., 2010; Trochim, 2006). Although results were insignificant, we found a moderate effect of 0.407.
Quadratic regression line over contextual posttest scores.
Expressive level of vocabulary knowledge
The scatterplot of expressive posttest scores suggested a linear relationship between scores of the expressive vocabulary measure and the adjusted PPVT-4 scores (see Figure 5). Therefore, we first tested a quadratic relationship between expressive posttest and PPVT. The resulting model was statistically significant, F(5, 158) = 13.798, p < .001. The coefficients for the assignment variable and the PPVT scores were also statistically significant. The quadratic term and its interaction term were not statistically significant. As with the other levels of vocabulary knowledge, we then tested a linear model. The resulting model was also statistically significant, F(3, 160) = 22.696, p < .001. Coefficients for both the assignment variable and the adjusted PPVT scores were statistically significant. Both the quadratic model and the linear model accounted for approximately 30% of the variance of total posttest scores with less than a 1% difference separating them (R2quadratic = .304, R2linear = .299). In comparing the coefficient and standard error for the assignment variable (i.e., treatment effect) in each model, we determined that the linear model was more efficient and chose to interpret it, as opposed to the quadratic model (see Table 1). The treatment effect is illustrated in Figure 5 by the discontinuity in the regression line at the cutoff. The coefficient of the assignment variable, which is statistically significant, provides the estimated treatment effect. Students in the treatment group performed approximately 1.2 points (SD = 0.53) higher after receiving the Tier 2 intervention than would be predicted had they only received Tier 1 instruction in the general education classroom. In addition, we found a moderate effect of 0.565.
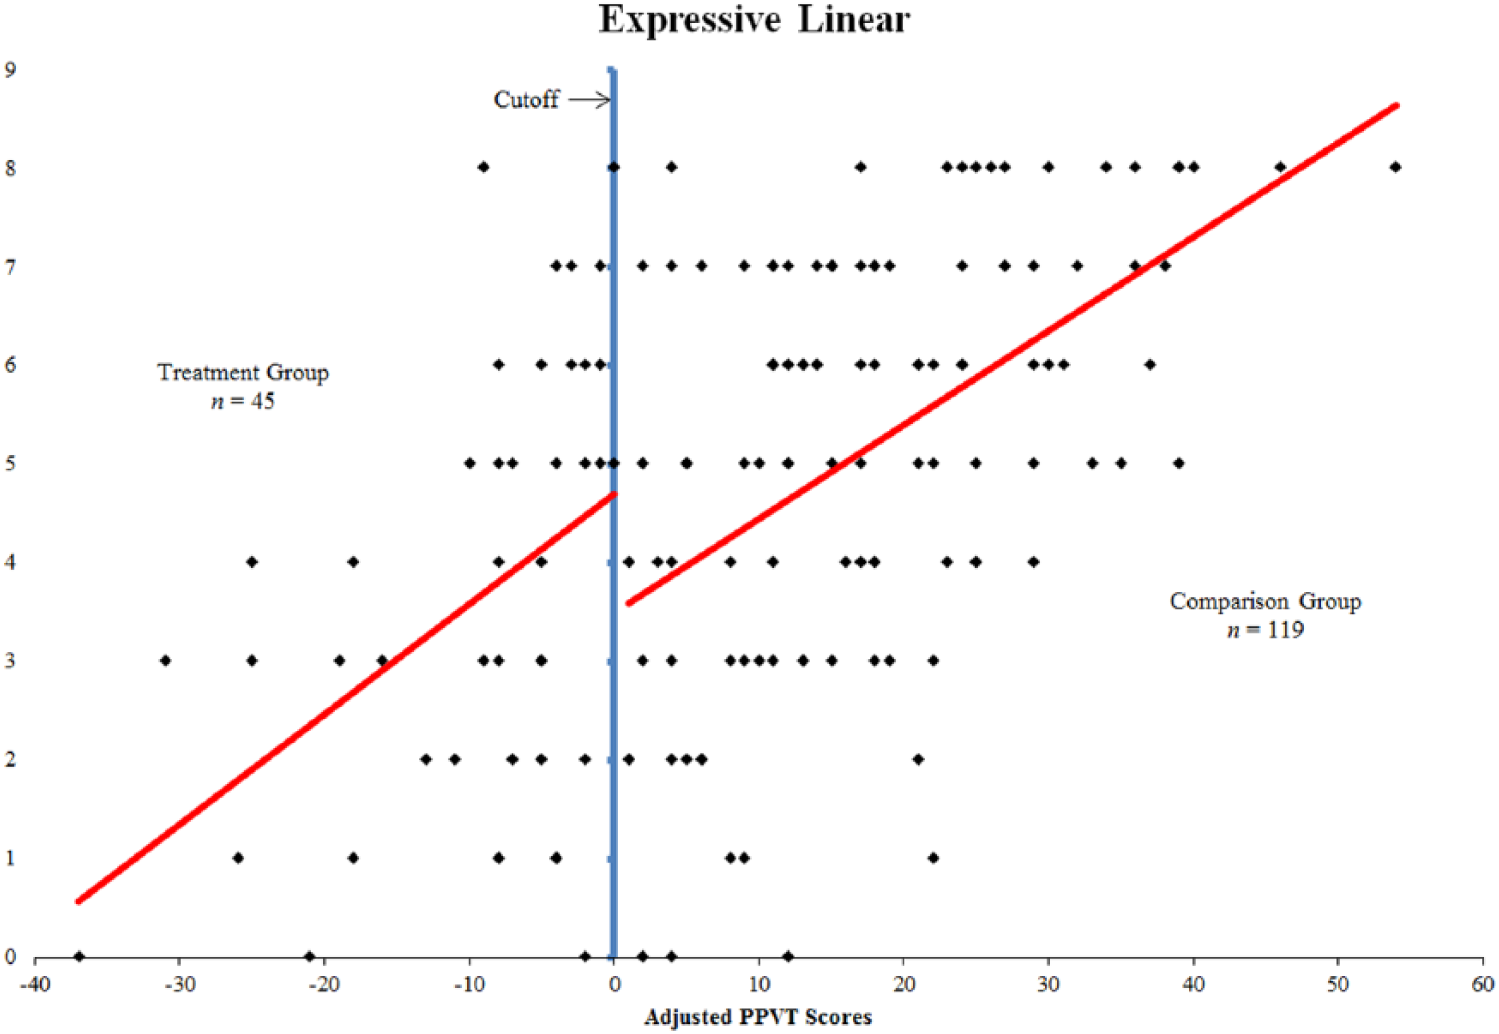
Linear regression line over expressive posttest scores.
Comparison of RDD With Randomized Experiment
In a discussion of a RDD’s treatment effect estimate between a treatment and comparison group (i.e., no control group), Berk et al. (2010) assert that “the estimate is analogous to a comparison between the mean of the experimentals and the mean of the controls in a randomized experiment” (p. 197). Therefore, in our comparison of the present study and Pullen and colleagues’ results, we compare our findings with the differences in outcome variables for their treatment and control groups and ignore their findings for the comparison group. Table 2 summarizes treatment effects from both studies.
Comparison of Results.
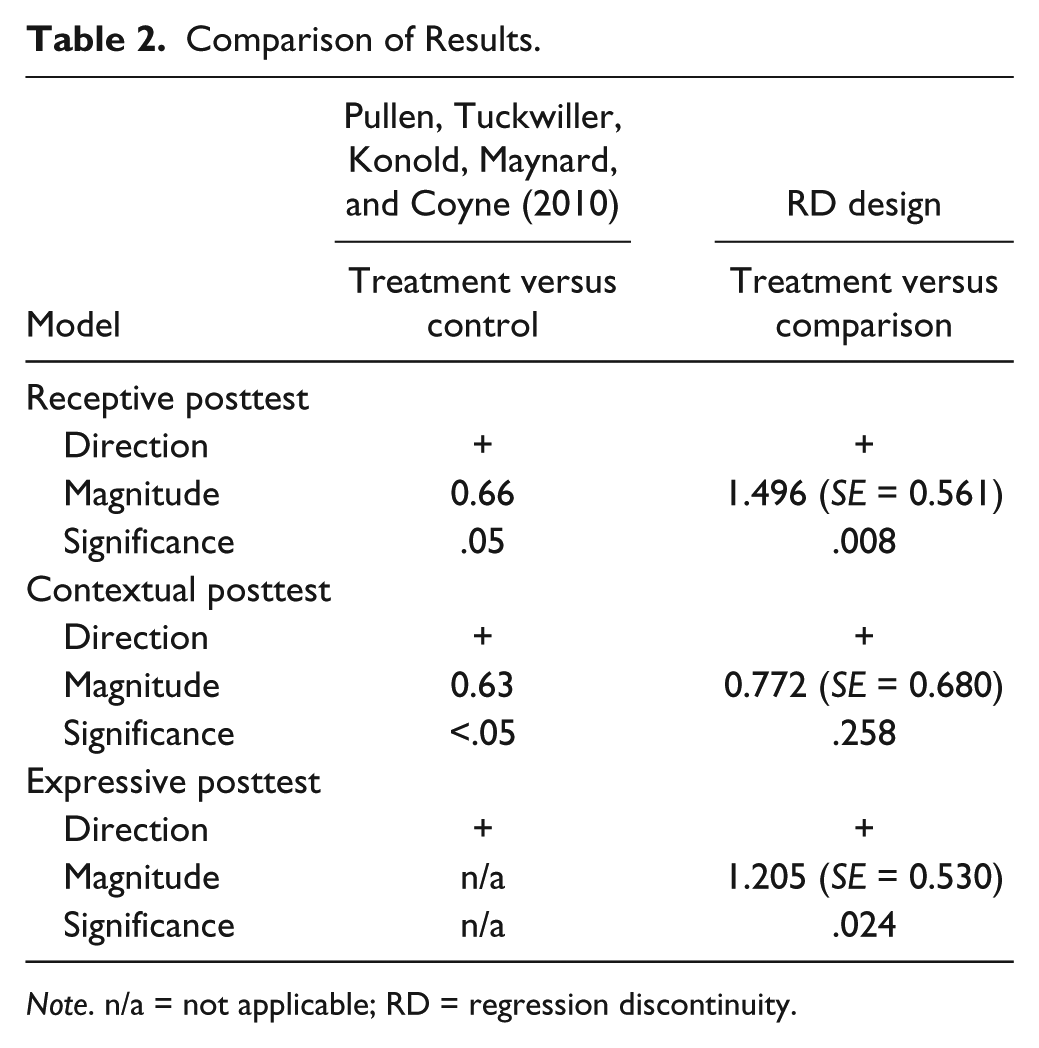
Note. n/a = not applicable; RD = regression discontinuity.
Pullen and colleagues (2010) used a MANOVA with Roy-Bargman step-down analyses to evaluate whether their three groups differed on the combination of three hierarchically ordered outcome variables. They also used planned contrasts to determine where any significant differences in groups occurred. They found statistically significant differences in their three groups on the combined posttest, F(6, 404) = 10.33, p < .001, η2 = .25. Furthermore, they found significant between-group differences on receptive, F(2, 204) = 16.34, p < .001, and contextual word knowledge, F(2, 203) = 14.62, p < .001. The treatment group outperformed the at-risk control group on measures of receptive (Mtreatment = 6.09, Mcontrol = 5.43, p = .05) and contextual word knowledge (Mtreatment = 4.66, Mcontrol = 4.03, p < .05). The not-at-risk comparison group performed better than the treatment group on receptive (Mcomparison = 6.96, Mtreatment = 6.09, p < .05) and contextual levels of word knowledge (Mcomparison = 5.43, Mtreatment = 4.66, p < .05). Unadjusted comparisons also revealed between-group differences in expressive level of word knowledge, F(2, 204) = 25.45, p < .001. However, due to the nature of the analysis and the fact that expressive word knowledge was ranked last hierarchically, between-group differences on this subtest were represented by the higher prioritized measures of receptive and contextual vocabulary knowledge. The adjusted test did not reveal significant differences on the expressive subtest, F(2, 202) = 0.23, p = .79.
Receptive level
Findings from the RDD analyses revealed that students who received both tiers of the vocabulary intervention scored 1.5 points higher on average on the measure of receptive level of word knowledge than would be predicted if they had not received the second tier of instruction, p = .008. Pullen et al. (2010) found a mean difference of approximately 0.7 of a point between mean scores on the measure of receptive level of word knowledge for treatment and control groups. The treatment effect was in favor of the treatment group and was statistically significant, p = .05. The results from the RDD and the experimental design are comparable in terms of direction and statistical significance; researchers for each would determine the treatment to be effective. However, the magnitude of the estimated treatment effect in the RDD was higher than that of the experimental design.
Contextual level
Findings from the RDD analysis revealed that students who received both tiers of the vocabulary intervention performed no better on the measure of receptive level of word knowledge than would be predicted if they had not received the second tier of instruction. Although the treatment effect was not significant, it was positive in favor of the treatment group in terms of direction. Pullen and colleagues (2010) found a significant between-group difference on the measure of contextual level of word knowledge. They found a mean difference of approximately 0.6 of a point between scores on the measure of contextual level of word knowledge for treatment and control groups favoring the treatment group. The results from the RDD and the experimental design are not comparable for the measure of contextual level of word knowledge in terms of statistical significance, but in analyzing the discontinuity in the quadratic regression function in Figure 4, one can see that the treatment group did have slightly higher scores than would be predicted if they had not received the treatment. In addition, the estimated treatment effect, albeit statistically insignificant, was approximately 0.77, similar to the mean difference found by Pullen et al.
Expressive level
Findings from the RDD analyses revealed that students who received both tiers of the vocabulary intervention had higher scores on the measure of expressive level of word knowledge than would be predicted if they had not received the second tier of instruction. Furthermore, these findings were statistically significant, p = .024, with a treatment effect of approximately 1.2. Pullen and colleagues (2010) did not find significant differences between treatment and control group means on the measure of expressive level of word knowledge. The results from the RDD and the experimental design are not comparable for the expressive posttest in terms of magnitude and statistical significance. However, the direction of the treatment effect in both studies was positive in favor of the treatment group. Overall, researchers from the RDD and experimental design came to different conclusions regarding the effectiveness of the treatment on improving performance at the expressive level of word knowledge.
Discussion and Conclusion
In this study, our purpose was to determine whether results from a RDD were comparable with those of a randomized experiment with the same dataset. In addition to confirming the effectiveness of a supplemental tier of vocabulary instruction for at-risk readers, the study contributes to knowledge regarding methodology and the use of RDDs in this type of research.
In comparing findings from the present study with those of Pullen and colleagues’ (2010) study, we found that results were comparable for the receptive outcome scores in direction, magnitude, and significance, although the magnitude of the treatment effect using RDD was slightly higher. Results were also comparable for contextual outcome scores for direction and magnitude. However, they found treatment effects for the contextual measure to be statistically significant, whereas the contextual-level treatment effect was not significant in the RDD based on the p value alone. A visual analysis of the quadratic regression function for contextual-level scores illustrated a slight treatment effect at the cutoff.
One notable difference between the findings from the RDD and the randomized experiment was the treatment effect of the intervention on students’ scores on the expressive-level subtest. Pullen et al. (2010) did not find a statistically significant treatment effect on the expressive-level subtest. However, the present study suggests a significant effect.
Many reasons exist that could explain the differences in statistical significance of expressive-level treatment effects. However, one reason for this difference is most likely in this case. Results from a RDD analysis and a randomized experiment will only be the same if treatment effects are constant across the sample, which is not the case with scores on the expressive vocabulary measure. Students in the treatment group with preprogram scores closer to the cutoff (i.e., students who were less at risk for reading and language difficulties as measured by their overall receptive vocabulary knowledge on the PPVT) benefited more from the second tier of instruction than students who were more at risk with PPVT scores at the lower end of the range. In fact, a visual analysis of the scatterplot of scores on the expressive measure with the quadratic regression function reveals that this is the case (see Figure 6). The curved quadratic function on the right side of the cutoff illustrates that students with higher PPVT scores experienced more of a treatment effect than students with lower PPVT scores.
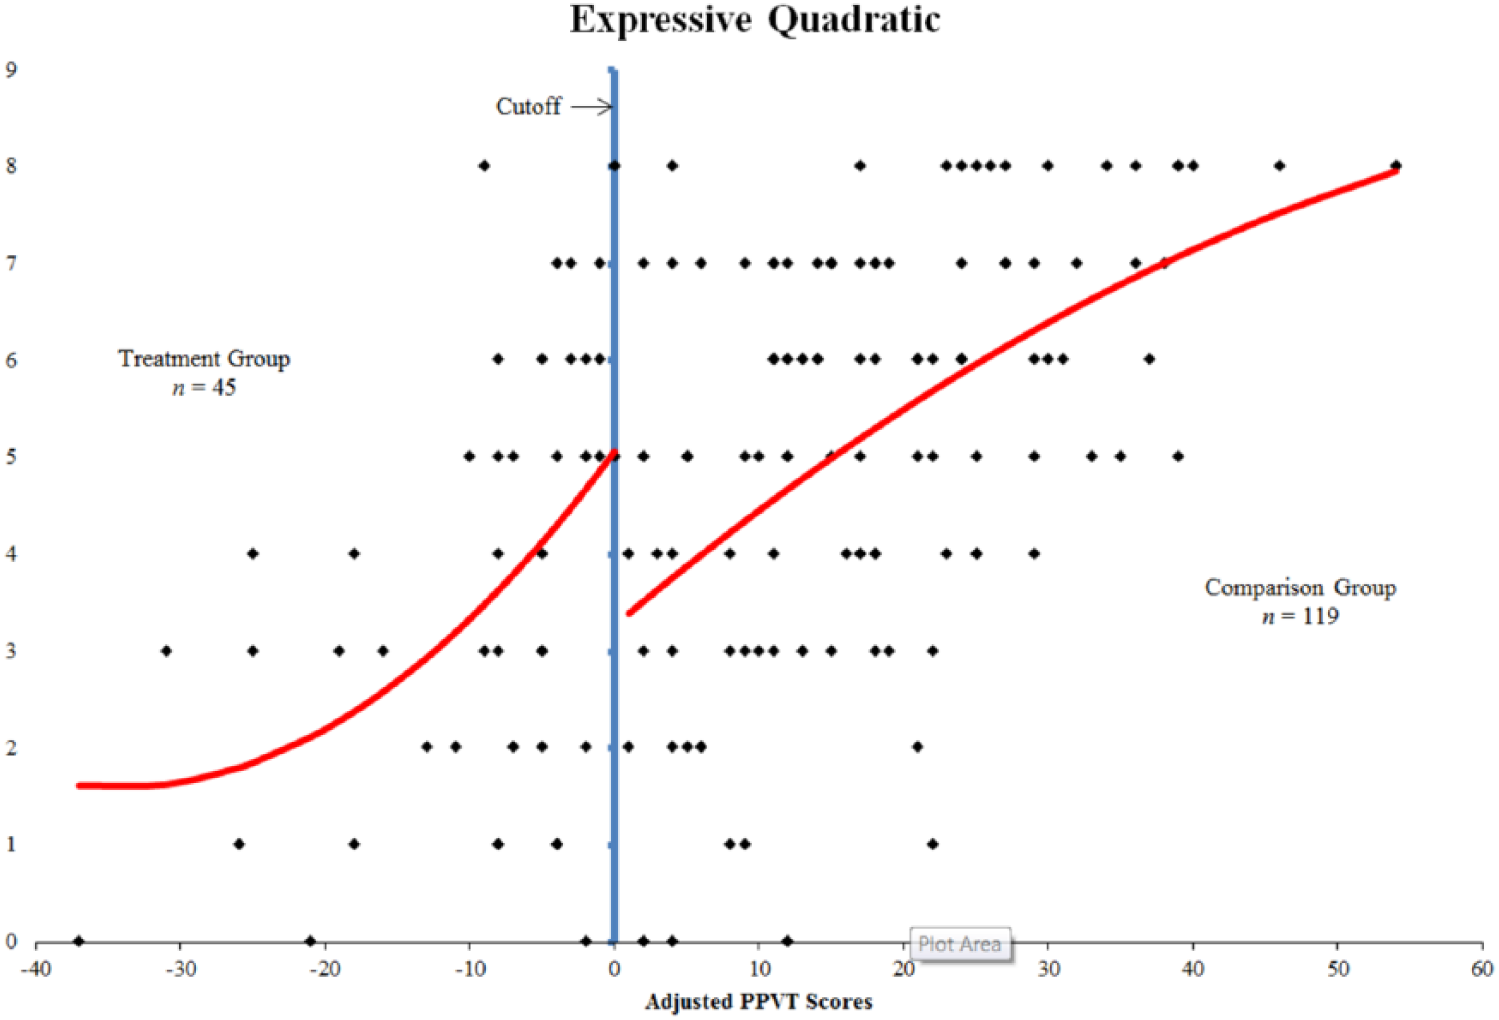
Quadratic regression line over expressive posttest scores.
Another possible reason for the difference in statistical significance of the treatment effect on expressive-level word knowledge is that Pullen et al. (2010) used Roy-Bargman step-down analyses in the original study. They ranked hierarchically the three levels of vocabulary knowledge, entering expressive subtest scores after receptive and contextual scores. Through their Roy-Bargman analysis, the majority of the variance was already accounted for by the higher-order variables at the point that expressive scores were included. In the RDD analysis, we conducted separate analyses for each of the levels of vocabulary knowledge. Therefore, variance in receptive and contextual scores did not influence the treatment effect estimate for scores on the expressive-level subtest.
As researchers continue to study early interventions for addressing the vocabulary gap, they have many research methodologies from which to choose. Stringent standards of research funding organizations, such as the Institute of Education Sciences, lead researchers to frequently use randomized experiments when testing the effectiveness of academic interventions in reading and other content areas. Even when fully randomized studies are not possible, educational researchers are likely to choose quasi-experimental designs that include the use of a control group of “needy” students who do not receive treatment.
In recent years, researchers have given more attention to RDD for determining the effectiveness of educational programs and policies (e.g., Jacob & Lefgren, 2004; Lesik, 2007; Ludwig & Miller, 2007; Wong et al., 2008). Educational researchers have also used the RDD to test the effects of reading interventions (Tuckwiller et al., 2010; Vaughn et al., 2009), but small sample sizes have limited their ability to find significant effects. In the present study, we have a larger sample size than those of Tuckwiller et al. and Vaughn et al., which is possibly one reason that the present study resulted in more significant effects than previous RDD studies of intervention research. Trochim (2006) discusses the issue of sample size in RDDs, noting that to achieve the same statistical power as a randomized experiment, a RDD needs close to three times the number of participants.
Theoretically, the RDD is comparable with the randomized experiment in terms of estimated treatment effects (Trochim, 2006). Ethically, the RDD is more appropriate for intervention research addressing the needs of at-risk populations because of the fact that a control group is unnecessary. Within-study comparisons of the two designs have shown promise for RDD’s credibility as a “competitor” in educational research. Some methodologists have been able to replicate results from randomized experiments through the use of RDDs and provide statistical significance of similarities between the two (e.g., Berk et al., 2010; Black et al., 2007; Shadish et al., 2011), whereas others have found discordant results (e.g., Buddelmeyer & Skoufias, 2004). The present study compares results from a randomized quasi-experimental study with those of a RDD using the same dataset (i.e., within-study comparison). The direction of the treatment effect was the same for both studies on all three levels of vocabulary knowledge (i.e., receptive, contextual, and expressive). Furthermore, results for the receptive level of vocabulary knowledge were comparable in terms of magnitude and significance. The present study’s findings show promise for the use of RDDs in intervention research, specifically for research in the area of tiered interventions for early elementary at-risk learners.
Limitations
A few limitations to the present study deserve mention. First, the use of archival data (i.e., Pullen et al., 2010) presents limitations to the present study, in that reliability and validity of the original data were out of the researchers’ control. To address this limitation, we conducted an agreement check with 20% of the hard copies of the data against the information recorded in the electronic dataset and found no discrepancies. In addition, we checked every PPVT-4 score against the assignment variable and determined that Pullen et al. followed the cutoff rule with 100% accuracy. Pullen and colleagues report data for fidelity of treatment and interrater reliability. Researchers observed 25% of the Tier 1 lessons and used a checklist to determine procedural reliability, which was 100%. Researchers used a similar checklist to observe 25% of the Tier 2 lessons and determine procedural reliability, which was 97% for Tier 2. In addition, 25% of the posttests were double-scored with 97% interscorer agreement.
A second limitation of the present study is the relatively small sample size. Although the sample sizes for treatment and comparison groups are nearly double those of Tuckwiller and colleagues’ (2010) RDD study of a comparable kindergarten tiered intervention, a larger sample would have been better. The present RDD study obviously has less power than its randomized counterpart (Trochim, 2006). Nonetheless, some of the present study’s findings are statistically significant and comparable with results from Pullen et al.’s (2010) randomized experiment.
A third limitation of the present study is the fact that we did not have access to data on all of the possible covariates that could have affected the treatment effects. Some student-level demographic data, such as free and reduced lunch status, were not available to Pullen and colleagues (2010) during their original data collection. To diminish this limitation as much as possible, we tested the student-level covariates that were available using RDD analyses to ensure that there were no differences between groups at the cutoff. Although only very small differences were apparent for the available covariates, we must still acknowledge that effects from unknown covariates could lead to biased results.
A fourth limitation is the fact that we had prior knowledge of Pullen and colleagues’ (2010) original data analyses. Shadish and colleagues (2011) discuss the potential bias that such prior knowledge could potentially cause for a within-study analysis of different methodologies. They assert that having knowledge of research findings prior to conducting a second analysis could cause the researcher to skew inadvertently the second analysis due to the underlying hope of replicating results from the original analysis.
Future Directions
More within-study comparisons are needed to determine whether results from the RDD are comparable with those of the “gold standard” randomized experiment. The present study compared results of a RDD with those of a randomized quasi-experimental design in terms of direction, magnitude, and statistical significance of treatment effects. Although the comparison provided important information regarding similarities and differences between the two studies, further statistical tests could provide a clearer picture. Shadish et al. (2011) compared a RDD with a randomized experiment in a highly controlled environment and used statistical analyses to determine whether results from the two designs were the same. Researchers should pursue further studies of this quality in determining whether RDDs can replicate results of randomized experiments. Further within-study comparisons are warranted to determine how researchers can use RDDs to eliminate the ethical concerns that accompany randomized experiments.
Footnotes
Declaration of Conflicting Interests
The author(s) declared no potential conflicts of interest with respect to the research, authorship, and/or publication of this article.
Funding
The author(s) received no financial support for the research, authorship, and/or publication of this article.