



Abstract
Using structural equation modeling, the study tested a theoretical model linking family background, student attributes, and college success. The sample consisted of 346 students with learning disabilities (LDs) who enrolled in college between 2004 and 2012. The data were taken from the public files of the Education Longitudinal Study: 2002. The results indicated that family background has a strong significant direct effect on the students’ attributes, which then has a direct effect on college success. Students with LDs from higher socioeconomic status (SES) families, who have higher educational expectations, coupled with a strong academic background, have the best chance at succeeding in college. However, these factors only explain 13% of the variance, which calls into question what other variables may also be important predictors of college success for these students.
Learning disability (LD) is the most prevalent disability served by special education (Cortiella & Horowitz, 2014). There has been an 18% decline in the number of students with LDs receiving special education services since 2002, while the overall number of students receiving special education only dropped 3% in that time (Cortiella & Horowitz, 2014). This is credited to a number of factors, including improved identification and early interventions during preschool, advances in reading instruction in general education classrooms, and revisions in the criteria for identification of LDs due to the changes within the 2004 and 2006 Individuals with Disabilities Education Act (IDEA). Although this progress has reduced the dependency on special education services for many students with LDs, this group of students continues to have one of the highest high school dropout rates at 19% in 2012 versus 6.6% for the general population (Cortiella & Horowitz, 2014; U.S. Department of Commerce & Census Bureau, 2015). This pattern continues into postsecondary education, where students with LDs are now enrolling at the same rate as the general population (67%), but only 41% of students with LDs complete their degree compared with 52% of their peers (Cortiella & Horowitz, 2014). The question then becomes, why do these students continue to have reduced postsecondary outcomes when compared with their peers?
To understand the educational disparities, a large body of research has focused on the relationship between income level, disability, and education outcomes. It has been well established that the prevalence of LDs is higher for those living in poverty (Cortiella & Horowitz, 2014), and children in poverty are less likely to graduate high school (Hernandez, 2012). Socioeconomic status (SES) has a similar impact on postsecondary outcomes, with students from affluent households more likely to complete their degree (Dynarski, 2015; Lee, Rojewski, Gregg, & Jeong, 2015). Although SES is a predictor of degree attainment, it is not the only contributing factor. There may be other elements that better explain why many students with LDs from less fortunate circumstances are able to surpass expectations. Considering that higher education institutions are unable to influence student high school academic achievement or their family background, it might be helpful to understand the predictive power of those factors and what gap exists for alternative explanations for student achievement.
This study investigates factors related to family background and student attributes that contribute to college success for individuals who have been identified with LDs. Family background includes parent aspirations (how far in school the parent wants their 10th grader to go) and SES (a composite of parental income, education, and occupation). Student attributes include student academic ability, as indicated by standardized test scores, student expectation (how far in school the student thinks that he or she will go), and whether there is a gap in time between high school graduation and postsecondary enrollment. College success is defined operationally by two variables: (a) degree attainment (within 6 years) and (b) postsecondary grade point average (GPA). The purpose of this study was to develop a model for how family background and student attributes influence college success.
This study analyzed data from the Education Longitudinal Study of 2002 (ELS: 2002; U.S. Department of Education, Institute of Education Sciences, & National Center for Education Statistics, 2002), a large national study that followed 10th graders from 2002 through 2013. The wave selected for analysis was from the 2013 postsecondary education transcripts (PETS). We developed a conceptual model a priori based on previous theory and scholarship conducted in the area of students with disabilities and college success. Using a two-step approach, we conducted confirmatory factor analysis (CFA) to test factor loadings between observed and latent variables, and then developed a full structural equation model (SEM) to test the conceptual model. SEM was selected for its unique ability to test relationships among latent variables. In this study, college success, family background, and student attributes were considered latent variables. A more thorough review of the variables studied is provided within the “Method” section.
Literature Review
Research indicates that retention and college degree completion rates for students with LDs have been quite poor (Belch, 2004; Cortiella & Horowitz, 2014). Ketevan and Koch (2012) reported that 24.7% of students with disabilities did not persist after their first year, with 50.6% dropping out by Year 3. Lee et al. (2015) researched persistence among individuals with LDs and emotional/behavioral disorders, and discovered that those with LDs were 70% less likely to enroll or persist in college compared with those without disabilities. Given the importance of acquiring postsecondary education and training in today’s knowledge-based global economy, this study aims to test a model of the relationship between important predictor variables and college success for students with LDs.
Family Background
SES
One of the main barriers to attaining a postsecondary degree is a student or family’s SES (Gregg, 2007). A recent national longitudinal study found that just 14% of students from the lowest income quartile earned a bachelor’s degree, while 60% of students from the highest income quartile had done so (Dynarski, 2015). Students from low SES families are more likely to transition from high school to work, while students with high SES were four times more likely to attend college (Rojewski & Kim, 2003). Lee et al. (2015) reported that significantly more adolescents with LDs were from lower SES families, and that SES is positively related to persistence in college. Therefore, students with LDs, who also have low SES, are at a significant disadvantage for persistence through and graduation from college.
Parent aspiration
In addition to a family’s financial and social background, a parent’s educational and career expectations can have a profound impact on a student’s willingness to pursue postsecondary education. Doren, Gau, and Lindstrom (2012) demonstrated that a parent’s expectation that their adolescent with a disability would enroll in a postsecondary institution was significantly associated with whether or not the adolescent was currently enrolled or had completed postsecondary school. Lee et al. (2015) also reported that students who had parents with higher educational expectations were 25% more likely to persist in postsecondary education. However, Cortiella and Horowitz (2014) presented that although 54% of high school students with LDs aspire to attend a postsecondary school, only 28% of parents have the same expectation. There is also a positive correlation between SES and parental aspirations, with parents of adolescents with disabilities from lower income backgrounds holding significantly lower expectations than parents from higher income backgrounds (Newman, 2005).
Student Attributes
Academic preparation
Typically, the two main academic predictors for college success are high school GPA and standardized test scores. Although there is abundant research collected on the impact of these academic indicators on college enrollment and success, the results have been mixed. Kobrin and Patterson in 2011 showed that all three sections of the SAT were significant predictors of first-year GPA; however, the validity of the three sections varied across institution type. Waugh, Micceri, and Takalkar (1994) demonstrated that students with higher high school GPAs have greater re-enrollment/graduation rates in college, while SAT/American College Test (ACT) scores were unrelated to retention. For students with disabilities, previous success in school is a positive predictor of future success in college (Lee et al., 2015; J. B. Martin & Bowman, 1985).
Students labeled with an LD are at a disadvantage for access to the high school coursework needed to transition to college. Shifrer, Callahan, and Muller (2013) reported that only 27% of high school students with the LD label had all the credits required for high school completion, compared with 50% of peers without LDs. Utilizing admissions tests (i.e., SAT or ACT) as a measure of academic achievement for people with disabilities is problematic, as students may be exempt from these tests (J. B. Martin & Bowman, 1985). Given the positive relationship between high school achievement (via the GPA) and the college GPA, we are also interested in how standardized test scores may affect college success.
Student expectation
Like parental expectations, a students’ educational expectation for themselves affects their educational attainment and career trajectory. Given that more than 70% of high school sophomores in 2002 (in a large nationally representative sample) aspired to earn a bachelor’s degree (Dynarski, 2015), it is apparent that most students would like to enroll and graduate from college. A study by Irvin et al. (2011) found that regardless of disability identification, rural high school students who had negative perceptions of school were less likely to pursue higher education. Although in general, students with LDs tended to have negative perceptions of school and low postsecondary aspirations, those who had positive perceptions more often planned to pursue postsecondary education and aspired to attain a degree. Likewise, Lee et al. (2015) reported that students with LDs who had high educational expectations had twice the odds of persisting through college, compared with those who did not.
Time to enrollment
Although most students intend on enrolling in postsecondary education following high school graduation, some students choose to delay their enrollment, which is typically termed a gap year (Jones, 2004). A gap year is defined as “any period of time between 3 and 24 months which an individual takes ‘out’ of formal education, training or the workplace, and where the time out sits in the context of a longer career trajectory” (Jones, 2004, p. 8). According to proponents of gap years, young adults can use their break from school to gain valuable work experience while developing the maturity and self-directedness needed to optimize their future academic performance (A. J. Martin, 2010). A. J. Martin’s (2010) research highlighted that students with lower motivation and academic performance, and postsecondary uncertainty were more likely to take a gap year, and that a gap year positively predicted academic motivation in college. Similar to those findings, Niu and Tienda (2013) found that more students who delayed enrollment had low expectations that they would attain a college degree, but that their expectations rose the following year.
Other research has demonstrated that there are deleterious effects to taking a gap year, especially for students who are economically disadvantaged or with disabilities. Students who delayed enrollment tended to be weaker academically and have lower SES compared with students who transitioned directly to college (Bozick & DeLuca, 2005; Niu & Tienda, 2013; Wells & Lynch, 2012). Delayed enrollment of 1 year or more negatively affects the likelihood that a student will pursue a baccalaureate degree, creating an extra barrier to higher education for disadvantaged students (Bozick & DeLuca, 2005; Niu & Tienda, 2013). Ketevan and Koch (2012) discovered that more than half of students with disabilities (53%) delayed enrollment, with 67.4% of those students not persisting through their second year of college. Delayed enrollment poses a significant barrier to degree attainment for these students, and is an important variable for consideration within the model.
College Success
Graduation is the ultimate goal of every college student, their parents, and teachers (Johnson, Zascavage, & Gerber, 2008). Given the importance of obtaining a postsecondary degree, this study uses degree attainment as an indicator of college success. Research by Madaus (2006) showed that postschool outcomes for university graduates with LDs were quite positive and that the employment rate, levels of income, and levels of benefits earned for these students were comparable with the general workforce in the United States. Because GPA is such an important factor for gaining acceptance into graduate or professional school and is often used in hiring practices of recent college graduates, this study is also looking at college GPA as a college success measure. Although earning a degree is the primary goal of college enrollment, one can make a strong case that students who graduate with a higher GPA (e.g., 3.0 or higher) from college were academically more successful than students who graduate with a lower GPA (e.g., 2.0–2.5).
The next section will provide the specific variables and analytical methods used within the study. The research questions driving the study were as follows:
Method
Participants
The purpose of this study was to gain a better understanding of the influence of student and family characteristics on college success for students with LDs. This was a secondary data analysis using public data provided by the ELS: 2002. Generally, the ELS focuses on the transition of U.S. youth from secondary schooling to subsequent education and work roles. The ELS: 2002 is a large nationally representative, longitudinal study that tracks high school 10th graders in 2002 and 12th graders in 2004, as they graduate from high school and enroll in postsecondary education or enter the workforce. The latest collection wave for the study was 2013, which includes postsecondary transcripts. The data used for the current study were obtained from the 2013 PETS data collection wave. The data collected include surveys of students, their parents, math and English teachers, and school administrators. In addition, the data include student assessments in math (10th and 12th grades) and English (10th grade).
Of the total ELS: 2002 sample of 16,197, there were 963 students identified as having an LD by a parent, and 456 of those reported having a college GPA. Imputing the missing data resulted in miss-attributing degrees to students; therefore, listwise deletion was used instead, providing a final sample size of 346. Considering the loss of 100 cases and the possibility of an increased Type 1 error due to selection bias, the standard for significance was raised to p < .01 (Huck, 2012). The original model had 19 parameters, and as recommended by Schreiber, Nora, Stage, Barlow, and King (2006), at least 10 participants per estimated parameter is optimal. The final sample of 346 exceeds this general guideline.
The sample demographics are presented in Table 1. Males comprised 53.5% of the sample, while females were 46.5% of the sample. Participants were predominantly White, accounting for roughly three fourths of the total sample. SES is a standard composite score, which in the full ELS: 2002 has a mean of 0. In our sample, the mean was .30 with an SD of 0.67, indicating that the students with LDs who went to college were generally more affluent. The average standardized 10th-grade reading and math composite was 46.7 (SD = 9.71) and the average 12th-grade math score was 45.51 (SD = 9.63), which is below the national mean of 50 for these tests. Most students attended college within 3 months of graduating high school (70.3%), while 15.6% enrolled over a year and 3 months after high school graduation. The sample average college GPA was 2.4 (SD = 0.94). The majority of students completed a postsecondary certificate (49.1%), then a bachelor’s degree (38.2%), followed by associate’s degree (9.2%). Only 3.5% of students attained a graduate degree.
Demographic Data (N = 346).

Variables
The main variables considered were related to student family background (SES and parent aspirations), student attributes (student expectation, standardized test composite score, standardized math score, and time to enrollment), and college success (college GPA and degree attained). Two additional demographic variables (race and sex) were included, as well as the main variable for identifying students with disabilities. Because we did not have a release for restricted data, we used the public data file available on the National Center for Education Statistics website. Below is relevant information related to the specific variables used in the study.
SES is a composite score of five equally weighted, standardized components: father/guardian education, mother/guardian education, family income, father/guardian occupation, and mother/guardian occupation. Parent aspiration indicates how far in school the parent wants their 10th grader to go, using a scale that ranged from 1, less than high school graduation, to 7, obtain a PhD, MD, or other advanced degree.
Student expectation indicates how far a student thinks he or she will get in school, using the same scale as parent aspiration above. Standardized test composite score signifies the average of the math and reading standardized scores from the 10th graders in 2002. The standardized math score is from the 12th graders in 2004. The national mean for both standardized scores was 50 with a standard deviation of 10. The time to enrollment variable is the number of months between high school exit and postsecondary entry.
The degree attained variable is the highest known degree earned as of June 2013. To help clarify the data, this variable was recoded as 1 = high school diploma, 2 = postsecondary certificate or diploma, 3 = associate’s degree, 4 = bachelor’s degree or postbachelor’s certificate, 5 = master’s degree or postmaster’s certificate, and 6 = doctoral degree. College GPA indicates the GPA at all known postsecondary institutions attended as of June 2013 and was measured on a 4.0 scale.
Because this study focuses on college students with LDs, the data used were limited to participants who had been identified as having an LD by the parent and had enrolled in at least one postsecondary institution. The exogenous latent construct family background was indicated by the observed variables SES and parent aspirations. Previous theory and research suggests that these variables are predictors of college enrollment and success. The latent mediating construct student attributes was indicated by the observable variables student expectation, standardized test composite score, standardized math score, and time to enrollment. Student ability has consistently been specified by standardized test scores within the literature. Student expectation is an indicator for motivation to enroll in college. Time to enrollment is also dependent on the students’ attributes, as students who are prepared and desire to attend college should be more likely to enroll sooner. As our definition of college success is degree attainment, the endogenous latent construct college success was indicated by the observed variables degree attained and college GPA. Maintaining a minimum college GPA, typically a 2.0, is necessary to attain a degree, and was included as another indicator of college success.
Analytical Method
We selected full SEM for its unique ability to test latent variables. Given that family background, student attributes, and college success are unobservable, we chose the indicator variables based on prior research and theory to help identify and quantify the constructs under review. Figure 1 reflects the original parsimonious model that was developed a priori and tested. We hypothesized family background and student attributes would each have a direct effect on college success, due to substantial support from previous research that both these variables have direct effects on college success.
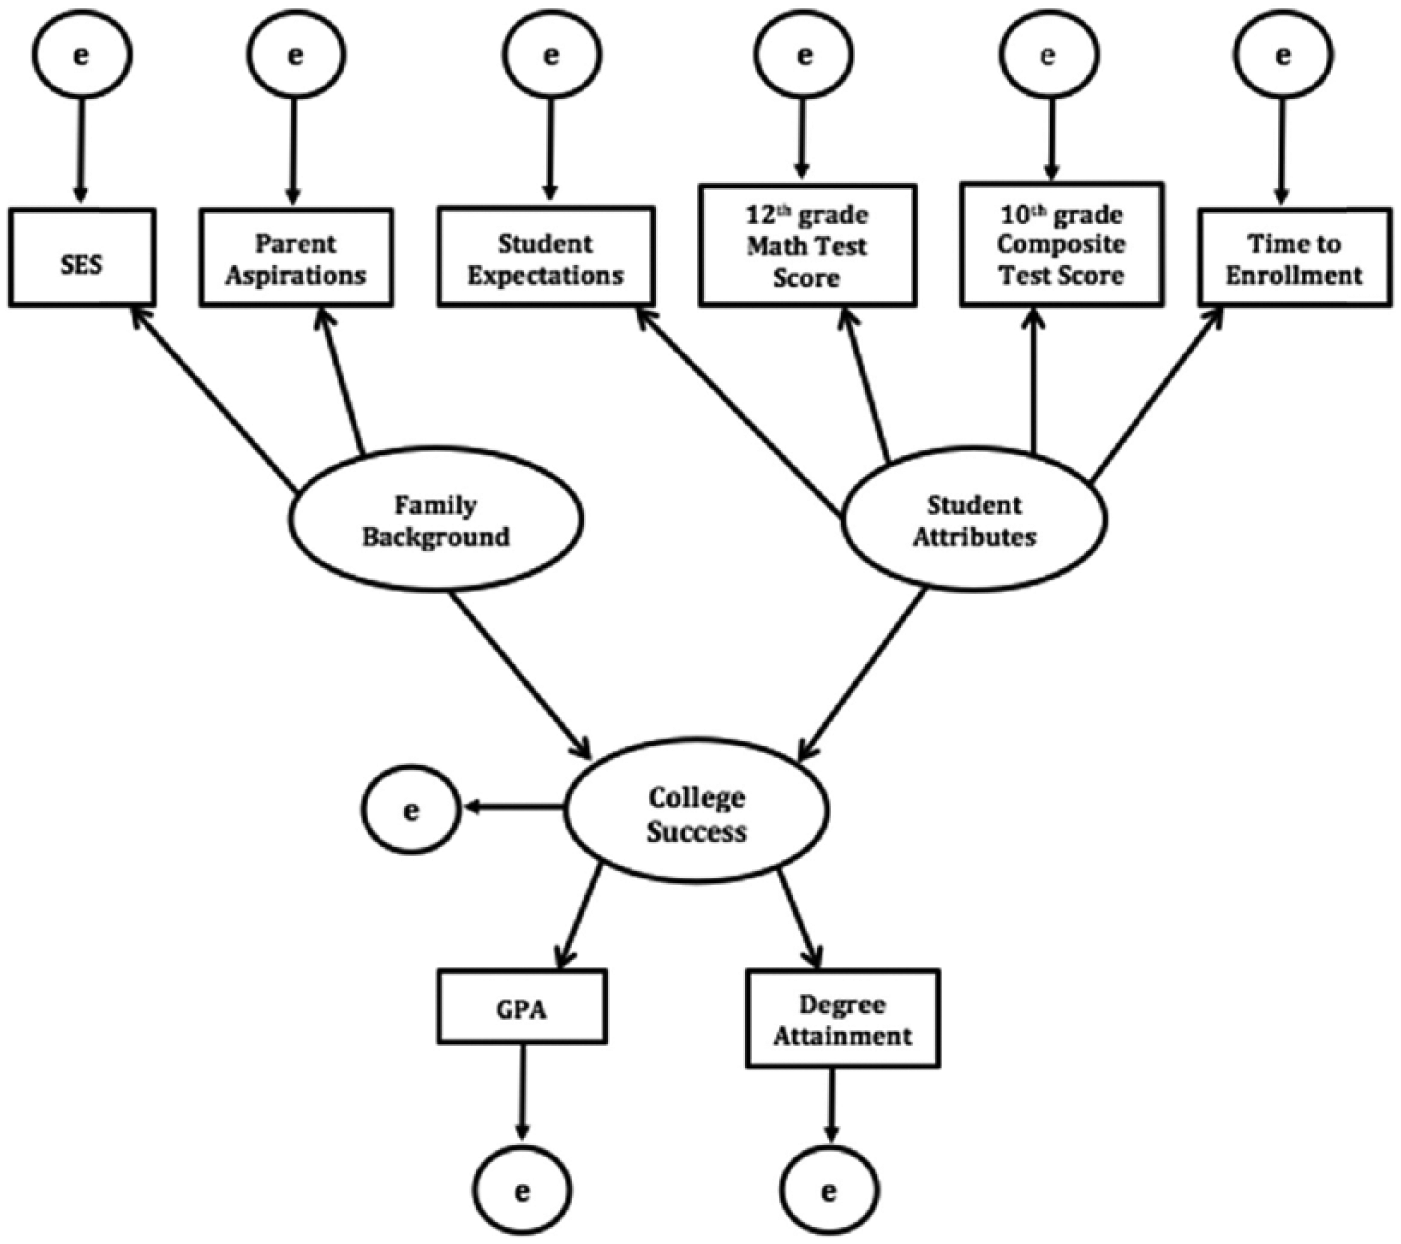
Original model.
We employed the computer program software LISREL 9.2 for our analysis (Joreskog & Sorbom, 2015). The statistical approach used was maximum likelihood estimates. As recommended by Schumacker and Lomax (2010), we utilized a two-step approach to test our model. First, we constructed a CFA to test our factor loadings of the constructs onto the observed variables. We then checked the fit statistics and modification indices to determine whether model modification was necessary. By allowing the error variance between the math standardized test and composite test, and parent aspiration and student expectation, to correlate, the model had an acceptable fit. It is to be expected that the measurement error would be similar for both standardized tests. Because students generally reside with their parents, and most likely discuss their educational plans, this helps explain why there was also similar error for both student expectations and parent aspirations.
For the second step, model specification, the strongest indicator variable for each latent construct was set to 1. The a priori model had an unacceptable fit, and modification was necessary. Each modification was completed one at a time and only if it simultaneously fit with previous theory. The modifications included letting the errors correlate between math standardized tests and the composite standardized test scores, and parent aspirations with student expectations. A path was added between family background to student attributes, and the path between family background and college success was deleted to form the final model. The addition of a path between family background and student attributes is supported in the literature, as there is a clear connection between SES and academic achievement (Pokropek, Borgonovi, & Jakubowski, 2015). Although initially, the deletion of the path from family background to college success seemed countertheory, when placed in a longitudinal perspective, it makes sense that the student is first affected by his or her family background, which then influences his or her academic achievement. Another explanation is that high school achievement is simply a better predictor of college success than family background for this specific population.
Results
The correlations, means, and standard deviations of the observed variables are presented in Table 2. On average, parents generally wanted their student to complete a 4-year degree (M = 5.07, SD = 1.19), similar to the students’ expectations (M = 4.95, SD = 1.43). As expected, SES has a significantly moderate correlation with parent aspiration (r = .32, p < .01). The math standardized score and standardized composite score were significantly strongly correlated (r = .81, p < .01). Both standardized tests scores had significant small to moderate correlations with GPA and degree attained. Time to enrollment had a significant negative correlation with all other variables except college GPA, and approached significance with degree attained (r = −.11, p < .05). The length of time between enrolling in college was inversely related to their performance in high school and degree attainment. Student expectation and parent aspiration was significantly correlated with all variables except GPA. GPA had a strong, significant correlation with degree attained (r = .53, p < .01).
Correlation Matrix.
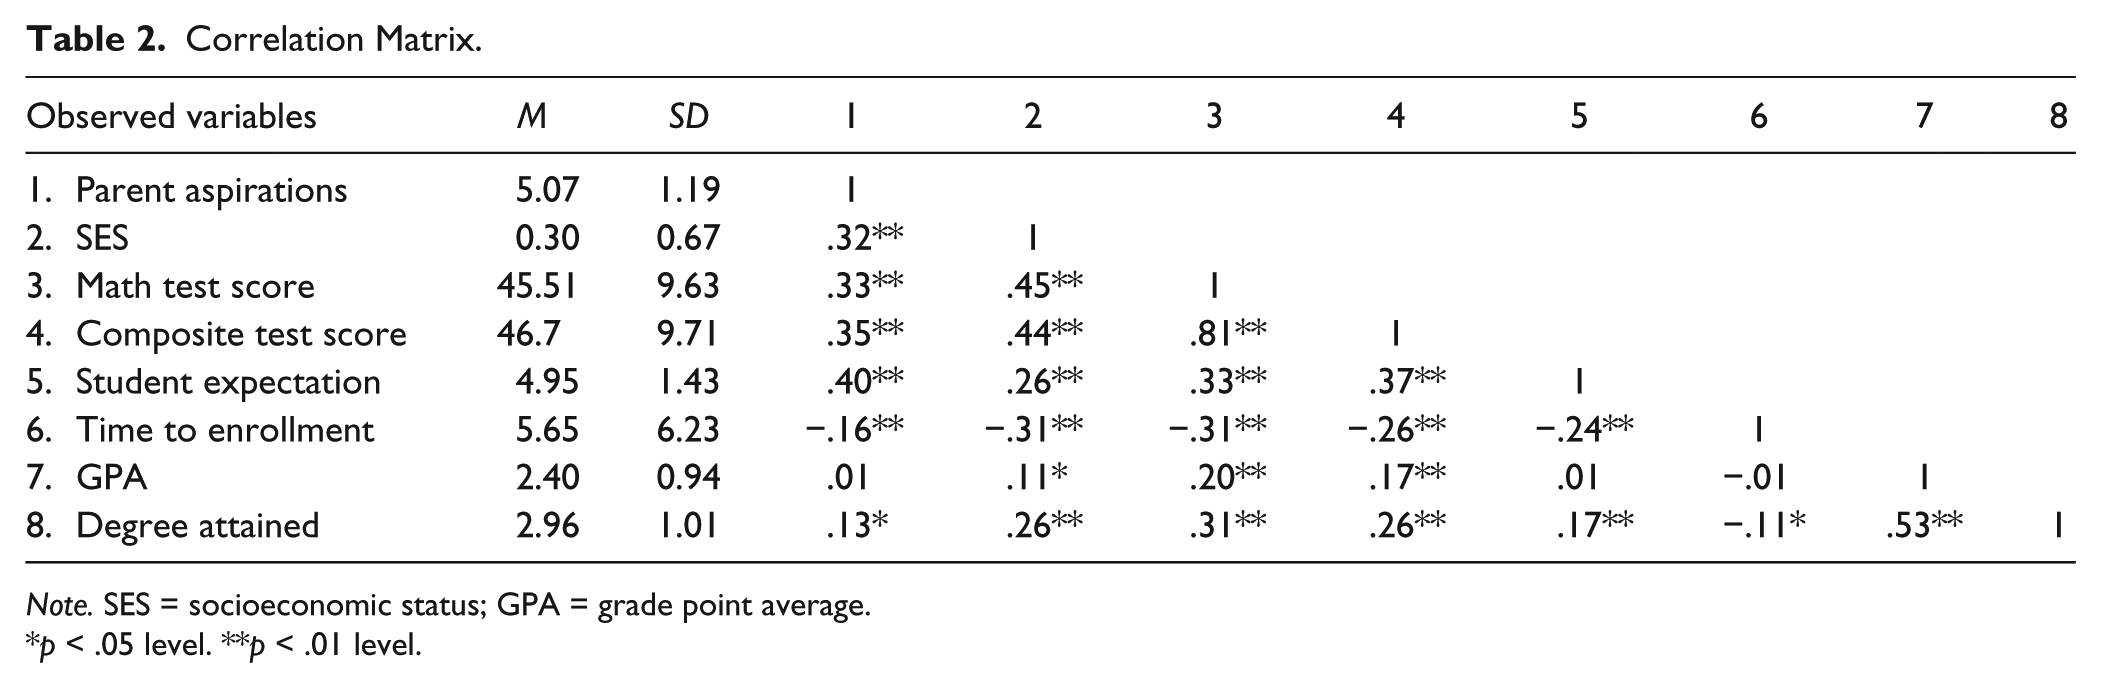
Note. SES = socioeconomic status; GPA = grade point average.
p < .05 level. **p < .01 level.
Relationship Between Family Background, Student Attributes, and College Success
The purpose of this study was to determine the relationship between family background, student attributes, and college success for students with LDs. The direct and indirect effects are reported in Table 3. Family background had a significant effect on student attributes (standardized coefficient = .98, p < .01). Family background had a significant indirect effect on college success through student attributes (standardized coefficient = .51, p < .01). Student attributes had a significant direct effect on college success (standardized coefficient = .52, p < .01). This indicates that family background strongly influences student attributes, which in turn predicts college success. Returning to our first research question, the study showed that student attributes had a direct impact on college success, while family background was mediated through this construct. Although family background explained 84% of the variance of student attributes, student attributes and family background together only explained 13% of the variance of college success. This answers our second research question: Once students with LDs enroll in college, their family background and high school attributes are not the only powerful explanations for student success. Other factors that students are exposed to after they begin classes may be better predictors for college success—and higher education institutions may be able to influence or control some of these factors.
Direct and Indirect Effects.

p < .01 level.
Measurement Model
Table 4 presents the factor loadings for the measurement model. All the observed variables significantly indicated their associated latent variables. After allowing the error variance between the math and composite test, and student expectations and parent aspirations to correlate, the fit was acceptable. It is reasonable to assume that the error variance between the math and composite standardized tests would correlate. Considering that the student generally resides with his or her parent, it is likely that the parent and student discussed post–high school graduation plans. Therefore, the error variance for parent aspirations and student experience should also correlate. This section will discuss the five fit measures that evaluated the confirmatory factor model (a) the chi-square, (b) the root mean square error of approximation (RMSEA), (c) the normed fit index (NFI), (d) the comparative fit index (CFI), and (e) the goodness of fit index (GFI). The chi-square was 21.67 (df = 15, p > .05), which is acceptable. The RMSEA is the measure of the average size of the residuals between the observed correlation from the sample and the expected model estimated for the population, and anything less than .08 indicates a good fit. The RMSEA was .04, which is a very good fit. The NFI is a measure that rescales the chi-square into a 0 to 1 range, with 0 indicating no fit and 1 equaling a perfect fit. The NFI of .97 indicated a good fit. The CFI was developed to improve the NFI and similarly a good fit is >.90. The CFI was .99, which is an excellent fit. The GFI is the proportion of variance in the sample correlation accounted for by the predicted model, with values ranging from 0 (no fit) to 1 (perfect fit). Generally a GFI equal to or greater than .9 indicates an acceptable model. The GFI was .99, confirming the strong fit between the observed variables and the latent constructs. There was one Heywood case, with a negative error variance for highest degree attained. This is most likely due to measurement error, which was unavoidable as we are analyzing secondary data. To account for this, the value was fixed to 1 for the structural model.
Measurement Model Factor Loadings.
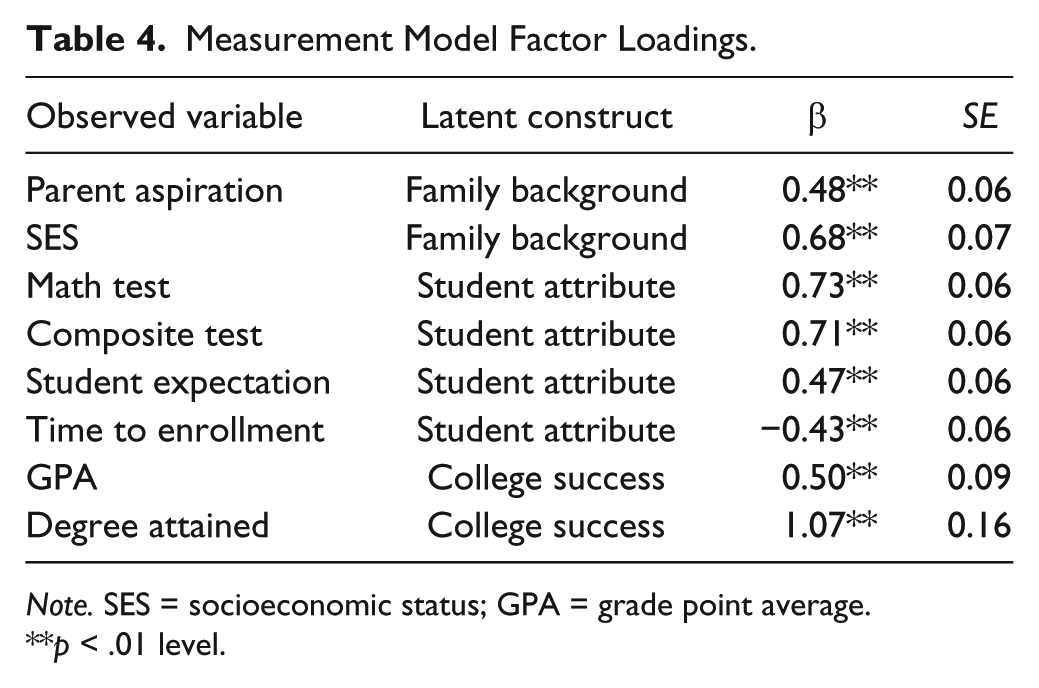
Note. SES = socioeconomic status; GPA = grade point average.
p < .01 level.
Structural Model
The original model did not fit the data and two modifications were needed. Presented in Table 5 is the comparison between the goodness-of-fit statistics between the original hypothesized model and the final model after modification. The first modification involved adding a path from family background to student attributes. This was recommended in the modification indices and fits theory because SES has a large impact on academic achievement. The total effect of family background on student attributes was significant. The model fit improved, however, neither the family background nor student attributes paths to college success was significant. This ran counter to theory and previous research, so one more modification was made: removing the direct path from family background to college success. This created a strong significant relationship between student attributes and college success, with family background having a strong, significant indirect effect on college success. This makes logical sense because SES and parent aspirations should have a direct effect on high school achievement and student expectations. This, in turn, should then have an impact on college achievement. This highlights the longitudinal aspect of the data used.
SEM Goodness-of-Fit Statistics.

Note. RMSEA = root mean square error of approximation; NFI = normed fit index; CFI = comparative fit index; GFI = goodness-of-fit index.
The final model can be seen in Figure 2. The overall fit of this revised model was excellent. The chi-square had a value of 21.68 (16, n = 346), p = .15, indicating a good match between the proposed final model and the observed data. The RMSEA of the final model was .03, which is excellent. The NFI, CFI, and GFI were .97, .99, and .99, respectively, which is indicative of a very strong fit.

Final model.
Discussion
Improving the postsecondary outcomes of students with LDs requires careful consideration and clear understanding of important variables related to college success. The purpose of this study was to determine the relationship between family background, student attributes, and college success for students with LDs. The study demonstrated that family background has a strong significant direct effect on the students’ attributes, which in turn has a direct effect on college success. Previous research found that SES (Dynarski, 2015; Rojewski & Kim, 2003) and parental aspiration (Lee et al., 2015; Newman, 2005) has a major impact on college enrollment and success. Our model helps demonstrate that family background plays a significant role in college success, but is mediated through student attributes. The students with LDs in our sample had a higher SES than the total sample within ELS: 2002, and most parents aspired for their children to attain a bachelor’s degree. This may be because students with LDs who attend college were provided more support services in high school, which helped them attain the academic performance necessary for college success. Future research should explore the relationship between family background, student attributes, and college success in students with LDs in more depth.
Student attributes includes academic preparation, student degree expectation, and time to enrollment. Students with LD had lower academic performance compared with the national sample on the standardized tests used to measure academic preparation. Given prior research, this lag in performance is typical for students with LDs due to processing deficits (Trainin & Swanson, 2005). Student degree expectations were closely aligned with that of their peers without LDs, as on average, they desired a bachelor’s degree. Time to enrollment was negatively associated with all variables, which implies that the longer students with LDs wait before enrolling, the less likely they are to be successful in college. Student attributes had the only direct effect on college success. This study helps clarify the relationship between family background, student attributes, and college success for students with LDs.
Although most students desired a bachelor’s degree, the majority of students attained a postsecondary certificate or diploma. Our study indicates that 38% of students graduated with a bachelor’s degree, which is lower than the national average of 59% for first-time, full-time students who enroll in a 4-year institution (U.S. Department of Education & National Center for Education Statistics, 2015). Likewise, our students’ overall GPA was lower than the ELS: 2002 average of 2.7. These two findings demonstrate a need to provide additional support services for students with LDs.
Although family background accounted for 84% of the variance in student attributes, both family background and student attributes combined only explained 13% of the variance in college success. It appears that once students enroll in college, there may be other variables that would have a stronger effect on college success for students with disabilities. For example, social factors, such as help-seeking behavior, may better predict college success. Trainin and Swanson (2005) reported that college students with an LD who performed on par with college students without an LD compensated for their processing deficits through help-seeking behaviors. Students with an LD who did not seek help had lower academic performance compared with students without an LD who also did not seek help. Similarly, DaDeppo’s (2009) research indicated that social factors were more related to college persistence than academic performance. This may be the case because students with LDs work harder to achieve academically and rely more on their social supports. This is helpful for higher education institutions, as they are unable to influence family background and student attributes—but can put programs in place to support students with LDs.
Limitations and Future Research
The biggest limitation was not having access to the restricted data of the ELS: 2002. Prior research was heavily based on high school GPA and SAT/ACT scores; therefore, not including these variables may have influenced the results and generalizability of this study. However, both the standardized test composite score and math standardized test score had the largest correlations with college GPA and highest degree attained than any other variable. This indicates that these standardized test scores were an appropriate replacement for the unattained variables. A second limitation was that we did not collect the data and were limited to the variables within the larger data set. Ideally, there would have been more questions pertaining to students with LDs and their transition from high school to postsecondary education. Another limitation was that the criteria for identifying a student with an LD was merely parental self-report, and was not confirmed by diagnostic measures. Therefore, some students with LDs may not have been included in the study, and some students who were included may not actually have an LD. Typically, when dealing with large-scale secondary data, there are missing cases. This reduced our initial sample size after listwise deletion and potentially increased our risk of making a Type 1 error. However, alternative forms for dealing with missing data were not deemed appropriate, and the resulting sample size was sufficient for analysis. In addition, we set the criteria for significance at the .01 level to reduce the likelihood of error.
Future studies should develop models using researcher-collected data on students with disabilities. This would allow for the inclusion of specific indicator variables, such as accommodations received by the student and their cognitive abilities. An additional area of interest would be adding student demographics, including race, gender, and first-generation status as indicator variables for student attributes, to study its effect on college success.
Implications for Practice
Overall, the findings of this model helped to confirm previous research and highlight areas for new study. Students from higher SES families, who have higher educational expectations, coupled with a strong academic background, have the best chance at college success. This study demonstrated that students from lower socioeconomic backgrounds are at higher risk of not completing or succeeding in college. These students need additional support and guidance in high school to be academically prepared for college. Delayed college enrollment was negatively correlated with college success. Therefore, students with LDs from disadvantaged backgrounds should receive college counseling and guidance with the application and enrollment process to decrease the likelihood of delayed college enrollment. Academic preparation was found to be important in predicting college success. We suggest providing increased academic support in high school to this population in an effort to better prepare them for college. Additional services in college should be considered to encourage persistence and degree completion among this student population.
Footnotes
Acknowledgements
We would like to thank Dr. Sunha Kim for her guidance and edits on this study and article.
Declaration of Conflicting Interests
The author(s) declared no potential conflicts of interest with respect to the research, authorship, and/or publication of this article.
Funding
The author(s) received no financial support for the research, authorship, and/or publication of this article.