



Abstract
To meet increasingly complex mathematics standards in late elementary school, students must conceptually understand and be fluent in the operations of multiplication and division. This includes understanding the operations’ inverse relation. The purpose of the study was to investigate the effects of alternating concrete–representational–abstract (CRA) multiplication and division instruction on students’ mastery of unknown facts and on their conceptual understanding. Fourth through sixth-grade students with learning disabilities who had failed to master all multiplication facts participated in the study. The researchers used a mixed method design, measuring accuracy and fluency of facts with a multiple probe across students design and qualitative methods to capture changes in students’ explanations of their computation. The researchers demonstrated a functional relation between CRA instruction and accuracy and fluency in multiplication and division. Qualitative results indicated differences in students’ understanding of the operations. Implications of the results will be discussed further.
Students develop the foundations for advanced mathematical thinking in elementary grades and one particularly critical foundation is multiplicative reasoning (Harel & Sowder, 2005). In primary elementary grades, students learn additive reasoning, the joining of quantities. However, within multiplication, numbers act upon each other in different ways (Clark & Kamii, 1996). According to Park and Nunes (2001), multiplicative reasoning involves understanding that the relation between two quantities involves a ratio or a rate. In other words, one interprets the symbols, 3 × 2, as meaning that three represents the number of copies of two. For each unit within three, one forms a group or a set of two. Bicknell, Young-Loveridge, and Simpson (2017) explained the difference between conceptual understanding of additive reasoning and multiplicative reasoning and its relation to division using shoes. Using additive reasoning, individual shoes are combined to form six. Multiplicative reasoning involves recognition of matching shoes as pairs, combining three equal-sized groups of two for a total of six. Division involves decomposing the six shoes into three equal-sized groups of two shoes or grouping pairs of two to produce three groups. Mastery of basic multiplication should include meaningful understanding of the operation leading to understanding of its inverse, division (Harel & Sowder, 2005; Mauro, LeFevre, & Morris, 2003; Ploger & Hecht, 2012). For example, understanding of multiplication involves showing that a whole can be composed from equal-sized groups. Understanding of division involves decomposing a whole into equal-sized groups (Bicknell et al., 2017; Fosnot & Dolk, 2001). The literature calls for instruction that develops conceptual understanding and connects operations (Sullivan & Lovin, 2009).
However, children often learn multiplication and division procedurally, lacking conceptual understanding of the operations (Dubé & Robinson, 2018; Sullivan & Lovin, 2009). This lack of understanding goes beyond operations and written algorithms and causes difficulties related to concepts such as fractions, ratios, and proportions (Richards, 2014; West, 2014). To avoid this, the National Council of Teachers of Mathematics (NCTM; 2014) called for balanced instruction emphasizing conceptual understanding supporting the development of procedural fluency so that students advance in mathematical reasoning and connect content.
Within basic operations instruction, such as multiplication and division, students must be actively involved in reasoning and discussion. This is possible with problems that are accessible to students through manipulation of objects, pictures, drawings, and other representations (Reys, Lindquist, Lambdin, & Smith, 2006). The use of multiple representations support students’ cognitive processing while learning operations and their connections (Ainsworth, 1999). According to Ainsworth, multiple representations used within mathematical learning support students in learning computational processes, highlighting specific differences between operations, and prevent potential misconceptions. According to Pape and Tchoshanov (2001), multiple representations, including hands-on and visual representation, are critical to the development of students’ mathematical thinking. High-quality instruction in operations should provide hands-on or concrete representation of operations to assist students in their initial understanding. However, Ding and Carlson (2013) suggested that these experiences should be faded so that students transfer understanding to abstract tasks involving numbers and symbols.
Teaching multiplication and division can involve different graphical or pictorial representations that emphasize different aspects of the operations. Arrays involve a grid, showing columns with equal-sized groups of pictures in each. Compared with other representations, arrays more clearly show the commutative property (6 × 8 = 8 × 6) as well as the distributive property (6 × 8 = 6 [5 + 3] = [6 × 5] + [6 × 3]) (Harris & Barmby, 2008; Matney & Daugherty, 2013). Multiplication tables include 100 cells (10 columns and 10 rows); one labels each cell with a numeral from 1 to 100 in order. Tables show patterns, highlight the commutative property, and show division using multiples (Ploger & Hecht, 2009). Using arrays and tables empowers students to solve problems efficiently (Heinz, Star, & Verschaffel, 2009). Within the literature focused on instruction for students with learning disabilities (LD) or students who struggle, the concrete–representational–abstract (CRA) sequence is an effective method of teaching using multiple representations. The current study included this sequence, so a review and explanation of CRA’s connection to recommendations with regard to multiple representations follows.
The CRA sequence is based on Bruner’s (1966) stages that explained how children use representations to understand information. The enactive stage involves the use of objects without internal representation. During the next stage, iconic, children develop mental images of what they have manipulated and can visualize concepts in their mind. The last stage is the symbolic stage in which information related to representations can be stored in the form of symbols; symbols can be organized and classified. In addition to Bruner’s stages, the CRA sequence is consistent with Pape and Tchoshanov’s (2001) explanation of the role of representation within the development of mathematical understanding. Students interact with external representations that support their internal representations or understanding of concepts.
Within the CRA sequence, students first learn mathematics operations through the manipulation of objects, forming conceptual understanding at the concrete level. At the concrete level, students form internal representations or make meaning through manipulation of objects (Miller & Hudson, 2006). The representational stage includes the use of pictures or drawings within computation. Students make their own representations of the operation and internalize the meaning of these representations and relations to other operations (Miller, Stringfellow, & Kaffar, 2011). This is consistent with the call for fading concrete models (Ding & Carlson, 2013). Finally, students complete operations using numbers only, associating previously formed representations with symbols. During the abstract stage, instruction builds on conceptual understanding and develops procedural knowledge and fluency. CRA research also includes mnemonic strategies; however, it is imperative that students achieve firm conceptual understanding prior to emphasis on procedural knowledge and fluency (Miller, Harris, Strawser, Jones, & Mercer, 1998).
Mercer and Miller (1992) used the CRA sequence to teach place value, and basic addition, subtraction, multiplication, and division to 109 students who struggled in mathematics. Through individualized instruction, students learned multiplication and division using plates and counters at the concrete level, pictures and drawings at the representational level, and a mnemonic strategy and numbers at the abstract level. Students (n = 52) receiving CRA instruction in multiplication improved from scores of 43% to 91%. Students (n = 19) receiving CRA instruction in division improved from scores of 9% to 81%. Focusing on just division, Miller and Mercer (1993) used CRA to teach fifth-grade students who struggled in mathematics. The researchers assessed student progress with 1-min timed assessments and students completed them with 100% accuracy. Other researchers used CRA to teach basic multiplication, but they provided initial instruction in general education inclusive settings rather than remedial settings (C. A. Harris, Miller, & Mercer, 1995; Miller et al., 1998). With regard to accuracy, students with disabilities and students who struggled with mathematics performed similarly to their peers without mathematics deficits.
The aforementioned CRA studies reported gains in acquisition of basic facts with regard to accuracy and fluency, but did not report qualitative changes in student understanding. According to Smith and Smith (2006), conceptual understanding goes beyond recall and production of correct answers. Rather, Smith and Smith asked students to compose a word problem using multiplication or division, draw pictures, and solve a given multiplication problem using another operation. Greene and Shorter (2017) measured conceptual understanding a different way, through identification of errors within incorrectly solved problems.
One purpose of the current study was to capture qualitative changes in students’ understanding of basic division as they engaged in CRA instruction and, as anticipated based on the literature (C. A. Harris et al., 1995; Mercer & Miller, 1992 and Miller et al., 1998), improved their accuracy and fluency. The current study developed out of observed deficits in students’ attempts in learning division. The students in the current study had mastered most multiplication facts, but could not apply their multiplication learning to division. For example, when given a division problem that was the inverse of a mastered multiplication fact, the students could not generate the answer (e.g., if 3 × 2 = 6, the division problem 6 ÷ 2 is 3 × ? = 6). Based on Richards’ (2014) recommendations, the current researchers hypothesized that students did not have sufficient understanding of multiplication to understand division. A hands-on approach (West, 2014) to teaching unknown multiplication facts and division facts simultaneously in an alternating fashion may address students’ lack of conceptual understanding. Therefore, another purpose of this study was to investigate the effects of an alternating sequence of CRA instruction in both operations. The research questions follow.
Method
Participants
To participate in the intervention, students met the following criteria: (a) have parent permission and student assent to participate, (b) demonstrate scores of 20% or less on untimed assessments of multiplication and division computation, and (c) be eligible for and receive special education services. The students were Tyler, Julia, Wyatt, Sam, and Antoni. Tyler was eligible under the category of other health impairments (OHI) because he had a medical condition affecting attention that significantly interfered with his educational performance. The other students were eligible under the category of specific learning disabilities (SLD). The state criteria for eligibility under SLD involves three options: (a) discrepancy of 16 or more points between actual achievement and predicted achievement which is a score derived using a cognitive ability score and a regression table; (b) demonstrated lack of response to interventions within a response to intervention framework without evidence of another disability; or (c) demonstrated patterns of strengths and weaknesses. Julia, Wyatt, Sam, and Antoni’s eligibility documentation showed SLD eligibility using the previously described discrepancy model. For example, Antoni’s predicted achievement derived from a regression table was 83; this was more than 16 points higher than his actual mathematics achievement. The students’ experiences with multiplication and division differed in length of time due to their grade placement. Their resource teacher discovered deficits in multiplication and division at the beginning of the school year when providing a review of previously taught skills. Tyler was a fourth grader who experienced multiplication and division instruction in third grade. Julia, a fifth grader, had the same experiences as Tyler in third grade as well as attempts at instruction using larger numbers in fourth grade. Sam, Wyatt, and Antoni, sixth graders, had the same experiences as Julia as well as attempts at instruction using standard algorithms in fifth grade. All students participated in general education mathematics and received special education services in a resource setting for intervention support in mathematics. The researchers did not have access to the students’ socioeconomic status, but they attended a school in which 49% of the students received free and reduced lunch. See Table 1 for student demographic information.
Student Demographic Information.

Note. OHI = other health impairment; SLD = specific learning disability.
Standard score Wechsler Intelligence Scale for Children V. bStandard score Calculations subtest of Woodcock Johnson Tests of Achievement IV. cStandard score Math Facts Fluency subtest of Woodcock Johnson Tests of Achievement IV.
Settings
The researchers conducted the study in an elementary school in a rural school district in the Southeastern United States serving students in kindergarten through sixth grade. The students received special education services in a resource setting which supported their performance in a general education mathematics class. During a 20-min portion of a 50-min class, the special education teacher provided instruction in groupings of one to three based on students’ schedules. The teacher provided instruction to students in three different class periods attended by students in the same grade level. Tyler attended one. Julia attended another. Wyatt, Sam, and Antoni attended another. Instruction occurred at a kidney-shaped table in which the teacher sat in the middle and the students sat in close proximity. The students’ teacher was a certified special education teacher with a master’s degree and 5 years of teaching experience.
Assessment Materials and Procedures
During the intervention, the teacher administered probes prior to instruction to assess learning from the previous day’s lesson rather than presenting probes immediately after instruction. The researchers created three types of assessment probes used for quantitative data collection: 1-min multiplication and division probes and untimed division probes. Division was the target skill. Therefore, the researchers used untimed probes to assess students’ acquisition. Untimed probes assessed acquisition and timed probes assessed fluency. Based on the teacher’s existing progress monitoring data, the researchers created the probes using fact families from 10 facts that each of the students did not consistently know. These shared unknown facts were 2 × 9, 8 × 3, 6 × 3, 9 × 3, 7 × 3, 4 × 6, 4 × 8, 7 × 4, 9 × 4, and 6 × 6.
The researchers created five versions of untimed division probes that consisted of sheets with the 10 shared unknown division facts. The reliability coefficients for the five versions of untimed division probes were 0.94, 0.89, 0.89, 0.94, and 0.96, respectively. The teacher presented probes to students and told them they had the whole period to complete the problems.
The researchers created five versions of timed probes. There were multiple examples of each unknown multiplication fact on a multiplication probe with varied order of factors based on the commutative property (9 × 2, 2 × 9). There were multiple examples of division facts on a timed division probe written in different orders with varied divisors (18 ÷ 9, 18 ÷ 2). The researchers assessed the probes for internal consistency. The reliability coefficients for the five versions of the multiplication fluency probes were 0.97, 0.96, 0.96, 0.95, and 0.94, respectively. The reliability coefficients for the five division fluency probes were 0.96, 0.96, 0.97, 0.96, and 0.95, respectively. The teacher presented a probe and explained that there was 1 min to complete the problems. She set a timer. The students began and stopped when the timer sounded.
To capture students’ understanding of the meaning of division and its inverse relation to multiplication, qualitative data collection involved an interview in which the teacher asked students to solve problems, verbally describe, draw, and use another operation to show their conceptual understanding. These activities were consistent with components used by Smith and Smith (2006). The researchers created sheets with three division facts and a teacher script for an interview. The teacher began with open-ended questions and followed up with specific directions for drawing and connecting division to multiplication. The teacher presented a written problem and said, what is eighteen divided by nine? The teacher said, explain your answer. How did you find the answer? The student wrote or drew the process in a blank space. If the student did not respond, the teacher asked, could you show me in the space below? While students’ strategies provided insight into their thinking, the researchers wanted to know if they recognized the relation between multiplication and division. For that reason, if any student’s answer did not include reference to multiplication as an inverse operation, the teacher asked, how can you find the answer using multiplication? The teacher administered qualitative interviews to students one-on-one. The researchers captured interviews on video.
Instructional Materials
The teacher used instructional materials based on the Strategic Math Series: Multiplication Facts 0-81 (Mercer & Miller, 2010b) and Strategic Math Series: Division Facts 0-81 (Mercer & Miller, 2010a). Just as included in the two manuals, the materials included a learning contract in which the teacher and students made a commitment to teach/learn unknown facts. The manuals include procedures for coming to consensus with the students about a need for instruction in which the teacher and students discuss deficits in pretests and agree to engage in a new method for increasing mathematics skills.
Because the facts taught in this study were 10 specific shared unknown multiplication facts (2 × 9, 8 × 3, 6 × 3, 9 × 3, 7 × 3, 4 × 6, 4 × 8, 7 × 4, 9 × 4, and 6 × 6) and inverse division facts, the researchers changed the learning sheets within the existing manuals. Using the same presentation and format, the researchers created learning sheets in which all problems consisted of variations of the shared unknown facts (2 × 9, 8 × 3, 6 × 3, 9 × 3, 7 × 3, 4 × 6, 4 × 8, 7 × 4, 9 × 4, 6 × 6, 18 ÷ 2, 24 ÷ 3, 18 ÷ 6, 27 ÷9, 21 ÷ 7, 2 4÷ 4, 32 ÷ 8, 28 ÷ 7, 36 ÷ 9, and 36 ÷ 6). The learning sheets consisted of four sections labeled describe and model, guided practice, independent practice, and problem solving. Just as presented in the manuals, there were three model problems, three guided practice problems, six independent practice problems, and two word problems. Each of the 10 unknown facts or a variation (2 × 9 or 9 × 2, 18 ÷ 6 or 18 ÷ 3) appeared in each lesson. Just as the number of problems in each section of the learning sheet changed in the manuals, the 10th lesson only had one model problem and included three word problems. The manuals included a suggested teacher script and the teacher followed the script, but changed wording for problem presentation only. The manuals include student progress charts and students used these to track their progress toward mastery.
Instructional Procedures
Prior to instruction, the students and teacher discussed the need for instruction in multiplication and division. Using a contract written in the same way as the authors of the manuals prescribed, the teacher agreed to do her best to teach and the students agreed to work hard to learn multiplication and division. To ensure that students developed conceptual understanding of multiplication, division, and the relation between the two operations, instruction alternated between the two operations. The teacher taught the first multiplication lesson using manipulative items, and the following lesson was the first division lesson using manipulative items. The third lesson was multiplication and the fourth lesson was division and so on. Students moved from one lesson to the next when they completed independent practice problems with at least 80% accuracy; otherwise, the teacher repeated the lesson. The teacher presented lessons using explicit instruction. She began with an advance organizer in which she introduced the lesson topic, connected it to previous lessons or student knowledge, and established behavioral expectations for the lesson. For example, connecting the present lesson to the previous lesson included mentioning previous activities such as combining sets with equal amounts and the current activities that would also involve sets with equal amounts. Next, the teacher modeled the process for solving three problems, but also included students by asking them to repeat information or assist in counting. Then, the teacher and students solved problems together in a back-and-forth guided practice in which the teacher and students took turns and the teacher provided prompts as needed. Third, the teacher asked students to complete problems independently. As per the manual procedures, independent practice involved completion of equations (9 × 2 = ) as well as problems with words (3 plates of 7 cookies = __ cookies). Finally, the teacher provided feedback and briefly reviewed the lesson.
The lessons followed the CRA instructional sequence. The first three multiplication lessons and first three division lessons were concrete. Concrete multiplication involved translating a problem, such as 6 × 3 into words. The units within six were sets or groups. The three represented the copies or equal-sized amount within each set or group. Therefore, 6 × 3 was six sets of three. The teacher and/or students placed six plates on the table to represent sets and placed three base-ten ones blocks on each plate. Division within the manuals involved a quotitive approach in which one takes a given set of items (dividend) and makes equal-sized sets according to the divisor and the answer (quotient) is the number of equal-sized sets formed. Another approach to division is partitive in which one takes a given set of items (dividend) and decides how many sets can be made using the divisor. Then, items are equally distributed across sets and the answer (quotient) is the number of items in each equal set.
Using the quotitive approach, concrete division instruction involved translating a problem, 18 ÷ 3, into words; eighteen can be made into how many equal sets of three? The teacher and/or students gathered eighteen base-ten ones blocks (dividend). According to the units in the divisor, the teacher and/or students took three blocks, set them on a plate, and continued to make plates of three until using the entire group of eighteen. The quotient was the number of equal groups formed. After the first lesson in multiplication and division, the teacher emphasized the relation between the two operations during modeling and guided practice. For example, when solving a division problem, the teacher would remind students about previous learning in multiplication, using the units of one factor to combine sets of equal value. She stated that division also included sets of equal value, but the students separated an amount into sets of equal value using the units of the divisor. The teacher highlighted the relation between factors in multiplication and divisors in division.
At the representational level, students learned to solve problems using drawings and pictures. Just as in the manuals, Lesson 4 learning sheets had preprinted drawings and Lessons 5 and 6 required that the teacher and students draw their own models using horizontal lines and vertical tallies. For multiplication, they drew horizontal lines for each group and short vertical tallies on each line to represent the number of objects in each group. For division, they drew a large group of short tallies and underlined smaller groups of the same size to determine the number of groups. The authors of the manuals suggested the use of line drawings. After completing instruction at the representational level, the students learned a strategy to assist in attending to key features of multiplication and division problems: discover the sign, read the problem, answer or draw and check, and write the answer (DRAW; Mercer & Miller, 2010a, 2010b). The DRAW strategy provided cues for attention to detail such as attention to the sign and numbers in the problem, a reminder that facts can be drawn if not memorized, and a prompt to write the answer. The students committed the DRAW strategy to memory. At the abstract level, students solved problems using the DRAW strategy. The strategy allowed for drawings if needed, but encouraged students to attempt to answer from memory first. If students completed all 10 lessons before achieving mastery for accuracy (three consecutive probes with 10/10 correct) or fluency (three consecutive probes with 30 correct digits written in 1 min), the teacher continued to present abstract lessons and added fluency activities such as games with flash cards as the authors of the instructional manuals suggested.
Teacher Professional Development
Prior to instruction, the researchers met with the teacher twice (1.5 hr each) to introduce and provide professional development in the instructional procedures. The first meeting involved modeling of the CRA methods at the concrete, representational, and abstract levels. The teacher took the manuals to review the instructional procedures. During the second meeting, the teacher demonstrated instruction at the concrete, representational, and abstract levels. The meeting ended when the teacher demonstrated the procedures with 100% accuracy.
Reliability and Fidelity
The teacher and a researcher scored probes to ensure consistency. The researchers calculated interscorer reliability for 50% of those probes by adding all agreements in the total score and dividing this by the combination of agreements and disagreements in the total score. Interscorer reliability was 100% across all students for timed multiplication, timed division, and untimed division probes.
The researchers video-recorded 30% of the instructional sessions. Using a checklist of teacher behaviors, two researchers watched the videos and assessed whether behaviors occurred or did not occur by answering yes or no. Examples of checklist items were as follows: (a) Provides necessary instruction to students to start the lesson and gives an advance organizer by telling the students what they will be doing and why; (b) Follows program and paraphrases suggested script within the manuals; (c) Engages students in instruction during demonstration by prompting their participation, asking questions about known information; and (d) Uses objects or drawings according to the procedures prescribed in the manuals. The researchers watched the videos with the CRA manuals and learning sheets on hand to ensure that the teacher followed appropriate procedures. The two researchers compared their checklists and calculated interscorer agreement by adding agreements and dividing that sum by the number of agreements and disagreements. Treatment fidelity was 100% and interscorer agreement was 100%.
Social Validity
The teacher provided information about the need for the study prior to instruction. Weekly fluency measures completed before the study showed lack of mastery. The teacher reported that students had difficulties in their general education mathematics classes because they did not know certain facts, nor did they have a way of finding the answer with drawings, known facts, or other strategies. The teacher and students completed social validity surveys after instruction and the items required a yes or no answer. The researchers wrote items using positive and negative statements such as using the objects made multiplication easier and using the objects made multiplication confusing. The teacher read the student survey aloud to each student individually. All (100%) of the students reported the following: (a) they liked the learning contract and progress-monitoring graph; (b) they knew more about math, multiplication, and division after intervention; (c) objects and drawings made operations easier; (d) they will continue to use the DRAW strategy; and (e) they recommended that other students learn multiplication and division the way they did. The teacher reported the following: (a) the students needed an intervention targeting multiplication facts and division; (b) the students mastered basic multiplication and division; (c) CRA instruction was easy to implement; (d) the learning contract and progress monitoring graphs positively influenced student motivation; (e) she would use the program again and recommend this method to other teachers.
Research Design
Quantitative design
The researchers used a multiple probe across students design to analyze student progress in learning multiplication and division facts. The researchers collected baseline data regarding accuracy in computing 10 division facts as well as fluency in multiplication and division (number of correct digits written in 1 min). When the first student demonstrated a stable baseline, defined as five data points with no more than 10% variability across the last three, the student began the CRA multiplication and division intervention. The other students remained in baseline until the first student demonstrated progress as defined as 60% of facts correct on the untimed division probes. If the second student’s data were stable, she began the intervention, while the third group of students remained in baseline. Once the second student demonstrated progress (at least 60% on untimed division probes), the third group began the intervention phase. The researchers defined mastery within the intervention phase as writing at least 30 correct digits across three consecutive timed probes and 100% accuracy for three consecutive untimed probes. After students demonstrated mastery of each skill, instruction ceased and the researchers assessed maintenance every 2 weeks with an additional probe. The students completed maintenance probes until the last student mastered each skill and completed at least one maintenance probe.
Qualitative design
The researchers used qualitative procedures to analyze the data collected from videos of student interviews in which students described and drew how they solved problems. The researchers used a deductive or theoretical thematic analysis (Braun & Clarke, 2006). Within this approach, researchers code data for a specific research question and pay attention to themes identified in previous research. Previous researchers define conceptual understanding of division as decomposition of numbers with equal-sized groups (Bicknell et al., 2017; Fosnot & Dolk, 2001) and a student’s use of another operation (Smith & Smith, 2006). Therefore, the researchers sought to assess the extent to which students’ explanations showed knowledge that a group was separated into set(s) of the same size as well as knowledge that a division problem could be solved with multiplication, showing understanding of the inverse relation.
With these themes of conceptual understanding, according to methods described by Nowell, Norris, White, and Moules (2017), before analysis began, three researchers participated in cross training regarding the coding process. Then the three researchers watched videos of the students’ interviews separately before and after instruction. Separately, they noted the following: (a) the students’ words, phrases, and drawings that indicated knowledge that division involves a group that is separated into other groups that are the same size; (b) the students’ words, phrases, and drawings that indicated that a student used a multiplication problem to solve a division problem; (c) the extent to which students’ actions or language varied from lesson presentation; (d) the length of responses such as the number of words or sentences within the response. After the three researchers compiled their notes, they compared their categorization of data units into the preexisting themes associated with conceptual understanding of division. This use of three coders provided researcher triangulation, enhancing the analysis (Pope, Ziebland, & Mays, 2000). When all three researchers categorized a unit of data within the same theme, the researchers considered it a demonstration of a student’s conceptual understanding.
Results
The researchers noted students’ performance using graphs. They used visual analysis of graphs displaying students’ baseline and intervention performance in the areas of division accuracy (percentage correct on untimed assessment) and fluency in division and multiplication (number of correct digits written on 1-min timed assessments). The graphs for division accuracy, division fluency, and multiplication fluency are in Figures 1 to 3.
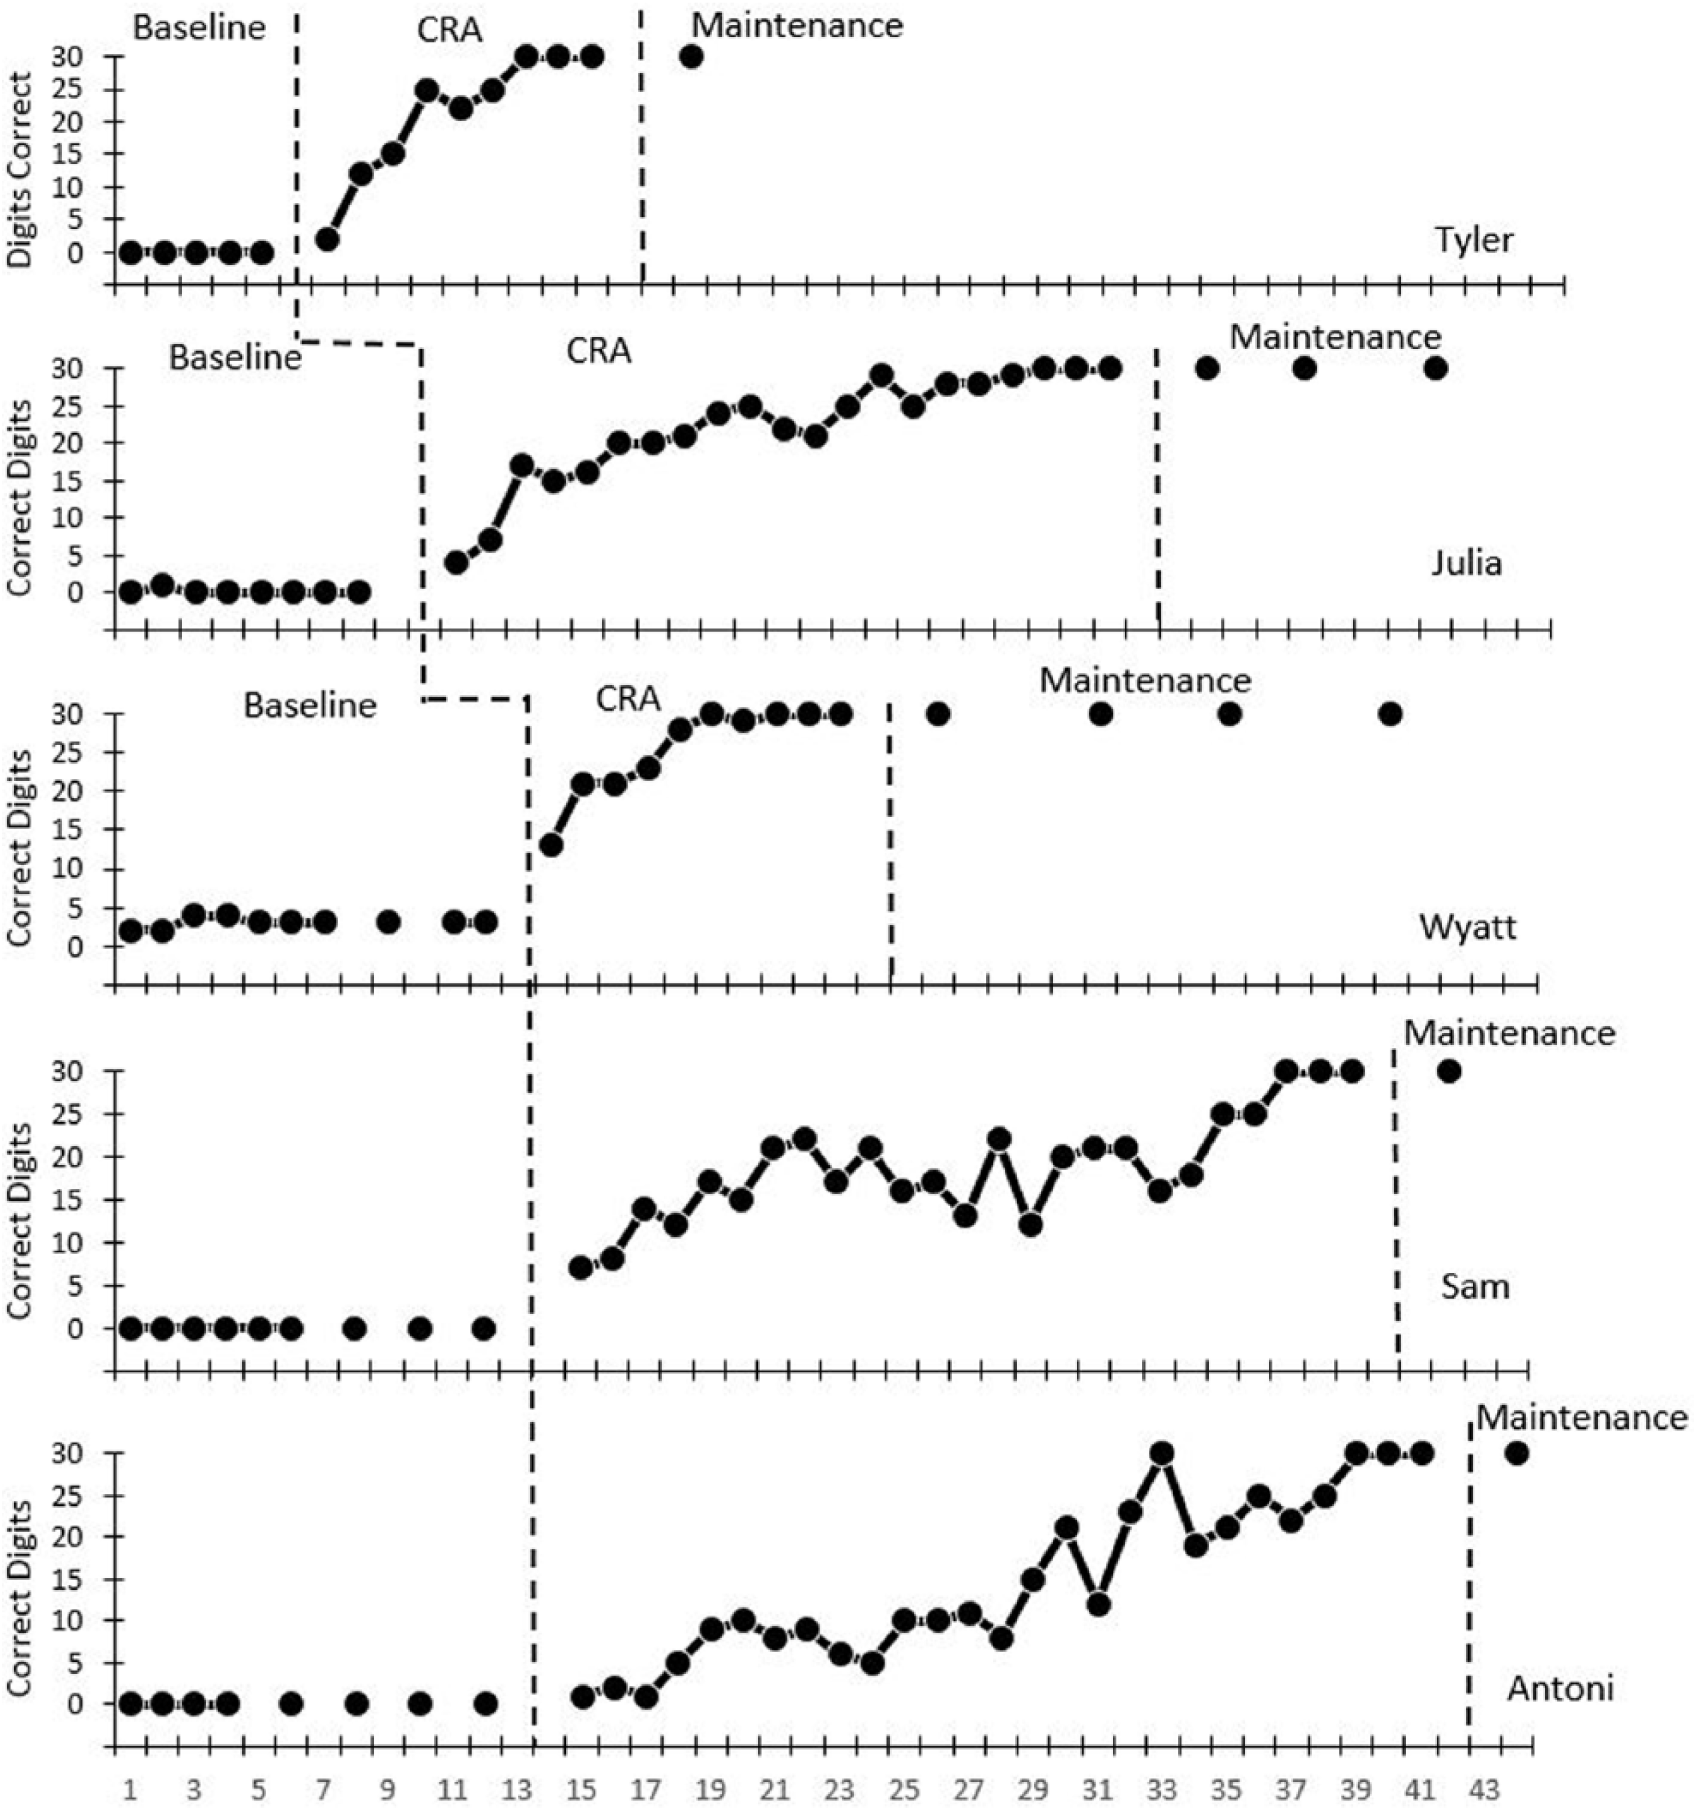
Division fluency results.
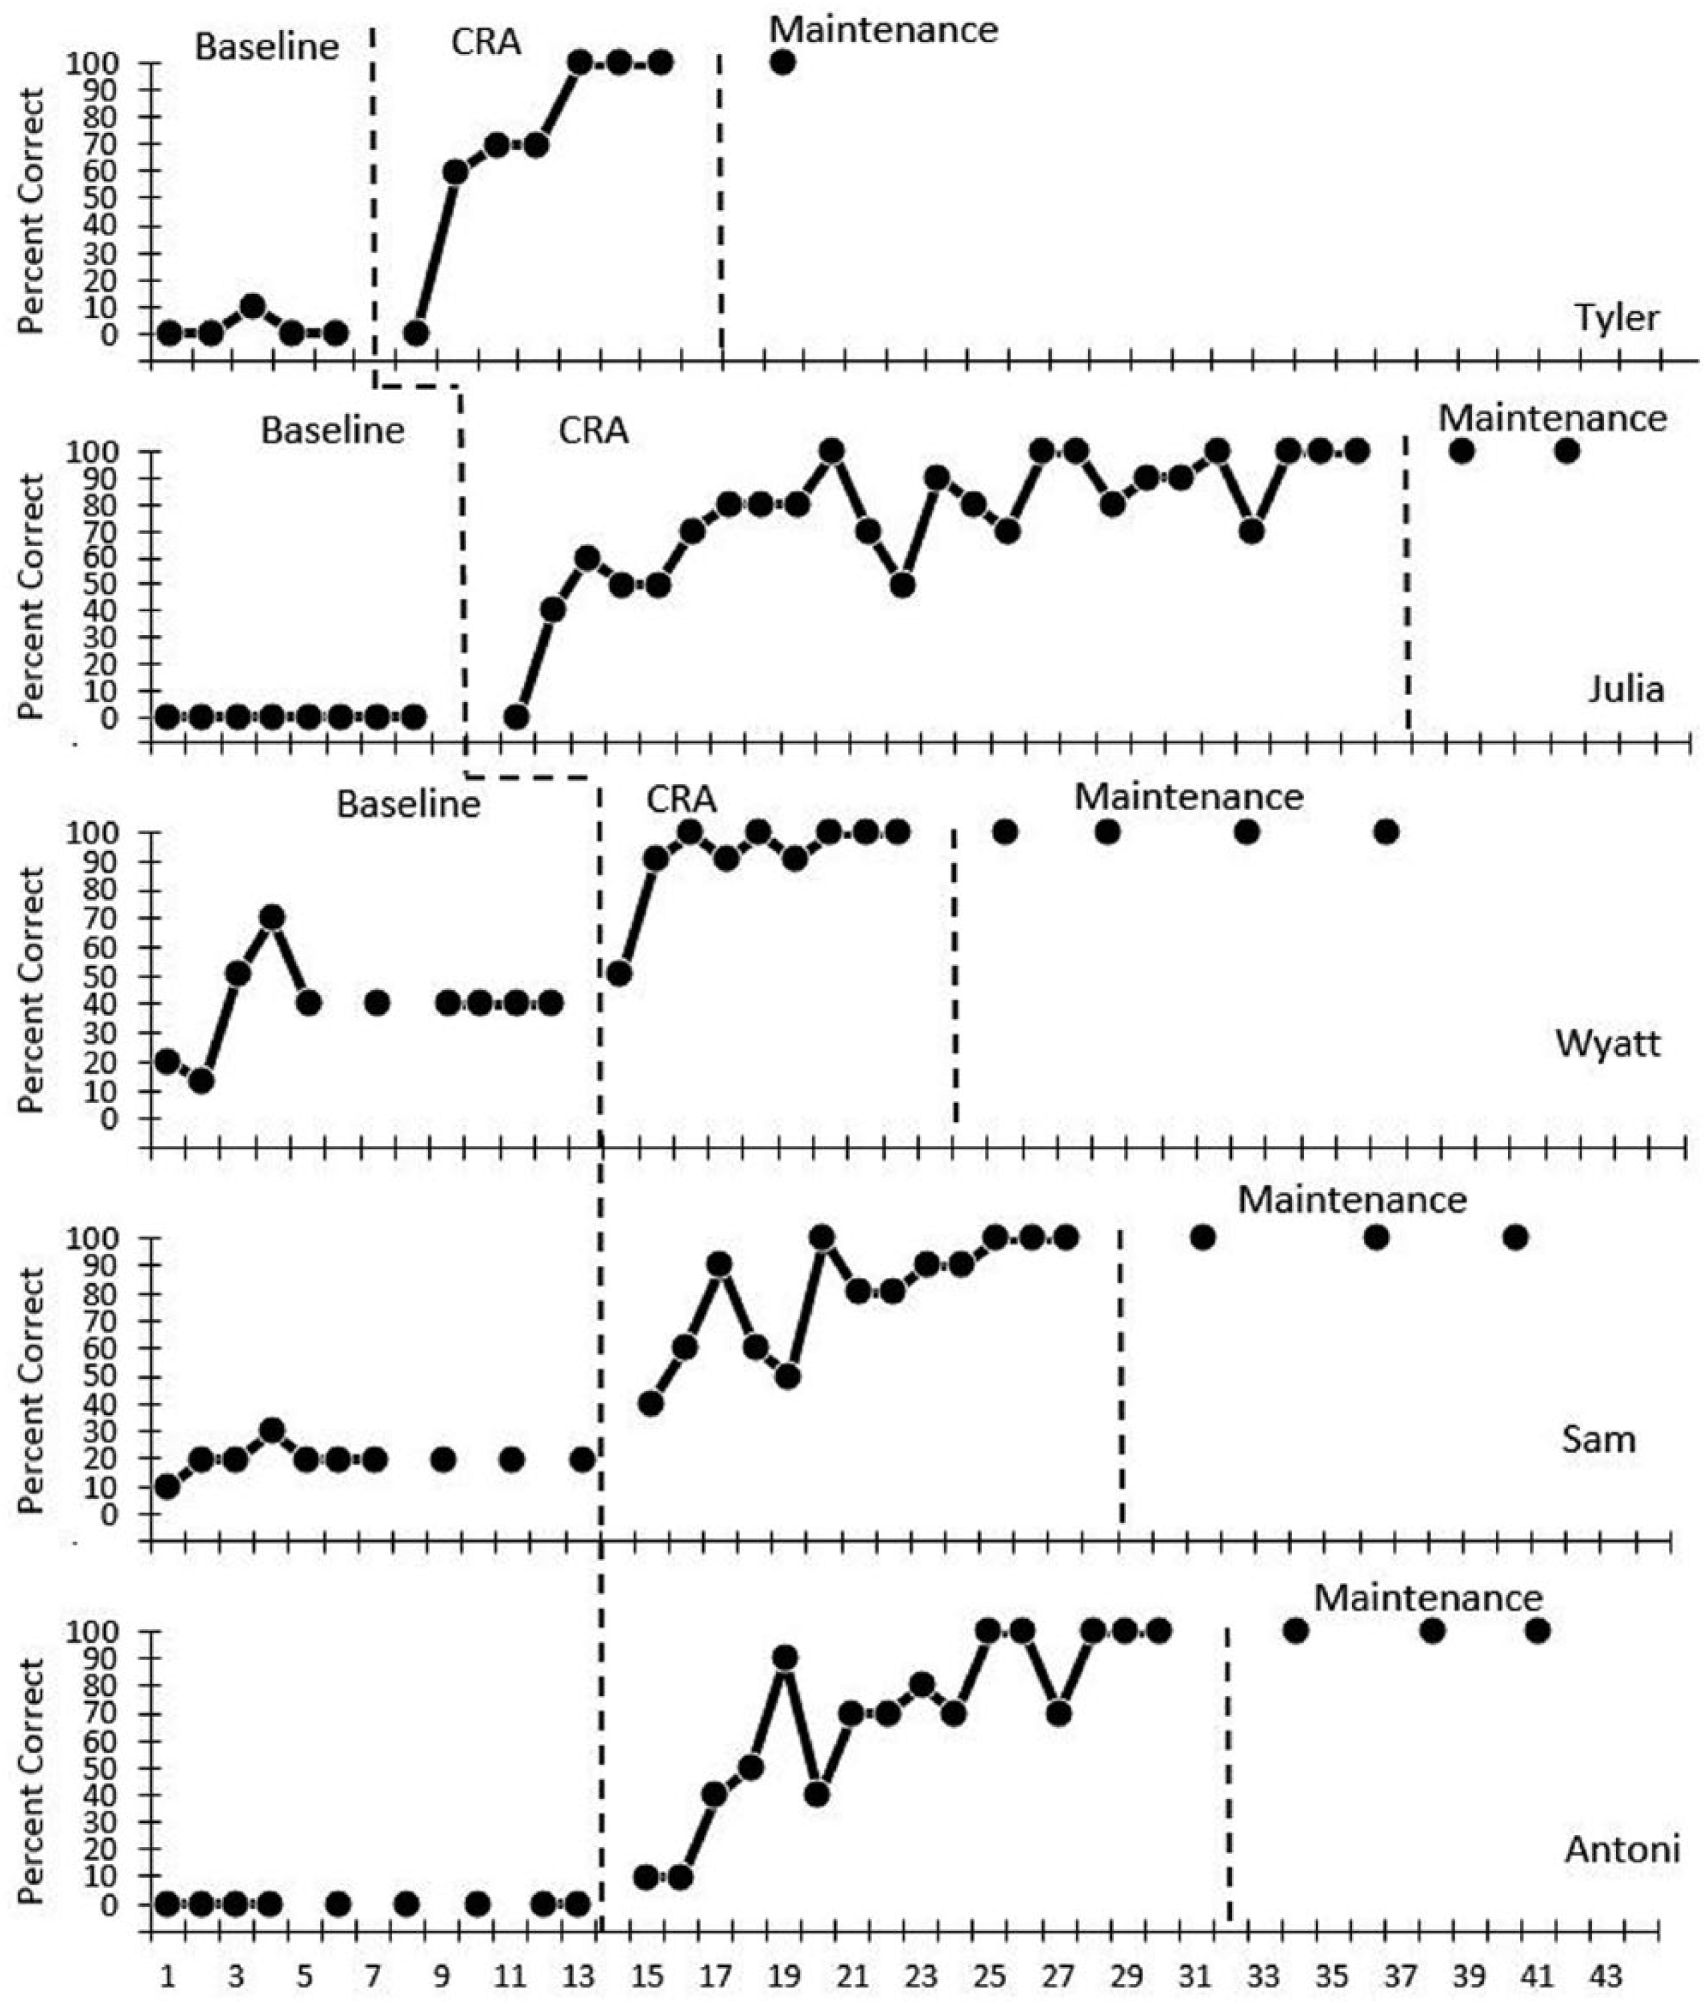
Division percent correct results.
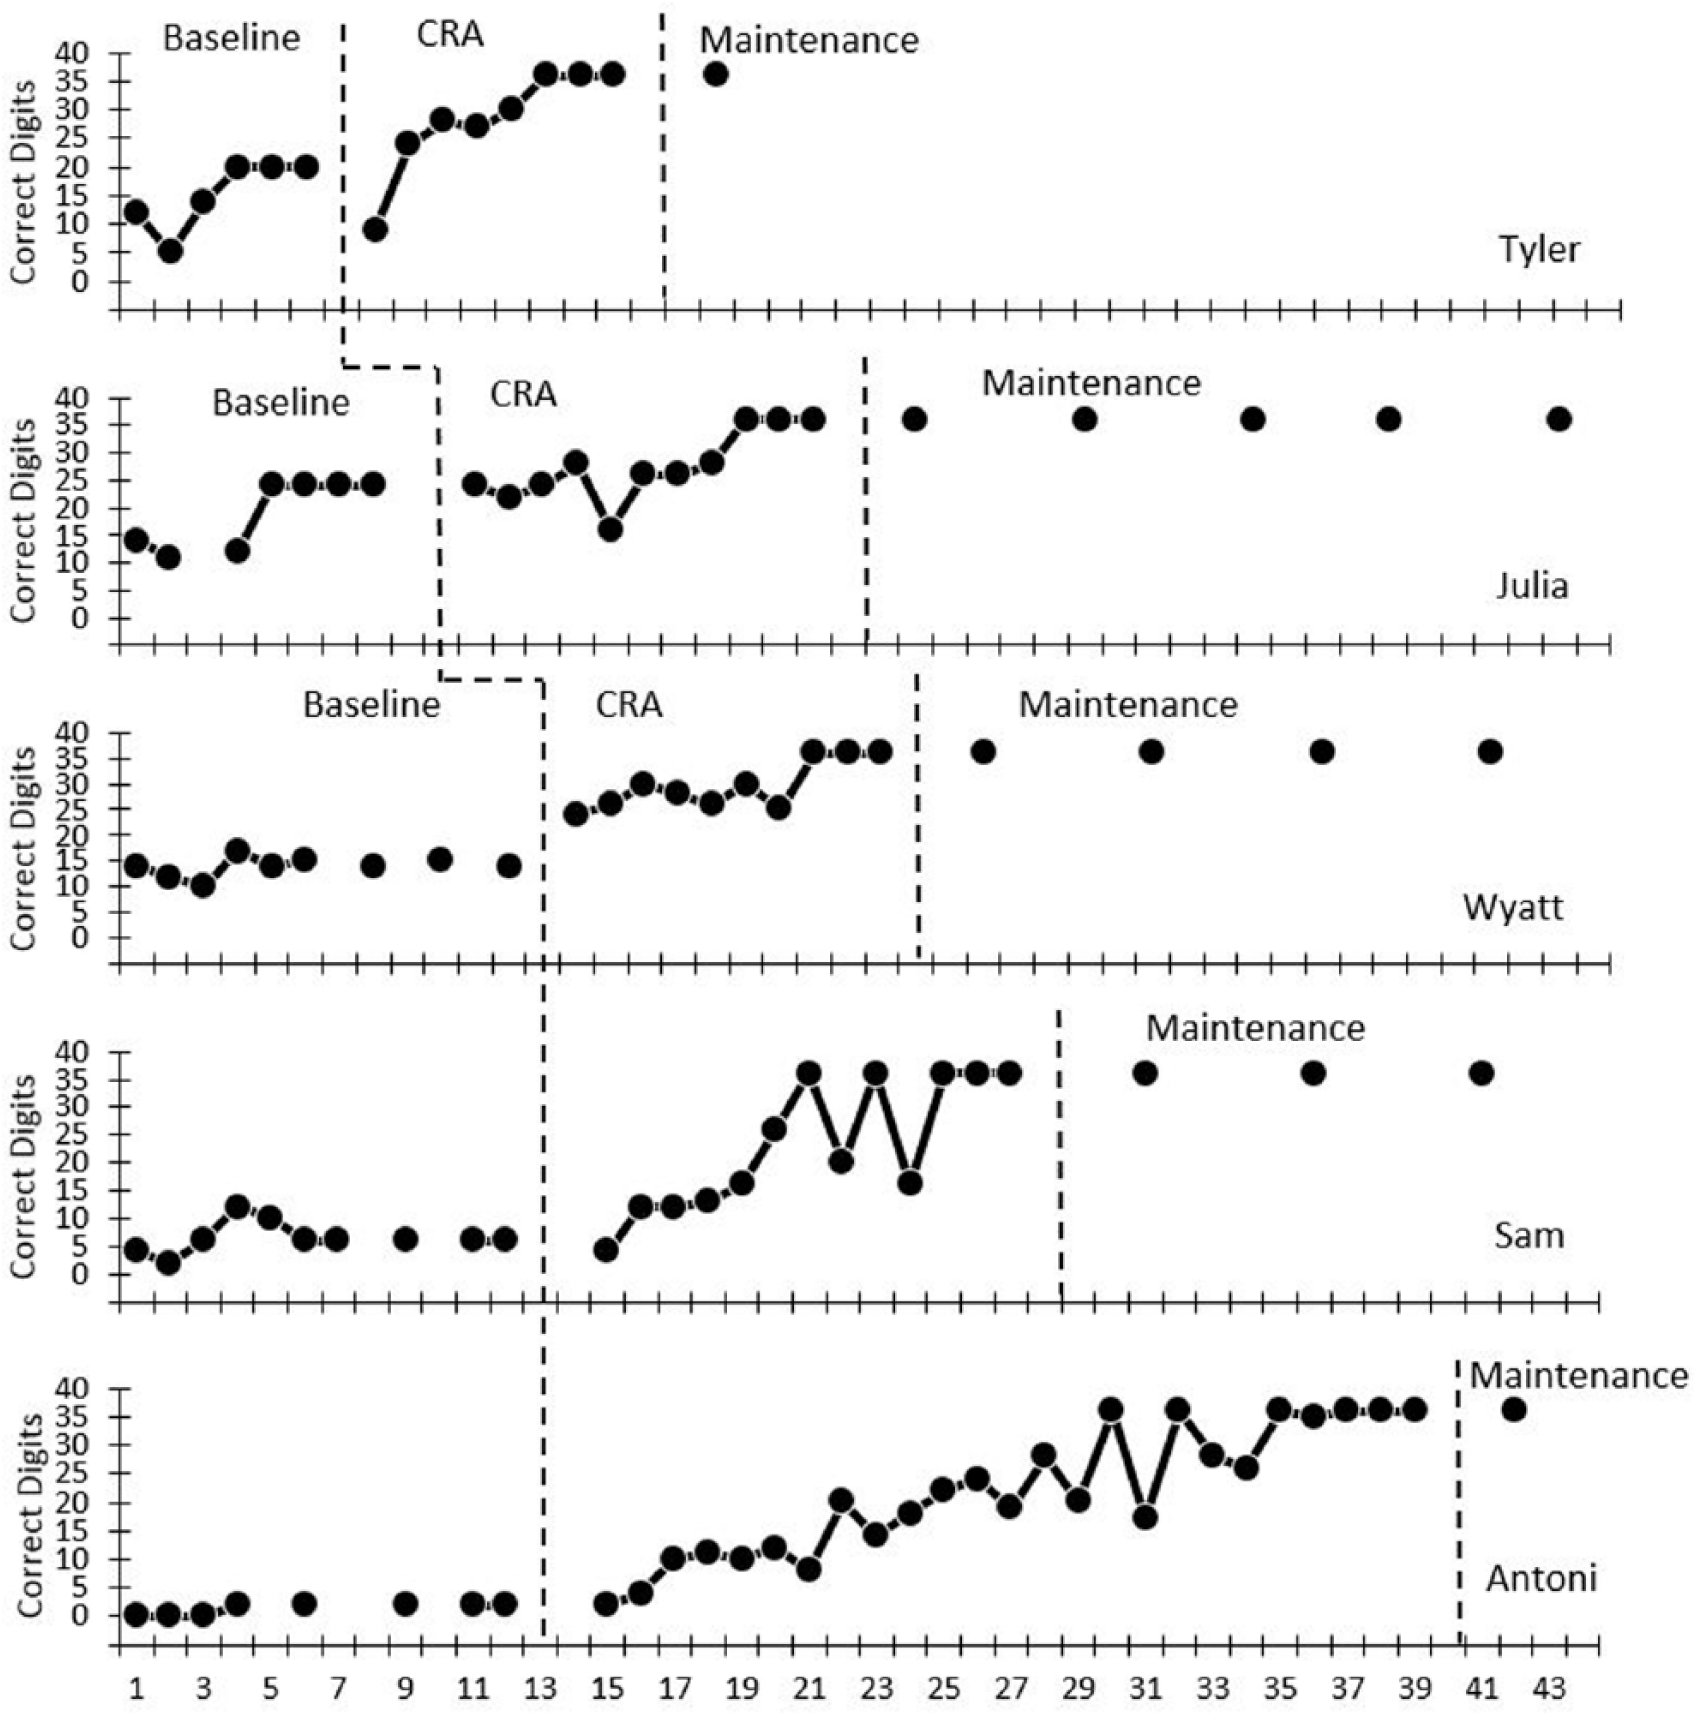
Multiplication fluency results.
The researchers analyzed the data visually, noting the range, level, immediacy of effect, number of probes to criteria for mastery (three consecutive probes with 100% accuracy or 30 correct digits), and the percentage of nonoverlapping data points (PND) between baseline and intervention (Scruggs & Mastropieri, 2013). The researchers calculated effect size using the Tau-U statistic; this is a statistical analysis that accounts for trend in baseline as well as the lack of overlap and trend within intervention data paths (Parker, Vannest, Davis, & Sauber, 2011). The researchers detected a trend in a student’s multiplication fluency baseline and that is why they used this statistic. Three researchers analyzed the qualitative data by noting students’ language and actions related to the understanding of division and its inverse relation to multiplication.
Quantitative Results for Division Accuracy
Tyler’s baseline performance ranged from 0% to 10% with a level of 2%. There was no immediate effect with one overlapping data point (PND = 86%). The intervention data ranged from 0% to 100% with a level of 71%. Tyler reached criterion for mastery after four probes. The Tau-U was 0.82, indicating a strong effect. Tyler maintained his performance 2 weeks after reaching criterion, but he moved to another school, so no more maintenance data were taken. Julia’s baseline level was zero. There was no immediate effect with one overlapping data point (PND = 96%). The intervention data ranged from 0% to 100% with a level of 76%. Julia reached criterion for mastery after 18 probes. The Tau-U for Julia’s accuracy was 0.96, indicating strong effect. Julia maintained her performance every 2 weeks after meeting criterion for 4 weeks. Wyatt’s baseline level was 39%, ranging from 13% to 70%. There was no immediate effect with one overlapping data point (PND = 89%). The intervention data ranged from 50% to 100% with a level of 91%. Wyatt reached criterion for mastery after nine probes. The Tau-U was 0.96, indicating a strong effect. Wyatt maintained his performance for 8 weeks.
Sam’s baseline level was 20%. There was an immediate effect, increasing from 20% to 40% (PND = 100%). The intervention data ranged from 40% to 100% with a level of 80%. Sam reached criterion for mastery after 13 probes. The Tau-U was 1.0, indicating a strong effect. Sam maintained his performance after the intervention as measured every 2 weeks for 6 weeks. Antoni’s baseline level was 0%. There was an immediate effect, increasing from 0% to 10% (PND = 100%). Intervention data ranged from 10% to 100% with a level of 68%. Antoni reached criterion for mastery after 15 probes. The Tau-U was 1.0, indicating a strong effect. Antoni maintained his performance for 6 weeks as measured with probes given every 2 weeks.
Quantitative Results for Division Fluency
Tyler’s baseline level was zero digits. There was an immediate effect with an increase from zero to two digits (PND = 100%). The intervention data ranged from two digits to 30 digits with a level of 21 digits. Tyler reached criterion after six probes. The Tau-U was 1.0, indicating a strong effect. Tyler maintained his fluency for 2 weeks after the intervention. Julia’s baseline level was 0.13 digits. There was an immediate effect with an increase from zero to four digits (PND = 100%). The intervention data ranged from four digits to 30 digits with a level of 22 digits. Julia reached criterion after 20 probes. The Tau-U was 1.0, indicating a strong effect. Julia maintained her performance, writing 30 correct digits every 2 weeks for 6 weeks.
Wyatt’s baseline level was three digits, ranging from two to four. The intervention had an immediate effect with an increase from three to 13 digits (PND = 100%). The intervention data ranged from 13 digits to 30 digits with a level of 26 digits. Wyatt reached criterion for mastery after nine probes. The Tau-U was 1.0, indicating a strong effect. Wyatt maintained his performance for 8 weeks with maintenance probes given every 2 weeks. Sam’s baseline level was zero digits. The intervention had an immediate effect with an increase from zero to seven digits (PND = 100%). The intervention data ranged from seven digits to 30 digits with a level of 19 digits. Sam reached criterion for mastery after 25 probes. The Tau-U was 1.0 indicating a strong effect. Sam maintained his performance for 6 weeks after the intervention with maintenance probes given every 2 weeks. Antoni’s baseline level for division fluency was zero digits. The intervention had an immediate effect with an increase from zero to one digit (PND = 100%). The intervention data ranged from one digit to 30 digits with a level of 15 digits. Antoni reached criterion for mastery after 26 probes. The Tau-U for Antoni’s division fluency was 1.0, indicating a strong effect. Antoni maintained his performance 2 weeks after the intervention ended.
Quantitative Results for Multiplication Fluency
Tyler’s baseline level was 14 digits. There was no immediate effect with one overlapping data point (PND = 88%). The intervention data ranged from nine digits to 36 digits with a level of 28 digits. Tyler reached criterion after eight probes. In calculating Tyler’s Tau-U, the researchers detected a trend in baseline, so the researchers took this into account when running the contrast; the trend in baseline resulted in a less robust Tau-U score. The Tau-U for Tyler’s multiplication fluency was 0.63, indicating a moderate effect. Tyler maintained his performance 2 weeks after the intervention. Julia’s baseline level was 17 digits, ranging from 12 to 24 digits. The intervention did not have an immediate effect with four overlapping data points (PND = 64%). The data ranged from 16 digits to 36 digits with a level of 27 digits. Julia reached criterion after 11 probes. The Tau-U was 0.62, indicating a moderate effect. Julia maintained her performance for 10 weeks with maintenance probes given every 2 weeks.
Wyatt’s baseline level was 14 digits, ranging from 10 to 17 digits. There was an immediate effect and no overlapping data points (PND = 100%). The intervention data ranged from 24 digits to 36 digits with a level of 30 digits. Wyatt reached criterion after 10 probes. The Tau-U was 1.0, indicating a strong effect. He maintained his performance for 8 weeks after the intervention with probes given every 2 weeks. Sam’s baseline level was six digits, ranging from two to12 digits. There was no immediate effect with three overlapping data points (PND = 77%). The data ranged from four digits to 36 digits with a level of 23 digits. Sam reached criterion after 13 probes. The Tau-U was 0.85, indicating a strong effect. Sam maintained his performance every 2 weeks after meeting criterion for 6 weeks. Antoni’s baseline level was 1.25 digits, ranging from zero to two digits. There was no immediate effect with one overlapping data point (PND = 96%). The data ranged from two digits to 36 digits with a level of 22 digits. Antoni reached criterion for mastery after 24 probes. The Tau-U was 0.9, indicating a strong effect. Antoni maintained his performance 2 weeks after the intervention.
Qualitative Results
Responses prior to intervention
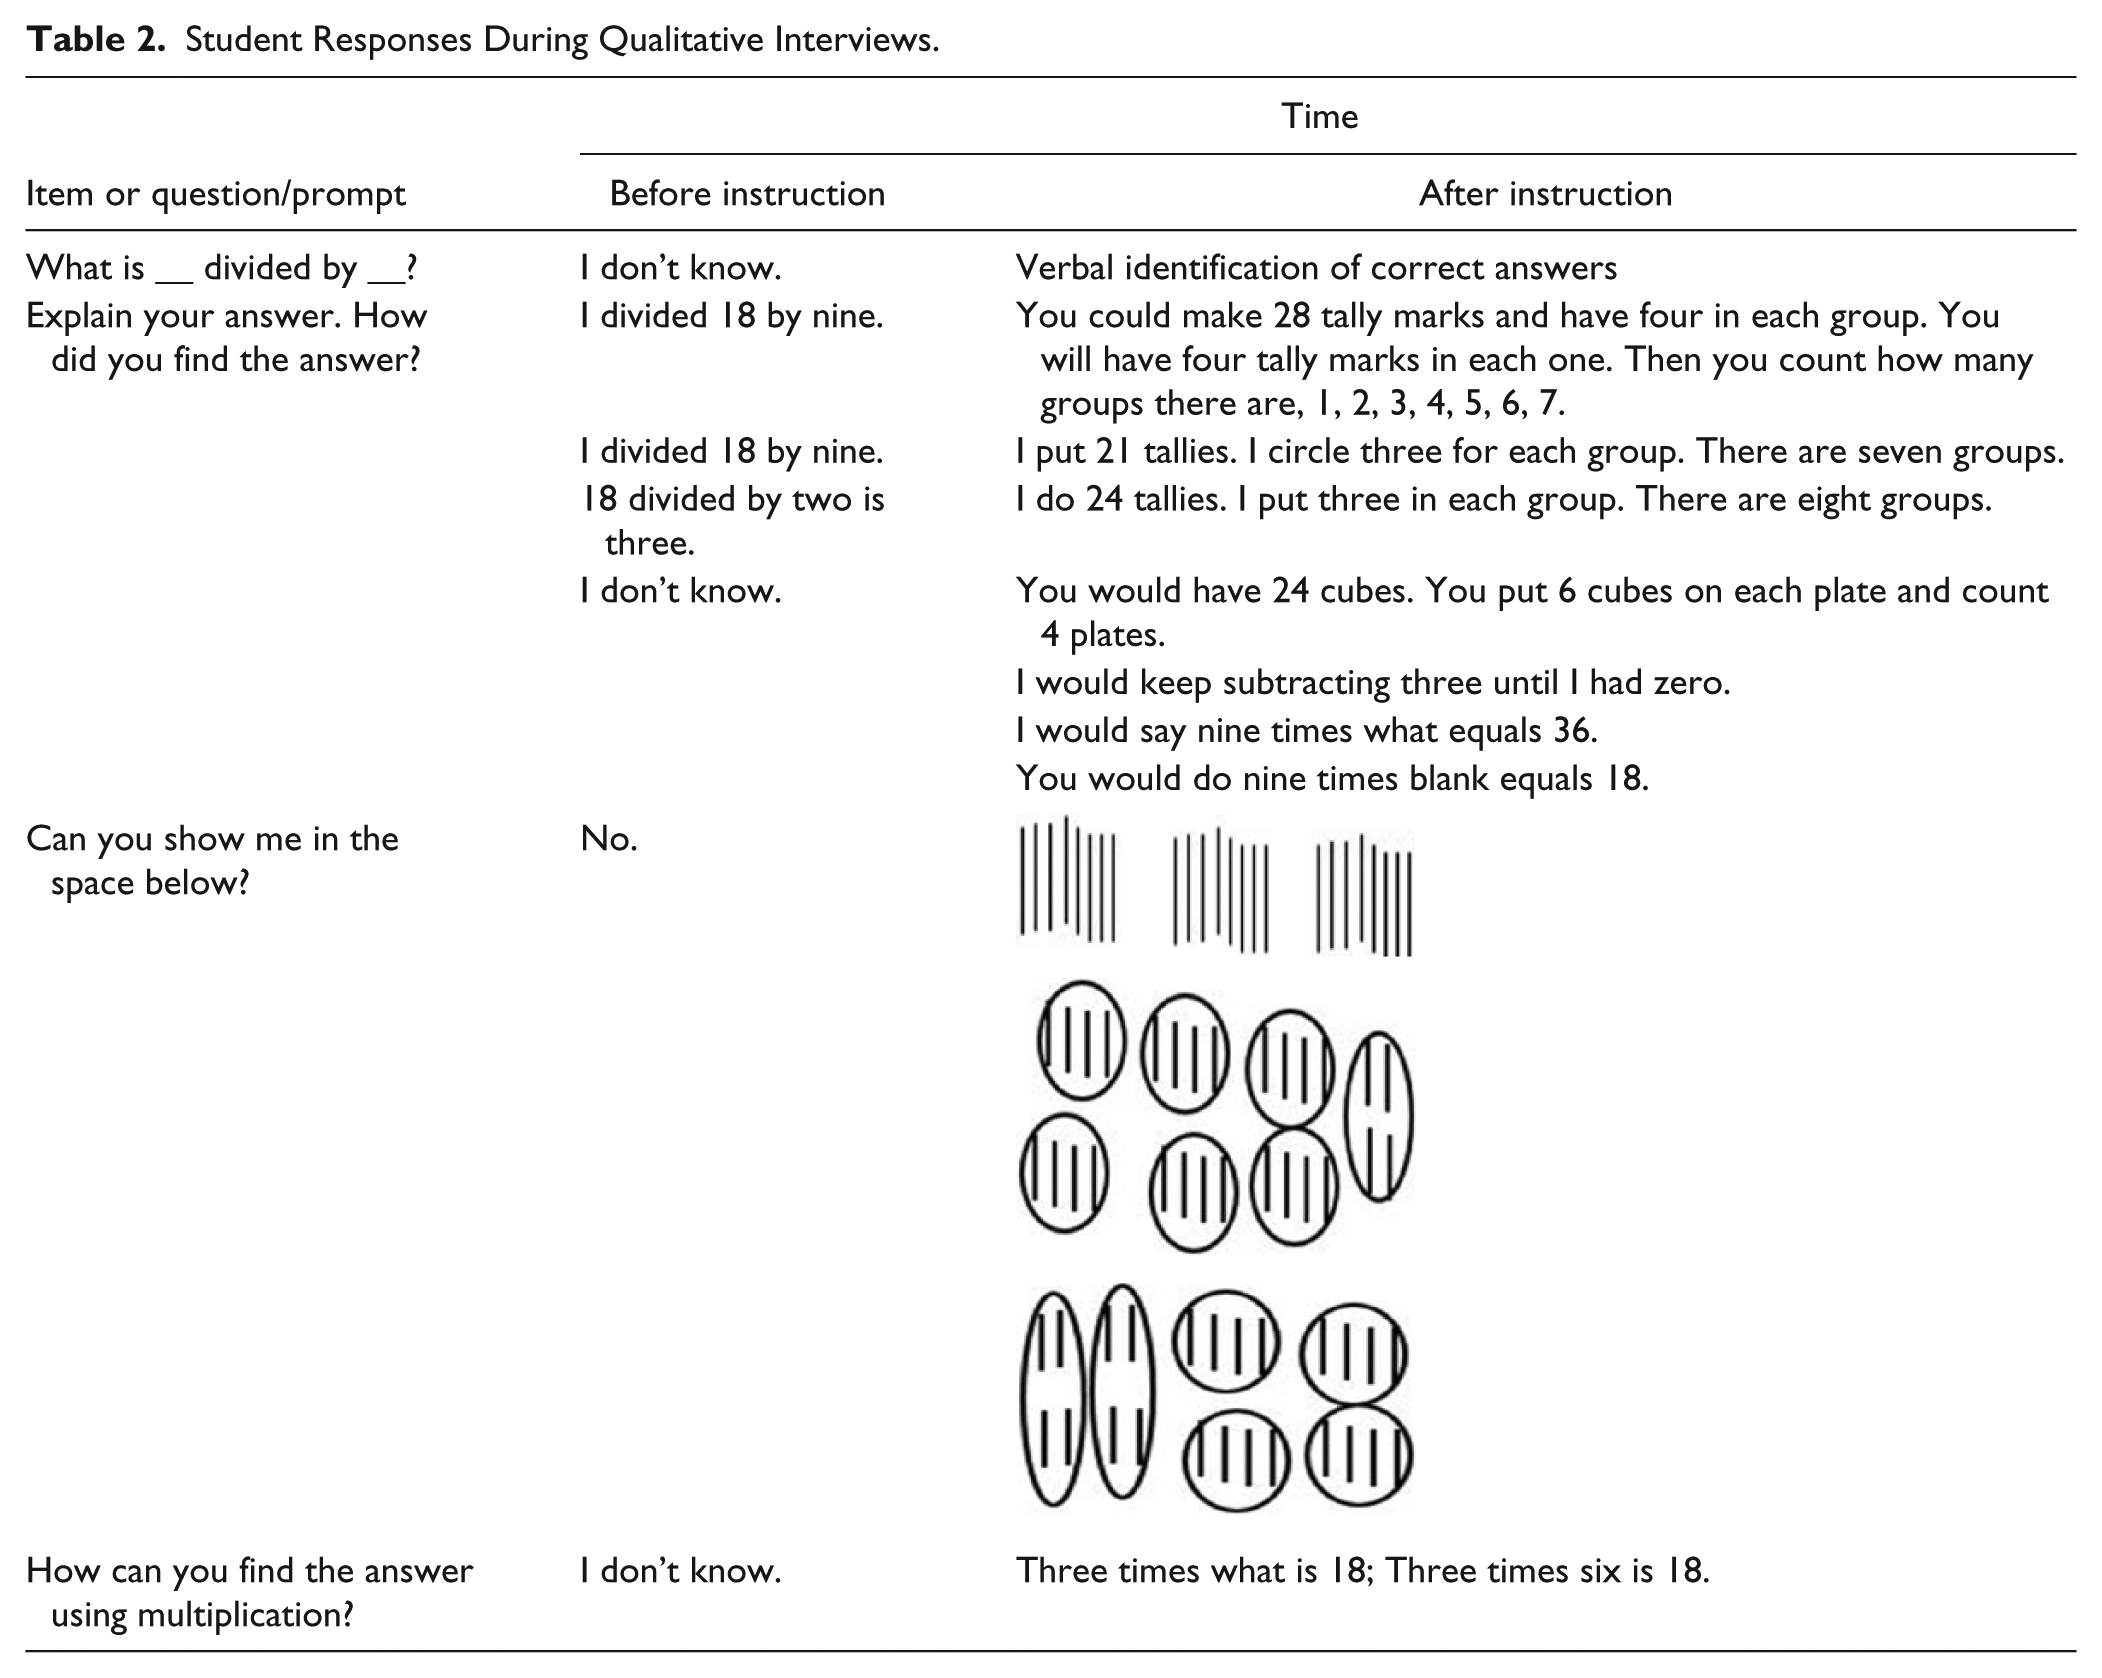
Prior to intervention, none of the students provided an accurate quotient, or verbal or pictorial explanation of the division operation. None of the students used multiplication to solve the division problem. After the teacher prompted students to use drawings or multiplication, none of the students provided a response other than, I do not know or No. Table 2 provides a summary of students’ responses before and after instruction.
Student Responses During Qualitative Interviews.
Explanations of division after intervention
After the intervention, all of the students provided a verbal and pictorial explanation of division upon the first request. All of the students described the process as one involving a group separated into smaller sets of the same size. Table 2 shows examples of their explanations and a rendering of drawings. The researchers agreed that the students explained and showed the existence of a larger group with actions and words such as put 21 tallies or do 24 tallies. The students physically separated same-sized sets and said I circle or I put three in each group. The researchers agreed that Trey also indicated separation of same-sized sets with large spaces between sets in his drawings.
Explanations of inverse relation after intervention
Four students spontaneously indicated knowledge of an inverse relation between the operations. Researchers agreed that each student created missing multiplier equations when given a division problem. Example answers are in Table 2. Antoni required a specific prompt as to how to solve the problem with multiplication. After the teacher asked, Antoni said, Three times what is 18; three times six is 18.
Length of responses and similarity to instruction
All of the students provided responses that were longer than responses given prior to intervention. Trey’s drawings differed from those used within instruction. The other students used tallies and circles as seen during instruction, but they created large disorganized drawings. This differed from small and organized drawings that they created during instructional lessons. Wyatt described an example that included plates and cubes which exactly described concrete instruction.
Discussion
The purpose of this study was to investigate the effects of alternating CRA multiplication and CRA division instruction on students’ mastery as well as conceptual understanding of multiplication and division. The researchers demonstrated a functional relation between this use of CRA instruction and students’ accuracy in division facts and fluency in multiplication and division facts. All five students met the accuracy criterion in division. In addition, all five students met the fluency criterion of writing 30 correct digits in a minute on three consecutive multiplication probes and division probes with 100% accuracy. This meant that students could not partially answer facts correctly (9 × 3 = 24) and meet the criteria. After instruction, students maintained their skills. The students engaged in the lessons and participated in each lesson as required. Students’ confidence in their mathematics ability appeared to increase after CRA instruction. The researchers made an inference regarding the students’ confidence using reports provided by the students’ special education teacher and general education teachers. The teachers reported increases in students’ participation such as verbal contributions during whole-class discussions. The teachers reported that students made positive comments about mathematics problems that involved multiplication and division. The teachers provided the following examples: (a) This is easy; (b) Division is just the opposite of multiplication; and (c) If you know your multiplication facts, you know your division facts.
Before CRA instruction began, none of the students wrote more than four correct digits on the division probes. The students wrote more correct digits on their baseline multiplication fluency probes (up to 17), but most of these digits were just one numeral within the correct two-digit answer (e.g., 7 × 4 = 21). After the intervention, students exceeded the criterion of 30 correct digits. The accuracy and fluency results are similar to those found by previous researchers (Harris et al., 1995; Mercer & Miller, 1992; Miller et al., 1998; Miller & Mercer, 1993). However, this study presented instruction in the two operations at the same time and this did not appear to interfere with students’ learning.
The current study differs from other CRA research because it included a qualitative component and attempted to investigate students’ understanding of operations, as advocated for by NCTM (2014). The students explained their approach to solving division facts using words and drawings. Prior to CRA, students used few words and did not provide more than a restatement of the equation. After instruction, students responded using more words, sentences, and drawings that meaningfully demonstrated how they understood division. Although most of the students’ drawings were similar to instruction, there were differences in organization. If students had used exact procedures as instruction, their drawings would have been neatly drawn vertical tallies that fit within a few inches of space. The students would have connected tallies together using neatly drawn horizontal lines underneath to show the groups.
The qualitative data also attempted to show students’ understanding of the inverse relation between division and multiplication. Although the students had previous knowledge of multiplication and division, it did not appear that they were aware of the inverse nature of the operations. After CRA, students solved division facts with multiplication, demonstrating application of the inverse relation between the operations. Four of the five students did this spontaneously without a prompting question. Instruction did not specifically teach students to use multiplication to solve division facts. At the concrete and representational levels, the teacher referenced the inverse nature, but the procedure of changing a division fact into a missing multiplier equation was not part of instruction. It is not known whether students drew their own conclusions or if previous learning contributed to its use. It is possible that students learned this procedure previously, and CRA instruction encouraged or reminded students to use it.
Limitations and Future Research
The study is limited in that it did not involve a comparison between CRA and another intervention. Future research could involve CRA and interventions using other representations (e.g., arrays and tables). Generalizability of the results limits the study. CRA instruction led to increased accuracy, fluency, and precision in students’ explanations of their computation, but these results do not generalize to other students due to the research design. Future research may address this issue with studies that include larger groups and rigorous experimental designs.
Conclusions and Implications
The alternating CRA instructional sequence proved successful when implemented in a natural setting for students with SLD and OHI, a portion of their regularly scheduled supplemental mathematics instruction. The students’ resource teacher implemented instruction related to their individualized program goals, but used a different approach. The teacher easily used the manual and learning sheets. The teacher had manipulative objects available as typical tools used to address students’ mathematical goals. Prior to CRA, the teacher had used the same amount of class time to address deficits with 1-min timings and flash cards. These implementation issues are important for replication and further implementation. Although the current study involved students with SLD in the resource setting, the ease of implementation and resources needed might allow for further study with students who are at risk for identification and receive focused small group instruction. The results related to students’ explanations show that alternating CRA instruction might better emphasize concepts than remedial instruction in which educators teach operations separately.
The students in the current study were in grades four, five, and six. Lack of mastery of multiplication may become more and more problematic as students with SLD advance from grade to grade. The fifth- and sixth-grade standards related to multiplication, division, and fractions become more complex; they rely less on models and representation and more on procedures and algorithms (Common Core State Standards Initiative [CCSSI], 2010). Therefore, deficits in conceptual understanding and fluency have a greater impact when students do not have visual models (arrays, number lines, and equipartitioned shapes for fractions). This alternating sequence may be an efficient way to teach both operations to students with SLD in need of remediation. However, researchers need additional data to draw these conclusions.
Footnotes
Declaration of Conflicting Interests
The author(s) declared no potential conflicts of interest with respect to the research, authorship, and/or publication of this article.
Funding
The author(s) received no financial support for the research, authorship, and/or publication of this article.
