



Abstract
Schematic chunks denote patterns, schemes, or sophisticated rules and knowledge stored in the long-term memory in the form of chunks. We investigated whether schematic chunking is effective in improving the performance of students with math difficulties (MD) and students at risk of math failure, and how the complexity level of geometry problems and students’ content knowledge moderate the effects of a visual chunking accommodation. A 3 (problem difficulty level) × 2 (plain version/chunking version) ×2 (cheat sheet provided/not provided) mixed design was used. Thirty-three students, including 18 with MD and 15 at risk, were randomly assigned to two groups: A “cheat sheet” of related theorems was provided to one group but not the other. Students in both groups received two versions of a geometry test: (a) a test with a plain figure representation, and (b) a parallel test with coloring and marks that highlighted the elements of a schematic chunk. Results found a main effect of chunking for all participants, and the chunking effect was greater for difficult one-step and multi-step problems than for simple one-step problems. Providing a cheat sheet increased the chunking effects for solving only the difficult one-step problems pertaining to low-frequency theorems for students with MD.
International competitions have revealed U.S. students’ underachievement in mathematics, particularly in geometry, compared with other industrialized nations (Bailey et al., 2014; Mullis et al., 2016). Reflecting these increasing concerns regarding students’ geometry learning, the K–12 Common Core State Standards in Mathematics (CCSS; Common Core State Standards Initiative, 2010) increased the emphasis on transformational geometry. National Council of Teachers of Mathematics (NCTM; 2000) has also set up geometry learning guidelines, moving from an emphasis on rote learning to problem solving.
Most of the current research on geometry problem solving for students with math difficulties (MD) has focused on the elementary level and relatively simple subjects, such as area, perimeter, and basic spatial imaginary skills (Bergstrom & Zhang, 2016). As students approach high school, geometry standards become more complex and in-depth. According to CCSS (2010), high school students are expected to develop an understanding of the attributes and relationships of geometric objects and apply this knowledge in novel contexts. Students engage in problem solving (Schoenfeld, 1992) to make connections (Hiebert & Grouws, 2007) across topics, such as right triangles, circles, congruence, trigonometry and geometric measurement, and formalize their geometry experience, using more precise definitions and careful proofs.
Theoretical Framework
Geometry Achievement and Visual Encoding
Due to the unique characteristics of geometry, research has identified the significant role that spatial abilities have in geometry-related academic achievement (Bizarro et al., 2018; Hannafin et al., 2008; Markey, 2009). For instance, Reuhkala (2001) found moderate correlations among spatial processes and high school algebra and geometry competence. Giofrè et al. (2013) examined the relationship between visuospatial working memory, intuitive geometry (i.e., geometry tasks independent from education), and academic achievement at the secondary school level, and results supported that visual-spatial working memory explained a significant portion of the variance in geometrical performance. Hannafin et al. (2008) found that students with weak spatial abilities demonstrated lower achievement in geometry than those whose spatial abilities were stronger. Li and Geary (2013, 2017) suggested that children who show above-average gains in visuospatial memory across their elementary school years have advantages in geometry learning beyond fifth grade.
Not all visual abilities are related to students’ geometry achievement. Giofrè et al. (2013) found that visual working memory is involved in some aspects of geometry (i.e., the manipulation of visual representations), but not in Euclidean geometry (e.g., lines, points, parallelism, angles, and triangles). Some visual working memory tests, such as the ability to retain a shape or a pattern of locations, did not correlate significantly with performance in geometry, which demonstrates that the ability to retain a shape or a pattern of locations is not always crucial to success in geometric tasks. Instead, Giofrè et al. (2013) found that students’ geometry achievement was directly influenced by a complex visual working memory task (i.e., the jigsaw puzzle task), which is not about rote memorization and manipulation of visual images but about the analysis of semantic relations between the puzzle chips (i.e., how to make a watering can with four puzzle chips). Mammarella et al. (2013) compared visual working memory capacity and performance on intuitive geometry tasks between normal-achieving students and students with nonverbal learning disabilities. They reported that the children with nonverbal disabilities performed worse than peers to a larger extent on complex visual working memory tasks than on simple image storage tasks, and such complex visual working memory differences accounted for group differences in their geometry achievement.
Hegarty and Kozhevnikov (1999) distinguished between two types of visuospatial representations: schematic representation, which encodes the spatial relationships between objects, and pictorial imagery, which provides vivid and detailed visual appearances. A schema is “a cognitive construct that organizes the elements of information according to the manner with which they will be dealt” (Sweller, 1994, p. 296). Researchers found a positive correlation between success in mathematical problem solving and the use of schematic representations, whereas the use of pictorial representations was negatively correlated with success in mathematical problem solving (Hegarty & Kozhevnikov, 1999; Matheson & Hutchinson, 2014; van Garderen, 2006). What affected students’ mathematics achievement is their encoding of the spatial relations between objects rather than their capacity to form a representation of figures in pictorial details (Hegarty & Kozhevnikov, 1999). The preference of pictorial imagery to schematic decoding could be the reason for the lack of success of struggling students compared with high-achieving students, who tend to prefer schematic representations (van Garderen, 2006).
That said, although there is a fundamental visual component to geometry—more than in other domains of mathematics such as algebra—research has suggested that achievement in school geometry is more related to one’s ability to encode spatial relations among objects in a schematic structure than in one’s cognitive capacity to retain pictorial details. Just as in chess, a master’s superior ability has much less to do with their photographic or mechanic memory of the positions of pieces than their capacity to encode the arrangements of pieces using associations to the experts’ extensive chess knowledge base (Chase & Simon, 1973). Therefore, facilitating the development of students’ abilities to encode schematic interactivity among the visual elements involved in a geometric figure is critical for improving their learning of geometry, especially those students who struggle to learn the subject.
Reducing the Cognitive Load with Schematic Chunks in Geometry Problem Solving
Cognitive load theory is concerned with cognitive resources and the limited capacities of a cognitive system (Sweller, 1994). If cognitive loads exceed cognitive capacity, an individual’s ability to learn will be hindered (Sweller, 1994). Cognitive load denotes the cognitive loads caused by interacting elements, namely, elements of information that are logically related and must, therefore, be simultaneously processed to achieve understanding (Sweller, 2010; Sweller et al., 2011) but that have not yet been integrated and stored in long-term memory as a single chunk or schema (Chen et al., 2015). For example, to solve a problem using the angle bisector theorem (“If a point lies on the bisector of an angle, then it is equidistant from both sides of the angle”), students have to understand all of the elements (e.g., an angle and the two rays that compose it, an angle bisector, a point on the angle bisector, the two perpendicular segments from the point on the angle bisector to each side of the angle) that constitute a particular diagrammatic representation of the situation. Simultaneously, students must process the elements of any verbal statements associated with the diagram and identify a correspondence between the elements of the diagram and the elements of the verbal statements. The working memory load can be overloaded due to the high intrinsic cognitive processes required to enact these intellectual efforts.
Cognitive load can be altered by changing the nature of the information or by advancing the expertise of learners (Chen et al., 2015). Relative to learning geometric theorems, the elements involved in the diagram and statements may be integrated and stored in long-term memory as a single chunk or schema, thereby resulting in a reduced intrinsic cognitive load (Sweller, 2010). In relation to the previous example of the angle bisector theorem, once a student has knowledge of the constituent elements and has adequately interpreted the theorem statement, that learner should be able to synthesize all those elements into a chunk or a schema. Thus, the learner is then prepared to engage with problems upon which the angle bisector theorem relies using the synthesized chunk as a single element in interaction with other elements in the posed problem.
Effects of Expertise in Forming Schematic Chunks
As mentioned earlier, intrinsic cognitive load can be altered by changing the nature of the information or by advancing the expertise of learners (Chen et al., 2015). For example, as students learn geometric theorems, they integrate an array of visual and verbal interactive elements into integrated and meaningful chunks. Consequently, what are high-element interactivity problems for less experienced learners become low-element interactivity problems for more knowledgeable students because they are able to engage in problem solving by relying on fewer schematic chunks than their less knowledgeable counterparts who are forced to accommodate what for them is an overwhelming number of interactive elements. With expertise, information that once consisted of many interactive elements can be transformed into fewer semantic chunks or schema, and thus, the intrinsic working memory load can be reduced so that students are less likely to be overwhelmed. Chase and Simon’s (1973) classic study of chess demonstrated this phenomenon by illustrating the superior memory of chess positions by chess experts who were able to recognize the meaningful associations of the chess arrangements, as opposed to chess novices who tended to regard positions as individual elements because they had not constructed meaningful associations.
Problem solvers’ expertise is closely related to their prior knowledge of the task domain. The complexity of materials and levels of element interactivity are always related to levels of the learner’s prior knowledge (or expertise) in a task domain (Sweller & Chandler, 1994; Tindall-Ford et al., 1997). In the case of problem solving in geometry, while learners who possess a less sophisticated understanding of the related concepts must simultaneously process all the constituent visual and verbal interactive elements, more knowledgeable learners incorporate interacting elements in the relevant schemas/theorems as chunks of information held in long-term memory. By treating the problem as a single, familiar chunk of information, learners’ working memory resources required for processing this information should be reduced.
As mentioned, individual differences in knowledge of the task domain emerge as variations in students’ capacity to recognize schematic chunks, schema, or theorems constituting a number of interactive elements (Lin & Lin, 2013). A student, who has investigated a theorem about the relationships among pairs of angles that are formed when a transversal cuts a pair of parallel lines, is more likely than a student who has not engaged with that theorem to recognize the constituent visual and verbal elements (i.e., angle pairs, pairs of parallel lines, and the transversal that cuts the parallel lines to form the angle pairs) and integrate them into a schematic chunk. That chunk, now stored in long-term memory, is then available to the student when they need to deduce such relationships as the measures of corresponding or alternate interior angles.
In contrast, students with difficulties in learning geometry may not have successfully constructed and stored the schematic chunks that would allow them to bring those geometric relationships to bear on their problem solving. First, for many reasons (e.g., poor memory, poor quality instruction), students with MD or at-risk students may lack the knowledge of geometry schemas/theorems. Second, even if some struggling students have the knowledge, many of them cannot recognize the visual patterns that correspond to the geometry schemas/theorems, especially when the problem complexity level is high. In either case, chunking has not occurred, and so struggling students (i.e., at-risk or students with MD) show difficulties in discerning the relationships between the elements in geometric representations and their related theorem.
Helping Students to Identify Schematic Chunks in a Geometry Figure
To integrate the interactive elements that form a schematic chunk according to a geometry theorem, two skills are required: first, the problem solver needs to know the geometry theorem; second, the problem solver needs to be able to identify the visual interactive elements in the theorem and distinguish the visual chunk from the complex configuration background. A geometry diagram may consist of multiple chunks and elements, and typically, as the diagram complexity increases, the number of chunks increases as well. Carpenter and Shah’s (1998) two-stage model of configuration comprehension suggested that problem solvers typically experience two stages to form a chunk in a diagram. First, during the pattern recognition stage, figure readers encode a visual pattern by forming a visual chunk. Then, during the interpretive stage, they translate the pattern into its quantitative and qualitative interpretation and relate the information to the diagram. Ratwani et al. (2008) introduced visual integration and cognitive integration as the main mechanisms needed to extract interactive elements to form a schematic chunk from diagrams, and suggested that coloring interactive elements of a schematic chunk with the same color could increase the perceptual proximity, which facilitates both visual and cognitive integration by reducing search cost and working memory load.
Marking the visual interactive elements on the diagram also facilitates the integration of visual and verbal elements to form a chunk (Sweller et al., 1990). For example, when presented with triangle ABC along with the statement, “AB = BC = AC,” a problem solver must search for the corresponding visual elements in the diagram. If this statement is located beneath or above the diagram, then attention must be split between the diagram and the statements, and the two must be mentally integrated before the given information can be interpreted and the relationships understood. Differently, the cognitive load imposed by searching for these diagrammatic references can be reduced by adding markings directly to the diagram to identify the relationships from the given statement.
Prior research (Zhang et al., 2012, 2014) demonstrated that highlighting visual chunks was helpful to elementary students with math difficulties (MD) to solve visual imaginary problems. In a single-subject design study, Zhang and colleagues (2012) investigated the effectiveness of visual chunking in helping four elementary students with MD to solve intuitive geometry problems that called on them to perform geometric transformations (e.g., ratios, translations, and reflections) of visual images. All four participants demonstrated a higher accuracy when geometry problems were represented with graphs of visual-chunking representation than with traditional-element representation. Another group study (Zhang et al., 2014) compared the differences in performance between two groups of students with and without MD when using the visual chunking representation. They found that students with geometry difficulties made greater improvement than students without MD, which we took to indicate that the visual chunking representation technique should be recommended as an effective accommodation for children with MD. Zhang (2014) also conducted a single-subject design study with students with MD to further explore the possibility of improving college students’ performance in solving more sophisticated geometry problems by connecting visual chunking to the long-term memory of the students who failed a math screening test and were enrolled in a developmental math remediation program. Results of the study showed that all participants improved their accuracy from baseline to posttest.
Research Questions
The purpose of this study was to extend the exploration of chunking representation from basic intuitive geometry problems at the elementary level to schematic visual chunking in higher order geometry problem solving at the high school level. In this study, we aimed to answer three research questions:
We manipulated students’ expertise with two variables: (a) classifying participants either as students having difficulties with math or as students at risk of math failure (based on grades and teacher’s assessment), and (b) providing students with a “cheat sheet” of relevant geometry theorems and postulates to improve student knowledge. We manipulated the difficulty level of geometry problems by selecting problems of different complexity (i.e., the number of steps).
We hypothesized that (a) all struggling students, including students with MD and at risk, perform better when provided with visual chunking presentation than when solving problems with plain figure representation; (b) all struggling students would make greater improvement with the visual chunking representation on problems with greater complexity and difficulty levels than on simple one-step problems; and (c) students’ expertise in geometry knowledge would moderate the chunking effects, specifically that students with MD would show greater improvement with the visual chunking representation when a cheat sheet of geometric theorems and postulates was provided.
Method
Design
This study used a 3 (problem difficulty level) × 2 (plain version/chunking version) × 2 (cheat sheet provided/not provided) mixed design, with two within-subject variables of (a) problem difficulty level (one-step simple problems/one-step difficult problems/multi-step problems) and (b) chunking/plain figure representations, and a between-subject variable of cheat sheet provided/not provided.
Participants
Participants in the study were enrolled in a suburban school district in the northeastern United States. They were recruited from ninth-grade inclusive classrooms and were compensated for their time by their teachers with extra credit. A total of 35 ninth-grade high school students participated in the study and 33 completed the whole study. Each student was identified by their math teacher as a student struggling with learning geometry. Although all participants were referred by their math teachers as students struggling in learning mathematics, we further divided them into two groups: (a) students with MD who met one or more of the following three criteria: (1) having received a grade of C or below in a high school geometry subject; (2) being eligible for special education services, with an individual education program (IEP) goal in mathematics; and/or (3) having failed the state standardized test in mathematics, or (b) students at-risk of math failure who did not meet the MD criteria.
According to the demographic data provided by the school, among the 33 participants who completed the whole study, 22 (55.67%) of the participants were White, two (6.7%) were Black, two (6.1%) were Hispanic, and three (9.1%) were Asian. Fourteen (42.4%) were female and 19 (57.6%) were male. Four of the 33 students (12.1%) received free or reduced-price lunch.
Among the 18 students with MD, six (33.3%) were female and 12 were male (66.7%); 11 (61.1%) were White, two (11.1%) were Black, one (5.6%) was Hispanic, one (5.6%) was Asian, one was other, and two (11.1%) were unknown; four (22.2%) received free or reduced price lunch; 12 (66.67%) failed the state standardized test in mathematics; 13 (72.2%) were officially diagnosed with learning disabilities and four (22.22%) were officially diagnosed with other health impairment; and 12 (66.67%) received a C or lower grade in a high school geometry subject. Of the 33 participants, the remaining 15 students were considered at-risk of math failure.
Procedures
All participants were asked to take a geometry test. Students were randomly assigned to two conditions: one condition in which students were provided with a cheat sheet that we created which included all related theorems and postulates needed to solve the geometry problems on the test, and the other condition in which students were not provided with the cheat sheet. To ensure that the students assigned to the two conditions were equivalent, we provided demographic information for each group in Table 1. There were no significant differences between the two groups in terms of race, gender, social economic status, and disability status. Students in both conditions received two versions of the geometry test: (a) a test with a plain figure representation, and (b) a parallel test with colored representations and marks that highlight the interactive elements of a schematic chunk involved in problem solving. Both tests included paralleled items or the same items. Example items can be found in Figure 1.
Demographic Information of Participants Assigned to Groups With and Without Cheat Sheet.
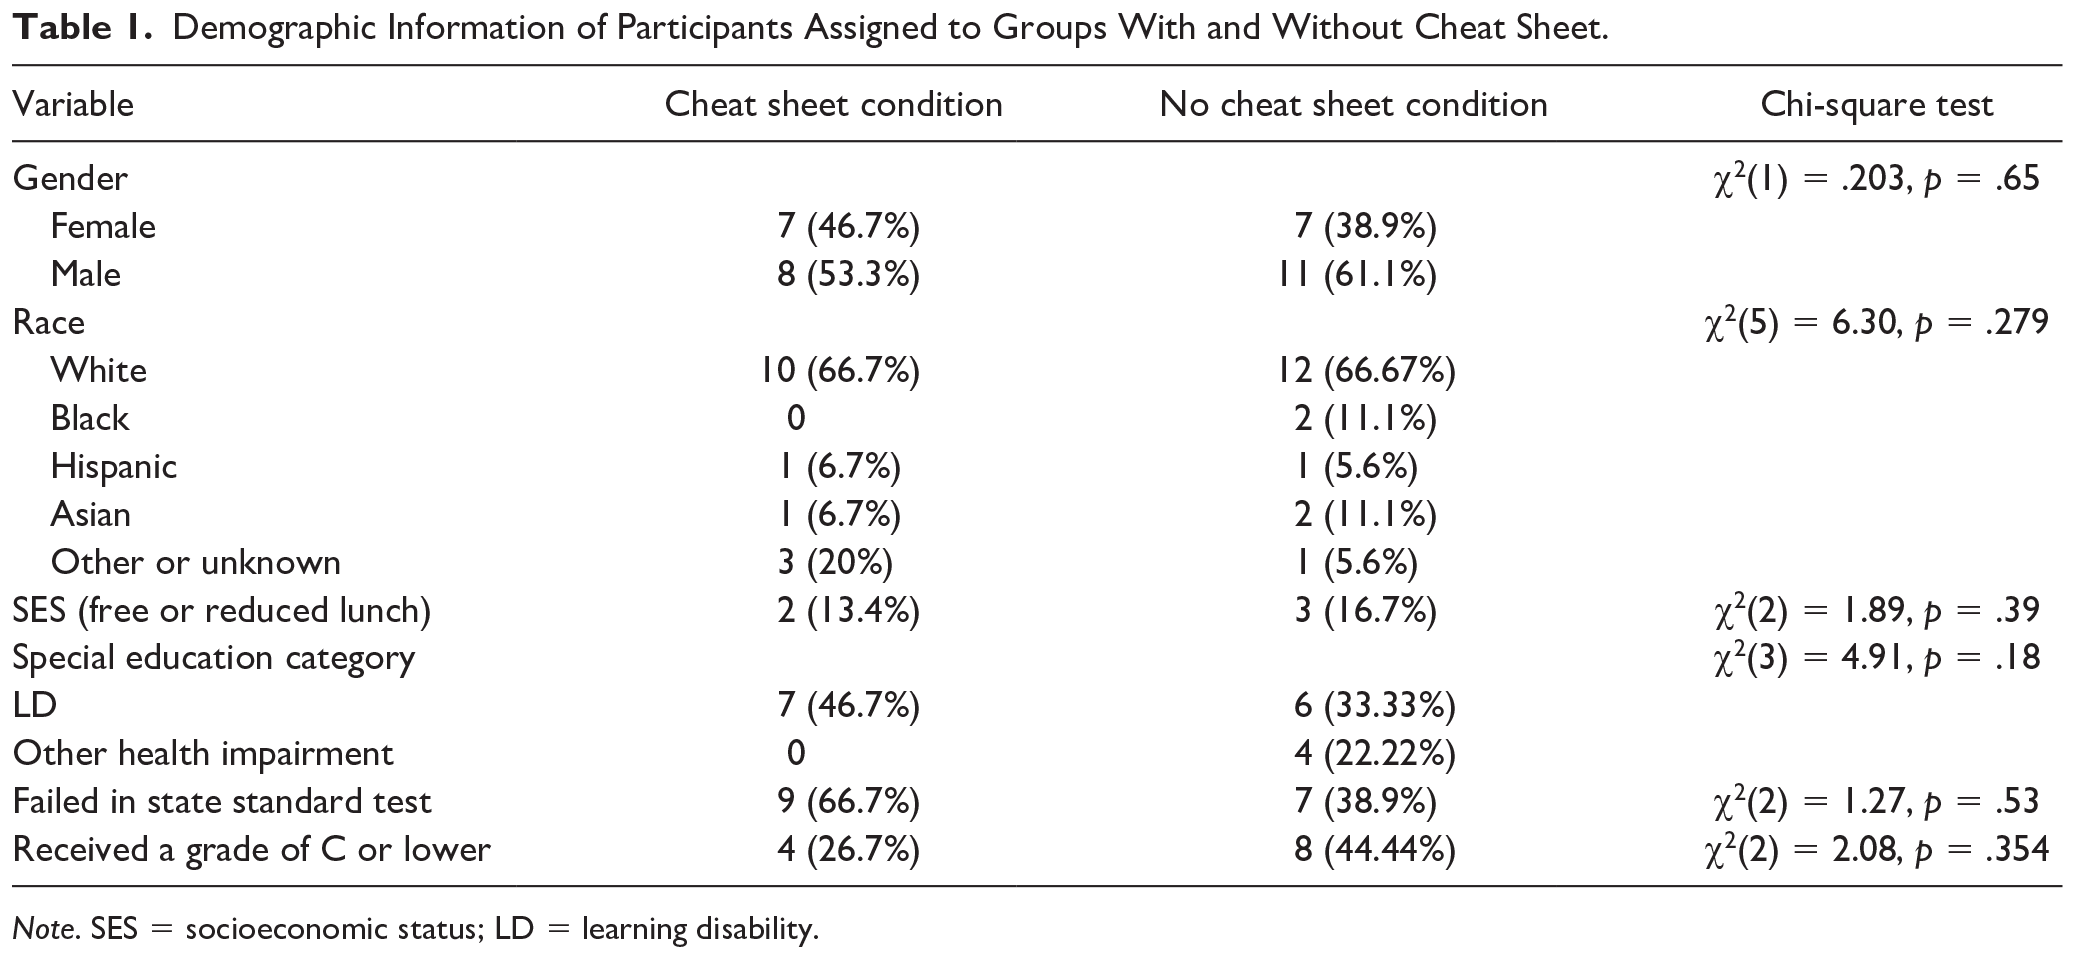
Note. SES = socioeconomic status; LD = learning disability.

Problem examples.
In the test with plain figure representations, geometry diagrams were composed only of segments. In the case of an example that includes an image of an equilateral triangle constructed from three segments, in order for students to interpret the problem situation, they had to integrate the provided verbal statements with the visual elements of the diagram to determine that the triangle is equilateral. From there, all the properties and theorems associated with equilateral triangles could be applied. In another example, two parallel lines were cut by a transversal to produce a pair of corresponding angles. To interpret this situation, the problem solver needed to integrate the visual elements and verbal elements and identify all the elements from the background images.
In contrast to the plain figure representations, the geometry diagrams featuring the chunking representation incorporated colors and markings to draw problem solvers’ attention to the related interactive elements so as to consolidate them into a schematic chunk or associate them with a geometric theorem. For example, a given triangle ABC is not represented solely of three segments; instead, specific elements of triangle ABC, such as AB, are colored and chunked together to differentiate it from other noninteractive elements that are not part of the chunk. In another example, a triangle is identified as an equilateral triangle by adding tick markings to its three sides to show that they are congruent. In yet another example, the relationship between angles produced by a pair of parallel lines cut by a transversal was highlighted by coloring the parallel lines and marking the corresponding angles. This could facilitate the problem solver’s identification of their congruence in a semantic chunk and then associate that chunk with a theorem in long-term memory.
To avoid any carryover effects (i.e., participants learning the problem-solving strategy in one condition and then applying it to another condition), the participants in the two conditions completed the plain test first and the test with visual semantic chunks second. Testing was conducted in a classroom at the participants’ high school. All students were directed to work independently on the problems. Each test took about 25 to 30 min to complete. In addition to providing a solution, students were asked to provide an explanation of how they arrived at their solution, such as listing the steps they used or providing the relevant theorems. Students were advised to skip a problem if they spent more than 8 min on it and still could not solve it.
Measures and Grading
Each test contained 22 geometry problems with three different difficulty levels: simple one-step, difficult one-step, and multi-step. Example items in each category can be found in Table 2. Five items asked students to determine the spatial relation (e.g., parallel, perpendicular, skew) between two segments or two planes in a three-dimensional (3D) background. In case students did not understand the math vocabulary used to describe the spatial relations, we provided the definitions of parallel, perpendicular, and skew lines in notes on the test. Students were awarded a 1-point full score if they were able to state the spatial relations correctly. No explanations were required because these spatial relations are determined by definition. Nine items assessed students’ abilities to determine unknown angle measures according to the given information in a set of parallel lines, and students needed to identify the relations between the unknown and known matched angles (e.g., corresponding pairs, alternate interior pairs, alternate exterior angles) to determine the magnitude of the unknown angles. Because statements like “If two parallel lines are cut by a transversal, then the pairs of corresponding angles are congruent” are postulates that are assumed true without proof, and considering that most of the participants could not use the correct math vocabulary to describe the relations between the angles (e.g., alternative pairs, alternate interior pairs etc.), we did not require students to use these specific terms or theorems to explain the answer to achieve a full score. Students were awarded a 1-point full score when the answers were correct. No points were given if the answer was incorrect. These 14 items (i.e., five spatial relation items and nine parallel line items) were considered simple, one-step problems.
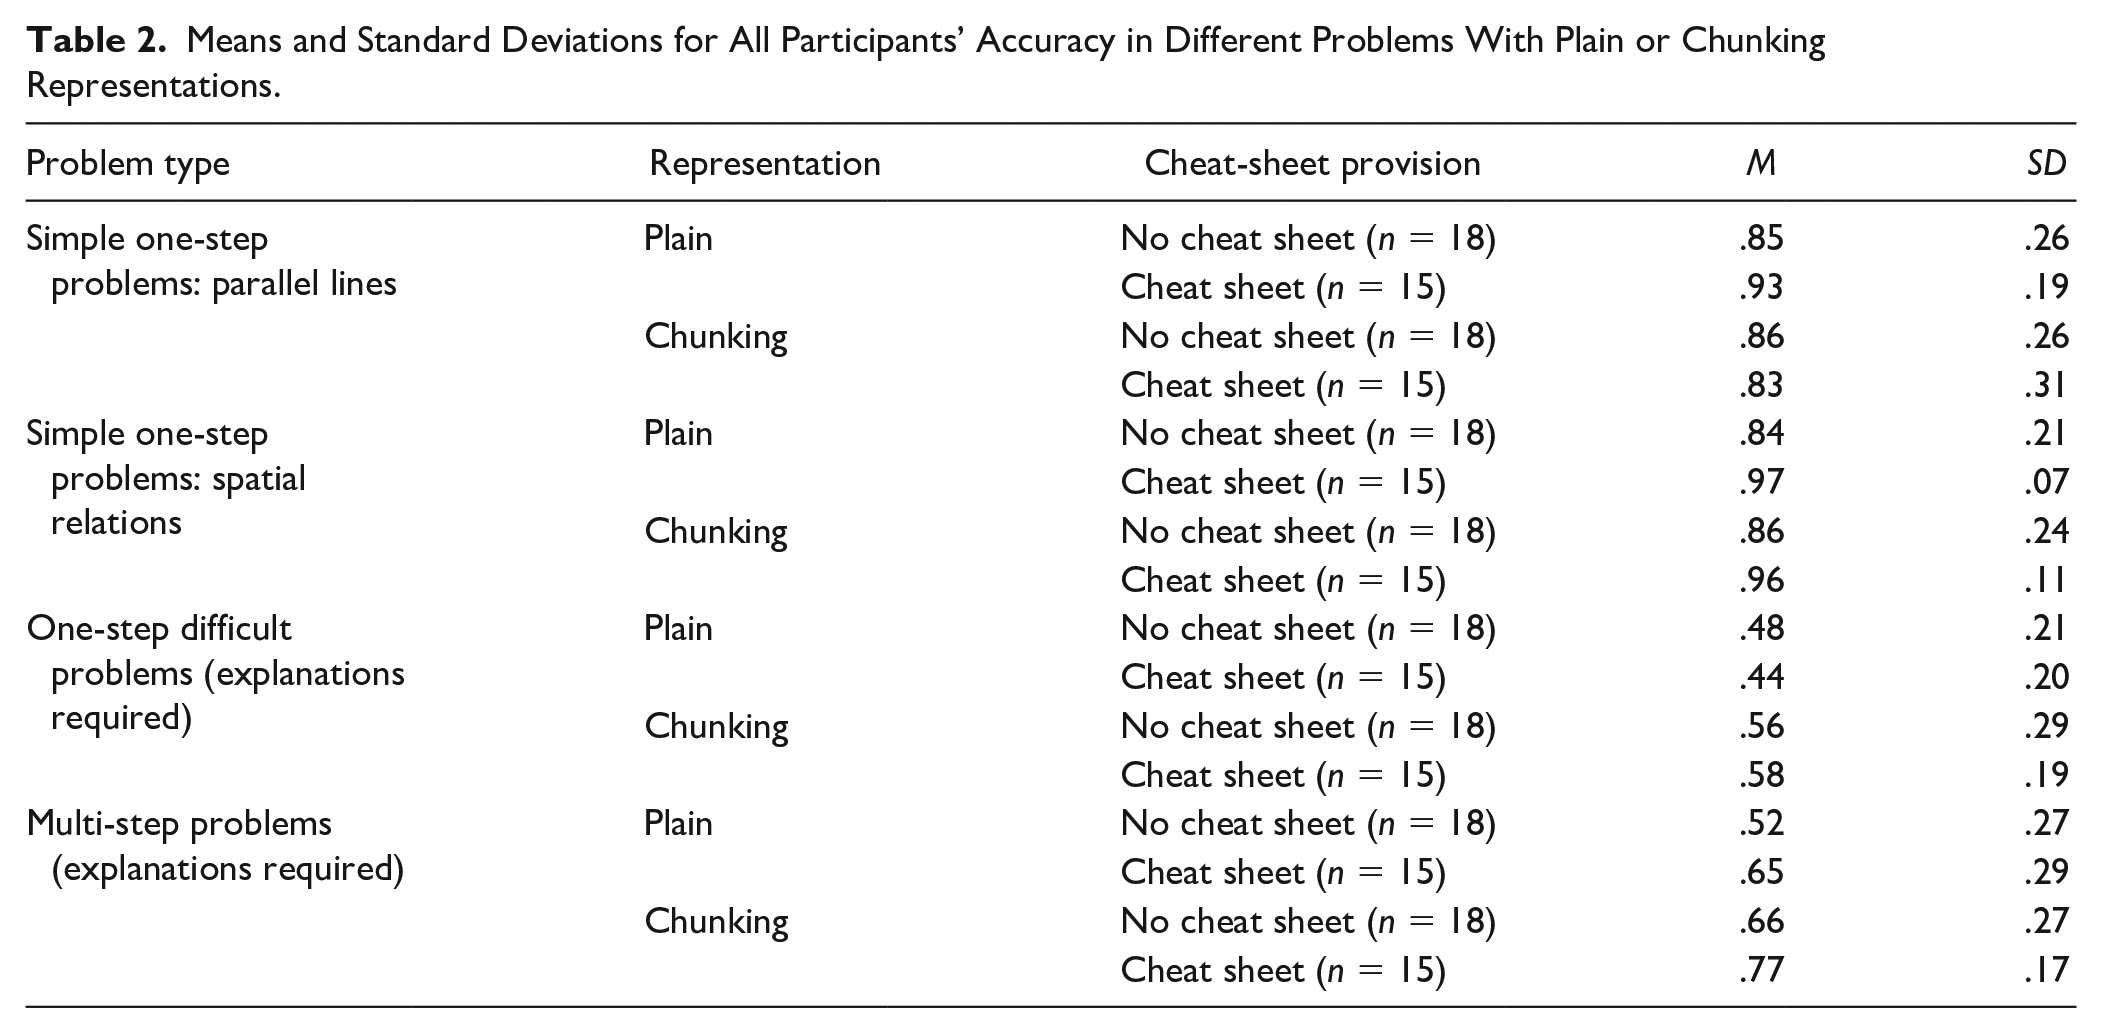
Means and Standard Deviations for All Participants’ Accuracy in Different Problems With Plain or Chunking Representations.
In addition to the above simple one-step problems, we included three one-step difficult items that required students to use one theorem to obtain a solution. The students had to provide an explanation to get a full score. We considered these three items difficult because they required the use of theorems that appear less frequently in their curriculum. Specifically, one item required students to use the triangle midsegment theorem (i.e., “In a triangle, the segment joining the midpoints of any two sides will be parallel to the third side and half its length.”) to determine the length of the third side when the length of the midsegment was given. Two other items concerned the angle bisector theorem (i.e., “If a point is on the bisector of an angle, then it is equidistant from each side of the angle.”) and the converse (i.e., “If a point is in the interior of an angle and equidistant from the sides, then it lies on the bisector of the angle”). Postulates are assumed to be true without proof or explanations, whereas theorems must be proven to be true. For items that included theorems, we required participants to provide explanations to achieve a full score. If an explanation is not provided or is wrong, they could only earn half credit, even if their solution was correct. To clarify, a standard written explanation would take the form, “Given A, according to Theorem X, then B.” For example, “Because PM is the midsegment of ΔLNO, according to the triangle midsegment theorem, the third side ON = 2 PM, and 2 × 7 = 14,” or “Because ray BD is the bisector of ∠ABC, AD ⊥ AB at D, and DC ⊥ BC at C, according to the Angle Bisector theorem, AD = DC.” If a student provided only a mathematical calculation without any supporting explanations (e.g., ON = 2 PM, so ON = 14) or provided an answer without any explanations (ON = 14), then the student was awarded 0.5 points. If neither a proper explanation nor the correct answer was provided, a student would receive 0 points. After reviewing students’ responses, we found none of the students fully articulated the theorems in this study, so we determined that as long as they provided a “condition → result” relation, such as “because P is the midpoint of LO, O is the midpoint of LN, so ON = 2 PM = 2 × 7 = 14” without explicitly stating the theorem or its name, they were awarded the full score.
Last, we included five multiple-step problems, which required students to employ at least two theorems or postulates to obtain a solution. The theorems, postulates, and properties involved in these five multi-step problems were primarily concerned with angle relationships, such as parallel lines and equilateral, isosceles, and other triangles. The standard format of the solutions to these problems was: Given A, then according to Theorem X, B; since B, then according to Theorem Y, C. However, given the finding that none of the students provided a chain of reasoning that explicitly referred to a suitable theorem, we decided that if a student wrote a sequence of relationships according to a postulate that was deemed self-evident without proof, or they stated the “condition → result” relation without explicitly mentioning the theorem names, we considered the explanations correct as an accommodation. Only half a point was earned if a student produced a correct solution but did not provide a proper supporting explanation. Students received 0 points if both the solution and explanation were incorrect.
Inter-Rater Reliability
The first and second author each graded half of the worksheets collected, with a grading rubric developed and agreed upon by both authors. Then a research assistant who did not know the purpose of the research randomly selected and graded 30% of the items. The inter-rater reliability was 96.54%.
Results
Descriptive Analysis
Table 2 illustrates the mean and standard deviations of students’ scores on three types of problems when represented with plain figures and with colored chunking figures. Results suggest that students scored high on simple one-step problems (i.e., the spatial relation problems and the parallel line problems), with an average accuracy ranging from 83% to 97% either in plain or chunking representations. Students demonstrated moderate performance on multi-step problems in both conditions, with an average accuracy ranging from 52% to 77%. Participants showed the lowest accuracy on the three difficult one-step items requiring explanations, with an average accuracy ranging from 44% to 58%, and this may be because the theorems involved in these three items (e.g., the angle bisector theorem and its converse, and the triangle midsegment theorem) appeared less frequently in their curriculum.
Effects of Chunking on Problems of Varying Difficulty Levels for All Participants
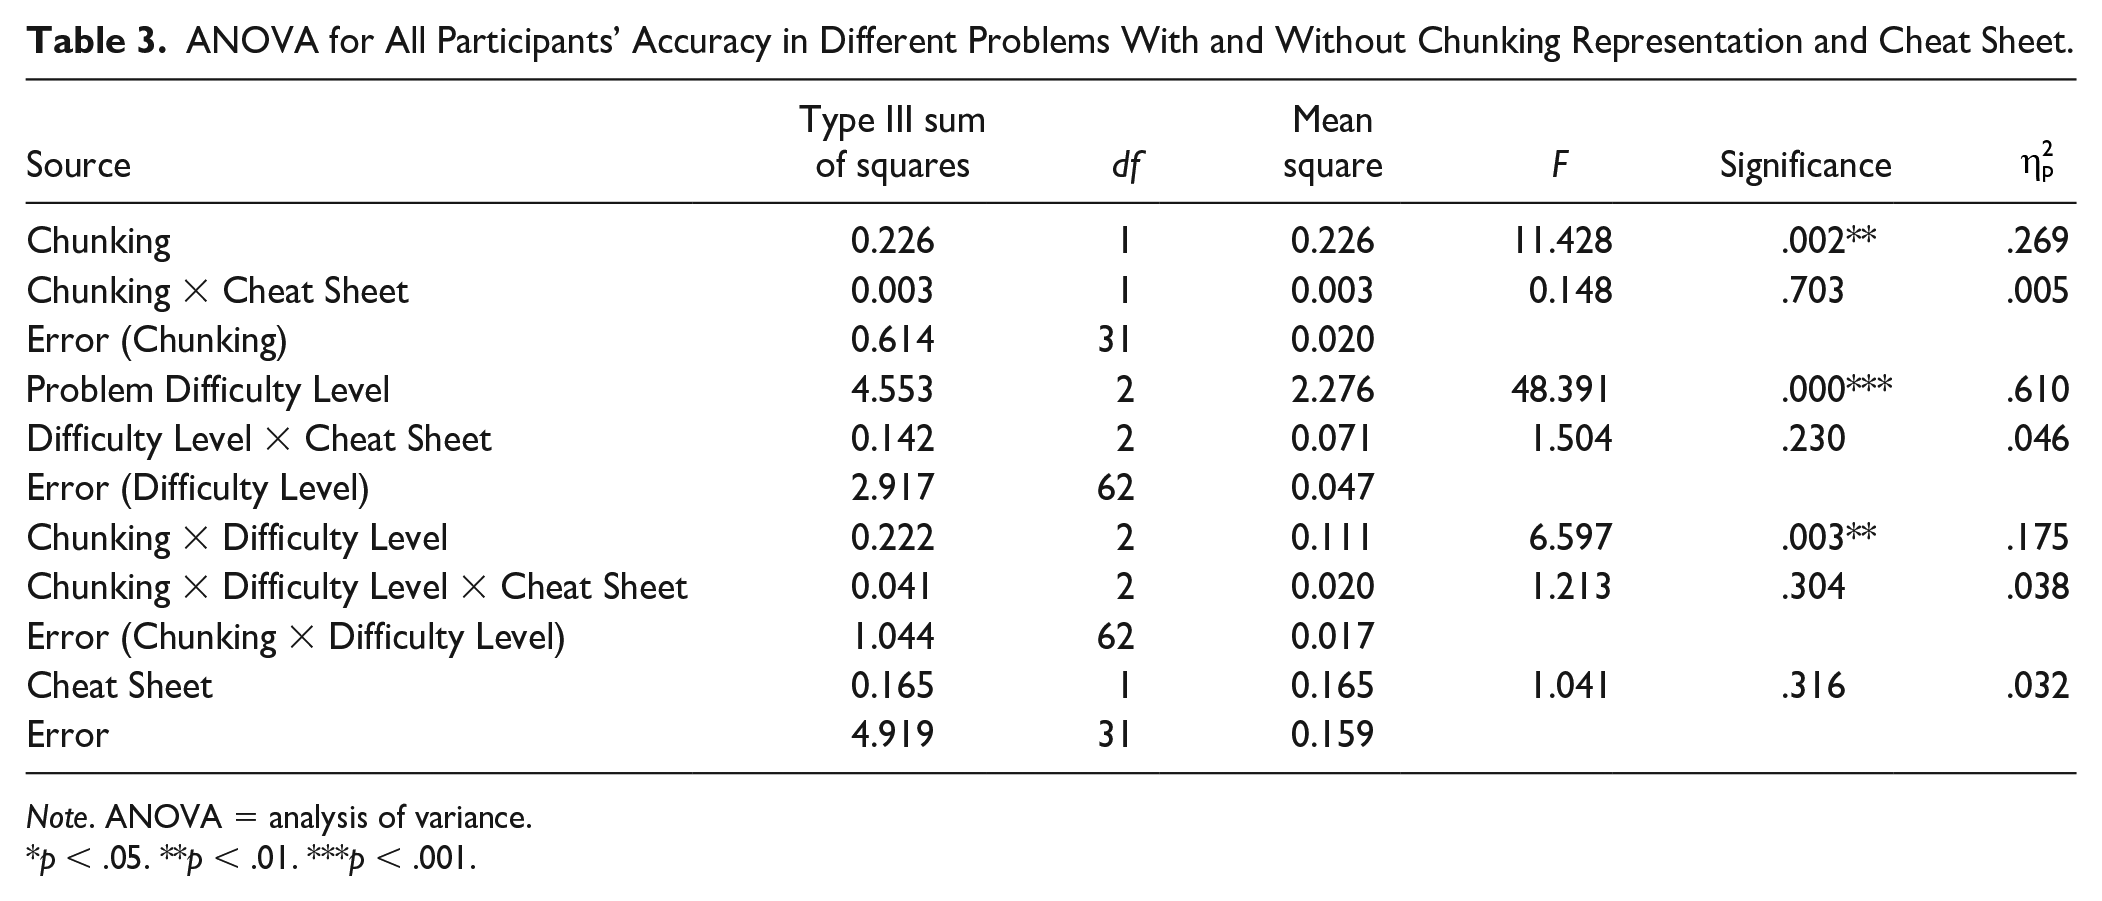
With data from all 33 participating students who were identified by mathematics teachers as struggling students who demonstrated difficulties with learning geometry, we conducted a 2 (chunking/plain representation) × 3 (problem difficulty level) × 2 (cheat sheet provided/not provided) analysis of variance (ANOVA), with two repeated variables of (a) problem difficulty level (one-step simple problems/one-step difficult problems/multi-step problems) and (b) chunking/plain figure representation, and a between-subject variable of cheat sheet provided/not provided. Results (see Table 3) suggested a significant main effect of chunking representation, F(1.31) = 11.43, p < .01; a main effect of problem difficulty level, F(2. 62) = 48.39, p < .01; and a significant interaction effect between chunking representation and problem difficulty level, F(2. 62) = 6.59, p < .01. Post hoc analysis suggested that participants generally performed better (mean difference = .068, SE = .02, p = .002) when the chunking representation was provided (M = .72, SD = .02) than when the plain representation was presented (M = .65, SD = .03) across all three types of problems.
ANOVA for All Participants’ Accuracy in Different Problems With and Without Chunking Representation and Cheat Sheet.
Note. ANOVA = analysis of variance.
p < .05. **p < .01. ***p < .001.
We further conducted a 2 (cheat-sheet provision) × 2 (chunking/plain representation) ANOVA for each of the three types of problems, to investigate the effects of chunking for each problem type. Notably, there was a significant interaction effect between the problem type and the chunking representation. This indicates that the effect of chunking became greater with the increase in problem difficulty, as illustrated in Figure 2. For the one-step simple geometry problems that did not require explanations (i.e., the spatial relation items and matched angles formed by parallel lines), no significant effect of chunking was found, F(1,31) = 1.32, p = .26; for the one-step difficult geometry problems, a significant effect of chunking was found, F(1,31) = 6.94, p = .013; and for the multi-step geometry problems, a significant chunking effect was found, F(1, 31) = 13.45, p =.001. With that said, chunking was effective only for the multi-step geometry problems or the difficult one-step geometry problems requiring explanations, but not effective for the simple one-step problems (i.e., fundamental spatial relations or angle relations in parallel lines).
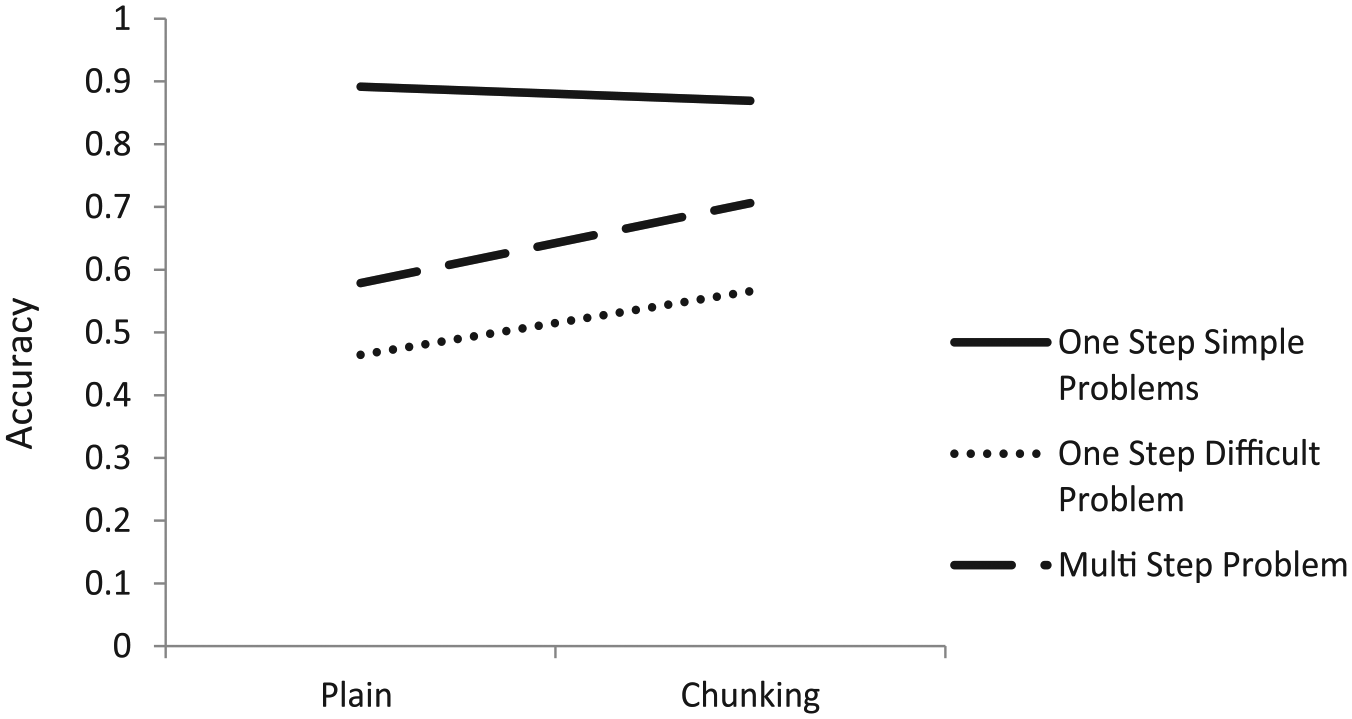
All participants’ performance on three types of problems with plain/chunking representation.
We found no significant main effect of cheat-sheet provision on student performance with the whole group data, F(1, 31) = 1.04, p = .32, nor an interaction effect between cheat-sheet provision and chunking, F(1, 31) = .15, p = .70, nor an interaction effect between cheat-sheet provision, chunking, and difficulty level, F(2, 62) = 1.21, p = .30. Results suggest that a cheat sheet, or lack thereof, did not have any impact on the whole participant group performance, regardless if chunking was provided or not.
Students with Math Learning Difficulties Versus Students at Risk of Math Failure
Next, we examined whether there was a difference in chunking effects between students with MD and students who were at risk of math failure. Due to smaller sample sizes for each of the participant categories (i.e., 15 at risk for math failure and 18 with MD), we did not include the participant category as a variable in the above ANOVA with all participants. Rather, we conducted a 2 (chunking/plain representation) × 3 (problem difficulty level) × 2 (cheat sheet provided/not provided) ANOVA in each of the above two groups of participants, respectively. For students with MD, we found a significant main effect of problem difficulty level, F(2, 32) = 19.03, p = .000; a marginal significant interaction effect of problem difficulty level and cheat sheet, F(2, 32) = 2.73, p = .08, indicating there is relatively small chance (8%) to make a mistake to claim that the provision of cheat sheet has different effects on problems with different difficulty levels in students with MD; and most importantly, a significant interaction effect of chunking, problem difficulty, and cheat-sheet provision, F(2, 32) = 3.725, p = .035 (see Table 4). In contrast, for at-risk students, we found only a significant effect of difficulty, F(2, 26) = 31.535, p =.000; a significant main effect of chunking, F(1, 13) = 12.91, p = .003; and a significant interaction effect of difficulty and chunking, F(2, 26) = 6.267, p = .006, but we did not find any effect of the cheat-sheet provision.
ANOVA for Accuracy of Students With MD in Different Problems With and Without Chunking Representation and Cheat Sheet.
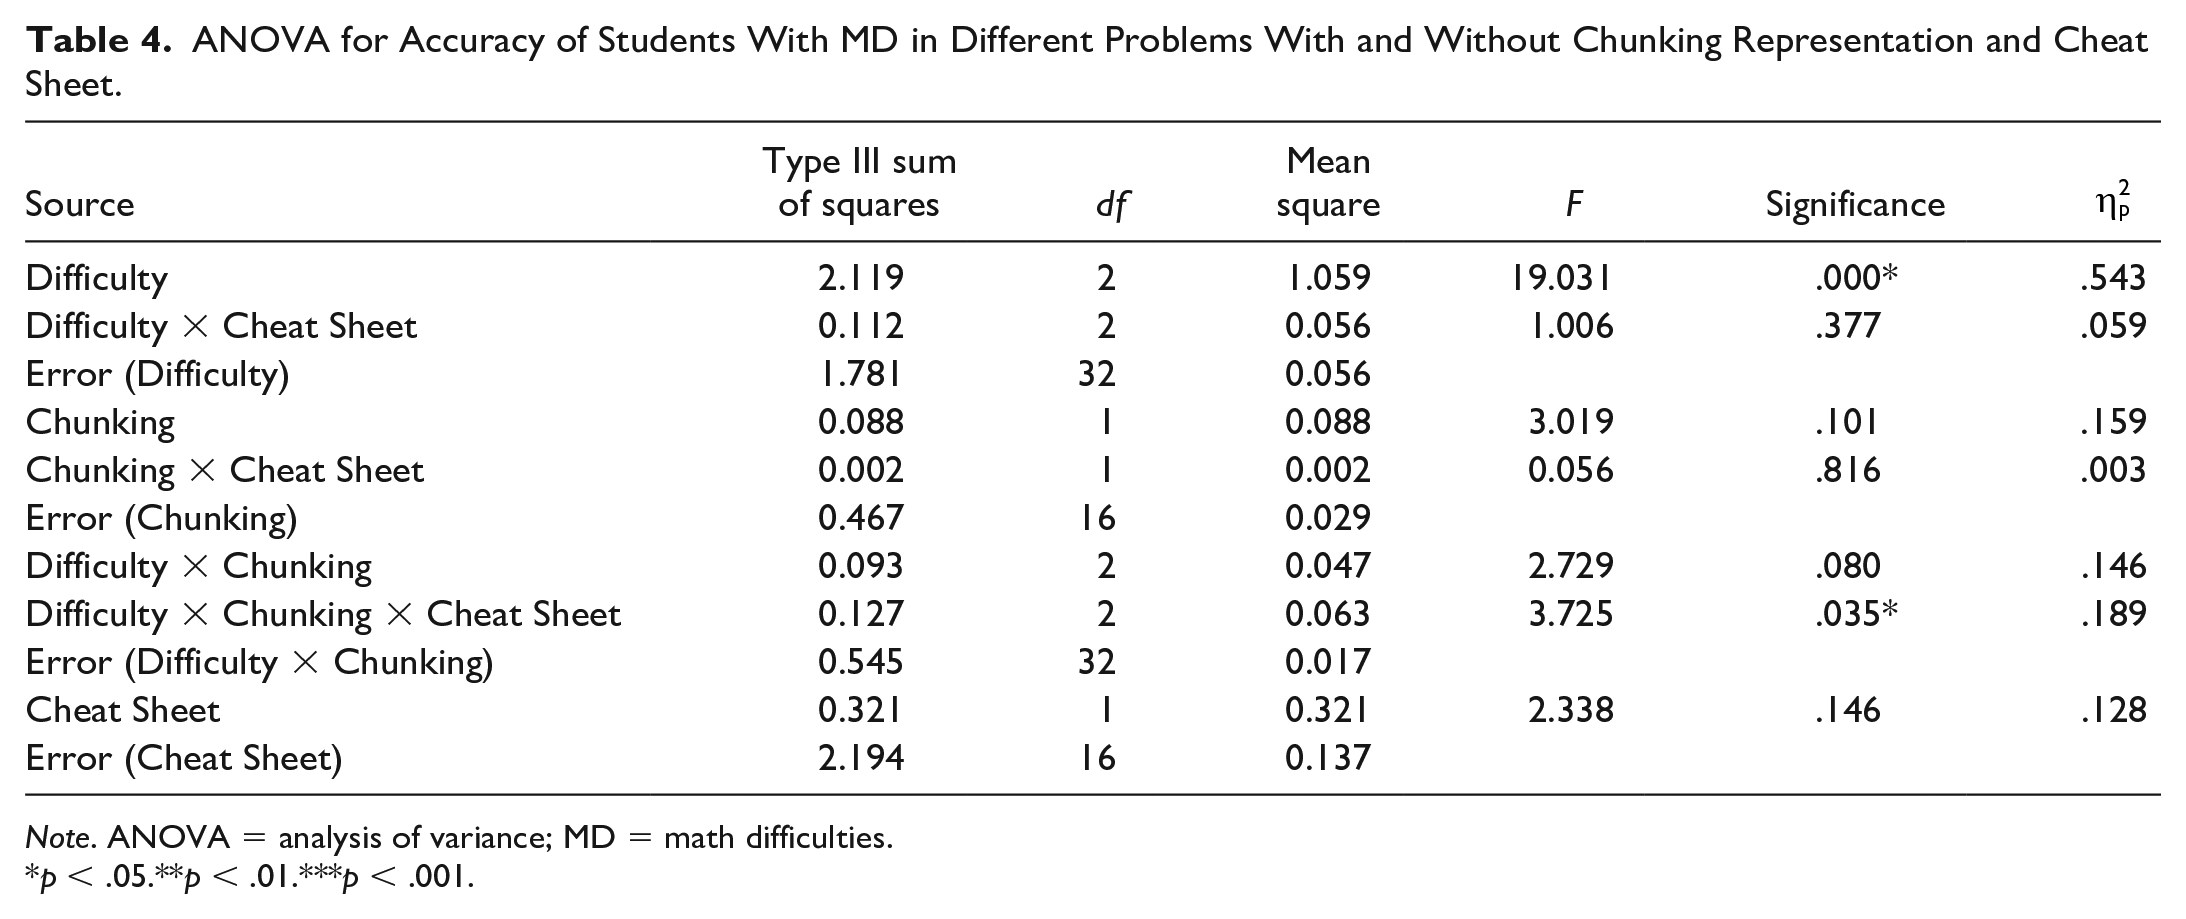
Note. ANOVA = analysis of variance; MD = math difficulties.
p < .05.**p < .01.***p < .001.
Consistent with the results of the whole-group participant data, students with MD and students at risk of math failure demonstrated different accuracy performance among the three problem types, and there were greater chunking effects on the multi-step problems than on the one-step simple problems. Specifically, for the multi-step problems, there was a significant main effect of chunking for both at-risk students, F(1, 13) = 6.011, p = .029, and students with MD, F(1, 16) = 5.86, p = .028. However, for the simple one-step problems (i.e., spatial relations and paired angles of parallel lines), chunking did not enhance students’ performance either in the at-risk group, F(1, 13) = 2.072, p = .174, or in the group of students with MD, F(1, 16) = .378, p = .547.
Considerably, provisions of a cheat sheet influenced performance depending on the group of students and the problem type. For students with MD, providing or not providing a cheat sheet made a significant difference in particular types of problems. In contrast, for the at-risk students, providing or not providing a cheat sheet did not have an effect on any of the problem types or with either of the two presentations. As illustrated in Figures 3 and 4, it was interesting that only for students with MD, without the provision of a cheat sheet, there was no chunking effect for the one-step difficult problems that required explanations with the less-frequency theorems, mean difference = −.15, SD = .29; t(10) = .17, p = .87; in contrast, when a cheat sheet was provided for this type of problems, we found significant improvement from the plain test to the chunking test, mean difference = .17, SD = .14, t(6) = 3.25, p = .017. The provision of a cheat sheet also had an effect on the multi-step problems: Only for students with MD, rather than at-risk students, there was a marginal significant effect of cheat-sheet provision, F(1, 16) = 3.52, p = .079, suggesting a relative low probability to make a mistake to reject the null hypothesis that there is no cheat sheet effect, favoring students who received a cheat sheet over their peers without a cheat sheet (mean difference = 0.205, SE = .109, p = .079), and such advantages of using a cheat sheet can be found in both representation conditions for these multi-step problems.
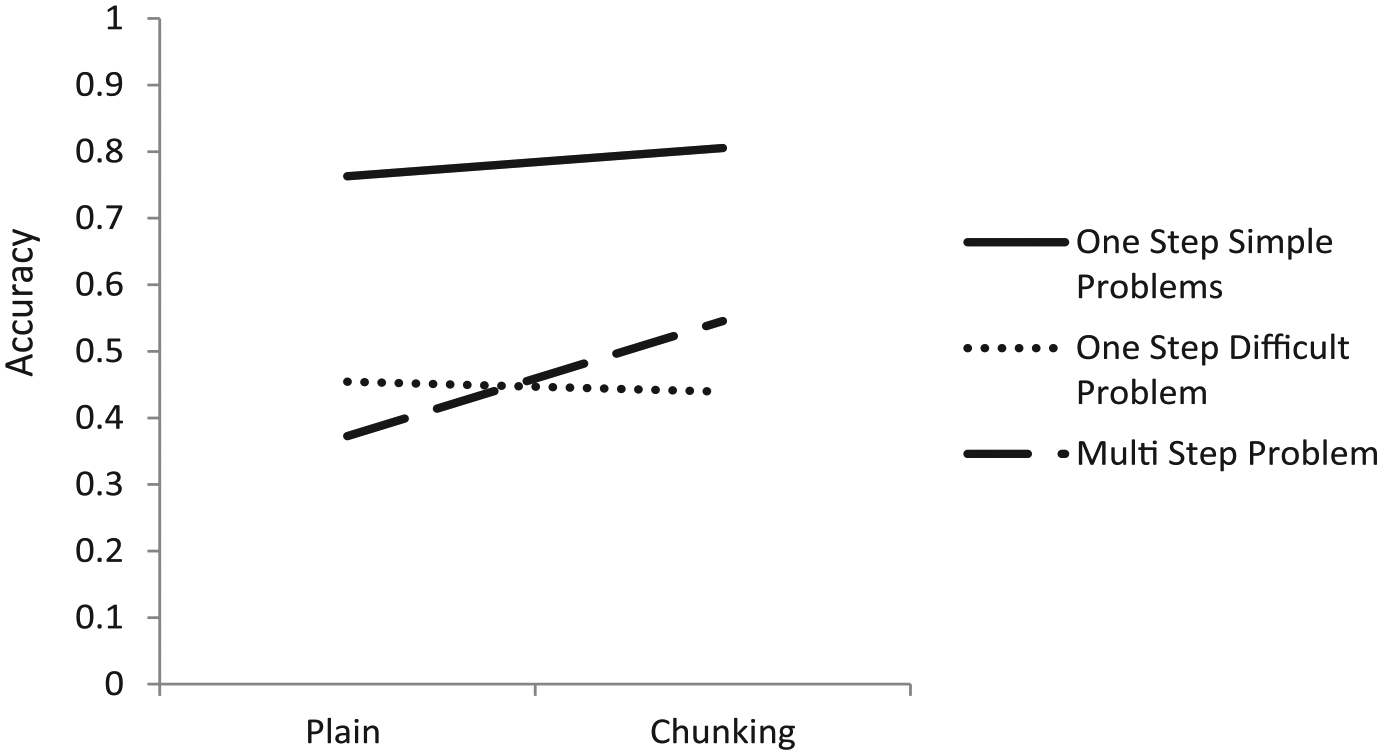
Chunking effects for students with MD without a cheat sheet.
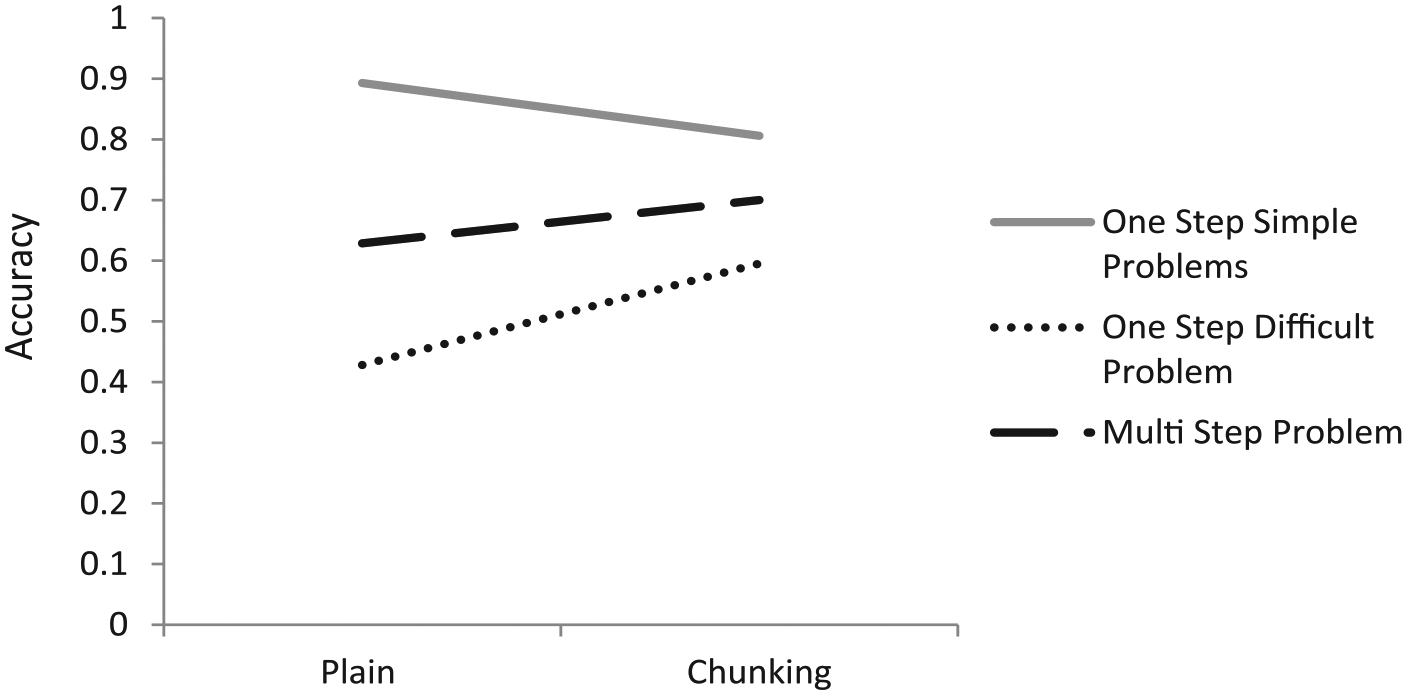
Chunking effects for students with MD with a cheat sheet.
Discussion
The primary purpose of this study was to validate the effectiveness of a visual chunking strategy as an accommodation for students with MD and at risk to solve advanced geometry problems from a high school geometry curriculum. The study also investigated the possible moderating effects of problem complexity level on the chunking effects, and the roles of students’ knowledge of geometry in the relation between chunking representation and geometry problem-solving performance.
Results supported the hypothesis that all participants, including students with MD and at-risk students, demonstrated superior geometry test performance when presented with the chunking representation compared with their performance when presented with plain geometry diagrams. Results were consistent with previous literature on the effectiveness of color scheming (Ratwani et al., 2008) and marking the visual interactive elements on a diagram to integrate with the verbal interactive elements from the statements (Sweller et al., 1990). Such chunking representations were effective in helping learners to identify the schematic chunks in a geometry diagram and then problem solve using schematic chunks rather than with a large number of visual and verbal interactive elements. This study extended the research on visual chunking from previous studies (Zhang et al., 2012, 2014) on intuitive elementary transformational geometry (e.g., rotation, flipping, and so on) to high school advanced geometry problem solving involving deductive reasoning using postulates and theorems. The study also extended the concept of “chunk” from a whole physical shape (e.g., a square, a triangle) to a schematic structure (e.g., matched angles in a set of parallel lines, the elements associated with the Angle Bisector Theorem) that is semantically meaningful in relation to geometry properties, theorems, or postulates.
This study also found moderating effects of problem complexity on the effects of chunking representation on student geometry performance. Results suggested that all struggling students demonstrated greater gains for the chunking effects on difficult geometry problems than on simple geometry problems. Specifically, the chunking effect was not significant on the simple one-step problems (i.e., to identify spatial relations between two lines, or matched angles and parallel lines). Rather, the chunking effect was significant on both (a) the difficult one-step problems requiring explanations with less frequently used theorems, and (b) multi-step problems requiring explanations with commonly used postulates and theorems. To summarize, it appears that chunking is particularly effective when the tasks are complex and require more load on working memory than with simple tasks.
Simple one-step problems are typically presented with simply structured diagrams in which only one schematic chunk is involved, and consequently, there is little need to make the interactive elements stand out from other elements by coloring or marking the visual interactive elements to bring to the forefront the significance of a schematic chunk to problem solvers. When tasks are simple, no matter whether chunking is applied or not, the task itself causes very little strain on working memory resources, and thus, students may perform well or show no difference in performance. In contrast, complex problems (i.e., multi-step problems) involve more than one schematic chunk in a diagram, which may increase the cognitive load and, thus, hinder learning ability (Sweller, 1994). It appears that the chunking representation that colors and/or marks the interactive elements that belong to a whole schematic scheme, which makes it easier for learners to recognize and differentiate the schematic chunk from irrelevant elements, is effective in reducing cognitive load and in increasing available working memory resources when the tasks are complex and can cause more cognitive strain (Chen et al., 2015; Sweller, 2010). Therefore, as shown in Figure 2, compared with the plain representation, participants received greater benefits with the chunking representation on the multi-step problems than on the simple one-step problems. This suggests that struggling students initially had more difficulties recognizing the semantic chunks in a complex diagram, particularly when the representation was plain. Future research and practice should focus on designing chunking representations for complex problems.
Consistent with the literature (Sweller, 1994), the results of this study suggested problem solvers’ expertise played a significant role in moderating the effects of semantic chunking. In this study, students’ expertise was manipulated with two variables: student category (i.e., students with MD or students at-risk for math failure) and the provision of a cheat sheet (i.e., one group received a cheat sheet of relevant theorems and the other group did not). In both the plain and chunking representation, we found that students with MD scored higher in solving multi-step problems when a cheat sheet was provided than when it was not provided. In the case of the difficult one-step problems, students with MD showed a significant improvement when the chunking representation and a cheat sheet was provided. However, in difficult one-step problems where a cheat sheet was not provided but a chunking representation was, students with MD showed no significant improvement in performance. As the first form of scaffolding support, the chunking representation helped students with MD recognize the visual schematic chunks from the diagram, and as the second form of support, the cheat sheet with theorems helped students with MD retrieve the theorem corresponding to the schematic visual chunk from their long-term memory.
In contrast, there were no significant cheat sheet effects among the participants who were at-risk, whether the problems were represented with chunking or not. This may possibly be due to the higher mathematics abilities that students who are at-risk possess compared with students with MD. Student at-risk may have better prior knowledge of geometry theorems and postulates than students with MD, and thus the provision of a cheat sheet may not have helped at-risk students improve their knowledge of these theorems. Results not only supported the cognitive load theory that individual differences in prior knowledge may interpret individual variations in how students are able to recognize the schematic chunks that incorporate a number of integrative elements (Lin & Lin, 2013), but also suggested that different forms of scaffolding interventions or accommodations are useful for students at different levels of knowledge sophistication on problems of varying difficulty/complexity levels.
Limitations and Future Research
This study includes two major limitations. First, although we separated participants with MD from students who were at-risk, due to the smaller sample size, we were not able to include student type as a between-subject variable in the analysis for the whole participant group. Further studies with a larger sample are needed to validate the effectiveness of schematic chunking with a broader range of geometry problem tasks. Future research will also compare the effects of the schematic chunking between average-achieving students and students with MD, to investigate if this strategy only works for students with MD as an accommodation, rather than improving the performance of all students by decreasing the difficulty level of the problem (Fuchs & Fuchs, 1999). Second, as mentioned in the “grading” section, we found that participants rarely explicitly articulated a chain of reasoning when referring to the postulates or theorems. In mathematics education, the abilities to make an argument and to provide justifications that are “proof-like” are critical for developing students’ mathematical thinking (Maher & Davis, 1995; Maher & Martino, 1998). In future research, we aim to develop and validate possible accommodations and intervention strategies to scaffold students with MD to articulate their arguments and justifications in geometry problem solving.
Implications for Practice
This study advanced the literature in validating the effects of visual chunking as an accommodation for students with MD and students who are at risk. We extended the concept of “geometry chunks” from physically integrated shapes (e.g., squares, triangles) at the elementary level to a set of interactive elements that are incorporated into theorems at the high school level. In future educational practice, teachers might consider modifying geometry tests, featuring complex geometry problems requiring multiple steps, for students with less sophisticated geometry content knowledge by scaffolding their identification of schematic chunks in supporting visual diagrams. Publishers of standardized mathematics texts might also consider designing geometry items using the schematic chunking representation rather than the standard plain representation when designing diagrams. Geometry curriculum developers and textbook writers might consider including geometry figures using schematic chunking in textbook diagrams. Moreover, in addition to using visual chunking as an accommodation of geometry testing, teachers could teach students with MD how to highlight the visual interactive elements with colors and marks to help them distinguish the schematic chunk from the other elements in a complex diagram. The chunking representation may be particularly helpful for multi-step complex problems in comparison to simple one-step problems and should be recommended for assessments of and instructions involving multi-step problems.
This research also has implications for how to choose accommodations for individuals with different levels of expertise. For example, the provision of a cheat sheet was effective only for students with more severe MD who might have less knowledge of the geometry domain than for students at-risk. In particular, the cheat sheet was effective for students with MD when solving problems that required knowledge of theorems that appear less frequently in their curriculum.
Footnotes
Declaration of Conflicting Interests
The author(s) declared no potential conflicts of interest with respect to the research, authorship, and/or publication of this article.
Funding
The author(s) disclosed receipt of the following financial support for the research, authorship, and/or publication of this article: This study was partially supported by the Rutgers University Research Council.